Sign Up for FREE Daily Energy News
canada flag CDN NEWS  |  us flag US NEWS  | TIMELY. FOCUSED. RELEVANT. FREE
  • Stay Connected
  • linkedin
  • twitter
  • facebook
  • instagram
  • youtube2
BREAKING NEWS:
Hazloc Heaters
Copper Tip Energy Services
Copper Tip Energy
Hazloc Heaters


Kinder Morgan Canada says Trans Mountain moving forward after extensive review

CALGARY — The president of Kinder Morgan Canada (TSX:KML) has defended the Trans Mountain project as having gone through rigorous assessments in his first comments since the B.C. NDP-Green party alliance resolved to stop the pipeline expansion.

Ian Anderson said in a statement Wednesday that the expansion has been reviewed, analyzed, discussed and considered thoroughly over many years, and now has approvals from the National Energy Board, the Government of Canada and a B.C. environmental certificate.

He said the company is starting to award significant contracts now that financing and a final investment decision are in place, and is moving ahead with the benefit agreements in place with aboriginal and local communities.

The company continues to move forward with planning for construction to start in September, said Anderson.

His comments come a day after the B.C. NDP and Green parties formalized their alliance and released an agreement that includes a commitment to employ every tool available to stop the Trans Mountain expansion.

Tuesday also marked the start of trading for Kinder Morgan Canada after its $1.75-billion IPO was at $17 a share, with the stock since down 5.66 per cent at $16.06 after two days of trading.

The Canadian Press

GET ENERGYNOW’S DAILY EMAIL FOR FREE


2 Day Workshop – Instrumentation and Controls (I&C) Training is Vital to Risk Reduction – PEICE

  Solid robust and reliable instrumentation and controls not only ensure efficient and profitable plant operations, but also includes safe functionality of the process, protection of the environment and regulatory compliance when required. 65% of risk reduction comes from Instrumentation and Controls (I&C), according to recent risk intelligence studies. I&C is the fastest growing form … Read more

GET ENERGYNOW’S DAILY EMAIL FOR FREE


Dakota Access pipeline expected to begin shipping Thursday

BISMARCK, N.D. — The developer of the Dakota Access oil pipeline, which is expected to begin shipping oil on Thursday, will face scrutiny later this summer on whether it violated North Dakota rules during construction.

The three-member North Dakota Public Service Commission is looking into whether Texas-based Energy Transfer Partners removed too many trees and shrubs along the pipeline route, and whether it improperly reported the discovery of Native American artifacts. No artifacts were disturbed.

ETP maintains it didn’t intentionally do anything wrong in either case. If the commission ultimately decides differently, the company could be subject to tens of thousands of dollars in fines, though it could fight them in state court.

Regulators decided during a Wednesday meeting to hold the hearings on back-to-back days in either July or August. A decision on fines would come sometime after that.

“I’m pretty eager to wrap this us,” Commissioner Julie Fedorchak said.

The $3.8 billion pipeline will move North Dakota oil through South Dakota and Iowa to a distribution point in Illinois. The developer of the Dakota Access oil pipeline will face hearings in North Dakota later this summer on whether it violated state rules during construction.

The pipeline prompted hundreds and sometimes thousands of Native American and environmental activists to camp in North Dakota to protest, saying it would disturb sacred sites and could pollute water used by Native Americans. President Donald Trump’s administration and the courts eventually allowed the pipeline to be completed.

The three-member Public Service Commission is looking into whether Texas-based Energy Transfer Partners removed too many trees and shrubs along the pipeline route, and whether it improperly reported the discovery of Native American artifacts. No artifacts were disturbed.

ETP maintains it didn’t intentionally do anything wrong in either case. If the PSC ultimately decides differently, the company could be subject to tens of thousands of dollars in fines, though it could fight them in state court.

Regulators decided during a Wednesday meeting to hold the hearings on back-to-back days in either July or August. A decision on fines would come sometime after that.

“I’m pretty eager to wrap this us,” Commissioner Julie Fedorchak said.

The $3.8 billion pipeline will move North Dakota oil through South Dakota and Iowa to a distribution point in Illinois. The company said earlier this month that it would begin shipping oil on June 1 to meet contracts with shippers.

The commission maintains the company diverted construction of the pipeline around artifacts last October without first running the plan by the commission, as required. The company did get clearance from the State Historic Preservation Office and maintains it acted in good faith.

In addition, a third-party inspector identified 83 sites along the 380-mile (610-kilometre) pipeline corridor in North Dakota where trees or shrubs might have been cleared in violation of the commission’s orders. Says it did nothing wrong, and the company has a plan to plant two trees for every one removed — a total of about 94,000 trees.

“The reason we have regulations regarding trees and shrubs in North Dakota is that they’re hard to grow, especially in western North Dakota,” Fedorchak said.

___

Follow Blake Nicholson on Twitter at: http://twitter.com/

Blake Nicholson, The Associated Press

GET ENERGYNOW’S DAILY EMAIL FOR FREE


Business leaders express concern about promises in B.C. NDP-Green agreement

CALGARY — Some business leaders in Canada are expressing concerns that the fallout from British Columbia’s election is discouraging the private sector from investing in the province.

Val Litwin, the president of the B.C. Chamber of Commerce, says the promises in NDP-Green agreement to block the Trans Mountain expansion, review the Site C dam, increase the hourly minimum wage to at least $15 and hike the carbon tax have done little to calm investor nerves.

Litwin says he hopes the NDP, should it form a minority government with the help of the Greens, would consult with businesses before making tax changes or raising the minimum wage as they would end up paying those costs.

Gary Leach, the president of the Explorers and Producers Association of Canada, says the resolution to immediately stop Kinder Morgan’s Trans Mountain expansion project would send a chilling message to investors across Canada.

Liberal Premier Christy Clark has said she will recall the provincial legislature in June where she expects a confidence vote will result in the probable defeat of her government.

The Liberals won 43 seats in the May 9 election, one shy of a majority, but the formal, four-year agreement between the Greens and NDP would give them 44 seats, handing them a one-seat majority.

The Canadian Press

GET ENERGYNOW’S DAILY EMAIL FOR FREE


Strad Energy Services Ltd. Announces Annual Meeting Voting Results

FOR: STRAD ENERGY SERVICES LTD.
TSX SYMBOL: SDY

Date issue: May 31, 2017
Time in: 7:33 PM e

Attention:

CALGARY, ALBERTA–(Marketwired – May 31, 2017) –

NOT FOR DISTRIBUTION TO U.S. NEWS WIRE SERVICES OR FOR DISSEMINATION IN THE U.S.

Strad Energy Services Ltd. (“Strad” or the “Company”) (TSX:SDY) announces the
voting results in respect of its annual and special meeting of shareholders
held on May 31, 2017 (the “Meeting”). Each of the matters voted on at the
Meeting is outlined in the Corporation’s Management Information Circular –
Proxy Statement dated April 21, 2017 (the “Information Circular”), which is
available on SEDAR at www.sedar.com.

Strad shareholders have duly elected all of the director nominees proposed by
management in the Information Circular. The detailed voting results from the
Meeting in respect of the election of directors is set forth below:

/T/

Nominee Votes For Votes Withheld
—————————————————————————-

Robert J.A. Grandfield 99.60% 0.40%
(39,369,263) (159,928)

Andrew R.C. Pernal 99.60% 0.41%
(39,369,263) (159,928)

Jack H. Nodwell 99.59% 0.41%
(39,367,663) (161,528)

Craig F. Hruska 99.60% 0.40%
(39,369,263) (159,928)

Thomas M. Alford 99.58% 0.42%
(39,361,601) (167,590)

Lyle A. Wood 99.59% 0.41%
(39,367,163) (162,028)

Michael J. McNulty 99.59% 0.41%
(39,368,663) (160,528)
—————————————————————————-

/T/

Shareholders also voted in favour of the balance of the matters considered at
the Meeting, namely, ordinary resolutions to fix the number of directors at
seven, appoint the Corporation’s auditors and approve the granting of all
unallocated options pursuant to the Company’s stock option plan for a further
three year term in accordance with the rules of the Toronto Stock Exchange.

For complete voting results, please see our Report of Voting Results which will
be available on SEDAR at www.sedar.com.

About Strad Energy Services Ltd.
Strad is a North American energy services company that provides rental
equipment and matting solutions to the oil and gas and energy infrastructure
sectors. Strad focuses on providing complete customer solutions in Canada and
the United States.

Strad is headquartered in Calgary, Alberta, Canada. Strad is listed on the
Toronto Stock Exchange under the trading symbol “SDY”.

– END RELEASE – 31/05/2017

For further information:
Strad Energy Services Ltd.
Andy Pernal
President & Chief Executive Officer
(403) 775-9202
(403) 232-6901 (FAX)
[email protected]
OR
Strad Energy Services Ltd.
Michael Donovan
Chief Financial Officer
(403) 775-9221
(403) 232-6901 (FAX)
[email protected]
www.stradenergy.com

COMPANY:
FOR: STRAD ENERGY SERVICES LTD.
TSX SYMBOL: SDY

INDUSTRY: Energy and Utilities – Oil and Gas
RELEASE ID: 20170531CC0109

Press Release from Marketwired 1-866-736-3779

All press releases are written by the client and have NO affiliation with the news copy written by The Canadian Press. Any questions that arise due to the content or information provided in the press release should be directed to the company/organization
issuing the release, not to The Canadian Press.

GET ENERGYNOW’S DAILY EMAIL FOR FREE


Canyon Services Group Inc. Announces Shareholder Approval of Plan of Arrangement

FOR: CANYON SERVICES GROUP INC.
TSX SYMBOL: FRC

Date issue: May 31, 2017
Time in: 7:31 PM e

Attention:

CALGARY, ALBERTA–(Marketwired – May 31, 2017) – Canyon Services Group Inc.
(“Canyon”) (TSX:FRC) is pleased to announce that at its annual and special
meeting of shareholders (the “Meeting”) held earlier today, holders (“Canyon
Shareholders”) of common shares of Canyon (“Canyon Shares”) approved the
previously announced plan of arrangement (the “Arrangement”) involving Trican
Well Service Ltd. (“Trican”), Canyon and the securityholders of Canyon.

A total of 57,987,084 Canyon Shares (approximately 67.02% of the issued and
outstanding Canyon Shares) were represented at the Meeting in person or by
proxy. The Arrangement was approved by 99.79% of the votes cast by Canyon
Shareholders, either in person or by proxy at the Meeting, and by 99.78% of the
votes cast by Canyon Shareholders, either in person or by proxy at the Meeting,
after excluding the votes cast by an officer of Canyon in accordance with
Multilateral Instrument 61-101 – Protection of Minority Security Holders in
Special Transactions.

Canyon expects to apply for the final approval of the Court of Queen’s Bench of
Alberta of the Arrangement on June 1, 2017 and assuming such order is granted
on the terms and conditions contemplated by Canyon and Trican, closing of the
Arrangement is expected to occur on June 2, 2017.

At the Meeting, Canyon Shareholders also approved, among other annual matters,
the election of seven nominees of Canyon as directors of Canyon, with Canyon
Shares represented at the Meeting voting by way of ballot in favour and
withheld from voting for each of the individual nominees as follows:

/T/

Nominee Outcome of Vote Votes For Votes Withheld
——————- —————— —————— ——————
Bradley P.D. Fedora Elected 57,179,955 94,756
Raymond P. Antony Elected 56,224,237 1,050,474
Neil M. MacKenzie Elected 57,232,352 42,359
M. Scott Ratushny Elected 57,229,675 45,036
Miles Lich Elected 54,017,518 3,257,193
Ken Mullen Elected 56,215,801 1,058,910
Pat G. Powell Elected 56,223,887 1,050,824

/T/

If the Arrangement is completed as planned, such individuals intend to resign
as directors of Canyon at closing of the Arrangement. If the Arrangement is not
completed, such individuals will hold office until the next annual meeting of
Canyon Shareholders or until their successors are duly elected or appointed.

For details of the voting results on the other matters considered at the
Meeting, see Canyon’s Report of Voting Results filed pursuant to National
Instrument 51-102 on www.sedar.com.

FORWARD LOOKING STATEMENTS: This press release contains forward-looking
statements. More particularly, this press release contains statements
concerning the timing and receipt of the final order and the expected closing
date of the Arrangement. The forward-looking statements contained herein are
based on certain key expectations and assumptions made by Canyon, including but
not limited to expectations and assumptions concerning the ability to obtain
the final order on the terms contemplated by the parties, to complete the
Arrangement on the terms and on the timing contemplated by management, and the
assumption that all necessary conditions will be met for the completion of the
Arrangement. Although Canyon believes that the expectations and assumptions on
which the forward-looking statements are based are reasonable, undue reliance
should not be placed on the forward-looking statements because they can give no
assurance that they will prove to be correct. Since forward-looking statements
address future events and conditions, by their very nature they involve
inherent risks and uncertainties. Actual results could differ materially from
those currently anticipated due to a number of factors and risks. These
include, but are not limited to, the failure of Canyon and Trican to obtain
necessary approvals, or to otherwise satisfy the conditions to completion of
the Arrangement, in a timely manner, or at all. Failure to so obtain such
approvals, or the failure of each of Canyon and Trican to otherwise satisfy the
conditions to the Arrangement, may result in the Arrangement not being
completed on the proposed terms, or at all. The forward-looking statements
contained in this press release are made as of the date hereof and Canyon does
not undertake any obligation to update publicly or revise any forward-looking
statements or information, whether as a result of new information, future
events or otherwise, unless so required by applicable securities laws.

– END RELEASE – 31/05/2017

For further information:
Canyon Services Group Inc.
2900 Bow Valley Square III
255-5th Avenue S.W.
Calgary, Alberta, T2P 3G6
Fax: 403-355-2211
OR
Brad Fedora
President & CEO
Phone: 403-290-2491
OR
Barry O’Brien
Vice President, Finance & CFO
Phone: 403-290-2478

COMPANY:
FOR: CANYON SERVICES GROUP INC.
TSX SYMBOL: FRC

INDUSTRY: Energy and Utilities – Oil and Gas , Manufacturing and
Production – Machinery and Tools
RELEASE ID: 20170531CC0108

Press Release from Marketwired 1-866-736-3779

All press releases are written by the client and have NO affiliation with the news copy written by The Canadian Press. Any questions that arise due to the content or information provided in the press release should be directed to the company/organization
issuing the release, not to The Canadian Press.

GET ENERGYNOW’S DAILY EMAIL FOR FREE


Investors press Exxon on disclosure of climate change impact

DALLAS — Exxon Mobil shareholders pushed the company on Wednesday to share more information about whether regulations designed to reduce climate change will hurt the oil giant’s business.

Investors holding 62 per cent of shares voted at the company’s annual meeting favoured more disclosure around the impact of global policies aimed at limiting global warming to 2 degrees centigrade. The vote is a defeat for Exxon and a victory for environmentalists and shareholder activists, who saw support for their proposal grow from 38 per cent a year ago.

Chairman and CEO Darren Woods said the matter will be reconsidered by the Exxon board.

The climate-change resolution was submitted by the New York state retirement fund. It asked the company to analyze the impacts on Exxon’s oil and gas reserves and resources in case demand for fossil fuels drops because of climate-change policies.

Edward Mason, an official with the Church of England’s endowment and a former British diplomat, said Exxon had refused to increase meaningful disclosure of its vulnerability to climate-related regulation in the face of scientific consensus about the severity of the problem.

Addressing some Exxon directors by name, Mason said, “Members of the board, do you leave your understanding of climate change at the door when you attend Exxon Mobil board meetings?”

Woods said Exxon believes that the risks related to climate change “are serious and warrant action, thoughtful action.” But he suggested that the company is already doing enough to protect shareholders by, among other things, assuming a “proxy cost of carbon” when predicting energy demand and planning new projects.

“Our outlook assumes increasingly stringent climate policy,” Woods said. “At the same time, it assumes growing energy demand through 2040 including substantial demand for oil and gas … We are confident in the commercial viability of our portfolio.”

Exxon did not disclose the votes of individual shareholders, but both sides had targeted major institutional investors including BlackRock, Vanguard and Fidelity.

Shareholders rejected another resolution backed by environmentally minded shareholders, which asked Exxon to describe steps it takes to prevent methane emissions from hydraulic fracturing, or fracking, during well drilling. The measure got about 39 per cent support.

Wednesday’s meeting was the first since Woods became CEO, replacing Rex Tillerson, who moved up his retirement date after being picked to become President Donald Trump’s secretary of state.

Tillerson set a different tone at Exxon by endorsing a carbon tax, supporting the Paris climate agreement, and calling climate change a serious risk. But environmentalists attack Exxon for funding groups that try to discredit and dismiss climate science, and New York and Massachusetts officials are investigating whether Exxon misled investors about the risks the company faces from tougher regulation of carbon emissions.

Low crude prices have taken a toll on Exxon profit, which fell from $32.5 billion in 2014 to $16.2 billion in 2015 to $7.8 billion in 2016. With cash declining and debt rising, Exxon lost its sterling AAA credit rating last year.

Shares of Irving, Texas-based Exxon Mobil Corp. rose 16 per cent in 2016 but have dropped 10 per cent since the start of this year. In afternoon trading Wednesday, they were down 44 cents to $80.66.

David Koenig, The Associated Press

GET ENERGYNOW’S DAILY EMAIL FOR FREE


Trican Well Service Ltd. Announces the 2017 Annual and Special Meeting Results

FOR: TRICAN WELL SERVICE LTD.
TSX SYMBOL: TCW

Date issue: May 31, 2017
Time in: 7:03 PM e

Attention:

CALGARY, ALBERTA–(Marketwired – May 31, 2017) – Trican Well Service Ltd.
(“Trican”) (TSX:TCW) today announced the final results from its 2017 annual and
special meeting held on May 31, 2017 (the “Meeting”).

At the Meeting, the resolution to approve the issuance of such number of common
shares (“Trican Shares”) of Trican as may be required to be issued pursuant to
the arrangement under Section 193 of the Business Corporations Act (Alberta)
involving Trican, Canyon Services Group Inc. (“Canyon”), and the security
holders of Canyon was approved. The results of the vote were as follows:

/T/

Votes For Percent Votes Against Percent
————————————————————
133,605,567 99.23% 1,039,854 0.77%

/T/

The following seven nominees were elected as directors of Trican to hold office
until the next annual meeting of shareholders of Trican, or until their
successors are elected or appointed:

/T/

# Votes % Votes
Nominee # Votes For % Votes For Withheld Withheld
—————————————————————————-
Kenneth M. Bagan 134,355,676 99.78% 289,746 0.22%
—————————————————————————-
G. Allen Brooks 133,504,418 99.15% 1,141,004 0.85%
—————————————————————————-
Murray L. Cobbe 132,526,179 98.43% 2,119,243 1.57%
—————————————————————————-
Dale M.
Dusterhoft 133,500,968 99.15% 1,144,454 0.85%
—————————————————————————-
Kevin L. Nugent 130,913,894 97.23% 3,731,528 2.77%
—————————————————————————-
Alexander J.
Pourbaix 134,190,285 99.66% 455,137 0.34%
—————————————————————————-
Deborah S. Stein 133,470,914 99.13% 1,174,508 0.87%
—————————————————————————-

/T/

At the Meeting, shareholders also voted to approve the appointment of KPMG LLP
as auditors of Trican, with Votes For totaling 131,631,588 Trican Shares
representing 94.37% of the Trican Shares voted. An advisory vote to accept
Trican’s approach to executive compensation was approved by shareholders with
Votes For totaling 133,639,211 Trican Shares representing 99.25% of Trican
Shares Voted.

Headquartered in Calgary, Alberta, Trican provides a comprehensive array of
specialized products, equipment and services that are used during the
exploration and development of oil and gas reserves.

– END RELEASE – 31/05/2017

For further information:
Trican Well Service Ltd.
Dale Dusterhoft
Chief Executive Officer
[email protected]
OR
Michael Baldwin
Senior Vice President, Finance & CFO
[email protected]
OR
(403) 266-0202
2900, 645 – 7th Avenue S.W.
Calgary, Alberta T2P 4G8
(403) 237-7716 (FAX)
www.tricanwellservice.com

COMPANY:
FOR: TRICAN WELL SERVICE LTD.
TSX SYMBOL: TCW

INDUSTRY: Energy and Utilities – Equipment, Energy and Utilities –
Oil and Gas
RELEASE ID: 20170531CC0106

Press Release from Marketwired 1-866-736-3779

All press releases are written by the client and have NO affiliation with the news copy written by The Canadian Press. Any questions that arise due to the content or information provided in the press release should be directed to the company/organization
issuing the release, not to The Canadian Press.

GET ENERGYNOW’S DAILY EMAIL FOR FREE


Greenfields Petroleum Corporation Announces Appointment of New Senior Vice President, CFO, and Treasurer

FOR: GREENFIELDS PETROLEUM CORPORATIONTSX VENTURE SYMBOL: GNFDate issue: May 31, 2017Time in: 5:47 PM eAttention:
HOUSTON, TEXAS–(Marketwired – May 31, 2017) – Greenfields Petroleum
Corporation (the “Company” or “Greenfields”) (TSX VENTURE:GNF), an i…

GET ENERGYNOW’S DAILY EMAIL FOR FREE


Trilogy Energy Corp. Completes Sale of Certain Duvernay Assets in the Kaybob Area for $60 Million

FOR: TRILOGY ENERGY CORP.TSX SYMBOL: TETDate issue: May 31, 2017Time in: 5:05 PM eAttention:
CALGARY, ALBERTA–(Marketwired – May 31, 2017) – Trilogy Energy Corp.
(“Trilogy”) (TSX:TET) is pleased to announce that it has completed its
previously announ…

GET ENERGYNOW’S DAILY EMAIL FOR FREE


Updated Share Capital and Voting Rights for BlackPearl

FOR: BLACKPEARL RESOURCES INC.TSX SYMBOL: PXXOMX SYMBOL: PXXSDate issue: May 31, 2017Time in: 5:00 PM eAttention:
CALGARY, ALBERTA–(Marketwired – May 31, 2017) – BlackPearl Resources Inc.
(“BlackPearl” or the “Company”) (TSX:PXX)(OMX:PXXS) reports th…

GET ENERGYNOW’S DAILY EMAIL FOR FREE


Petro Vista Annouces Completion of Return of Capital and Transfer to NEX

FOR: PETRO VISTA ENERGY CORP.TSX VENTURE SYMBOL: PTVDate issue: May 31, 2017Time in: 4:15 PM eAttention:
VANCOUVER, BRITISH COLUMBIA–(Marketwired – May 31, 2017) – Petro Vista Energy
Corp. (TSX VENTURE:PTV)(“Petro Vista” or the “Company”), announces,…

GET ENERGYNOW’S DAILY EMAIL FOR FREE


Serinus Reports Voting Results from AGM

FOR: SERINUS ENERGY INC.
TSX SYMBOL: SEN
WARSAW SYMBOL: SEN

Date issue: May 31, 2017
Time in: 2:22 PM e

Attention:

CALGARY, ALBERTA–(Marketwired – May 31, 2017) – Serinus Energy Inc.
(“Serinus”, “SEN” or the “Company”) (TSX:SEN)(WARSAW:SEN) is pleased to report
that at its annual meeting of shareholders (“AGM”) held on May 31, 2017, each
of the nominees proposed as directors in its Proxy Statement and Information
Circular dated April 28, 2017 were elected as directors of the Company.

Voting Results

The results of the vote for directors are as follows:

/T/

—————————————————————————-

Votes For Votes Withheld
Number Percent (%) Number Percent (%)
Jeffrey Auld 92,153,405 99.96% 38,020 0.04%
Sebastian
Kulczyk 92,153,584 99.96% 37,841 0.04%
Helmut J.
Langanger 92,189,332 100.00% 2,103 0.00%
Dominik Libicki 92,153,584 99.96% 37,841 0.04%
Lukasz Redziniak 92,153,584 99.96% 37,841 0.04%
Evgenij Iorich 92,189,322 100.00% 2,103 0.00%
Eleanor Barker 92,189,322 100.00% 2,103 0.00%
Duncan
Nightingale 92,189,322 100.00% 2,103 0.00%
—————————————————————————-

/T/

For complete voting results, please see our Report of Voting Results available
through SEDAR at www.sedar.com.

About Serinus

Serinus is an international upstream oil and gas exploration and production
company that owns and operates projects in Tunisia and Romania.

For further information, please refer to the Serinus website
(www.serinusenergy.com).

Translation: This news release has been translated into Polish from the English
original.

Forward-looking Statements This release may contain forward-looking statements
made as of the date of this announcement with respect to future activities that
either are not or may not be historical facts. Although the Company believes
that its expectations reflected in the forward-looking statements are
reasonable as of the date hereof, any potential results suggested by such
statements involve risk and uncertainties and no assurance can be given that
actual results will be consistent with these forward-looking statements.
Various factors that could impair or prevent the Company from completing the
expected activities on its projects include that the Company’s projects
experience technical and mechanical problems, there are changes in product
prices, failure to obtain regulatory approvals, the state of the national or
international monetary, oil and gas, financial, political and economic markets
in the jurisdictions where the Company operates and other risks not anticipated
by the Company or disclosed in the Company’s published material. Since
forward-looking statements address future events and conditions, by their very
nature, they involve inherent risks and uncertainties and actual results may
vary materially from those expressed in the forward-looking statement. The
Company undertakes no obligation to revise or update any forward-looking
statements in this announcement to reflect events or circumstances after the
date of this announcement, unless required by law.

– END RELEASE – 31/05/2017

For further information:
Serinus Energy Inc.
Calvin Brackman
Vice President, External Relations & Strategy
+1-403-264-8877
[email protected]
OR
Serinus Energy Inc.
Jeffrey Auld
Chief Executive Officer
+1-403-264-8877
[email protected]

COMPANY:
FOR: SERINUS ENERGY INC.
TSX SYMBOL: SEN
WARSAW SYMBOL: SEN

INDUSTRY: Energy and Utilities – Oil and Gas
RELEASE ID: 20170531CC0074

Press Release from Marketwired 1-866-736-3779

All press releases are written by the client and have NO affiliation with the news copy written by The Canadian Press. Any questions that arise due to the content or information provided in the press release should be directed to the company/organization
issuing the release, not to The Canadian Press.

GET ENERGYNOW’S DAILY EMAIL FOR FREE


Optimize your Maintenance Dollar – T.A. Cook

  Matthew Popovacki, Manager T.A. Cook Consultants   In world class organizations, the maintenance program can be broken down into three benchmarked categories: Base work (where the right work is done at the right time; Non-value-added work (involving too much too soon); and Deviation work (where too little is done, too late).  The ideal amount … Read more

GET ENERGYNOW’S DAILY EMAIL FOR FREE


Canadian Natural Resources Limited Completes the Acquisition of Working Interests in the Athabasca Oil Sands Project and Other Oil Sands Assets

FOR: CANADIAN NATURAL RESOURCES LIMITED
TSX SYMBOL: CNQ
NYSE SYMBOL: CNQ

Date issue: May 31, 2017
Time in: 10:56 AM e

Attention:

CALGARY, ALBERTA–(Marketwired – May 31, 2017) – Canadian Natural Resources
Limited (TSX:CNQ)(NYSE:CNQ) (“Canadian Natural” or the “Company”) announces
that the agreements to acquire in aggregate 70% of the Athabasca Oil Sands
Project (“AOSP”), including 70% of the Scotford upgrader and the Quest Carbon
Capture and Storage project, as well as additional working interests in other
producing and non-producing oil sands leases, have been completed. Upon
closing, the respective ownership interests in the AOSP assets will be 70%
Canadian Natural, 20% Chevron Canada Limited and 10% Shell Canada Limited and
certain subsidiaries (“Shell”).

The aggregate consideration under the acquisition is comprised of 97,560,975
common shares of Canadian Natural issued to Shell, a combined pre-adjustment
cash payment of $8.24 billion to Shell and Marathon Oil Corporation (“Marathon
Oil”), and a deferred payment of US$375 million to Marathon Oil, due in the
first quarter of 2018.

Canadian Natural welcomes approximately 2,800 high caliber employees from Shell
and Marathon Oil to its teams in Fort McMurray, the Peace River region and the
Calgary head office and will commence as operator of the AOSP mines on June 1,
2017. The acquired production, infrastructure and land will add to Canadian
Natural’s existing core areas and provide the Company opportunities to more
effectively and efficiently operate, upon full integration of the employees and
the assets.

Based on the previously approved AOSP 2017 Joint Venture budget, June mine
production from Canadian Natural’s working interest in the acquired AOSP assets
is targeted to be 173,000 – 191,000 bbl/d. In addition, June budgeted
production from the 100% acquired Peace River properties is targeted to be
12,000 – 14,000 bbl/d, reflected within the Company’s North America E&P and
Thermal in situ production guidance. Corporate guidance has been updated to
reflect the May 31, 2017 closing of the transaction based on the previously
approved AOSP and Peace River 2017 budgets, and can be found on the Company’s
website.

Canadian Natural is a senior oil and natural gas production company, with
continuing operations in its core areas located in Western Canada, the U.K.
portion of the North Sea and Offshore Africa.

Certain information regarding the Company contained herein may constitute
forward-looking statements under applicable securities laws. Such statements
are subject to known or unknown risks and uncertainties that may cause actual
results to differ materially from those anticipated or implied in the
forward-looking statements. Refer to our reports filed with the Canadian
securities regulatory authorities and with the SEC for complete forward-looking
statements.

– END RELEASE – 31/05/2017

For further information:
Canadian Natural Resources Limited
2100, 855 – 2nd Street S.W.
Calgary, Alberta, T2P 4J8 Canada
Phone: (403) 514-7777
Email: [email protected]
www.cnrl.com
OR
Steve W. Laut
President
OR
Corey B. Bieber
Chief Financial Officer and Senior Vice-President, Finance
OR
Mark A. Stainthorpe
Director, Treasury and Investor Relations

COMPANY:
FOR: CANADIAN NATURAL RESOURCES LIMITED
TSX SYMBOL: CNQ
NYSE SYMBOL: CNQ

INDUSTRY: Energy and Utilities – Oil and Gas
RELEASE ID: 20170531CC0056

Press Release from Marketwired 1-866-736-3779

All press releases are written by the client and have NO affiliation with the news copy written by The Canadian Press. Any questions that arise due to the content or information provided in the press release should be directed to the company/organization
issuing the release, not to The Canadian Press.

GET ENERGYNOW’S DAILY EMAIL FOR FREE


Sunshine Oilsands Ltd.: Placing of Up to 67,511,000 New Shares Under General Mandate

FOR: SUNSHINE OILSANDS LTD.HKSE SYMBOL: 2012Date issue: May 31, 2017Time in: 7:43 AM eAttention:
HONG KONG, CHINA and CALGARY, ALBERTA–(Marketwired – May 31, 2017) – The Board
of Directors (the “Board”) of Sunshine Oilsands Ltd. (the “Corporation” or…

GET ENERGYNOW’S DAILY EMAIL FOR FREE


STEP Energy Services To Open Toronto Stock Exchange on June 1

Calgary, AB (May 30, 2017) – STEP Energy Services Ltd. (the “Company” or “STEP”), a coiled tubing, pumping and hydraulic fracturing services company, will initiate the siren to open the day’s trading session of Toronto Stock Exchange on June 1, 2017.  The ceremony commemorates the debut of STEP’s listing of common shares on TSX, under … Read more

GET ENERGYNOW’S DAILY EMAIL FOR FREE


B.C. government shake-up puts federally-approved pipeline project in jeopardy

OTTAWA — Federal Liberals are nervous about the future of the Trans Mountain pipeline project as a political shake-up in British Columbia seems likely to produce a provincial government that opposes the plan.

Liberals waited anxiously throughout the day for details of a deal between B.C. NDP Leader John Horgan and Green Party Leader Andrew Weaver and were greeted at day’s end by news the deal had not only been signed, but specifically included a plan to oppose the pipeline.

The project – to twin the existing pipeline that runs between Edmonton and Burnaby, B.C. – was given the green light by Prime Minister Justin Trudeau last fall. B.C. Liberal Premier Christy Clark came around to supporting it over the winter after certain conditions she placed on it were met.

That approval likely cost her in the May 9 election, in which the Liberals fell one seat short of a majority and the Greens, with just three seats, were left holding the balance of power.

Clark intends to test her government in the Legislature before the end of June, a test she expects to lose. She would likely then be replaced by Horgan and the NDP, whose minority government would be propped up by the Greens.

Both Horgan and Weaver campaigned against Trans Mountain, a factor University of British Columbia professor George Hoberg said was certainly part of the election result and a sign that a majority of British Columbians don’t want the pipeline to be twinned.

“A lot has changed,” said Hoberg, of the politics around Trans Mountain.

While interprovincial pipelines remain the jurisdiction of Ottawa, he said a province could put up road blocks, such as refusing logging permits for construction or insisting on a provincial environmental assessment.

“If it does either of those things the federal government would have to go to court to force B.C. to stand down and respect federal jurisdiction,” said Hoberg. “They would probably win. That would take a couple of years.”

He said any delays could further erode the confidence of investors, who were already showing some skittishness about the project during Kinder Morgan’s initial public offering Tuesday.

Trudeau, who was in Italy, insisted Tuesday the B.C. political shake-up doesn’t change the facts in favour of the Trans Mountain pipeline expansion. Natural Resources Minister Jim Carr reiterated the message saying the project was approved based on science and extensive consultations and nothing has changed that.

“The approval will be there for the former government, the current government and any government after that,” Carr said.

However a source in the federal government acknowledged events in B.C. have made people in Ottawa nervous. The pipeline has already caused strife for the ruling party among supporters and even within the caucus with several B.C. Liberal MPs opposing it.

Federal Conservatives smell blood. Newly-minted Leader Andrew Scheer said there are “forces uniting” to kill the Trans Mountain project and Trudeau doesn’t have the political stamina to stand up to them.

“The Prime Minister personally approved this pipeline,” Scheer said in the House of Commons.

“He said that it was a fundamental responsibility to get Canadian energy to market. Will the Prime Minister finally stand up to the forces that are seeking to kill these jobs, or will he fold like a cardboard cutout?”

Greg MacEachern, a former Liberal strategist who is now a vice-president at Environics, said whatever happens in the B.C. legislature there will be areas of common ground and room for negotiation.

“If there is a new NDP/Green government they are also going to have demands,” he said. “What this likely will come down to is the economy.”

But federal Green Party Leader Elizabeth May said Tuesday she thinks Trans Mountain is “dead.”

-follow @mrabson on Twitter.

Mia Rabson, The Canadian Press

GET ENERGYNOW’S DAILY EMAIL FOR FREE


Dakota Access pipeline, law officers had close relationship

BISMARCK, N.D. — A private security firm hired by the developer of the $3.8 billion Dakota Access pipeline conducted an aggressive, multifaceted operation against protesters that included a close working relationship with public law enforcement, documents obtained by an online magazine indicate.

Native American groups that opposed the pipeline say the report from The Intercept lends credence to their belief that law enforcement favoured private industry in the monthslong dispute. But law enforcement and Texas-based pipeline developer Energy Transfer Partners say their concern was everyone’s safety.

The Dakota Access pipeline will move North Dakota oil to a distribution point in Illinois. ETP plans to begin commercial operations Thursday. The company says the pipeline is safe, but opponents fear environmental harm.

Thousands of protesters last year descended on a camp set up in North Dakota near a section of the pipeline that runs under a Missouri River reservoir upstream from the Standing Rock Sioux reservation. Pipeline opponents frequently clashed with police, and 761 arrests happened between August and February.

The documents show that ETP hired security firm TigerSwan, which was founded by retired military special forces members. The Intercept posted some of the documents it obtained online. It said it received more than 100 documents from a TigerSwan contractor and more than 1,000 through public records requests.

TigerSwan used military-style counter-terrorism measures against what it considered “an ideologically driven insurgency,” the documents show. Its tactics included protest camp flyovers, video surveillance, social media monitoring, public relations — described in one document as “pro-DAPL propaganda” — and interactions with law enforcement. That included placing a liaison in the law enforcement operations centre.

“Excellent comments from lead LEOs (Law Enforcement Officers) today regarding planning and communication from our personnel,” says a TigerSwan report from Sept. 14.

The relationship was heavily criticized Tuesday by the Lakota People’s Law Office.

“Rather than one-sidedly protecting the private interests of oil corporations, these state and federal law enforcement agencies should have been also protecting the constitutional rights of those who were being criminally conspired against, disrupted, and physically attacked by the oil company’s private mercenary army of Middle East-based anti-terrorist specialists,” Chief Counsel Daniel Sheehan said in a statement.

Indigenous Environmental Network organizer Dallas Goldtooth said in a statement that “police and security were essentially given permission to carry out war-like tactics” on protesters.

One particularly violent clash happened in late November, when protesters trying to push past a blocked highway bridge were turned back by authorities using tear gas, rubber bullets and water sprays. Police said protesters were throwing rocks, asphalt and water bottles at officers.

The Morton County Sheriff’s Office, which spearheaded the response to the protests, said its communications with TigerSwan security weren’t unusual and “gave law enforcement situational awareness in order to monitor and respond to illegal protest activity.”

ETP said in a statement that “the safety of our employees and the communities in which we live and work is our top priority. In order to ensure that we do have security plans in place, we do communicate with law enforcement agencies as appropriate.”

___

Follow Blake Nicholson on Twitter at: http://twitter.com/NicholsonBlake

Blake Nicholson, The Associated Press

GET ENERGYNOW’S DAILY EMAIL FOR FREE


Husky Energy releases 5-year plan bracing for low oil prices, forecasts growth

CALGARY — Husky Energy (TSX:HSE) released a new five-year plan Tuesday that braces for lower oil prices while forecasting average production to grow by nearly five per cent annually.

The Calgary-based company said it will aim to reduce its break-even price point by 2021 to US$32 per barrel from the current US$33.50. Crude settled Tuesday at $49.66 per barrel.

“Over the next five years we see average production growth of about 4.8 per cent annually, approaching 400,000 barrels (of oil equivalent) per day in 2021,” said CEO Rob Peabody at Husky Energy’s investor day in Toronto.

Peabody said Husky Energy plans to spend an average of $3.3 billion per year through to 2021, taking funds from operations from about $3.3 billion this year to about $4.8 billion in 2021.

The capital spending is expected to go mainly to heavy oil projects on the Alberta-Saskatchewan border as well as offshore projects in the Asia-Pacific region and off the east coast of Newfoundland.

The plan came a day after Husky Energy announced it would move ahead with the West White Rose project in the North Atlantic. The development, estimated to cost $2.2 billion, is expected to produce first oil in 2022.

Analysts had hoped to hear when Husky Energy would reinstate the dividend payouts it cancelled in late 2015 because of low commodity prices. But chief financial officer Jon McKenzie said no decision has yet been made by the board.

But he added Husky expects to generate rising levels of free cash flow over the next five years that will outstrip sustaining capital needs, based on an oil price forecast of US$50 this year, US$55 in 2018 and US$60 per barrel in 2019 and beyond.

“There is room for both growth and a dividend,” McKenzie said. “We don’t want to do one to the exclusion of the other.”

He said improved efficiencies have allowed Husky Energy to reduce its 2017 capital spending budget by $100 million to a midpoint of $2.55 billion.

About 70 per cent of Husky Energy’s shares are controlled by Hong Kong billionaire Li Ka-Shing.


Follow @HealingSlowly on Twitter.

Dan Healing, The Canadian Press

GET ENERGYNOW’S DAILY EMAIL FOR FREE


NDP, Green agreement to govern B.C. trumpets rep-by-pop vote system

VICTORIA — British Columbia’s New Democrats and Greens signed a four-year political manifesto Tuesday with a long list of ambitions to run the province, including a new voting system and a ban on corporate and union donations.

It also seeks to stop the Kinder Morgan’s $7.4 billion pipeline expansion project and require further reviews of the $8.8 billion Site C hydroelectric dam.

But the unprecedented political agreement for an NDP minority government will have to wait until Premier Christy Clark recalls the legislature for what she said would likely be the end of her government in a confidence vote.

NDP Leader John Horgan and Green Leader Andrew Weaver didn’t take issue with Clark’s decision to lose in a house vote, but want her to move quickly.

“I’m hopeful that if Ms. Clark does want to go through with that precedent, that she does so in a timely manner,” Horgan said after signing the 10-page agreement during a ceremony with Weaver at the legislature.

The agreement would see the legislature recalled within one month of the swearing in of an NDP government and its first order of business would be legislation to hold a referendum next year on proportional representation.

“We’re going to work together on this,” said Weaver. “The goal is to have a very clear question after an extensive consultative process that John and I and our various teams campaign on as opposed to against.”

The two parties also agreed to introduce legislation to ban corporate and union donations to political parties, as well as contributions from non-residents of B.C. after fundraising became a major issue in this month’s provincial election campaign.

The parties said they would use “every tool available” to stop the expansion of Kinder Morgan’s Trans Mountain pipeline, and would refer the Site C dam, which is already under construction, to the B.C. Utilities Commission to determine its economic viability.

The likelihood of a renewed debate on the Trans Mountain pipeline drew reaction from outside the province even before Horgan said the parties have a responsibility to “defend” the coastline of British Columbia and stop the pipeline, which would increase tanker traffic seven-fold off the west coast.

Both Prime Minister Justin Trudeau and Alberta Premier Rachel Notley defended the pipeline expansion, saying it is in the country’s best interests.

“And mark my words: that pipeline will be built,” Notley said.

Weaver said comments in support of the pipeline are misguided, likening them to Clark’s promises in the 2013 election campaign to the potential prosperity of a liquefied natural gas industry.

“We’ve heard this before. One-hundred thousand jobs in LNG, $100-billion prosperity fund, $1-trillion increase in GDP, elimination of the PST, debt-free B.C., unicorns in all our backyards,” he said.

Every member of the NDP and Green caucuses supported the agreement.

“The challenge here is to demonstrate to British Columbians, as we are today, that people from different political persuasions can come together in the interest of British Columbians so people don’t fear minority governments, in fact, they embrace them,” Horgan said.

Although Clark appeared resigned to the outcome of a confidence motion, she said she is not ready to walk away from office before recalling the legislature to see if she can get support to continue governing.

She said it would be up to the lieutenant-governor to decide whether the NDP can take power or call a new election if the Liberals are defeated.

“What’s most important is this basic principle, that if there is going to be a transfer of power in this province, and it certainly seems like there will be, it shouldn’t be done behind closed doors,” she told a news conference in Vancouver.

Clark said if her government loses a confidence vote, she would be willing to serve as Opposition leader.

She said she plans to bring the house back in June and made the decision to test the will of the legislature after consulting constitutional experts.

The Liberals have been in power for 16 years. They took 43 seats in the election, one short of a majority, compared with 41 for the NDP and three for the Greens, leaving them with the balance of power for the first time in Canadian history.

The Greens went into negotiations with the other two parties shortly after the May 9 election making three key demands: getting official party status in the legislature, an electoral system based on proportional representation and political fundraising reform.

The Greens and NDP have supported a system of proportional representation that accounts for the number of seats each party gets in the legislature based on their percentage of the popular vote.

Two previous referendums on proportional representation have failed in B.C.

Under the terms of the NDP-Green agreement, the next referendum would take place when municipal elections are held in the fall of the 2018.


Dirk Meissner, The Canadian Press


GET ENERGYNOW’S DAILY EMAIL FOR FREE


Rooster Energy Ltd. Provides Update Regarding Quarterly Financial Statement Filing

FOR: ROOSTER ENERGY LTD.
TSX VENTURE SYMBOL: COQ

Date issue: May 30, 2017
Time in: 7:03 PM e

Attention:

CALGARY, ALBERTA–(Marketwired – May 30, 2017) – ROOSTER ENERGY LTD. (the
“Company”) (www.roosterenergyltd.com) (TSX VENTURE:COQ) announced today that
the filing with applicable Canadian securities regulators of its quarterly
financial statements, management’s discussion and analysis and related CEO and
CFO certifications for the period ended March 31, 2017 has been delayed beyond
the filing deadline of May 30, 2017.

As previously disclosed, the Company is in discussions with the holders of its
Senior Secured Notes to restructure the terms and conditions of the related
Note Purchase Agreement. To date the Company and the holders of Senior Secured
Notes have been unable to reach agreement on these matters. As a result, the
Company remains under significant cash constraints and has been unable to
complete its requisite financial disclosures within the mandated time frame.
Additionally, the Company opted not to make the interest payment due on May 1,
2017 under the terms of the Note Purchase Agreement. There can be no assurance
the Company will be able to reach a satisfactory agreement with the holders of
its Senior Secured Notes or resume the filing of its continuous disclosure
materials within a particular time frame or at all. In the event the Company is
unable to satisfactorily restructure the Senior Secured Notes, the Company
would in all likelihood exercise all of its available alternatives to preserve
the going concern value of the Company. Such alternatives could include filing
a voluntary petition for relief under Chapter 11 of the U.S. Bankruptcy Code or
similar restructuring laws, with recognition of any orders entered thereunder
in the appropriate jurisdiction in Canada.

ABOUT ROOSTER ENERGY LTD.

Rooster Energy Ltd. is a Houston, Texas, based independent oil and natural gas
exploration & production company focused on the development of resources in the
shallow waters of the Gulf of Mexico and the delivery of well intervention
services, including well plugging and abandonment.

Investors are welcome to visit our website at www.roosterenergyltd.com or
contact Kenneth F. Tamplain, Jr. for all corporate updates and investor
inquiries via the contact information listed below.

Forward Looking Information and Statements

Certain statements and information in this press release may constitute
“forward-looking information” or statements as such terms are used in
applicable Canadian securities laws. Any statement that expresses, involves or
includes expectations of the anticipated benefits of the refinancing or
modification of existing debt, future operations, resumption of public filings,
projections, objectives, assumptions or future events that are not statements
of historical fact should be viewed as “forward-looking statements”.
Forward-looking information is based on opinions, expectations and estimates of
the Company as at the date such statements are made and are subject to a
variety of known and unknown risks and uncertainties. Events or circumstances
may cause use actual results to differ materially from those predicted, as a
result of numerous known and unknown risks, uncertainties, and other factors,
many of which are beyond the control of the Company. These risks include, but
are not limited to, the risks associated with the refinancing the Company’s
indebtedness, the oil and gas industry, commodity prices, and interest and
exchange rate changes. Industry related risks could include, but are not
limited to, operational risks in exploration, development and production,
delays or changes in plans, risks associated with the uncertainty of reserve
estimates, or reservoir performance, health and safety risks and the
uncertainty of estimates and projections of production, costs and expenses. The
reader is cautioned not to place undue reliance on any forward-looking
statement in this press release. The Company disclaims any intention or
obligation to update or revise any forward-looking statement, whether as a
result of new information, future events or otherwise, except as required by
applicable law.

NEITHER THE TSX VENTURE EXCHANGE NOR ITS REGULATION SERVICE PROVIDER (AS THAT
TERM IS DEFINED IN THE POLICIES OF THE TSX VENTURE EXCHANGE) ACCEPTS
RESPONSIBILITY FOR THE ADEQUACY OR ACCURACY OF THE RELEASE.

– END RELEASE – 30/05/2017

For further information:
Kenneth F. Tamplain, Jr.
Chief Executive Officer
Rooster Energy Ltd.
16285 Park Ten Place, Suite 120
Houston, Texas, USA 77084
Telephone: (832) 463-0625

COMPANY:
FOR: ROOSTER ENERGY LTD.
TSX VENTURE SYMBOL: COQ

INDUSTRY: Energy and Utilities – Oil and Gas
RELEASE ID: 20170530CC0121

Press Release from Marketwired 1-866-736-3779

All press releases are written by the client and have NO affiliation with the news copy written by The Canadian Press. Any questions that arise due to the content or information provided in the press release should be directed to the company/organization
issuing the release, not to The Canadian Press.

GET ENERGYNOW’S DAILY EMAIL FOR FREE


Marquee Energy Ltd. Announces First Quarter 2017 Financial Results and 2017 Corporate Budget and Guidance

FOR: MARQUEE ENERGY LTD.
TSX VENTURE Symbol: MQX

Date issue: May 30, 2017
Time in: 6:54 PM e

Attention:

CALGARY, AB –(Marketwired – May 30, 2017) –

NOT FOR DISTRIBUTION TO U.S. NEWS SERVICES OR FOR DISSEMINATION IN THE UNITED
STATES

Marquee Energy Ltd. (“Marquee” or the “Company”) (TSX VENTURE: MQX) announces
its first quarter operational and financial results for the three months ended
March 31, 2017. The Company’s financial statements and Management’s Discussion
and Analysis (“MD&A”) for the three months ended March 31, 2017 are available
on the System for Electronic Document Analysis and Retrieval (SEDAR) at
www.sedar.com and on Marquee’s website at www.marquee-energy.com.

FIRST QUARTER 2017 FINANCIAL AND OPERATING HIGHLIGHTS

/T/

— Marquee successfully drilled, completed, and equipped three light oil

horizontal Banff wells at Michichi on a single pad location at an
average cost of $1.79 million per well. These are the first wells
Marquee has drilled since the third quarter of 2015. The wells came on
production in early April with higher than expected production rates;

/T/

/T/

— Production averaged 2,479 boe/d (46% liquids) in the first quarter of

2017, down 79 boe/d (3%) from the fourth quarter 2016. No new production
was brought on line in the quarter with results reflecting the low-
decline performance of production at Michichi;

/T/

/T/

— Funds flows from operations were $1.3 million in the first quarter, an

increase of $2.2 million from the previous quarter;

/T/

/T/

— Revenue was $33.27/boe in the first quarter of 2017, down $0.78/boe from

$34.05/boe realized in the previous quarter;

/T/

/T/

— Reduced quarterly production and transportation costs by 32% to $3.9

million or $17.56 per boe from $5.7 million or $24.30 per boe in the
fourth quarter of 2016, primarily due to a number of one time only costs
that occurred in Q4 2016;

/T/

/T/

— Operating netbacks prior to hedging averaged $13.06/boe in Q1 2017, a

60% increase from the previous quarter.

/T/

/T/

— Subsequent to March 31, 2017, the Company entered into a $30 million

term loan with Crown Capital Fund IV, LP, an investment fund managed by
Crown Capital Partners Inc.

/T/

/T/

— Subsequent to March 31, 2017, the Company signed a $12 million credit

facility with a major Canadian bank, replacing the previous syndicated
credit facility of $25 million;

/T/

/T/

— The Company’s Annual and Special Shareholders’ meeting will be held on

June 26, 2017. At the meeting, shareholders will be asked to approve a
Consolidation to effect a consolidation of the Common Shares of

/T/

Marquee on the basis of one (1) post-consolidation Common Share for every
thirty (30) pre-consolidation Common Shares then issued and outstanding.

FINANCIAL AND OPERATIONAL RESULTS

/T/

—————————————————————————-

Three months ended March 31,
2017 2016
—————————————————————————-
Financial (000’s except per share and per
boe amounts)
Oil and natural gas sales (1) $7,423 $7,749
Funds flow from operations (2) $1,332 $1,392
Per share – basic and diluted $- $0.01
Per boe $5.76 $3.45
Net income (loss) $(3,663) $(7,918)
Per share – basic and diluted $(0.01) $(0.04)
Capital expenditures $6,611 $100

Net debt (2) $22,688 $49,058
Total Assets $174,239 $217,189
Weighted average basic and diluted shares
outstanding 435,772,196 205,686,639

Operational
Net wells drilled 3 –
Daily sales volumes
Oil (bbls per day) 1,000 1,457
Heavy Oil (bbls per day) – 407
NGL’s (bbls per day) 132 157
Natural Gas (mcf per day) 8,082 14,451
Total (boe per day) 2,479 4,430
% Oil and NGL’s 46% 46%
Average realized prices
Light Oil ($/bbl) $52.69 $31.11
Heavy Oil ($/bbl) $- $17.60
NGL’s ($/bbl) $41.58 $24.08
Natural Gas ($/mcf) $3.00 $2.00
Netback
Revenue ($/boe) $33.27 $19.22
Royalties ($/boe) $(2.65) $(1.34)
Operating and transportation costs
($/boe) $(17.56) $(16.46)
Operating netback prior to hedging (2) $13.06 $1.42
Realized hedging gain (loss) ($/boe) $- $5.89
Operating netback ($/boe) (2) $13.06 $7.31
—————————————————————————-

/T/

/T/

(1) Before Royalties
(2) Defined under the Non-GAAP Measures section of the Company’s MD&A for

the three months ended March 31, 2017

/T/

2017 CAPITAL BUDGET AND GUIDANCE

Further to its earlier press release also dated May 30, 2017, announcing the
entering into of a term loan with Crown Capital Fund IV, LP, an investment
fund managed by Crown Capital Partners Inc., and a new credit facility with a
major Canadian bank (the “Credit Facility”), the Board of Directors of Marquee
has approved a capital budget of approximately $15 million for the second half
of 2017. The budgeting is based on an oil price of US$50WTI/barrel and a
natural gas price of $2.75/GJ AECO. The capital program is expected to
increase cashflow, production and reserves while leaving the Company undrawn
on its Credit Facility at year-end.

Marquee is planning to drill six light oil horizontal Banff wells in the
second half of 2017, and expects a year end corporate exit rate of 3,000 boe/d
– 3,300 boe/d (25-37% production growth exit to exit). The production growth
in 2017 is expected to increase the Company’s oil and liquids weighting and
reduce corporate unit operating costs generating an expected improvement of
field netbacks by more than 40%.

The second half 2017 drilling program is anticipated to commence mid-June to
early July, and expects to incorporate mono-bore drilling with increased frack
stages to improve productivity and reserves recoveries while maintaining
similar well costs as recent drilling. The capital spending also includes
legacy horizontal well optimization, operating capital, normal course
abandonment and reclamations costs as well as seismic and land acquisition
expenditures.

Marquee’s latest well results were press released on May 23, 2017 and the
wells continue to perform above expected rates. The wells demonstrate strong
economics at current commodity prices and provide high rates of return and
cash netbacks.

ANNUAL AND SPECIAL MEETING OF SHAREHOLDERS

The Company’s Annual and Special Meeting of Shareholders (the “Meeting”) is
scheduled for 2:00 PM on Monday, June 26, 2017 in the Strand/Tivoli room at
the Metropolitan Conference Centre in Calgary, Alberta. The record date for
the meeting has been set at May 23, 2017.

At the Meeting, shareholders (“Shareholders”) of Marquee’s common shares
(“Common Shares”) will be asked to approve a special resolution (the
“Consolidation Resolution”) authorizing the Company to amend its Articles to
effect a consolidation (the “Consolidation”) of the Common Shares on the basis
of one (1) post-consolidation Common Share for every thirty (30)
pre-consolidation Common Shares then issued and outstanding, or such other
number of pre-consolidation Common Shares as may be determined by the Board in
its sole discretion, subject to the requirements of the TSX Venture Exchange.
As of the date hereof, the Company has 435,772,196 Common Shares outstanding.
Notwithstanding approval of the proposed Consolidation by the Shareholders,
the Board may, in its sole discretion, revoke the Consolidation Resolution,
and abandon the Consolidation without further approval or action by, or prior
notice to, the Shareholders.

The Company believes that, if implemented, the Consolidation will help attract
a new investor base and potentially increase liquidity. The Board believes
that the Consolidation is in the best interest of the Company, and that the
Consolidation will more closely align the issued and outstanding share capital
of the Company with its financial valuation.

If approved and implemented, the Consolidation will occur simultaneously for
all of the Company’s issued and outstanding Common Shares and the
consolidation ratio will be same for all such Common Shares. The Consolidation
will affect all holders of Common Shares uniformly and will not affect any
Shareholder’s percentage ownership interest in the Company, except to the
extent that the Consolidation would otherwise result in a Shareholder owning a
fractional Common Share. No fractional post-consolidation Common Shares will
be issued and no cash will be paid in lieu of fractional post-consolidation
Common Shares. Any fractional Common Shares resulting from the Consolidation
will be rounded to the nearest whole Common Share.

ABOUT MARQUEE

Marquee is a Calgary-based, junior energy company focused on light oil
development and production in the Michichi area of eastern Alberta. Marquee’s
shares trade on the TSX Venture Exchange under the trading symbol “MQX”.
Additional information about Marquee may be found on its website
www.marquee-energy.com and in its continuous disclosure documents filed with
Canadian securities regulators on SEDAR at www.sedar.com.

Neither the TSX Venture Exchange nor its Regulation Services Provider (as that
term is defined in the policies of the TSX Venture Exchange) accepts
responsibility for the adequacy or accuracy of this release.

FORWARD-LOOKING STATEMENTS OR INFORMATION

Certain statements included or incorporated by reference in this news release
may constitute forward-looking statements under applicable securities
legislation. Such forward-looking statements or information typically contain
statements with words such as “anticipate”, “believe”, “expect”, “plan”,
“intend”, “estimate”, “propose”, or similar words suggesting future outcomes
or statements regarding an outlook. Forward-looking statements or information
in this news release may include, but are not limited to: reserves estimates
and the net present value of the future net reserves related thereto; the
number and quality of future potential drilling and development opportunities;
anticipated capital budgets and expenditures; average production for 2017 and
beyond; 2017 exit production rates; the Company’s development plan; the size
and extent of the Michichi oil fairway; matters to be voted on at the
Company’s annual and special meeting of shareholders, a consolidation of the
Company’s shares, and the benefits to be derived therefrom; and the timing of
disclosure of further 2017 guidance, capital expenditure plans and well
performance.

Such forward-looking statements or information are based on a number of
assumptions all or any of which may prove to be incorrect. In addition to any
other assumptions identified in this document, assumptions have been made
regarding, among other things: the ability of the Company to obtain equipment,
services and supplies in a timely manner to carry out its activities; the
ability of the Company to market crude oil, natural gas liquids and natural
gas successfully to current and new customers; the ability to secure adequate
product transportation; the timely receipt of required regulatory approvals;
the ability of the Company to obtain financing on acceptable terms; interest
rates; regulatory framework regarding taxes, royalties and environmental
matters; future crude oil, natural gas liquids and natural gas prices; the
ability to successfully integrate acquisitions into Marquee’s business and
management’s expectations relating to the timing and results of development
activities.

Forward-looking information is based on current expectations, estimates and
projections that involve a number of risks and uncertainties which could cause
actual results to differ materially from those anticipated by the Company and
described in the forward-looking information. Material risk factors affecting
the Company and its business are contained in Marquee’s Annual Information
Form for the year ended December 31, 2016, which is available under Marquee’s
issuer profile on SEDAR at www.sedar.com.

The forward-looking information contained in this press release is made as of
the date hereof and the Company undertakes no obligation to update publicly or
revise any forward-looking information, whether as a result of new
information, future events or otherwise, unless required by applicable
securities laws. The forward -looking information contained in this press
release is expressly qualified by this cautionary statement.

NON-GAAP FINANCIAL MEASURES

This press release contains the term “operating netbacks prior to hedging” and
“operating netbacks” which do not have standardized meanings prescribed by
IFRS and, therefore, may not be comparable with the calculation of similar
measures presented by other companies. Marquee uses operating netbacks to
analyze operating performance. Marquee believes this benchmark is a key
measure of profitability and overall sustainability for the Company and this
term is commonly used in the oil and natural gas industry. Operating netbacks
are not intended to represent operating profits, net earnings or other
measures of financial performance calculated in accordance with IFRS.

Operating netbacks prior to hedging are calculated by subtracting royalties,
production, and operating and transportation expenses from revenues before
other income/losses. Operating netbacks include realized hedging gain (loss).

This press release also contains the term “funds flow from operations” which
should not be considered an alternative to, or more meaningful than “cash flow
from operating activities”, as determined in accordance with IFRS, as an
indicator of the Company’s performance. “Funds flow from operations” does not
have any standardized meaning prescribed by IFRS and therefore reference to
funds flow from operations or funds flow from operations per share may not be
comparable with the calculation of similar measures presented by other
entities. Management uses funds flow from operations to analyze operating
performance and leverage and considers funds flow from operations to be a key
measure as it demonstrates the Company’s ability to generate cash necessary to
fund future capital investments and to repay debt. Funds flow from operations
per share is calculated using the weighted average number of shares for the
period.

In addition, the press release contains the term “net debt”, which does not
have any standardized meaning under IFRS and therefore may not be comparable
to similar measures presented by other issuers. Net debt is calculated as net
debt, defined as current assets less current liabilities (excluding fair value
of commodity contracts and flow-through share premiums). Management considers
net debt as an important additional measure to monitor debt repayment
requirements and track the financial viability of the Company.

Please see the Company’s MD&A for the year ended December 31, 2016 and the
Company’s MD&A for the three months ended March 31, 2017 for a reconciliation
of certain Non-GAAP financial measures used in this press release to their
most directly comparable GAAP or IFRS measures.

ADDITIONAL ADVISORIES

Barrels of oil equivalent (boe) are presented on the basis of one boe for six
Mcf of natural gas. Disclosure provided herein in respect of boe may be
misleading, particularly if used in isolation. A boe conversion ratio of 6
Mcf: 1 bbl is based on an energy equivalency conversion method primarily
applicable at the burner tip and does not represent a value equivalency at the
wellhead. Given that the value ratio based on the current price of crude oil
as compared to natural gas is significantly different from the energy
equivalency of 6:1, utilizing a conversion on a 6:1 basis may be misleading as
an indication of value.

– END RELEASE – 30/05/2017

For further information:

FOR ADDITIONAL INFORMATION PLEASE CONTACT:

Richard Thompson
President & Chief Executive Officer
(403) 817-5561
[email protected]

or visit the Company’s website at www.marquee-energy.com

COMPANY:
FOR: MARQUEE ENERGY LTD.
TSX VENTURE Symbol: MQX

INDUSTRY: Energy and Utilities – Oil and Gas
RELEASE ID: 20170530CC024

Press Release from Marketwired 1-866-736-3779

All press releases are written by the client and have NO affiliation with the news copy written by The Canadian Press. Any questions that arise due to the content or information provided in the press release should be directed to the company/organization
issuing the release, not to The Canadian Press.

GET ENERGYNOW’S DAILY EMAIL FOR FREE


Conagra Brands sells Wesson brand for $285M to Smucker

OMAHA, Neb. — Conagra is selling Wesson oil for $285 million to the J.M. Smucker Company as it hones its focus on its strongest brands.

CEO Sean Connolly said Tuesday that the sale is part of a reorganization that was undertaken after he was picked to lead Conagra in 2015.

Conagra moved its headquarters to Chicago from Omaha, Nebraska.

Smucker said Wesson is expected to add $230 million in sales and roughly $30 million in pretax earnings.

Conagra Brands will initially continue producing Wesson after the sale until the work moves to Smucker’s existing oil manufacturing plant in Cincinnati, Ohio.

The Associated Press

GET ENERGYNOW’S DAILY EMAIL FOR FREE


Marquee Energy Ltd. Announces Strategic Financing Transaction and Expanded 2017 Capital Program

FOR: MARQUEE ENERGY LTD.
TSX VENTURE Symbol: MQX

Date issue: May 30, 2017
Time in: 5:51 PM e

Attention:

CALGARY, AB –(Marketwired – May 30, 2017) – Marquee Energy Ltd. (“Marquee”
or the “Company”) (TSX VENTURE: MQX) is pleased to announce key steps that
have been taken to increase growth, value and liquidity. The Company has
entered into a term loan with Crown Capital Fund IV, LP (“Crown Capital”), an
investment fund managed by Crown Capital Partners Inc. and has closed a new
credit facility with a major Canadian bank (the “Credit Facility”). This will
allow the Company to expand its capital program for the second half of 2017.

THE TERM LOAN

Marquee has entered into an agreement with Crown Capital for a $30 million
subordinated term loan (the “Term Loan”). The Term Loan bears an interest rate
of 10% per annum over a term of five years and is second lien secured. In
conjunction with the Term Loan, Marquee has granted Crown Capital 37,500,000
warrants (the “Warrants”) or approximately 8.6% of the outstanding shares.
Each Warrant entitles Crown to purchase one common share of Marquee at an
exercise price of $0.11 any time prior to May 30, 2021. The exercise price of
the Warrants represents a 46% premium to the 20-day volume-weighted average
trading price of Marquee common shares at market close on May 29, 2017. If
fully exercised, the warrants would represent approximately 8% of the fully
diluted common shares outstanding.

Proceeds from the Term Loan will fully repay the previous syndicated loan,
provide long term funding and liquidity certainty for the Company and support
an expanded drilling program of high netback and high rate of return
horizontal light oil wells at Michichi.

2017 CAPITAL BUDGET AND GUIDANCE

The Board of Directors of Marquee has approved a capital budget of
approximately $15 million for the second half of 2017. The budgeting is based
on an oil price of US$50WTI/barrel and a natural gas price of $2.75/GJ AECO.
The capital program is expected to increase cashflow, production and reserves
while leaving the Company undrawn on its Credit Facility at year-end.

Marquee is planning to drill six light oil horizontal Banff wells in the
second half of 2017, and expects a year end corporate exit rate of 3,000 boe/d
– 3,300 boe/d (25-37% production growth exit to exit). The production growth
in 2017 is expected to increase the Company’s oil and liquids weighting and
reduce corporate unit operating costs generating an expected improvement of
field netbacks by more than 40%.

The second half 2017 drilling program is anticipated to commence mid-June to
early July, and expects to incorporate mono-bore drilling with increased frack
stages to improve productivity and reserves recoveries while maintaining
similar well costs as recent drilling. The capital spending also includes
legacy horizontal well optimization, operating capital, normal course
abandonment and reclamations costs as well as seismic and land acquisition
expenditures.

Marquee’s latest well results were press released on May 23, 2017 and the
wells continue to perform above expected rates. The wells demonstrate strong
economics at current commodity prices and provide high rates of return and
cash netbacks.

THE CREDIT FACILITY

Marquee’s Credit Facility is a $12 million revolving, operating demand
facility with a major Canadian bank, with the next interim review scheduled
for October 31, 2017 and replaces the Company’s previous syndicated credit
facility of $25 million. Following the closing of the financing, Marquee will
have a positive cash balance of approximately $7.5 million and be undrawn on
its Credit Facility.

STRATEGIC RATIONALE

“Marquee is pleased to have a new strategic partner in Crown Capital who is
supportive of unlocking the value of our Michichi asset in eastern Alberta”,
said Richard Thompson, president and CEO of Marquee.

The Credit Facility and Term Loan significantly improve Marquee’s liquidity
and allow for acceleration of the large scale light oil development
opportunity at Michichi. The enhanced liquidity will support an accelerated
drilling program following up on the success of the first quarter drilling
program.

Marquee owns and operates oil and gas facilities and extensive gas gathering
system infrastructure at Michichi and has identified over 290 development
drilling locations which include 88 undrilled locations booked in Marquee’s
2016 year end reserve report. These locations have been identified utilizing
extensive horizontal and vertical well control in combination with Marquee’s
large 2D and 3D seismic coverage at Michichi

ANNUAL AND SPECIAL MEETING OF SHAREHOLDERS

The Company’s Annual and Special Meeting of Shareholders (the “Meeting”) is
scheduled for 2:00 PM on Monday, June 26, 2017 in the Strand/Tivoli room at
the Metropolitan Conference Centre in Calgary, Alberta. The record date for
the meeting has been set at May 23, 2017.

At the Meeting, shareholders (“Shareholders”) of Marquee’s common shares
(“Common Shares”) will be asked to approve a special resolution (the
“Consolidation Resolution”) authorizing the Company to amend its Articles to
effect a consolidation (the “Consolidation”) of the Common Shares on the basis
of one (1) post-consolidation Common Share for every thirty (30)
pre-consolidation Common Shares then issued and outstanding, or such other
number of pre-consolidation Common Shares as may be determined by the Board in
its sole discretion, subject to the requirements of the TSX Venture Exchange.
As of the date hereof, the Company has 435,772,196 Common Shares outstanding.
Notwithstanding approval of the proposed Consolidation by the Shareholders,
the Board may, in its sole discretion, revoke the Consolidation Resolution,
and abandon the Consolidation without further approval or action by, or prior
notice to, the Shareholders.

The Company believes that, if implemented, the Consolidation will help attract
a new investor base and potentially increase liquidity. The Board believes
that the Consolidation is in the best interest of the Company, and that the
Consolidation will more closely align the issued and outstanding share capital
of the Company with its financial valuation.

If approved and implemented, the Consolidation will occur simultaneously for
all of the Company’s issued and outstanding Common Shares and the
consolidation ratio will be same for all such Common Shares. The Consolidation
will affect all holders of Common Shares uniformly and will not affect any
Shareholder’s percentage ownership interest in the Company, except to the
extent that the Consolidation would otherwise result in a Shareholder owning a
fractional Common Share. No fractional post-consolidation Common Shares will
be issued and no cash will be paid in lieu of fractional post-consolidation
Common Shares. Any fractional Common Shares resulting from the Consolidation
will be rounded to the nearest whole Common Share.

ABOUT MARQUEE

Marquee is a Calgary based, junior energy company focused on light oil
development and production in the Michichi area of eastern Alberta. Marquee’s
shares trade on the TSX Venture Exchange under the trading symbol “MQX”.
Additional information about Marquee may be found on its website
www.marquee-energy.com and in its continuous disclosure documents filed with
Canadian securities regulators on the System for Electronic Document Analysis
and Retrieval (SEDAR) at www.sedar.com.

Neither TSX Venture Exchange nor its Regulation Services Provider (as that
term is defined in policies of the TSX Venture Exchange) accepts
responsibility for the adequacy or accuracy of this release.

FORWARD-LOOKING STATEMENTS OR INFORMATION

Certain statements included or incorporated by reference in this news release
may constitute forward-looking statements under applicable securities
legislation. Such forward-looking statements or information typically contain
statements with words such as “anticipate”, “believe”, “expect”, “plan”,
“intend”, “estimate”, “propose”, or similar words suggesting future outcomes
or statements regarding an outlook. Forward-looking statements or information
in this news release may include, but are not limited to: reserves estimates
and the net present value of the future net reserves related thereto; the
number and quality of future potential drilling and development opportunities;
anticipated capital budgets and expenditures; average production for 2017 and
beyond; 2017 exit production rates; the Company’s development plan; the size
and extent of the Michichi oil fairway; matters to be voted on at the
Company’s annual and special meeting of shareholders, a consolidation of the
Company’s shares, and the benefits to be derived therefrom; and the timing of
disclosure of further 2017 guidance, capital expenditure plans and well
performance.

Such forward-looking statements or information are based on a number of
assumptions all or any of which may prove to be incorrect. In addition to any
other assumptions identified in this document, assumptions have been made
regarding, among other things: the ability of the Company to obtain equipment,
services and supplies in a timely manner to carry out its activities; the
ability of the Company to market crude oil, natural gas liquids and natural
gas successfully to current and new customers; the ability to secure adequate
product transportation; the timely receipt of required regulatory approvals;
the ability of the Company to obtain financing on acceptable terms; interest
rates; regulatory framework regarding taxes, royalties and environmental
matters; future crude oil, natural gas liquids and natural gas prices; the
ability to successfully integrate acquisitions into Marquee’s business and
management’s expectations relating to the timing and results of development
activities.

Forward-looking information is based on current expectations, estimates and
projections that involve a number of risks and uncertainties which could cause
actual results to differ materially from those anticipated by the Company and
described in the forward-looking information. Material risk factors affecting
the Company and its business are contained in Marquee’s Annual Information
Form for the year ended December 31, 2016, which is available under Marquee’s
issuer profile on SEDAR at www.sedar.com.

The forward-looking information contained in this press release is made as of
the date hereof and the Company undertakes no obligation to update publicly or
revise any forward-looking information, whether as a result of new
information, future events or otherwise, unless required by applicable
securities laws. The forward -looking information contained in this press
release is expressly qualified by this cautionary statement.

DRILLING LOCATIONS

This press release discloses drilling locations in three categories: (i)
proved locations; (ii) probable locations; and (iii) unbooked locations.
Proved locations and probable locations are derived from the Company’s most
recent independent reserves report prepared by Sproule as at December 31, 2016
and account for drilling locations that have associated proved and/or probable
reserves, as applicable. Unbooked locations are internal estimates based on
the Company’s prospective acreage and assumptions as to the number of wells
that can be drilled per section based on industry practice and internal
review. Unbooked locations do not have attributed reserves. Of the 290
Michichi drilling locations identified herein, 69 are proved locations, 19 are
probable locations, and the remaining 234 are unbooked locations. Unbooked
locations have been identified by management as an estimation of our
multi-year drilling activities based on evaluation of applicable geologic,
seismic, engineering, production and reserves information. There is no
certainty that the Company will drill all unbooked drilling locations and if
drilled there is no certainty that such locations will result in additional
oil and gas reserves or production. The drilling locations on which the
Company will actually drill wells will ultimately depend upon the availability
of capital, regulatory approvals, seasonal restrictions, oil and natural gas
prices, costs, actual drilling results, additional reservoir information that
is obtained and other factors. While certain of the unbooked drilling
locations have been de-risked by drilling existing wells in relative close
proximity to such unbooked drilling locations, other unbooked drilling
locations are farther away from existing wells where management has less
information about the characteristics of the reservoir and therefore there is
more uncertainty whether wells will be drilled in such locations and if
drilled there is more uncertainty that such wells will result in additional
oil and gas reserves or production.

ADDITIONAL ADVISORIES

Barrels of oil equivalent (boe) are presented on the basis of one boe for six
Mcf of natural gas. Disclosure provided herein in respect of boe may be
misleading, particularly if used in isolation. A boe conversion ratio of 6
Mcf: 1 bbl is based on an energy equivalency conversion method primarily
applicable at the burner tip and does not represent a value equivalency at the
wellhead. Given that the value ratio based on the current price of crude oil
as compared to natural gas is significantly different from the energy
equivalency of 6:1, utilizing a conversion on a 6:1 basis may be misleading as
an indication of value.

NOT FOR DISTRIBUTION TO U.S. NEWS SERVICES OR FOR DISSEMINATION IN THE UNITED
STATES

– END RELEASE – 30/05/2017

For further information:

FOR ADDITIONAL INFORMATION PLEASE CONTACT:

Richard Thompson
President & Chief Executive Officer
(403) 817-5561
[email protected]

or visit the Company’s website at www.marquee-energy.com.

COMPANY:
FOR: MARQUEE ENERGY LTD.
TSX VENTURE Symbol: MQX

INDUSTRY: Energy and Utilities – Oil and Gas
RELEASE ID: 20170530CC020

Press Release from Marketwired 1-866-736-3779

All press releases are written by the client and have NO affiliation with the news copy written by The Canadian Press. Any questions that arise due to the content or information provided in the press release should be directed to the company/organization
issuing the release, not to The Canadian Press.

GET ENERGYNOW’S DAILY EMAIL FOR FREE


Going public: A look at some of the biggest Canadian IPOs by value since 2000

TORONTO — Rarely has an IPO drawn as much political attention as Kinder Morgan’s sale of its Canadian unit, a deal designed to fund the Trans Mountain pipeline expansion. At $1.75 billion, the public market debut of Kinder Morgan Canada (TSX:KML) is on track to be the fourth most valuable in Canadian history.

Here’s a look back at some of the biggest IPOs in Canada since Manulife Financial went public for $2.49 billion in 1999. The figures, based on data provided by Thomson Reuters, include proceeds raised through over-allotments:

Sun Life Financial: $1.89 billion in 2000. Soon after Manulife’s blockbuster IPO, fellow insurer Sun Life Financial followed suit. It listed on the Toronto market in March 2000, one of a wave of so-called demutualizations by insurers in 1999 and 2000. Other insurers that went public around that time include Clarica, which Sun Life took over in 2001, and Canada Life Financial, which was purchased by Great-West Lifeco in 2003. The stock debuted below $14 and rose to more than $55 by 2007. In early trading Tuesday, it was at $44.33.

Hydro One: $1.83 billion in 2015. The Hydro One IPO, another politically charged stock offering, was part of the Ontario government’s plan to raise money to fund transit and infrastructure projects. The partial sale of the utility triggered concerns from critics who said it would result in higher electricity prices. It debuted at $21.50 and in early trading Tuesday it was at $23.38.

PrairieSky Royalty: $1.67 billion in 2014. Calgary-based energy giant Encana Corp. raised $1.67 billion in a spring 2014 IPO when it spun off 46 per cent of its PrairieSky Royalty subsidiary, which pays dividends based on its rights to oil and gas exploration areas in Alberta. After debuting on the open market at $37 in May and hitting a peak of $42.39 in July 2014, PrairieSky was trading early Tuesday at $30.21.

Athabasca Oil: $1.35 billion in 2010. Founded in 2006, the energy company is focused on the development of oil assets in northern Alberta. In 2014, Athabasca Oil completed the sale of its Dover project to PetroChina for $1.18 billion. After debuting around $15, the stock fell to $10 within six weeks. The stock has been below $2 since January, trading at $1.27 early Tuesday.

Franco-Nevada: $1.26 billion in 2007. The Toronto-based mining royalties company was taken private in 2002 and went public in 2007, raising $1.26 billion on the strength of its portfolio including Barrick Gold Corp.’s Goldstrike property and Stillwater Mining Co.’s Stillwater property. Since its debut in December 2007, Franco-Nevada’s stock has increased from around $15 to $98.65 shortly after markets opened Tuesday.

The Canadian Press

GET ENERGYNOW’S DAILY EMAIL FOR FREE


‘Mark my words:’ Alberta’s Notley says pipeline coming no matter B.C. politics

EDMONTON — Alberta Premier Rachel Notley wants everyone to mark her words: the Trans Mountain pipeline expansion will go ahead to deliver her province’s oil to the West Coast and jobs to British Columbia.

Notley says she doesn’t believe it makes much difference who is running B.C., because the federal government has already approved the Kinder Morgan (TSX:KML) project.

“The decision has been taken,” she said Tuesday when asked about the pipeline as she was announcing a new hospital for Edmonton.

“It’s been taken by the federal government. It was taken by a federal government that was committed to balancing and driving towards two goals at the same time: environmental sustainability and economic growth on behalf of the whole country.”

The premier said her NDP government will continue to advocate on behalf of all Canadians’ economic interests to get the pipeline done.

“And mark my words: that pipeline will be built. The decisions have been made … There may be debate, but at the end of the day we’re quite confident in the strength of our position.”

She said the pipeline is in the best interests of Albertans and all Canadians — but especially to British Columbians.

“Quite honestly the province of B.C. can’t grow solely on the basis of escalating housing prices in Vancouver and the Lower Mainland. They need stronger economic growth and the reality is that in Interior B.C., they need the jobs that this pipeline will provide.”

The future of the pipeline, which would nearly triple the capacity of an existing line running from Edmonton to Burnaby, is in question given a co-operation agreement between the B.C. New Democrats and Greens, which could lead to an NDP minority government. Both parties have voiced opposition to the project.

Notley said governments that care about working people put good jobs front and centre and “there, I know, we ultimately share a number of values with the emerging leadership in B.C.”

Alberta has long argued that it needs a pipeline to get more of its oil to the West Coast and from there to overseas markets.

Andrew Weaver, leader of the B.C. Greens, called Notley’s comments “classic fear-mongering.”

He said promises of pipeline jobs aren’t based in fact and pointed to a promise by the B.C. Liberals of a liquefied natural gas industry.

“The idea that somehow a pipeline in a market where it doesn’t exist is going to create jobs in British Columbia is nothing more than a myth,” Weaver said.

“We’ve heard this before — 100,000 jobs in (liquefied natural gas), $100-billion prosperity fund, $1-trillion increase in GDP, elimination of the PST, debt-free B.C. Unicorns in all our backyards.”

The Canadian Press

GET ENERGYNOW’S DAILY EMAIL FOR FREE


B.C. shakeup brings new doubts for Kinder Morgan Canada as shares fall on debut

CALGARY — British Columbia’s NDP and Greens are vowing to bring the Trans Mountain expansion to a halt should they form government, one of several promises that could have widespread ramifications on the business community that extend beyond the pipeline project.

From B.C. to Bay Street, the alliance formalized Tuesday between the two parties served as a potential foreshock to the private sector.

Kinder Morgan Canada, the proponent behind the Trans Mountain expansion, made a tepid debut on the Toronto Stock Exchange, with its shares (TSX:KML) falling 4.5 per cent to $16.24 from the $17 they were priced at in the initial public offering.

The commitments outlined in the NDP-Green pact, however, are poised to have a more long-term effect on investment in the province.

The Greens and B.C. have promised to “immediately employ every tool available” to stop the Trans Mountain expansion, refer the Site C dam construction project to the province’s utilities commission, raise the carbon tax by $5 per tonne annually beginning next year and raise minimum wage to at least $15 per hour.

Green party Leader Andrew Weaver was blunt in his rejection of future fossil fuel infrastructure in the province, saying the promised jobs from the sector haven’t happened.

“I think British Columbians, quite frankly, are sick and tired of being told that the 20th century economy is the economy of tomorrow,” Weaver told a news conference alongside B.C. NDP Leader John Horgan.

Weaver called out Alberta Premier Rachel Notley’s advocacy of Trans Mountain, saying she is mistaken when she says there’s nothing B.C. can do to stop the federally-approved project.

“There’s an awful lot that can be done in British Columbia to stop the shipping of diluted bitumen in our coastal waters,” Weaver said, pointing specifically to the rights of First Nations.

Kinder Morgan Canada didn’t immediately respond to a request for comment on Weaver’s remarks. But Ian Anderson, the president of Kinder Morgan Canada, said in a statement earlier that the $1.75 billion IPO fulfilled the company’s final requirement to proceed with the Trans Mountain expansion.

“This is an exciting day for our customers for communities and for the many individuals who are relying on this project to deliver jobs and economic benefits to their communities,” Anderson said in the statement, which didn’t acknowledge the political challenges that could be ahead.

But others like Stewart Muir, executive director of Resource Works, a B.C. group that advocates for resource development, have raised concerns about the project’s fate.

“If this proves to be a lasting union, then it’s obvious that the Greens would pursue their anti-fossil fuel agenda,” said Muir.

He said the province could delay or deny road access and other permits needed for the project.

“Small potatoes really, but a potential pebble in the shoe of the project,” said Muir.

Hilary Novik, an analyst at political risk consultancy the Eurasia Group, said the province could also join legal challenges, while there’s also the risk that the position held by a B.C. minority NDP government could enable more protests.

“A risk we’re watching is just how an antagonistic government could increase the level of civil disobedience against the project, and that could be a real risk to construction and threaten more delays for Kinder Morgan,” said Novik.

“It’s really going to test Kinder Morgan’s resolve to move forward with the project against the heightened risk of delays.”

Both Prime Minister Justin Trudeau and Notley came out in defence of the project, with Trudeau emphasizing that the project is in the national interest while Notley reminded B.C. of the jobs it will provide.

B.C. Chamber of Commerce president Val Litwin said part of his job going forward will be reminding the NDP-Green alliance of the Interior’s perspective.

“Our job would be to remind that alliance that there’s a whole lot of province outside of the 604 (area code), there’s this whole other side of the equation that’s the 250, that mostly voted in the other side of the aisle,” said Litwin.

Desjardins Capital Markets analyst Kristopher Zack said in a note that the deal between the Greens and NDP presents another element of uncertainty for Canada’s oil and gas industry.

He said the general tone of the two parties is less business-friendly than with the Liberals, though he sees pipelines as under greater threat than shale gas development.

Construction of the Trans Mountain expansion is expected to begin in September, Kinder Morgan Canada said. The project would triple the capacity of a 1,150-kilometre pipeline than runs from Edmonton to Burnaby, B.C.

Ian Bickis, The Canadian Press

GET ENERGYNOW’S DAILY EMAIL FOR FREE


CORRECTION – Wow Unlimited Media Announces Financial Results for the First Quarter of 2017 and Ticker Symbol Change to WOW Effective June 1, 2017

FOR: WOW! UNLIMITED MEDIA INC.
TSX VENTURE Symbol: RNK.A
TSX VENTURE Symbol: RNK.B

Date issue: May 30, 2017
Time in: 4:58 PM e

Attention:

VANCOUVER, BC –(Marketwired – May 30, 2017) – Wow Unlimited Media Inc.
(formerly Rainmaker Entertainment Inc.) (“Wow” or the “Company”) (TSX VENTURE:
RNK.A) (TSX VENTURE: RNK.B) has refiled its financial statements and
management’s discussion & analysis for the period ended March 31, 2017 to
correct a clerical error with respect to the loss per share figures included
therein. The Company is pleased to announce its results for the quarter ended
March 31, 2017. The first quarter results incorporate a full quarter of the
operations of Frederator Networks following the acquisition of Frederator
Networks in December 2016.

/T/

For the three months ended
March 31, March 31,
$000’s, except per share amounts 2017 2016
—————————————————————————-
Revenue $ 5,867 $ 4,545
Operating EBITDA (795) 33
Operating loss (1,184) (555)
—————————————————————————-
Net loss $ (1,184) $ (9,961)
Net loss per share
– basic and diluted $ (0.05) $ (5.68)
—————————————————————————-
Weighted average number of shares outstanding
– basic and diluted 25,581,577 1,754,018
—————————————————————————-

/T/

(1) See section “Non-GAAP Financial Measures” in this earnings release.
(2) All earnings per share data for comparative periods have been adjusted to
reflect a 10:1 share consolidation completed during the year-ended December
31, 2016

FINANCIAL HIGLIGHTS

The Company reported the following highlights from three months ended March
31, 2017:

/T/

— First quarter revenue earned was $5.9 million. This included $1.6

million generated by Channel Frederator Network, which grew by an
average of 155 million views a month during the first quarter of 2017.

/T/

/T/

— Work commenced on two new work-for-hire productions during the quarter,

which total approximately $24 million in contract revenue.

/T/

Michael Hirsh, Chairman and CEO, commented: “Wow has started off with strong
momentum in its first quarter as a combined company. The Company signed on
several new projects with marquee clients such as Netflix, Amazon and Mattel,
resulting in a current production pipeline of over $50 million. In addition,
our digital network recorded substantial growth in monthly viewership of over
32% quarter over quarter.”

OPERATIONAL UPDATE

Channel Frederator Network continues to grow, with 44 channels added to the
network in April 2017, for a total of 270 channels added between January 2017
and April 2017. This brings the network channel partner count even closer to
the 3,000 channel partner threshold. By April 30, 2017, Channel Frederator
Network attracted a total of 2.4 billion views from January to April, with 695
million views in April alone, and by April 30, 2017 there were 43 million
subscribers.

Animation productions continue to form a steady part of Wow’s business. The
two new productions added to the slate during the quarter strengthen the
production services pipeline.

CHANGE OF TICKER SYMBOL

The Company is pleased to announce that the Company’s Common Voting Shares and
Variable Voting Shares will begin trading under the new stock ticker symbols
“WOW.A” and “WOW.B”, respectively, on the TSX Venture Exchange (“TSXV”),
effective at the opening of trading on June 1, 2017. This change in the stock
ticker symbols for the Common Voting Shares and Variable Voting Shares does
not require any action by current shareholders as the Company’s CUSIP numbers
for these shares will remain unchanged.

CONSOLIDATED RESULTS FOR THE QUARTER

Selected financial information for the three months ended March 31, 2017 and
2016 is as follows:

/T/

For the three months ended
March 31, March 31,
$000’s 2017 2016
—————————————————————————-
Revenue $ 5,867 $ 4,545

Operating EBITDA (795) 33
Net finance costs 88 494
Depreciation and amortization1 121 144
Share based payments 180 –
Service credits – (50)
—————————————————————————-
Operating loss (1,184) (555)
—————————————————————————-
Items affecting comparability:
Impairments – 567
Share of loss of Ratchet Productions, LLC – 8,839
—————————————————————————-
– 9,406
—————————————————————————-
Net loss $ (1,184) $ (9,961)
—————————————————————————-
Items affecting comparability:
Foreign operations – foreign currency
transation differences 9 416
—————————————————————————-
Total comprehensive loss $ (1,193) $ (10,377)
—————————————————————————-

/T/

(1) Excludes amortization of investment in film and television properties

Revenue & Operating EBITDA

Revenue increased by 31% by $1.4 million, for total revenue earned of $5.9
million. The increase was driven by:

/T/

— The addition of revenue generated by Channel Frederator Network;
— The commencement of two new productions during the quarter; offset by
— Comparatively lower work-for-hire production levels, as the new

productions take time reach full production levels.

/T/

The production of the Company’s own IP, Reboot, was underway at Mainframe
Studios utilizing capacity, the benefit of which is expected to be recognised
as revenue in the second half of 2017.

The $0.8 million reduction in operating EBITDA compared to the first quarter
of 2016 is largely result of an increase in general and administration
expenses of the combined operations and higher operating expenses relative to
revenue generated largely due to the timing of studio production schedules.

Net finance costs

The decrease in other expenses of $0.4 million is largely due to the decrease
in interest expense on convertible debentures of $0.4 million quarter over
quarter. The convertible debentures were settled as part of the Company’s
corporate reorganization and acquisitions that were completed in December
2016.

Depreciation and amortization

The reduced depreciation charge is as a result of amounts capitalized during
the first three months of 2017 for assets used during the production of the
one of the Company’s owned IP, ReBoot.

Share based payments

Shared based payments for the three months ended March 31, 2017 was $0.2
million compared to $nil in the same period for 2016. On April 20, 2017 the
Company’s board of directors approved the issuance of incentive stock options
to key members of management and personnel. Although the options were granted
and issued subsequent to March 31, 2017, vesting began during the first
quarter. Their issuance remains subject to TSXV approval.

Impairments and Share of loss in Ratchet Productions, LLC – Ratchet & Clank

During the Company’s previous fiscal year, as previously disclosed, the
Company impaired its investment in Ratchet Productions, LLC (“RPLLC”) ($8.8
million) and an amount of $0.6 million owing to Wow by RPLLC which was not
recoverable.

NON-GAAP FINANCIAL MEASURES

The Company reports using certain supplemental indicators of the Company’s
financial and operating performance in addition to results reported in
accordance with International Financial Reporting Standards (“GAAP”). These
measures are referred to as non-GAAP measures, and include operating earnings,
operating earnings per share and operating EBITDA. The Company believes these
supplemental financial measures reflect the Company’s ongoing business in a
manner that allows for meaningful period-to-period comparisons and analysis of
trends in its business.

The Company defines operating earnings as net profit or loss excluding the
impact of specified items affecting comparability, including, where
applicable, share of loss of equity accounted investees, other non-operational
income and expenses, deferred taxes and other gains or losses. The use of the
term “non-operational income and expenses” is defined by the Company as those
that do not impact operating decisions taken by the Company’s management and
is based upon the way the Company’s management evaluates the performance of
the Company’s business for use in the Company’s internal management reports.
Operating earnings per share is calculated using diluted weighted average
shares outstanding and does not represent actual earnings per share
attributable to shareholders. The Company believes that the disclosure of
operating earnings and operating earnings per share allows investors to
evaluate the operational and financial performance of the Company’s ongoing
business using the same evaluation measures that management uses, and is
therefore a useful indicator of the Company’s performance or expected
performance of recurring operations.

The Company defines operating EBITDA as earnings before interest, taxes,
depreciation and amortization (excluding amortization of investments in film
and television properties), adjusted for certain items affecting comparability
as specified in the calculation of operating earnings. The Company discloses
operating EBITDA to capture the profitability of its business before the
impact of items not considered in management’s evaluation of operating
performance. Unless otherwise stated, the Company includes the amortization of
investments in film and television in the calculation of EBITDA.

Operating earnings, operating earnings per share and operating EBITDA do not
have any standardized meaning prescribed by GAAP and therefore may not be
comparable to similar measures presented by other companies. The Company
cautions readers to consider these non-GAAP financial measures in addition to,
and not as an alternative for, measures calculated in accordance with GAAP.

Forward-looking Statements

This news release contains certain forward-looking statements and
forward-looking information (collectively referred to herein as
“forward-looking statements”) within the meaning of applicable Canadian
securities laws. All statements other than statements of present or historical
fact are forward-looking statements. Forward-looking statements are often, but
not always, identified by the use of words such as “anticipate”, “achieve”,
“could”, “believe”, “plan”, “intend”, “objective”, “continuous”, “ongoing”,
“estimate”, “outlook”, “expect”, “may”, “will”, “project”, “should” or similar
words, including negatives thereof, suggesting future outcomes.

In particular, this news release contains forward-looking statements relating
to, among other things: (i) general economic conditions; (ii) future revenues
to be received by Wow; (iii) Wow’s future business prospects and
opportunities; and (iv) Wow’s ability to complete any or all of its proposed
production work.

Management of the Company believes the expectations reflected in such
forward-looking statements are reasonable as of the date hereof but no
assurance can be given that these expectations will prove to be correct and
such forward-looking statements should not be unduly relied upon. Various
material factors and assumptions are typically applied in drawing conclusions
or making the forecasts or projections set out in forward-looking statements.
Those material factors and assumptions are based on information currently
available to the Company, including data from publicly available governmental
sources as well as from market research and industry analysis and on
assumptions based on data and knowledge of this industry which the Corporation
believes to be reasonable. However, although generally indicative of relative
market positions, market shares and performance characteristics, such data is
inherently imprecise.

Forward-looking statements are not a guarantee of future performance and are
subject to and involve a number of known and unknown risks and uncertainties,
many of which are beyond the control of the Company, which may cause the
Company’s actual performance and results to differ materially from any
projections of future performance or results expressed or implied by such
forward-looking statements. These risks and uncertainties include, but are not
limited to, the risks identified in the Company’s management’s discussion &
analysis dated April 25, 2017 and the Company’s management information
circular dated November 14, 2016 both of which have been filed with the
Canadian Securities Administrators and available on www.sedar.com. Any
forward-looking statements are made as of the date hereof and, except as
required by law, the Company assumes no obligation to publicly update or
revise such statements to reflect new information, subsequent or otherwise.

Neither TSX Venture Exchange nor its Regulation Services Provider (as that
term is defined in the policies of the TSX Venture Exchange) accepts
responsibility for the adequacy or accuracy of this release.

About Wow Unlimited Media Inc.

Wow Unlimited Media Inc., (formerly Rainmaker Entertainment Inc.), is creating
a leading next-generation kids and youth animation business by focusing on
digital platforms and content. The company’s key assets include: the world’s
No. 1 digital animation network, Frederator Networks, which consists of an
animation production company Frederator Studios, as well as VOD channels on
digital platforms; the world’s first Hispanic animation network, Atomo
Network, a joint venture with Anima Estudios; and one of Canada’s largest,
multifaceted animation production studios, Rainmaker Entertainment, which
consists of Mainframe Studios that produces CGI animated television series,
and Rainmaker Studios that produces long-form animated features.

– END RELEASE – 30/05/2017

For further information:

Further information available at:
Website: www.wowunlimited.co
Contact: Lowell Hall
Tel: (416) 887-1636
Email: [email protected]

COMPANY:
FOR: WOW! UNLIMITED MEDIA INC.
TSX VENTURE Symbol: RNK.A
TSX VENTURE Symbol: RNK.B

INDUSTRY: Media and Entertainment – Movies/Music Videos
RELEASE ID: 20170530CC017

Press Release from Marketwired 1-866-736-3779

All press releases are written by the client and have NO affiliation with the news copy written by The Canadian Press. Any questions that arise due to the content or information provided in the press release should be directed to the company/organization
issuing the release, not to The Canadian Press.

GET ENERGYNOW’S DAILY EMAIL FOR FREE


Marksmen Announces Consolidated Financial Results for the Quarter Ended March 31, 2017

FOR: MARKSMEN ENERGY INC.
TSX VENTURE SYMBOL: MAH
OTCQB SYMBOL: MKSEF

Date issue: May 30, 2017
Time in: 4:25 PM e

Attention:

CALGARY, ALBERTA–(Marketwired – May 30, 2017) – Marksmen Energy Inc.
(“Marksmen” or the “Company”) (TSX VENTURE:MAH)(OTCQB:MKSEF) and its wholly
owned subsidiary Marksmen Energy USA, Inc. announces financial results for the
interim period ended March 31, 2017. The following documents have been filed on
SEDAR:

/T/

— Financial Statements
— Management’s Discussion and Analysis (“MD&A”)
— Form 52-109FV2 Certificate of Interim Filings – CEO

/T/

These filings may be viewed on the SEDAR website at www.sedar.com.

Highlights for quarter ended March 31, 2017 and 2016

Selected financial and operational information for the first quarter of 2017
are set out below and should be read in conjunction with Marksmen’s financial
statements, and the related MD&A.

/T/

Q1 Q1
Production 2017 2016 Change % Change
—————————————————————————-
Oil production – bbls 5,468 1,029 4,439 431%
Production per day – bbls 61 11 49 433%

/T/

Production increased by over four times in the first quarter of 2017 compared
to the first quarter of 2016, primarily due to the successful well,
Davis-Holbrook #1 drilled in July of 2016.

Net Loss and Comprehensive Loss before Tax – improved significantly to
$(17,861) in the first quarter of 2017 compared to a loss of $(502,713) in the
first quarter of 2016, an improvement of $484,852. (see financial statements).

The calculation below of “net petroleum income” does not have any standardized
meaning under IFRS and may not be directly comparable to similar measures
presented by other companies. However, Marksmen and other oil and gas companies
consider this measurement to be a valuable measurement of operational
performance. Net petroleum income is calculated by deducting royalties and
production expenses from revenue.

/T/

Q1 Q1
Net Petroleum Income 2017 2016 Change % Change
—————————————————————————-
Revenue $ 366,804 $ 45,209 $ 321,595 711%
Royalties $ (47,835) $ (5,920) $ (41,915) 708%
Production expenses $ (29,363) $ (30,975) $ 1,612 -5%
———————————————-
Net petroleum income $ 289,606 $ 8,314 $ 281,292 3383%
Net petroleum income per bbl
of Oil $ 53 $ 8 $ 44.9 556%

/T/

Revenue, less royalties, and production expenses has resulted in a significant
improvement of the net petroleum income of approximately thirty-five times in
the first quarter of 2017 compared to the same period in 2016.

Cash – increased over two and a half times to $335,667 in the first quarter of
2017 compared to $116,806 in the same period of 2016.

Cash-flow provided by operating activities – is positive in the first quarter
of 2017 at $127,868 and is approximately five times the negative cash-flow of
$(503,621) in the first quarter of 2016.

Other Costs – general and administrative expenses were similar in quarter over
quarter comparisons at approximately $124,000. Depletion, a non-cash expense,
increased proportionally with production from $33,497 in the first quarter of
2016 to $133,911 in the first quarter of 2017.

Common Shares issued and outstanding – there are 80,550,432 common shares
outstanding as of March 31, 2017 compared to 63,593,152 common shares
outstanding at March 31, 2016.

Outlook

In June of 2016 the Company drilled the Davis-Holbrook #1 well and it was put
on production in mid-July. It has contributed significantly to the revenue of
the Company in the second half of 2016. The total production from this well to
December 31, 2016 is 13,223 barrels of oil or 9,917 barrels net to Marksmen. As
of the end of March 2017 the well has produced a total of 19,335 barrels of oil
or 14,501 barrels net to Marksmen.

In February of 2017, the well at Delong-Davis #1 was deepened by approximately
20 feet to expose more of the producing zone. The total production from this
well in the first quarter was 1,473 barrels of oil gross or 663 net barrels to
Marksmen.

Marksmen is currently evaluating offset drilling opportunities on its current
land position. The Company is also evaluating other land, 3D seismic and
drilling opportunities in Ohio.

Neither the TSX Venture Exchange nor its Regulation Services Provider (as that
term is defined in the policies of the TSX Venture Exchange) accepts
responsibility for the adequacy or accuracy of this news release.

This news release may contain certain forward-looking information and
statements including drilling and other opportunities available to Marksmen.
All statements included herein, other than statements of historical fact, are
forward-looking information and such information involves various risks and
uncertainties. There can be no assurance that such information will prove to be
accurate, and actual results and future events could differ materially from
those anticipated in such information. A description of assumptions used to
develop such forward-looking information and a description of risk factors that
may cause actual results to differ materially from forward-looking information
can be found in Marksmen’s disclosure documents on the SEDAR website at
www.sedar.com. Marksmen does not undertake to update any forward-looking
information except in accordance with applicable securities laws.

– END RELEASE – 30/05/2017

For further information:
Marksmen Energy Inc.
Archie Nesbitt
CEO and President
(403) 265-7270
[email protected]

COMPANY:
FOR: MARKSMEN ENERGY INC.
TSX VENTURE SYMBOL: MAH
OTCQB SYMBOL: MKSEF

INDUSTRY: Energy and Utilities – Oil and Gas
RELEASE ID: 20170530CC0109

Press Release from Marketwired 1-866-736-3779

All press releases are written by the client and have NO affiliation with the news copy written by The Canadian Press. Any questions that arise due to the content or information provided in the press release should be directed to the company/organization
issuing the release, not to The Canadian Press.

GET ENERGYNOW’S DAILY EMAIL FOR FREE


BTL Group Files Q1 2017 Financials

FOR: BTL GROUP LTD.TSX VENTURE SYMBOL: BTLDate issue: May 30, 2017Time in: 4:14 PM eAttention:
VANCOUVER, BRITISH COLUMBIA and LONDON, UNITED KINGDOM–(Marketwired – May 30,
2017) – BTL GROUP LTD. (TSX VENTURE:BTL) (“BTL” or the “Company”) announces

GET ENERGYNOW’S DAILY EMAIL FOR FREE


Trudeau stands by Kinder Morgan despite changing politics in B.C.

ROME — Prime Minister Justin Trudeau is standing by the Kinder Morgan pipeline project, even as the New Democrats and Greens in B.C. are teaming up to fight it.

“The decision we took on the Trans Mountain pipeline was based on facts and evidence on what is in the best interests of Canadians and indeed, all of Canada,” Trudeau said Tuesday in Rome at a joint news conference with Italian Prime Minister Paolo Gentiloni.

“Regardless of the change in government in British Columbia or anywhere, the facts and evidence do not change.”

The Liberal government understands that growing a strong economy requires taking leadership on both the environment and the economy, he added.

“That is what drives us in the choices we make. We stand by those choices.”

Trudeau’s comments followed Monday’s news that B.C.’s anti-pipeline Green party and the provincial NDP have come to an agreement that could see the formation of a minority NDP government in the province, casting doubt on the project’s future.

Both parties have voiced their opposition to the Trans Mountain expansion, which would nearly triple the capacity of the pipeline that runs from Edmonton to Burnaby, B.C.

For Alberta Premier Rachel Notley, the pipeline stand of the West Coast New Democrats threatens a project that she says is vital both to her province and the national economy. No province can veto the line, she said in a statement.

“It’s important to note that provinces do not have the right to unilaterally stop projects such as Trans Mountain that have earned the federal government’s approval,” Notley said.

“This is a foundational principle that binds our country together. There are no legal tools available to provinces to stand in the way of infrastructure projects that benefit all Canadians.”

Kinder Morgan went ahead Tuesday with its initial public offering for the expansion. Shortly after the opening bell, shares (TSX:KML) traded at $15.77, down 7.24 per cent from the $17 they were priced at in their initial public offering. The first trade was for $16.25.

Trudeau also praised the benefits that international trade can bring to a world where people are anxious about the future, holding up the trade deal between Canada and the European Union as an example of creating new jobs and ensure more people can benefit from economic growth.

“We are proud of it, and you should be, too,” he told 45 parliamentarians and other dignitaries in the Sala della Regina, or the Queen’s Room, a majestic committee room at the Chamber of Deputies in the Italian Parliament.

“It will create the kind of growth that benefits all our citizens, not just our wealthiest.”

The trade agreement, known as CETA, is now being considered by the Senate.

Trudeau thanked the Italian parliamentarians who supported the deal, and said it would not have been possible without the support of “like-minded” leaders like Gentiloni.

International Trade Minister Francois-Philippe Champagne said the Liberal government hopes to bring other countries onside with trade by promoting it alongside Canadian values.

“There’s enormous interest for what Canada stands for,” he said. “The progressive and inclusive trade agenda is what, obviously, is the highlight, but we’re really building the bridges.”

Champagne also said Trudeau had given him the job of making trade “real” for people, by highlighting the tangible benefits for consumers.

“The best way to convince those who may not yet be convinced is to show them the real benefits.”

Trudeau is in Italy to promote trade and cultural ties between the two countries at the end of a trip to Europe that included the NATO meeting in Brussels, the G7 summit in Sicily and a private audience with Pope Francis at the Vatican.

The coded language about working together and sharing values follows U.S. President Donald Trump’s refusal to support the G7 consensus among the other six leaders, including Trudeau, to commit to the Paris agreement on climate change.

Trudeau was asked whether he shares the views expressed recently by campaigning German Chancellor Angela Merkel, who has said it is time to think about whether Europe can rely on the U.S. and other longtime allies.

Trudeau stepped gingerly with his response.

“We will always work together and highlight the shared values that are equally important on both sides of the Atlantic, including in the United States,” Trudeau said.

“The way we can work on that together, where we have discussions, where we agree, is going to continue to be based in openness, frankness, robust exchanges, and in the conviction — with regards to climate change particularly — that the only way to move forward is to protect the environment while creating the jobs that we need for today and tomorrow.”

On Tuesday, Trudeau was introduced with glowing remarks by Laura Boldrini, president of the Chamber of Deputies, noting his efforts at fighting climate change. “The biggest challenges can’t be tackled alone,” she said in Italian.

Pietro Grasso, president of the Senate, expressed concern over the “isolationism and protectionist sentiment” that was heard at the G7 summit.

Trudeau addressed the anxiety that people around the world are facing as “the twin forces of technology and globalization” change everything, and quickly. Those same forces can be harnessed to develop solutions to problems like climate change, he noted.

“Leaders who think we can hide from these changes, or turn back the clock, are wrong,” he said. “It’s our responsibility to harness these changes and make them work for people.”

Joanna Smith, The Canadian Press


GET ENERGYNOW’S DAILY EMAIL FOR FREE


Birchcliff Energy Ltd. Announces Declaration of Common Share Quarterly Dividend and Preferred Share Dividends

FOR: BIRCHCLIFF ENERGY LTD.TSX SYMBOL: BIRDate issue: May 30, 2017Time in: 2:56 PM eAttention:
CALGARY, ALBERTA–(Marketwired – May 30, 2017) – Birchcliff Energy Ltd.
(“Birchcliff”) (TSX:BIR) is pleased to announce that its board of directors has
decl…

GET ENERGYNOW’S DAILY EMAIL FOR FREE


Trans Mountain IPO to proceed despite B.C. Green-NDP deal, Kinder Morgan says

CALGARY — Kinder Morgan says it expects to proceed Tuesday with its initial public offering for the Trans Mountain expansion, just as the anti-pipeline Greens and NDP in B.C. announced they have come to an agreement that could cast the project’s future into doubt.

Dave Conover, a spokesman for the Houston-based energy company, said in an email that the share listing will go ahead on the Toronto Stock Exchange.

Conover’s confirmation came shortly after the leaders of the B.C. Greens and NDP said they came to a deal that could see the formation of a minority NDP government in the province.

Both parties have voiced their opposition to the Trans Mountain expansion, which would see the capacity of a pipeline running from Edmonton to Burnaby, B.C., nearly triple its capacity to 890,000 barrels of oil per day.

In a press conference Monday, Green Party Leader Andrew Weaver said he’s been heavily invested in the Kinder Morgan pipeline issue, and that it was an important part of negotiating terms with the NDP that will be released tomorrow.

“This issue of Kinder Morgan was one that was critical to us and I think you’ll see that reflected in tomorrow’s announcement,” said Weaver.

The IPO is intended to raise $1.75 billion to help fund the $7.4-billion Trans Mountain expansion.

Kinder Morgan has put up 102.9 million shares on offer at $17 each — down from $19 to $21 it had initially sought — which will leave it with control of about 70 per cent of the Canadian entity.

The offering would be the largest on the Toronto Stock Exchange since Hydro One’s $1.83-billion listing in 2015, with only insurers Sun Life Financial and Manulife Financial having bigger debuts.

The listing, set to trade under the symbol KML, comes as opponents ramped up their campaign against the Trans Mountain expansion Monday.

The Tsleil-Waututh Nation sent out warnings to potential investors about the legal risks the project faces, while Stand.earth challenged the accuracy of the IPO documents and the Wilderness Committee launched a website to track construction of and protests against the pipeline.

Greenpeace, which earlier made its own challenge of Kinder Morgan’s IPO filing, said in a statement Monday that the B.C. Green-NDP co-operation is an unprecedented opportunity to stop Kinder Morgan’s expansion project. 


Ian Bickis, The Canadian Press

GET ENERGYNOW’S DAILY EMAIL FOR FREE


Enercare Partners with Bethlehem Housing and Support Services in Niagara to Provide Families in Need with a Fresh Start

FOR: ENERCARE INC.TSX Symbol: ECIDate issue: May 30, 2017Time in: 10:00 AM eAttention:
The Enercare Fresh Start Program provides basic living necessities and
small luxuries to families and individuals transitioning from shelters to
more permanent livi…

GET ENERGYNOW’S DAILY EMAIL FOR FREE


CaiTerra International Energy Corporation: Q2 Interim Financial Statements Filed

FOR: CAITERRA INTERNATIONAL ENERGY CORPORATION
TSX VENTURE SYMBOL: CTI

Date issue: May 30, 2017
Time in: 9:46 AM e

Attention:

CALGARY, ALBERTA–(Marketwired – May 30, 2017) – CaiTerra International Energy
Corporation (TSX VENTURE:CTI) (the “Company”) is pleased to report that it has
filed with Canadian securities regulatory authorities its interim financial
statements for the quarter ended March 31, 2017. The interim financial
statements along with the related management discussion and analysis (MD&A) may
be viewed on the Company’s profile at www.sedar.com.

Neither the TSX Venture Exchange nor its Regulation Services Provider (as that
term is defined in the policies of the TSX Venture Exchange) accepts
responsibility for the adequacy or accuracy of this release.

– END RELEASE – 30/05/2017

For further information:
CaiTerra International Energy Corporation
Songning Shen
Chief Executive Officer
(403) 875-2129
OR
CaiTerra International Energy Corporation
Perla Woo
President
(403) 827-6328

COMPANY:
FOR: CAITERRA INTERNATIONAL ENERGY CORPORATION
TSX VENTURE SYMBOL: CTI

INDUSTRY: Energy and Utilities – Oil and Gas
RELEASE ID: 20170530CC0070

Press Release from Marketwired 1-866-736-3779

All press releases are written by the client and have NO affiliation with the news copy written by The Canadian Press. Any questions that arise due to the content or information provided in the press release should be directed to the company/organization
issuing the release, not to The Canadian Press.

GET ENERGYNOW’S DAILY EMAIL FOR FREE


Wow Unlimited Media Announces Financial Results for the First Quarter of 2017 and Ticker Symbol Change to Wow Effective June 1, 2017

FOR: WOW! UNLIMITED MEDIA INC.
TSX VENTURE Symbol: RNK.A
TSX VENTURE Symbol: RNK.B

Date issue: May 30, 2017
Time in: 9:00 AM e

Attention:

VANCOUVER, BC –(Marketwired – May 30, 2017) – Wow Unlimited Media Inc.
(formerly Rainmaker Entertainment Inc.) (“Wow” or the “Company”) (TSX VENTURE:
RNK.A) (TSX VENTURE: RNK.B) is pleased to announce its results for the quarter
ended March 31, 2017. The first quarter results incorporate a full quarter of
the operations of Frederator Networks following the acquisition of Frederator
Networks in December 2016.

/T/

March 31, March 31,
$000’s, except per share amounts 2017 2016
—————————————————————————-
Revenue $ 5,867 $ 4,545
Operating EBITDA (795) 33
Operating loss (1,184) (555)
—————————————————————————-
Net loss $ (1,184) $ (9,961)
Net loss per share
– basic and diluted $ (0.42) $ (5.68)
—————————————————————————-
Weighted average number of shares outstanding
– basic and diluted 2,798,249 1,754,018
—————————————————————————-

/T/

/T/

1 See section “Non-GAAP Financial Measures” in this earnings release
2 All earnings per share data for comparative periods have been adjusted to reflect a 10:1 share consolidation completed during the year-ended December 31, 2016

/T/

FINANCIAL HIGLIGHTS

The Company reported the following highlights from three months ended March
31, 2017:

/T/

— First quarter revenue earned was $5.9 million. This included $1.6

million generated by Channel Frederator Network, which grew by an
average of 155 million views a month during the first quarter of 2017.

/T/

/T/

— Work commenced on two new work-for-hire productions during the quarter,

which total approximately $24 million in contract revenue.

/T/

Michael Hirsh, Chairman and CEO, commented: “Wow has started off with strong
momentum in its first quarter as a combined company. The Company signed on
several new projects with marquee clients such as Netflix, Amazon and Mattel,
resulting in a current production pipeline of over $50 million. In addition,
our digital network recorded substantial growth in monthly viewership of over
32% quarter over quarter.”

OPERATIONAL UPDATE

Channel Frederator Network continues to grow, with 44 channels added to the
network in April 2017, for a total of 270 channels added between January 2017
and April 2017. This brings the network channel partner count even closer to
the 3,000 channel partner threshold. By April 30, 2017, Channel Frederator
Network attracted a total of 2.4 billion views from January to April, with 695
million views in April alone, and by April 30, 2017 there were 43 million
subscribers.

Animation productions continue to form a steady part of Wow’s business. The
two new productions added to the slate during the quarter strengthen the
production services pipeline.

CHANGE OF TICKER SYMBOL

The Company is pleased to announce that the Company’s Common Voting Shares and
Variable Voting Shares will begin trading under the new stock ticker symbols
“WOW.A” and “WOW.B”, respectively, on the TSX Venture Exchange (“TSXV”),
effective at the opening of trading on June 1, 2017. This change in the stock
ticker symbols for the Common Voting Shares and Variable Voting Shares does
not require any action by current shareholders as the Company’s CUSIP numbers
for these shares will remain unchanged.

/T/

CONSOLIDATED RESULTS FOR THE QUARTER

Selected financial information for the three months ended March 31, 2017 and
2016 is as follows:

For the three months ended
March 31, March 31,
$000’s 2017 2016
—————————————————————————-
Revenue $ 5,867 $ 4,545
Operating EBITDA (795) 33
Net finance costs 88 494
Depreciation and amortization1 121 144
Share based payments 180 –
Service credits – (50)
—————————————————————————-
Operating loss (1,184) (555)
—————————————————————————-
Items affecting comparability:
Impairments – 567
Share of loss of Ratchet Productions, LLC – 8,839
—————————————————————————-
– 9,406
—————————————————————————-
Net loss $ (1,184) $ (9,961)
—————————————————————————-
Items affecting comparability:
Foreign operations – foreign currency
transation differences 9 416
—————————————————————————-
Total comprehensive loss $ (1,193) $ (10,377)
—————————————————————————-

/T/

/T/

1 Excludes amortization of investment in film and television properties

/T/

Revenue & Operating EBITDA

Revenue increased by 31% by $1.4 million, for total revenue earned of $5.9
million. The increase was driven by:

/T/

— The addition of revenue generated by Channel Frederator Network;
— The commencement of two new productions during the quarter; offset by
— Comparatively lower work-for-hire production levels, as the new

productions take time to reach full production levels.

/T/

The production of the Company’s own IP, Reboot, was underway at Mainframe
Studios utilizing capacity, the benefit of which is expected to be recognised
as revenue in the second half of 2017.

The $0.8 million reduction in operating EBITDA compared to the first quarter
of 2016 is largely result of an increase in general and administration
expenses of the combined operations and higher operating expenses relative to
revenue generated largely due to the timing of studio production schedules.

Net finance costs

The decrease in other expenses of $0.4 million is largely due to the decrease
in interest expense on convertible debentures of $0.4 million quarter over
quarter. The convertible debentures were settled as part of the Company’s
corporate reorganization and acquisitions that were completed in December
2016.

Depreciation and amortization

The reduced depreciation charge is as a result of amounts capitalized during
the first three months of 2017 for assets used during the production of the
one of the Company’s owned IP, ReBoot.

Share based payments

Shared based payments for the three months ended March 31, 2017 was $0.2
million compared to $nil in the same period for 2016. On April 20, 2017 the
Company’s board of directors approved the issuance of incentive stock options
to key members of management and personnel. Although the options were granted
and issued subsequent to March 31, 2017, vesting began during the first
quarter. Their issuance remains subject to TSXV approval.

Impairments and Share of loss in Ratchet Productions, LLC – Ratchet & Clank

During the Company’s previous fiscal year, as previously disclosed, the
Company impaired its investment in Ratchet Productions, LLC (“RPLLC”) ($8.8
million) and an amount of $0.6 million owing to Wow by RPLLC which was not
recoverable.

NON-GAAP FINANCIAL MEASURES

The Company reports using certain supplemental indicators of the Company’s
financial and operating performance in addition to results reported in
accordance with International Financial Reporting Standards (“GAAP”). These
measures are referred to as non-GAAP measures, and include operating earnings,
operating earnings per share and operating EBITDA. The Company believes these
supplemental financial measures reflect the Company’s ongoing business in a
manner that allows for meaningful period-to-period comparisons and analysis of
trends in its business.

The Company defines operating earnings as net profit or loss excluding the
impact of specified items affecting comparability, including, where
applicable, share of loss of equity accounted investees, other non-operational
income and expenses, deferred taxes and other gains or losses. The use of the
term “non-operational income and expenses” is defined by the Company as those
that do not impact operating decisions taken by the Company’s management and
is based upon the way the Company’s management evaluates the performance of
the Company’s business for use in the Company’s internal management reports.
Operating earnings per share is calculated using diluted weighted average
shares outstanding and does not represent actual earnings per share
attributable to shareholders. The Company believes that the disclosure of
operating earnings and operating earnings per share allows investors to
evaluate the operational and financial performance of the Company’s ongoing
business using the same evaluation measures that management uses, and is
therefore a useful indicator of the Company’s performance or expected
performance of recurring operations.

The Company defines operating EBITDA as earnings before interest, taxes,
depreciation and amortization (excluding amortization of investments in film
and television properties), adjusted for certain items affecting comparability
as specified in the calculation of operating earnings. The Company discloses
operating EBITDA to capture the profitability of its business before the
impact of items not considered in management’s evaluation of operating
performance. Unless otherwise stated, the Company includes the amortization of
investments in film and television in the calculation of EBITDA.

Operating earnings, operating earnings per share and operating EBITDA do not
have any standardized meaning prescribed by GAAP and therefore may not be
comparable to similar measures presented by other companies. The Company
cautions readers to consider these non-GAAP financial measures in addition to,
and not as an alternative for, measures calculated in accordance with GAAP.

Forward-looking Statements

This news release contains certain forward-looking statements and
forward-looking information (collectively referred to herein as
“forward-looking statements”) within the meaning of applicable Canadian
securities laws. All statements other than statements of present or historical
fact are forward-looking statements. Forward-looking statements are often, but
not always, identified by the use of words such as “anticipate”, “achieve”,
“could”, “believe”, “plan”, “intend”, “objective”, “continuous”, “ongoing”,
“estimate”, “outlook”, “expect”, “may”, “will”, “project”, “should” or similar
words, including negatives thereof, suggesting future outcomes.

In particular, this news release contains forward-looking statements relating
to, among other things: (i) general economic conditions; (ii) future revenues
to be received by Wow; (iii) Wow’s future business prospects and
opportunities; and (iv) Wow’s ability to complete any or all of its proposed
production work.

Management of the Company believes the expectations reflected in such
forward-looking statements are reasonable as of the date hereof but no
assurance can be given that these expectations will prove to be correct and
such forward-looking statements should not be unduly relied upon. Various
material factors and assumptions are typically applied in drawing conclusions
or making the forecasts or projections set out in forward-looking statements.
Those material factors and assumptions are based on information currently
available to the Company, including data from publicly available governmental
sources as well as from market research and industry analysis and on
assumptions based on data and knowledge of this industry which the Corporation
believes to be reasonable. However, although generally indicative of relative
market positions, market shares and performance characteristics, such data is
inherently imprecise.

Forward-looking statements are not a guarantee of future performance and are
subject to and involve a number of known and unknown risks and uncertainties,
many of which are beyond the control of the Company, which may cause the
Company’s actual performance and results to differ materially from any
projections of future performance or results expressed or implied by such
forward-looking statements. These risks and uncertainties include, but are not
limited to, the risks identified in the Company’s management’s discussion &
analysis dated April 25, 2017 and the Company’s management information
circular dated November 14, 2016 both of which have been filed with the
Canadian Securities Administrators and available on www.sedar.com. Any
forward-looking statements are made as of the date hereof and, except as
required by law, the Company assumes no obligation to publicly update or
revise such statements to reflect new information, subsequent or otherwise.

Neither TSX Venture Exchange nor its Regulation Services Provider (as that
term is defined in the policies of the TSX Venture Exchange) accepts
responsibility for the adequacy or accuracy of this release.

About Wow Unlimited Media Inc.

Wow Unlimited Media Inc., (formerly Rainmaker Entertainment Inc.), is creating
a leading next-generation kids and youth animation business by focusing on
digital platforms and content. The company’s key assets include: the world’s
No. 1 digital animation network, Frederator Networks, which consists of an
animation production company Frederator Studios, as well as VOD channels on
digital platforms; the world’s first Hispanic animation network, Atomo
Network, a joint venture with Anima Estudios; and one of Canada’s largest,
multifaceted animation production studios, Rainmaker Entertainment, which
consists of Mainframe Studios that produces CGI animated television series,
and Rainmaker Studios that produces long-form animated features.

– END RELEASE – 30/05/2017

For further information:

Further information available at:
Website: www.wowunlimited.co
Contact: Lowell Hall
Tel: (416) 887-1636
Email: [email protected]

COMPANY:
FOR: WOW! UNLIMITED MEDIA INC.
TSX VENTURE Symbol: RNK.A
TSX VENTURE Symbol: RNK.B

INDUSTRY: Media and Entertainment – Movies/Music Videos
RELEASE ID: 20170530CC028

Press Release from Marketwired 1-866-736-3779

All press releases are written by the client and have NO affiliation with the news copy written by The Canadian Press. Any questions that arise due to the content or information provided in the press release should be directed to the company/organization
issuing the release, not to The Canadian Press.

GET ENERGYNOW’S DAILY EMAIL FOR FREE


VIQ Announces Profitable FY17 Q1 Results Driven by 45% YOY Revenue Growth

FOR: VIQ SOLUTIONS INC.
TSX VENTURE SYMBOL: VQS

Date issue: May 30, 2017
Time in: 8:30 AM e

Attention:

MARKHAM, ONTARIO–(Marketwired – May 30, 2017) – VIQ Solutions Inc. (“VIQ” or
the “Company”) (TSX VENTURE:VQS), a global expert in secure digital media
technology and services, today reported financial results for the three month
period ended March 31, 2017.

Results are reported in U.S. dollars to reflect the evolving profile of the
Company’s revenue, sales pipeline and cash flows. Comparative figures are also
converted into U.S. dollars. The statements are prepared in accordance with
International Financial Reporting Standards (“IFRS”).

“We are pleased to report a first quarter profit and strong growth in top line
revenue. Our diversification, SaaS and innovation driven growth plan is now
delivering on our plan for increasing financial results,” said Sebastien Pare,
President and CEO of VIQ. “We capitalized on last year’s momentum by continuing
to build our international footprint and expand markets. Our performance
reflects the concerted dedication of the entire VIQ team.

“As large scale cybersecurity focused projects commenced in 2016 progress to
fruition, we anticipate continued strong growth for 2017 and beyond.”

Consolidated revenue for the quarter was USD $2.9M, an increase of USD $0.9M or
45% over the same period in 2016.

VIQ’s adjusted net income (which excludes stock based compensation expense) was
USD $0.3M for the three months ended March 31, 2017 as compared to an adjusted
net loss of USD $0.2M for the same period in 2016. Adjusted net income is a
non-GAAP earnings measure which does not have any standardized meaning
prescribed by IFRS. Adjusted net income represents net income excluding stock
based compensation.

Adjusted net income was driven by continued customer base diversification and
an increase in recurring revenue. The software and services division increased
revenue by $0.4M or 58% over the same period in 2016 with new wins in the
public safety, intelligence and medical markets for the Company’s secure
digital capture and management platform.

VIQ CyberCrypt, the Company’s recently released best in class SaaS
cybersecurity platform for high value digital evidence and sensitive content,
is anticipated to continue significant revenue contribution in 2017.

VIQ CyberCrypt is currently in the midst of an enterprise level rollout with an
international agency, and in the advanced pilot phase with other cybersecurity
focused customers of similar scale. While some revenue from these projects was
recognized in Q1, the majority is anticipated later in 2017 as projects
continue to progress into the rollout phase.

“VIQ CyberCrypt was designed to address specific demand from large scale
customers for a proven solution that protects massive amounts of critical
content in a secure cloud based platform,” said Mr. Pare. “We believe that,
after successfully passing rigorous security vetting, future procurement cycles
will shorten. We continue to anticipate several enterprise level engagements
potentially in 2017.”

VIQ CyberCrypt constitutes a significant milestone in VIQ’s SaaS and cloud
based infrastructure over the last 12 months. More innovations are scheduled
for release in 2017 and 2018.

Revenue from our services division increased by USD $0.5M or 39% over the same
period in 2016 despite the typical summer holiday business slowdown. The
revenue increase resulted from new customer wins in higher revenue blended
reporting, technology and transcription contracts as Spark & Cannon continued
diversifying its service offerings.

“The profitable 2017 first quarter represents a significant milestone for VIQ
in our drive toward sustained, quarter after quarter profitability,” said Mr.
Pare. “Continued market diversification, expansion into SaaS and cybersecurity
pilot project advancement will further revenue growth in 2017.”

Business Highlights for the Quarter

/T/

— Reported adjusted operating income (which excludes deferred and non cash

stock based compensation expenses) of USD $0.3M as compared to a loss of
USD $0.2M in 2016
— Increased consolidated quarterly revenue by USD $0.9M or 45% over 2016
with new diversified wins and increase in recurring SaaS revenue
— Quarterly profit posted by technology division with revenue growth of
USD $0.4M or 58% over Q1 2016 through new customer wins in intelligence,
public safety and medical
— Grew revenue in Spark & Cannon services division by USD $0.5M or 39%
over same period in 2016 due to increase in higher revenue blended
reporting and transcription contracts
— Released VIQ EnConnect, the Company’s first secure audio-video capture
and collaboration smartphone app, on Apple iTunes and Google Play
— Significant expansion announced with US based transcription provider for
secure smartphone dictation and transcription workflow
— Changed reporting currency to U.S. dollars to provide more accurate
reflection of the Company’s financial performance and revenue, which is
increasingly generated in U.S. dollars

/T/

Additional Information

The unaudited first quarter 2017 interim consolidated financial statements and
results of operations and Management’s Discussion and Analysis of Results and
Financial Condition for the three month period ended March 31, 2017 will be
posted on SEDAR’s website at www.sedar.com. The financial information included
in this release is qualified in its entirety and should be read together with
the unaudited first quarter 2017 interim consolidated financial statements and
the audited consolidated financial statements for the year ended December 31,
2016, including the notes thereto.

About VIQ

VIQ is the leading technology and service platform provider for digital
evidence capture and content management. Our secure modular software allows
customers to onboard the VIQ platform at any stage of their organization’s
digitization, from the capture of digital content from video and audio devices
through to online collaboration, mobility, data analytics and integration with
sensors, facial recognition, speech recognition and case management or patient
record systems. VIQ’s technology leads the industry in security, meeting the
highest international standards for digital cybersecurity and privacy,
including military and medical regulations.

Our solutions are in use in over 20 countries with tens of thousands of users
in over 200 government and private agencies including law enforcement,
immigration, medical, legal, insurance, courts, transportation and
transcription service providers. VIQ also provides end to end transcription
services to several large government agencies through our Australia-based
reporting and transcription partners. VIQ operates worldwide with partners like
security integrators, audio-video specialists, and hardware and data storage
suppliers. For more information about VIQ, please visit www.viqsolutions.com.

Forward-looking Statements

Certain statements included in this news release constitute forward looking
statements or forward looking information under applicable securities
legislation. Such forward looking statements or information are provided for
the purpose of providing information about management’s current expectations
and plans relating to the future. Readers are cautioned that reliance on such
information may not be appropriate for other purposes. Forward looking
statements or information typically contain statements with words such as
“anticipate”, “believe”, “expect”, “plan”, “intend”, “estimate”, “propose”,
“project” or similar words suggesting future outcomes or statements regarding
an outlook. Forward looking statements or information in this news release
include, but are not limited to, management’s targets for the Company’s growth
in 2017, as well as the size, scope, and timing of the implementation of
projects currently in the pilot phase.

Forward looking statements or information is based on a number of factors and
assumptions which have been used to develop such statements and information but
which may prove to be incorrect. Although VIQ believes that the expectations
reflected in such forward looking statements or information are reasonable,
undue reliance should not be placed on forward looking statements because VIQ
can give no assurance that such expectations will prove to be correct. In
addition to other factors and assumptions which may be identified in this news
release, assumptions have been made regarding, among other things, the
Company’s recent initiatives, and that sales and prospects may provide
incremental value for shareholders. Readers are cautioned that the foregoing
list is not exhaustive of all factors and assumptions which have been used.

Forward looking statements or information are based on current expectations,
estimates and projections that involve a number of risks and uncertainties
which could cause actual results to differ materially from those anticipated by
VIQ and described in the forward looking statements or information. These risks
and uncertainties may cause actual results to differ materially from the
forward looking statements or information. Readers are cautioned that the
foregoing list is not exhaustive of all possible risks and uncertainties.

For more information about VIQ, please visit www.viqsolutions.com.

Neither the TSX Venture Exchange nor its Regulation Service Provider (as that
term is defined in the policies of the Exchange) accepts responsibility for the
adequacy or accuracy of this release.

– END RELEASE – 30/05/2017

For further information:
VIQ Solutions Inc.
Sebastien Pare
(905) 948-8266 ext. 221
[email protected]

COMPANY:
FOR: VIQ SOLUTIONS INC.
TSX VENTURE SYMBOL: VQS

INDUSTRY: Computers and Software – Software, Government – Security
(law enforcement, homeland etc)
RELEASE ID: 20170530CC0037

Press Release from Marketwired 1-866-736-3779

All press releases are written by the client and have NO affiliation with the news copy written by The Canadian Press. Any questions that arise due to the content or information provided in the press release should be directed to the company/organization
issuing the release, not to The Canadian Press.

GET ENERGYNOW’S DAILY EMAIL FOR FREE


The Western Investment Company of Canada Announces Filing of Q1 2017 Financial Statements and Provides Update to Shareholders

FOR: THE WESTERN INVESTMENT COMPANY OF CANADA LIMITED
TSX VENTURE SYMBOL: WI
Date issue: May 30, 2017Time in: 8:30 AM eAttention:
CALGARY, ALBERTA–(Marketwired – May 30, 2017) – The Western Investment Company
of Canada Limited (TSX VENTURE:WI)
NOT FO…

GET ENERGYNOW’S DAILY EMAIL FOR FREE


Point Loma Resources Announces First Quarter Financial and Operating Results

FOR: POINT LOMA RESOURCES LTD
TSX VENTURE Symbol: PLX

Date issue: May 30, 2017
Time in: 8:00 AM e

Attention:

CALGARY, AB –(Marketwired – May 30, 2017) – Point Loma Resources Ltd. (TSX
VENTURE: PLX) (the “Corporation” or “Point Loma”) is pleased to report
financial and operating results for the three months ended March 31, 2017.
Highlights of the period and additional updates are summarized below:

HIGHLIGHTS

/T/

—————————————————————————-
Financial Three Months ended Three Months ended
March 31, 2017(1) December 31, 2016
—————————————————————————-
($ thousands, except share
amounts)

Gross revenue 1,515 970
Cash from (used) in operating
activities 340 (168)
Funds used in operations(2)(3) (60) (618)
Per share – basic(3) (0.00) (0.02)
Net loss (772) (2,522)
Per share – basic (0.03) (0.10)
Capital expenditures 128 2,258
Working capital deficit 1,655 1,491
Convertible Debentures 2,385 2,357
Share capital
Weighted average shares
outstanding for period 29,538,409 21,655,040
Outstanding shares at end of
period 31,961,419 27,353,325

Operations

Daily average production
———————————–

Crude oil and liquids (bbls/d) 205 146
Natural gas (mcf/d) 2,263 1,171
Total production (boe/d at 6:1) 582 341

Average sales price
———————————–

Crude oil and liquids ($/bbl) 51.89 48.18
Natural gas ($/mcf) 2.75 3.02
Equivalent ($/boe) 28.95 30.91
Netback(3)
Revenues ($/boe) 28.95 30.91
Royalties ($/boe) (3.66) (5.47)
Operating expense ($/boe) (17.30) (26.81)
Transportation expense ($/boe) (1.04) (0.80)
——————– ——————–
Netback ($/boe)(3) 6.96 (2.17)
———————————–====================-====================

—————————————————————————-

/T/

/T/

(1) Three months ended March 31, 2017 includes one month of Judy Creek

acquisition production.
(2) Funds used in operations is cash flow used in operating activities less
changes in non-cash working capital and transaction costs paid.
(3) Cash from (used) in operating activities and netback are non-GAAP
measures; see “Non-GAAP Measures” below.

/T/

First Quarter Summary

The first quarter of 2017 was an active period for acquisitions and an
increasing production profile for Point Loma. The Corporation closed a smaller
transaction in January 2017 (“Ascent”) and a larger deal in February, 2017
(“Judy Creek”) which in combination with work completed in December 2016
resulted in increased production for the quarter and an average of 830 boe/d
for the month of March 2017.

Subsequent to the first quarter Point Loma has announced two additional
transactions that will capitalize 2017 drilling and facilities programs and
provide strategic capital partners for future growth.

Salt Bush JV

On May 23, 2017 the Corporation closed a disposition and joint venture with
Salt Bush Energy Ltd. (“Salt Bush”) for consideration of $4.17 million for 20%
of its oil and gas assets. Salt Bush has made an additional capital commitment
of $0.83 million towards the current joint budget.

Salt Bush will be a strategic JV partner with Point Loma in future endeavors
and will also contribute a proportionate share of general and administrative
expenses to the Corporation.

Evenergy Investment

On May 24, 2017 Point Loma announced an investment agreement with Evenergy
Company Limited (“Evenergy”) to acquire 8,375,000 shares of Point Loma for
$4,020,000 representing a purchase price of $0.48 per share. The first tranche
of funds closed on May 29, 2017 in the amount of $1,797,541 and the second
tranche of $2,222,458 is expected to close within 3 business days after the
receipt of approvals from the TSX Venture Exchange.

Evenergy will also have the right to nominate one director to the board of
directors of the Corporation and the right to participate in future equity
issuances of the Corporation to maintain its pro rata interest on the terms
set out in the investment agreement.

New Director

Point Loma is very pleased to have added Kevin R. Baker, Q.C., to the
Corporation’s Board of Directors subject to the approval of the Corporations
shareholders at our upcoming Annual and General meeting. Mr. Baker is a
significant shareholder of Point Loma with ownership of approximately 17% of
the Corporation’s common shares. Mr. Baker has been President and CEO of a
number of public and private exploration and production and oilfield services
companies. It is anticipated that he will join the Audit and Corporate
Governance and Compensation committees of Point Loma.

Outlook

With the injection of the additional capital outlined above Point Loma is
planning to undertake a busy drilling and facilities program this summer. The
Corporation has approved a capital budget for the second and third quarters
that will see approximately $5 million of activity including the drilling of 2
horizontal development wells, one vertical exploratory test and additional
facilities optimization and acquisitions. Point Loma anticipates that these
activities will be the precursor to an increase in oil and gas production into
the fourth quarter.

Pending success and approved capital programs Point Loma would anticipate a
further program of drilling in the fourth quarter. Point Loma has been in
contact with an industry midstream operator regarding their announced purchase
of the Paddle River gas facility and infrastructure system. Point Loma has
previously producing suspended wells in the area that could be re-activated
into the facility.

“Point Loma is excited to begin our 2017 drilling and operational cycle,” said
Terry Meek, President and CEO of Point Loma. “The combination of additional
capital, development drilling, identified tuck in opportunities and potential
re-activation of key infrastructure in our core area provides the impetus for
a growth step and operational improvements for Point Loma that would benefit
our production levels while improving our netbacks through lower operating
costs.”

Additional Information

Point Loma has filed its first quarter financial statements, Management’s
Discussion and Analysis (MD&A) and Annual Information Form (AIF) for the
quarter ended March 31, 2017 with Canadian securities regulators. These
filings, and additional information including the Corporation’s recently
updated corporate presentation can be found at Point Loma’s website at
www.pointloma.ca or at Point Loma’s profile on the System for Electronic
Document Analysis and Retrieval website at www.sedar.com.

About Point Loma

Point Loma is a public oil and gas development and exploration company focused
on horizontally exploiting conventional oil and gas reservoirs in west central
Alberta. Point Loma’s business plan is to utilize its experience to drill,
develop and acquire accretive assets with potential for implementation of
horizontal multi-stage frac technology and exploit opportunities for secondary
recovery.

A Note Regarding Forward-Looking Information

This press release contains forward-looking statements and forward-looking
information within the meaning of applicable securities laws, including
without limitation, statements pertaining to Point Loma’s expectations as to
production and future potential production increases, as well as increases in
cash flow and the timing thereof; future gas processing rates; Point Loma’s
expectations as to future prices of oil and natural gas; the focus of Point
Loma’s management team and go-forward strategy.

The use of any of the words “will”, “expects”, “believe”, “plans”, “potential”
and similar expressions are intended to identify forward-looking statements or
information. Although Point Loma believes that the expectations and
assumptions on which such forward-looking statements and information are based
are reasonable, undue reliance should not be placed on the forward-looking
statements and information because Point Loma cannot give assurance that they
will prove to be correct.

Since forward-looking statements and information address future events and
conditions, by their very nature they involve inherent risks and
uncertainties. Actual results could differ materially from those currently
anticipated due to a number of factors and risks. These include, but are not
limited to, the risks associated with the oil and gas industry in general such
as operational risks in development, exploration and production; delays or
changes in plans with respect to exploration or development projects or
capital expenditures; the uncertainty of reserve and resource estimates; the
inability of Point Loma to bring additional production on stream or in the
anticipated quantities disclosed herein; the uncertainty of estimates and
projections relating to reserves, resources, production, costs and expenses;
health, safety and environmental risks; commodity price and exchange rate
fluctuations; marketing and transportation; loss of markets; environmental
risks; competition; incorrect assessment of the value of acquisitions; failure
to realize the anticipated benefits of acquisitions; ability to access
sufficient capital from internal and external sources; changes in legislation,
including but not limited to tax laws, royalties and environmental
regulations, actual production from the acquired assets may be greater or less
than estimates. Management has included the above summary of assumptions and
risks related to forward-looking information provided in this press release in
order to provide security holders with a more complete perspective on Point
Loma’s future operations and such information may not be appropriate for other
purposes.

The forward-looking statements and information contained in this press release
are made as of the date hereof and Point Loma does not undertake any
obligation to update publicly or revise any forward-looking statements or
information, whether as a result of new information, future events or
otherwise, unless so required by applicable securities laws.

Oil and Gas Information

“BOEs” may be misleading, particularly if used in isolation. A BOE conversion
ratio of six thousand cubic feet of natural gas to one barrel of oil
equivalent (6 Mcf: 1 bbl) is based on an energy equivalency conversion method
primarily applicable at the burner tip and does not represent a value
equivalency at the wellhead. As the value ratio between natural gas and crude
oil based on the current prices of natural gas and crude oil is significantly
different from the energy equivalency of 6:1, utilizing a conversion on a 6:1
basis may be misleading as an indication of value.

Non-GAAP Measures

The Corporation utilizes certain measurements that do not have a standardized
meaning or definition as prescribed by IFRS and therefore may not be
comparable with the calculation of similar measures by other entities,
including cash from (used) in operating activities and netback. Readers are
referred to advisories and further discussion on non-GAAP measurements
contained in the Corporation’s MD&A.

– END RELEASE – 30/05/2017

For further information:

For further information, please contact:

Terry Meek
President and CEO
Telephone: (403) 705-5051 ext.101
[email protected]

Kevin Angus
Executive Vice-President Business Development
Telephone: (403) 705-5051 ext. 103
[email protected]

Randall Boyd
Vice President Finance and CFO
Telephone: (403) 705-5051 ext. 105
[email protected]

COMPANY:
FOR: POINT LOMA RESOURCES LTD
TSX VENTURE Symbol: PLX

INDUSTRY: Energy and Utilities – Oil and Gas
RELEASE ID: 20170530CC003

Press Release from Marketwired 1-866-736-3779

All press releases are written by the client and have NO affiliation with the news copy written by The Canadian Press. Any questions that arise due to the content or information provided in the press release should be directed to the company/organization
issuing the release, not to The Canadian Press.

GET ENERGYNOW’S DAILY EMAIL FOR FREE


North America Frac Sand Inc. ("NAFS") Completes NI43-101 Report on NAFS Saskatchewan frac sand deposit

FOR: NORTH AMERICA FRAC SAND, INC.OTCQB SYMBOL: NAFSDate issue: May 30, 2017Time in: 5:00 AM eAttention:
NORTH VANCOUVER, BRITISH COLUMBIA–(Marketwired – May 30, 2017) – North America
Frac Sand, Inc. (“NAFS” or the “Company”) (OTCQB:NAFS) (www.NAFSIN…

GET ENERGYNOW’S DAILY EMAIL FOR FREE


CAPPA Is Looking For Subject Matter Experts (SMEs): Interested? Click HERE for Details

What are Subject Matter Experts (SMEs)? A Subject Matter Expert (SME) is an individual who exhibits the highest level of expertise in performing a specific job, task or skill.  A SME will have bona fide in-depth knowledge and expertise about a particular job or area of work. Who are CAPPA SMEs? SMEs are CAPPA members … Read more

GET ENERGYNOW’S DAILY EMAIL FOR FREE


Founders Advantage Releases Q1 2017 Results; Investee Revenues Increase Year Over Year, Earnings Reflect Normal Seasonality

FOR: FOUNDERS ADVANTAGE CAPITAL CORP.
TSX VENTURE SYMBOL: FCF

Date issue: May 29, 2017
Time in: 10:08 PM e

Attention:

CALGARY, ALBERTA–(Marketwired – May 29, 2017) – Founders Advantage Capital
Corp. (TSX VENTURE:FCF) (the “Corporation”) is pleased to report its financial
results for the three months ended March 31, 2017 (“Q1 2017”). Readers should
refer to the condensed interim consolidated financial statements and management
discussion and analysis (“MD&A”) for the three months ended March 31, 2017 for
complete information, which are available on SEDAR at www.sedar.com and on the
Corporation’s website at www.advantagecapital.ca.

“We continue to be excited about the performance of our current investments and
the pipeline of opportunities being presented to us,” stated Stephen Reid,
President and Chief Executive Officer of the Corporation. “DLC has continued to
grow its funded mortgage volumes despite the recent turbulence in the Canadian
mortgage industry and Club16 has increased its membership base by 4.9% year
over year. Historically, January through March is the slowest period of the
year for home purchases, which impacts DLC’s revenues. Even during the slowest
time of year, DLC’s funded mortgage volume grew 11.2% year over year,
outperforming our expectations. As these seasonal lows are anticipated, DLC
management uses this time for marketing and promotion activities to recruit
additional brokers and franchises, which drive additional funded volume growth
for the remainder of the year. During the quarter, DLC continued to reposition
its newest asset, Newton Connectivity Systems, which was acquired in December
2016. While we are very pleased with the growth outlook and initial revenues
being generated by Newton, we are forecasting certain repositioning costs to be
incurred during the year, and expect better indications of run-rate
profitability in subsequent quarters.”

Please see the Overview and Outlook of Investees section for performance
details on each of our investees and Outlook for 2017.

Q1 2017 Highlights

/T/

— On March 1, 2017, the Corporation completed the acquisition of a 52%

interest in Impact Radio Accessories (“Impact”) for $12.7 million. This
acquisition further diversifies the Corporation’s investment portfolio
of companies operating in defensive, recession-resistant industries.
— Concurrent with the acquisition of Impact, the Corporation entered into
an amended credit facility with ATB Financial to increase its revolving
credit facility from $17.0 million to $28.0 million and to cancel its
previously existing non-revolving $5.0 million credit facility. As such,
the Corporation increased its available borrowing limit from $22.0
million to $28.0 million. The Corporation used its available borrowings
to fund the acquisition of Impact.
— Declared first quarterly dividend of $0.0125 per share ($0.05 per share
annualized), which resulted in a payment of $0.5 million in April 2017.

/T/

Selected Consolidated Financial Highlights

/T/

—————————————————————————-
—————————————————————————-

For the three months ended
December
March 31, 31, March 31,
(000’s, except per share amounts) 2017 2016 2016(1)
—————————————————————————-
Revenues $ 13,694 $ 9,277 $ –
Loss from operations (2) $ (1,790) $ (1,606) $ (2,940)
Adjusted EBITDA (2) (3) $ 1,413 $ 998 $ (1,930)
Cash generated by (used in) operating
activities $ 3,334 $ (253) $ (1,578)
Net loss attributable to shareholders $ (1,630) $ (2,410) $ (4,025)
Adjusted EBITDA attributable to
shareholders (3) $ 255 $ (211) $ (1,930)
Basic loss per share $ (0.04) $ (0.07) $ (0.40)
Diluted loss per share $ (0.04) $ (0.07) $ (0.40)
Dividends declared (4) $ 474 $ – $ –
—————————————————————————-
—————————————————————————-
(1) As a result of the change in the Corporation’s business plan, effective
February 23, 2016, the prior year period is not a direct indication of
comparable results.
(2) Newton Connectivity Systems contributed loss from operations of $1.0
million and negative adjusted EBITDA of $0.8 million during the three
months ended March 31, 2017.
(3) See “Non-IFRS measures” below for the definition of adjusted EBITDA and
cautions related thereto.
(4) The Corporation announced a dividend policy in November 2016, with the
first quarterly dividend being declared on March 15, 2017 to shareholders
of record as at March 31, 2017.

/T/

Review of Q1 2017 Consolidated Financial Results

Consolidated revenues were $13.7 million, compared to $nil during Q1 2016, due
to the timing of acquisitions made during fiscal 2016. Specifically, as the
acquisition of Dominion Lending Centres Limited Partnership (“DLC”), Club16
Limited Partnership (“Club16” or “Trevor Linden Club16”) and Impact Radio
Accessories (“Impact”) closed on June 3, 2016, December 20, 2016 and March 1,
2017, respectively, there were no financial results consolidated into the
Corporation’s financial statements during Q1 2016. DLC’s $7.2 million in
revenues for Q1 2017 were impacted by the expected seasonally slowest period
for home purchases, but were supplemented by $0.6 million in revenues generated
by DLC’s most recent acquisition, Newton Connectivity Systems Inc. (“Newton”).
As Newton is still restructuring and ramping up its services, we expect growing
quarterly revenues from Newton going forward. Club16 generated revenue of $5.5
million during Q1 2017, which excludes the annual club enhancement fee paid by
the Club16 members every May, which $2.2 million was received on May 3, 2017.
Impact generated revenue of $0.9 million since its acquisition (31 days of the
current quarter), which is effected by the timing of certain larger purchase
orders during the year. Please see “Overview and Outlook of Investees” section
below for additional details on investee performance.

Consolidated loss from operations was $1.8 million, compared to $2.9 million
during Q1 2016. The current quarter loss is impacted by the $9.6 million of
consolidated general and administrative expenses and seasonality of DLC’s
operations. DLC ($4.1 million), Club16 ($3.8 million), Impact ($0.3 million)
and Corporate ($1.5 million) each contributed to the consolidated general and
administrative expenses. DLC’s expenses do not vary proportionately with the
fluctuations in revenue caused by the changes in home buying season. As a
result, loss from operations for Q1 2017 is impacted more heavily than in other
fiscal quarters when revenues are expected to be higher and costs are not
increased proportionately. Also, DLC incurred $0.3 million in severance costs
related to DLC and Newton during Q1 2017. Newton incurred a loss from
operations of $1.0 million during the quarter, which is expected to improve
during fiscal 2017 as operations continue to ramp up. Further, Club16’s annual
club enhancement fee is not earned until May every year, which $2.2 million was
received on May 3, 2017. This revenue has no associated costs, which results in
a significant positive impact to income from operations during the next fiscal
quarter. Due to the seasonality of DLC’s business, the changing run-rate
profitability of Newton, the timing of Club16’s annual club enhancement fee,
and the variable timing of Impact’s revenue, the loss from operations for Q1
2017 is not necessarily indicative of future quarterly results.

Consolidated adjusted EBITDA was $1.4 million, compared to negative adjusted
EBITDA of $1.9 million during Q1 2016. This increase over the prior year is
significantly due to the completed acquisitions. As noted above, due to the
seasonality of DLC’s business, the changing run-rate profitability of Newton,
the timing of Club16’s annual club enhancement fee, and the variable timing of
Impact’s revenue, the adjusted EBITDA for Q1 2017 is not necessarily indicative
of future quarterly results.

Consolidated net loss attributable to shareholders was $1.6 million, compared
to $4.0 million during Q1 2016. This variance over the prior year quarter is
primarily driven by the full consolidation of the financial results of DLC,
Club16 and Impact during Q1 2017. As discussed above, due to the seasonality of
DLC’s business, the changing run-rate profitability of Newton, the timing of
Club16’s annual club enhancement fee, and the variable timing of Impact’s
revenue, the net loss attributable to shareholders for Q1 2017 is not
necessarily indicative of future quarterly results.

Overview and Outlook of Investees

In addition to the information provided in the Q1 2017 consolidated financial
statements and associated MD&A, we would like to note the following additional
information regarding our investees.

DLC Limited Partnership

/T/

—————————————————————————-
—————————————————————————-

For the three months
ended
—————————————————————————-
December
March 31, 31,
(000’s) (1) 2017 2016
—————————————————————————-
Revenues $ 7,338 $ 8,644
Operating expenses 6,729 7,153
—————————————————————————-
Income from operations (2) 609 1,491
Other (expense) income, net (275) 426
—————————————————————————-
Income before tax 334 1,917
Add back:
Depreciation and amortization 1,338 1,341
Finance expense 177 130
Other income – (462)
—————————————————————————-
Adjusted EBITDA(2) $ 1,849 $ 2,926

Adjusted EBITDA attributable to:
Shareholders $ 1,224 $ 1,755
Non-controlling interests $ 605 $ 1,171
—————————————————————————-
—————————————————————————-

—————————————————————————-
—————————————————————————-
Key performance indicators:
Funded mortgage volumes (3) $ 6,769,244 $ 9,325,208
Number of franchises (4) 446 443
Number of brokers (4) 5,309 5,237
—————————————————————————-
—————————————————————————-
(1) DLC’s results generally vary from quarter to quarter as a result of
seasonal fluctuations in the reporting segment. This means DLC’s results in
one quarter are not necessarily a good indication of how they will perform
in a future quarter.
(2) Newton Connectivity Systems contributed loss from operations of $1.0
million and negative adjusted EBITDA of $0.8 million during the three
months ended March 31, 2017.
(3) Funded mortgage volumes are a key performance indicator for the DLC
segment that allows us to measure DLC’s performance against our operating
strategy. These amounts are stated in thousands.
(4) The number of franchises and brokers are as at the respective balance
sheet date.

/T/

The Corporation acquired its 60% interest in DLC on June 3, 2016. Prior to the
acquisition, DLC’s unaudited revenue for Q1 2016 was $6.4 million. The revenue
for Q1 2017 was $7.3 million, representing 14.1% revenue growth year over year.
This growth over the prior year is significantly due to the 11.2% increase in
funded mortgage volumes during Q1 2017, compared to Q1 2016. DLC’s revenues are
significantly impacted by the home buying season, which is typically more
heavily weighted during the months of May through September. As a result, we
expect additional revenues to be earned during the upcoming fiscal quarters
when compared to Q1 2017.

DLC’s income from operations and adjusted EBITDA were $0.6 million and $1.8
million, respectively, which were significantly impacted by both direct costs
of $1.3 million and general and administrative expense of $4.1 million. As
noted above, DLC’s revenue is seasonal in nature caused by changes in the home
buying season, and general and administrative costs do not vary proportionately
with these seasonal fluctuations. As a result, income from operations for Q1
2017 is impacted more heavily than in other fiscal quarters when revenues are
expected to be higher and costs are not increased proportionately. Also
included in income from operations for the current quarter are the revenues and
costs associated with Newton, totaling a net $1.0 million in costs, which
include $0.2 million of severance related expenses. As Newton continues to ramp
up its operations, we expect the income from operations to increase going
forward. Currently, Newton represents approximately 3% of the connectivity
platform market. As DLC represents approximately 35% of the Canadian mortgage
brokerage industry, migrating mortgage brokers to the Newton platform would
have a meaningful impact on DLC’s revenues and adjusted EBITDA.

DLC expects to continue to expand its network of mortgage brokers and
franchisees by focusing on their recruiting initiatives, as evidenced by DLC’s
continued quarter over quarter growth in funded mortgage volumes and increases
in franchises and brokers. As a result of these growth initiatives, we
anticipate DLC having steady growth in its funded mortgage volumes in 2017,
resulting in steady growth in revenues and adjusted EBITDA.

The Corporation is receiving $540,000 per month in after-tax cash distributions
from DLC.

Trevor Linden Club16

/T/

—————————————————————————-
—————————————————————————-

For the three months
ended
—————————————————————————-
December
March 31, 31,
(000’s) 2017 2016
—————————————————————————-
Revenues $ 5,466 $ 633
Operating expenses 5,022 665
—————————————————————————-
Income (loss) from operations 444 (32)
Other (expense), net (40) (6)
—————————————————————————-
Income (loss) before tax 404 (38)
Add back:
Depreciation and amortization 672 127
Finance expense 40 6
—————————————————————————-
Adjusted EBITDA $ 1,116 $ 95

Adjusted EBITDA attributable to:
Shareholders $ 670 $ 57
Non-controlling interests $ 446 $ 38
—————————————————————————-
—————————————————————————-

—————————————————————————-
—————————————————————————-
Key performance indicators:
Total fitness club members (1) 80,296 78,316
—————————————————————————-
—————————————————————————-
(1) The number of fitness club members is as at the respective balance sheet
date.

/T/

The Corporation acquired its 60% interest in Trevor Linden Club16 on December
20, 2016. Prior to the acquisition, Club16’s unaudited revenue for Q1 2016 was
$5.0 million. The revenue for Q1 2017 was $5.5 million, representing 9.2%
revenue growth year over year, which is partially driven by the 4.9% increase
in membership base. Also, Club16 received its annual club enhancement fee from
its members on May 3, 2017 for $2.2 million, which will be included in the
financial results of the next quarter.

Club16’s income from operations and adjusted EBITDA were $0.4 million and $1.1
million, respectively. The income from operations and adjusted EBITDA for Q1
2017 represent normal course operations, and we expect continued growth in the
total fitness club members based on the historic growth trend.

Club16 anticipates continued growth in its personal training services, which
are a relatively new product offering. These services are expected to add to
Trevor Linden Club16’s revenues and adjusted EBITDA. During Q1 2017, Club16
earned $0.7 million in revenues related to personal training services (gross
margin of 43%), compared to $0.3 million during Q1 2016 (gross margin of 24%).

Trevor Linden Club16 expects to continue adding new members by increasing total
square footage of gym space via opening a new location and expanding one of the
current locations during 2017. It is anticipated that these initiatives will
have a positive impact on 2017 fitness club membership revenues and adjusted
EBITDA.

The Corporation is receiving $270,000 per month in pre-tax cash distributions
from Club16. The Corporation offsets this income with its corporate general and
administrative expenses to reduce the income taxes payable to nil.

Impact

/T/

—————————————————————————-
—————————————————————————-

For the three months
ended
—————————————————————————-
December
March 31, 31,
(000’s) (1) 2017 2016
—————————————————————————-
Revenues $ 890 $ –
Operating expenses 799 –
—————————————————————————-
Income from operations 91 –
Other income, net 12 –
—————————————————————————-
Income before tax 103 –
Add back:
Depreciation and amortization 96 –
Share-based payments 24 –
—————————————————————————-
Adjusted EBITDA $ 223 $ –

Adjusted EBITDA attributable to:
Shareholders $ 116 $ –
Non-controlling interests $ 107 $ –
—————————————————————————-
—————————————————————————-
(1) Includes 31 days of Impact operations as the acquisition was completed
on March 1, 2017.

/T/

The Corporation acquired its 52% interest in Impact on March 1, 2017. Revenues
for the month of March 2017 were $0.9 million, consistent with March 2016.
Total revenues for Q1 2017, including the period prior to the acquisition, were
$2.4 million, consistent with the same prior year period.

Impact’s income from operations and adjusted EBITDA were $0.1 million and $0.2
million, respectively, which represents 31 days of operations. As Impact is
subject to certain fluctuations in timing of larger purchase orders, we expect
variability in the quarterly financial results.

Impact expects to increase sales by adding distributors and anticipates that
its products will gain additional exposure as the distributors expand their own
businesses (via organic and acquisition growth), which will result in more
distributor representatives selling the Impact products. It is anticipated that
these initiatives will have a positive impact on 2017 revenues and adjusted
EBITDA.

The Corporation is receiving $104,000 per month in after-tax cash distributions
from Impact.

Non-IFRS measures

Adjusted EBITDA for both our corporate head office and investees is defined as
earnings before interest, taxes, and non-cash items such as depreciation and
amortization, share-based payments, losses recognized on the sale of
investments, and any unusual non-operating one-time items such as corporate
start-up costs and other revenues. Adjusted EBITDA is also adjusted for
expenses relating to prior mineral property impairment reversal and
arbitration. Readers are cautioned that adjusted EBITDA should not be construed
as a substitute or an alternative to applicable generally accepted accounting
principle measures as determined in accordance with IFRS.

About Founders Advantage Capital Corp.

The Corporation is listed on the TSX Venture Exchange as an Investment Issuer
(Tier 1) and employs a permanent investment approach. The Corporation has
developed an investment approach to create long-term value for its shareholders
and partner entrepreneurs (investees) by pursuing controlling interest
acquisitions of cash flow positive middle-market privately held entities. The
Corporation seeks to win mandates by appealing to the segment of the market
which is not aligned with traditional private equity control, royalty
monetizations or related structures. The Corporation’s innovative platform
offers disproportionate incentives (contractually) for growth in favour of our
investees. This unique platform is designed to appeal to entrepreneurs who
believe in the growth of their businesses and who want the added ability to
continue managing the business while partnering with a long-term partner.

The Corporation’s common shares are listed on the TSX Venture Exchange under
the symbol “FCF”.

For further information, please refer to the Corporation’s website at
www.advantagecapital.ca.

NEITHER THE TSX VENTURE EXCHANGE NOR ITS REGULATION SERVICES PROVIDER (AS THAT
TERM IS DEFINED IN THE POLICIES OF THE TSX VENTURE EXCHANGE) ACCEPTS
RESPONSIBILITY FOR THE ADEQUACY OR ACCURACY OF THIS RELEASE.

Cautionary Statement Regarding Forward-Looking Financial Information

Certain statements in this document constitute forward-looking information
under applicable securities legislation. Forward-looking information typically
contains statements with words such as “anticipate”, “believe”, “estimate”,
“will”, “expect”, “plan”, “intend”, or similar words suggesting future outcomes
or an outlook. Forward-looking information in this document includes, but is
not limited to:

/T/

— the Corporation forecasts certain restructuring costs to be incurred

related to Newton;
— the Corporation expects better run-rate profitability in subsequent
quarters from Newton;
— the Corporation expects growing quarterly revenues from Newton going
forward;
— the Corporation plans to obtain additional financing either through debt
or equity;
— the Corporation is forecasting positive cash flows from operating
activities;
— the Corporation expects DLC’s funded mortgage volumes will continue
growing;
— the Corporation expects Newton to continue to ramp up its operations;
— the Corporation expects Newton’s income from operations to increase
going forward;
— DLC anticipates it can increase Newton’s market share;
— DLC expects to continue to expand its network of mortgage brokers and
franchisees;
— the Corporation expects Trevor Linden Club16’s membership base to
continue growing;
— Trevor Linden Club16 anticipates continued growth in its personal
training services;
— Trevor Linden Club16 expects to continue adding new members;
— Impact expects to increase sales by adding distributors;
— Impact expects its products will gain additional exposure; and
— The Corporation’s ability to win potential acquisitions over competing
sources of investment, including, but not limited to, private equity,
royalty funds or related structures.

/T/

Such forward-looking information is based on a number of assumptions which may
prove to be incorrect. Assumptions have been made with respect to the following
matters, in addition to any other assumptions identified in this document:

/T/

— The Corporation being able to source and negotiate transactions on

acceptable terms and in a timely manner;
— The Corporation being able to source additional financing on acceptable
terms and in a timely manner;
— That the Board of Directors for each of the investee entities resolves
to continue distributing cash as expected; and
— That the business of DLC, Trevor Linden Club16 and Impact will not
suffer any material adverse changes.

/T/

Although the Corporation believes that the expectations reflected in such
forward-looking information are reasonable, undue reliance should not be placed
on them as the Corporation can give no assurance that such expectations will
prove to be correct. Forward-looking information is based on expectations,
estimates and projections that involve a number of risks and uncertainties
which could cause actual results to differ materially from those anticipated by
the Corporation and described in the forward-looking information. The material
risks and uncertainties include, but are not limited to:

/T/

— The adequacy of the Corporation’s existing resources to complete

additional potential transactions;
— The return for any acquisition not being as expected by the Corporation
post-closing; and
— Incremental risks associated with any additional investee company, as
well as the risks associated with the industries in which additional
investees operate.

/T/

The foregoing list of risks is not exhaustive. For more information relating to
risks, see the section titled “Risk Factors” in the Corporation’s current
annual information form. The forward-looking information contained in this
document is made as of the date hereof and, except as required by applicable
securities law, the Corporation undertakes no obligation to update publicly or
revise any forward-looking statements or information, whether as a result of
new information, future events or otherwise.

– END RELEASE – 29/05/2017

For further information:
Founders Advantage Capital Corp.
Stephen Reid
Chief Executive Officer
403-455-7350
[email protected]
OR
Founders Advantage Capital Corp.
Darren Prins
Chief Financial Officer
403-455-2274
[email protected]
OR
Founders Advantage Capital Corp.
James Bell
Chief Operating Officer
403-455-2218
[email protected]

COMPANY:
FOR: FOUNDERS ADVANTAGE CAPITAL CORP.
TSX VENTURE SYMBOL: FCF

INDUSTRY: Financial Services – Investment Services and Trading
RELEASE ID: 20170529CC0071

Press Release from Marketwired 1-866-736-3779

All press releases are written by the client and have NO affiliation with the news copy written by The Canadian Press. Any questions that arise due to the content or information provided in the press release should be directed to the company/organization
issuing the release, not to The Canadian Press.

GET ENERGYNOW’S DAILY EMAIL FOR FREE


Lingo Media Reports First Quarter 2017 Results

FOR: LINGO MEDIA CORPORATION
OTCQB Symbol: LMDCF
TSX VENTURE Symbol: LM

Date issue: May 29, 2017
Time in: 8:44 PM e

Attention:

TORONTO, ON –(Marketwired – May 29, 2017) – Lingo Media Corporation (TSX
VENTURE: LM) (OTCQB: LMDCF) (“Lingo Media” or the “Company”), an EdTech
company that is ‘Changing the way the world learns English’ through innovative
online and print-based technologies and solutions, announces its financial
results for the first quarter ended March 31, 2017. All figures are reported
in Canadian Dollars and are in accordance with International Financial
Reporting Standards unless otherwise noted.

Michael Kraft, President & CEO of Lingo Media, commented, “During the first
quarter of 2017, we invested approximately $875,000 in our digital content
library to position the company for future growth. In Q1, we collected
$685,695 and subsequent to the quarter, we collected a further $691,880, in
aggregate $1.37 million of accounts recievable from 2016 publishing royalties.
In addition, we extended the publishing royalty contract by three years with
People’s Education Press in China till August 2022. As of March 31, 2017, our
cash position increased to $300,042 as compared to $84,303 as of the year end
and our book value increased by $1.7 million to $6.4 million or $0.18 per
share compared to March 31, 2016. While our Q1-17 sales year over year
declined by 21%, our ELL Technologies digital sales actually increased,
excluding SENA revenue from Q1-16.”

Q1 2017 Operational Highlights

/T/

— Online English Language Learning:

— initiated the localization in Spanish for English For Success
— advanced the development of ELL Technologies’ new online Mandarin
course
— continued to market and sell, English For Success, a series of
lessons and activities derived from ELL Library as a premium
solution for governments and educational institutions
— entered into a software licensing contract for ELL Technologies’
programs with a new distributor group in Peru

/T/

/T/

— Print-Based English Language Learning:

— extended the publishing agreements for PEP Primary English and
Starting Line programs with People’s Education Press in China by
three additional years till August 2022.

/T/

/T/

Financial Highlights for the First Quarter Ended March 31, 2017
—————————————————————————-
First Quarter Ended March 31st 2017 2016
—————————————————————————-
Revenue $ 597,977 $ 756,858
—————————————————————————-
Operating expenses 269,618 262,922
—————————————————————————-
Income before amortization, share-based payments,
depreciation, finance charges and taxes 328,359 493,936
—————————————————————————-
Amortization, share-based payments, and depreciation 295,661 225,732
—————————————————————————-
Finance charges, taxes, foreign exchange 28,753 217,374
—————————————————————————-
Total expenses 594,032 706,028
—————————————————————————-
Net profit 3,945 50,830
—————————————————————————-
Total comprehensive income 3,727 111,788
—————————————————————————-
Earnings per share $ 0.00 $ 0.00
—————————————————————————-

/T/

/T/

— Revenue for the period ended March 31, 2017 totalled $597,977 as

compared to $756,858 in 2016, a 21% decrease.
— Operating expenses for the period ended March 31, 2017 totalled $269,618
compared to $262,922 in 2016
— Net profit for the period ended March 31, 2017 was $3,945 or $0.00 per
share (basic) based on 35.5 million weighted number of common shares as
compared to $50,830 for 2016 or $0.00 per share (basic) on 29.7 million
shares.
— Income before amortization, share-based payments, depreciation, finance
charges and taxes was $328,359 compared to $493,936 in 2016.

/T/

Balance Sheet as at March 31, 2017

/T/

— Cash and cash equivalents as at March 31, 2017 totalled $300,042 as

compared to $121,208 as at March 31, 2016, an increase of $178,834
— Current ratio improved to 3.67:1 for the period ended March 31, 2017 as
compared to 2.65:1 as at March 31, 2016.
— Total liabilities as at March 31, 2017 totalled $899,151 as compared to
$1,207,199 as at March 31, 2016, an improvement of $308,048 after loans
payable of $580,000 were repaid in full and retired.
— Book value improved to $6,448,760 as at March 31, 2017 as compared to
$4,737,605 as at March 31, 2016.

/T/

“Our on the ground presence with a new strategic hire in Mexico City is
gaining significant traction, aggressively signing up distributors, managing
sales channels and advancing our sales pipeline throughout Mexico and Central
America. At the same time, we continue our efforts through various initiatives
to expand our sales in Peru and Colombia. We are on the right track with a
very deep and active sales pipeline. Management also remains excited about the
proposed merger with Schoold, announced at the end March, and will be
providing an update in the coming weeks”, said Michael Kraft.

The unaudited condensed interim financial statements for the quarter ended
March 31, 2017 and Management Discussion & Analysis are available at
www.sedar.com.

About Lingo Media (TSX VENTURE: LM) (OTCQB: LMDCF)

Lingo Media is a global EdTech company that is ‘Changing the way the world
learns English’, developing and marketing products for learners of English
through various life stages, from classroom to boardroom. By integrating
education and technology, the company empowers English language educators to
easily transition from traditional teaching methods to digital learning.

Lingo Media provides both online and print-based solutions through two
distinct business units: ELL Technologies and Lingo Learning. ELL Technologies
provides online training and assessment for English language learning, while
Lingo Learning is a print-based publisher of English language learning
programs in China.

Lingo Media has formed successful relationships with key government and
industry organizations internationally, with a particularly strong presence in
Latin America and China, and continues to both extend its global reach and
expand its product offerings.

Follow Lingo Media On:

Facebook: https://www.facebook.com/LingoMedia
Twitter: @LingoMediaCorp
YouTube: https://www.youtube.com/lingomedialm
LinkedIn: https://www.linkedin.com/company/lingo-media-corporation
RSS: http://feeds.feedburner.com/LingoMedia

Portions of this press release may include “forward-looking statements” within
the meaning of securities laws. These statements are made in reliance upon
Sections 21E and 27A of the Securities Exchange Act of 1934, which involve
known and unknown risks, uncertainties or other factors that could cause
actual results to differ materially from the results, performance, or
expectations implied by these forward-looking statements. These statements are
based on management’s current expectations and involve certain risks and
uncertainties. Actual results may vary materially from management’s
expectations and projections and thus readers should not place undue reliance
on forward-looking statements. Lingo Media has tried to identify these
forward-looking statements by using words such as “may,” “should,” “expect,”
“hope,” “anticipate,” “believe,” “intend,” “plan,” “estimate” and similar
expressions. Lingo Media’s expectations, among other things, are dependent
upon general economic conditions, the continued and growth in demand for its
products, retention of its key management and operating personnel, its need
for and availability of additional capital as well as other uncontrollable or
unknown factors. No assurance can be given that the actual results will be
consistent with the forward-looking statements. Except as otherwise required
by US Federal securities laws, Lingo Media undertakes no obligation to
publicly update or revise any forward-looking statements, whether as a result
of new information, future events, changed circumstances or any other reason.
Certain factors that can affect the Company’s ability to achieve projected
results are described in the Company’s filings with the Canadian and United
States securities regulators available on www.sedar.com or
www.sec.gov/edgar.shtml.

NEITHER THE TSX VENTURE EXCHANGE NOR ITS REGULATION SERVICES PROVIDER (AS THAT
TERM IS DEFINED IN THE POLICIES OF THE TSX VENTURE EXCHANGE) ACCEPTS
RESPONSIBILITY FOR THE ADEQUACY OR ACCURACY OF THIS RELEASE

– END RELEASE – 29/05/2017

For further information:

For further information, contact:
Lingo Media
Michael Kraft
President & CEO
Tel: (+1) 416-927-7000 Ext. 23
Toll Free: 1-866-927-7011
Email: [email protected]
To learn more, visit us at www.lingomedia.com

COMPANY:
FOR: LINGO MEDIA CORPORATION
OTCQB Symbol: LMDCF
TSX VENTURE Symbol: LM

INDUSTRY: Media and Entertainment – Books and Publishing, Education and Training
– Education Aids and Products, Education and Training – Schools and
Courses, Colleges/Universities, Computers and Software – Software,
Education and Training – Training/Online

RELEASE ID: 20170529CC025

Press Release from Marketwired 1-866-736-3779

All press releases are written by the client and have NO affiliation with the news copy written by The Canadian Press. Any questions that arise due to the content or information provided in the press release should be directed to the company/organization
issuing the release, not to The Canadian Press.

GET ENERGYNOW’S DAILY EMAIL FOR FREE


Jura Announces Release of Interim Filings

FOR: JURA ENERGY CORPORATIONTSX VENTURE SYMBOL: JECDate issue: May 29, 2017Time in: 7:08 PM eAttention:
CALGARY, ALBERTA–(Marketwired – May 29, 2017) – Jura Energy Corporation (TSX
VENTURE:JEC) (“Jura”) today announced the filing on SEDAR of its cond…

GET ENERGYNOW’S DAILY EMAIL FOR FREE


Oilpatch recovery to boost Alberta, Saskatchewan growth, says Conference Board

CALGARY — The Conference Board of Canada says a slow recovery in the oil and gas sector will allow Alberta and Saskatchewan to emerge from recession and lead the provinces in economic growth this year.

In its spring provincial outlook, the board says Alberta will have the fastest growing economy this year after two years of contractions. Real GDP is forecast to increase by 3.3 per cent, thanks to startup of a new oilsands refinery near Edmonton and efforts to rebuild Fort McMurray after the 2016 wildfire.

Saskatchewan and British Columbia are expected to tie for second place at 2.5 per cent this year, based on stronger drilling numbers and labour markets in Saskatchewan and slower housing and forestry sectors in B.C.

The board says all provinces will grow this year except Newfoundland and Labrador which will shrink by 3.0 per cent before bouncing back in 2018 on new oil production at the Hebron offshore project.

Ontario is forecast to slow to 2.3 per cent in 2017 thanks to a slowing housing market in the southern part of the province, while Quebec will advance by 1.8 per cent on consumer spending boosted by tax cuts and job creation. Manitoba is to post 2.1 per cent growth.

Nova Scotia’s outlook is forecast to advance by just 0.5 per cent this year, while New Brunswick’s GDP growth is expected to hit 1.0 per cent and Prince Edward Island is to rise to 1.8 per cent on tourism and manufacturing sector.

“The difficulties in the resources sector are slowly dissipating and helping Alberta and Saskatchewan emerge out of recession. However, the turnaround is still in its early stages and a full recovery will take time,” said Marie-Christine Bernard, associate director of the provincial forecast for the board.

“Economic prospects are also improving across the country, but continued weakness in business investment—both in and out of the resources sector—could hurt economic growth in all provinces down the road.”

At the Alberta legislature Monday, Finance Minister Joe Ceci called the forecast “good news.”

“It shows that jobs are returning, confidence is returning to this province (and) recovery is in process,” said Ceci.

It was a sharp contrast to last week, when the Alberta government was hit with another credit downgrade. S&P Global Ratings reduced Alberta’s rating two notches, from AA to A-plus.

S&P cited concerns with provincial debt it expects will reach $94 billion by 2020.

Ceci said S&P’s recommendation for tax hikes or billions of dollars in cuts would not serve Albertans well as it digs out from financial problems caused by low oil prices.

“I like our plan,” said Ceci. “I think Albertans like our plan.”

The Canadian Press

GET ENERGYNOW’S DAILY EMAIL FOR FREE


Lonestar West Announces Q1 2017 Financial Results

FOR: LONESTAR WEST INC.
TSX VENTURE SYMBOL: LSI

Date issue: May 29, 2017
Time in: 6:44 PM e

Attention:

SYLVAN LAKE, ALBERTA–(Marketwired – May 29, 2017) – Lonestar West Inc. (TSX
VENTURE:LSI) today announced the financial results for the three month period
ended March 31, 2017.

The results for the quarter ended March 31, 2017 continue to reflect the impact
of the significant pricing pressure from the heightened competition for
non-energy related projects. There was an increase in the Canadian utilization
which did not translate into an increase in revenue as a result of the low
rates. The ongoing delay in contract negotiations with a major account in the
Unites States also had a direct impact on the Company overall. The focus of the
Company will be to continue to reduce operating costs and improve margins which
have suffered as a result of the low rates and higher costs.

Key points for the three months ended March 31, 2017 include:

/T/

— Revenues were $8,307,033 for the quarter ended March 31, 2017, compared

to $11,919,783 for the prior year comparable quarter.
— Gross margin(1) was 7.9% compared to 19.3% for the prior year comparable
quarter.
— Normalized EBITDAC(2) was $(296,736) compared to $891,813 for the prior
year comparable quarter.
— Normalized EBITDAC(3) per basic share was $(0.01) from $0.03 for the
prior year comparable quarter.
— Loss before taxes was $2,123,873 as compared to a loss before taxes of
$1,053,137 for the prior year comparable quarter.
— Loss for the period was $2,124,472 as compared to a Loss of $2,271,552
for the prior year comparable quarter.

/T/

“The results for the first quarter of 2017 did not reflect the efforts we made
to improve our profit margin. The cost cutting was completed by mid-March but
did not have sufficient time to realize the benefits, and the continued decline
of the revenues offset the impact of the cuts we have made. As a result we have
taken additional steps to continue making cuts throughout the organization.”
commented James Horvath, President and CEO of Lonestar. “We view the potential
acquisition by Clean Harbors, Inc. in a positive light and believe it is the
correct strategy for all stakeholders.”

The Company is continuing to intensify its focus on cost control while
maintaining superior service to its customer base. In addition, the Company is
continually assessing the location of its fleet and redeploys assets to areas
less impacted by the energy markets.

About Lonestar West

Based in Sylvan Lake, Alberta, Lonestar West Inc. operates a fleet of 137
Hydrovac, Vacuum and Auxiliary units throughout Western Canada, Ontario,
California, and the South Eastern United States. It is focused on profitably
growing its HVAC services to become a major competitor in the North American
market.

For more information please visit the Lonestar West website at
www.lonestarwest.com

CAUTIONARY STATEMENT REGARDING FORWARD-LOOKING INFORMATION

This News Release contains certain forward-looking statements and
forward-looking information (collectively referred to herein as
“forward-looking statements”) within the meaning of applicable Canadian
securities laws. All statements other than statements of present or historical
fact are forward-looking statements. Forward-looking statements are often, but
not always, identified by the use of words such as “anticipate”, “achieve”,
“could”, “believe”, “plan”, “intend”, “objective”, “continuous”, “ongoing”,
“estimate”, “outlook”, “expect”, “may”, “will”, “project”, “should” or similar
words, including negatives thereof, suggesting future outcomes. In particular,
this News Release contains forward-looking statements relating to: demand for
the Company’s services and general industry activity level; the Company’s
growth opportunities; and expectations regarding the Company’s revenue,
normalized EBITDAC and equipment utilization. Lonestar believes the
expectations reflected in such forward-looking statements are reasonable as of
the date hereof but no assurance can be given that these expectations will
prove to be correct and such forward-looking statements should not be unduly
relied upon.

Various material factors and assumptions are typically applied in drawing
conclusions. Specific material factors and assumptions include, but are not
limited to:

/T/

— Changes in industry conditions (including the levels of capital

expenditures made by oil and gas producers and explorers)
— Credit risk to which the Company is exposed in the conduct of its
business
— Fluctuations in prevailing commodity prices, currency and interest rates
— The competitive environment to which the business is, or may be, exposed
in all aspects of its business
— The ability of the Company to access equipment and new technologies
— The Company’s ability to maintain relationships with key suppliers
— The ability of the Company to attract and maintain key personnel and
other qualified employees
— Various environmental risks to which the Company is exposed in the
conduct of its operations
— Inherent risks associated with the conduct of the business in which the
Company operates
— Timing and costs associated with the acquisition of capital equipment
— The impact of weather and other seasonal factors that affect business
operations
— Availability of financial resources or third-party financing, and;
— The impact of new laws or changes in administrative practices on the
part of regulatory authorities.

/T/

Readers are cautioned that these factors are difficult to predict. Accordingly
readers are cautioned that the actual results achieved will vary from the
information provided herein and the variations may be material. Readers are
also cautioned that the list of factors above are not exhaustive. Before
placing reliance on any forward-looking statements to make decisions with
respect to an investment in securities in Lonestar, prospective investors and
others should carefully consider the factors identified above and other risks,
uncertainties and potential changes that may cause actual results or events to
differ materially from those anticipated in such forward-looking statements.

Forward-looking statements are not a guarantee of future performance and
involve a number of risks and uncertainties, some of which are described
herein. Such forward-looking statements necessarily involve known and unknown
risks and uncertainties, which may cause Lonestar’s actual performance and
financial results in future periods to differ materially from any projections
of future performance or results expressed or implied by such forward-looking
statements. These risks and uncertainties include, but are not limited to, the
risks identified in Lonestar’s annual information form and management
discussion and analysis for the year ended December 31, 2016 (the “MD&A”),
which are available for viewing on SEDAR at www.sedar.com. In addition, the
forward-looking statements contained in this News Release are made as of the
date of this News Release. Lonestar does not undertake any obligation to
publicly update or to revise any forward-looking statements except as expressly
required by applicable securities laws. The forward-looking statements
contained in this Press Release are expressly qualified by the cautionary
statements contained herein.

Notes:

/T/

1. Gross margin is calculated as gross profit as a percentage of revenues
2. This News Release contains the term Normalized EBITDAC as presented and

does not have any standardized meaning prescribed by international
financial reporting standards (“IFRS”) and therefore it may not be
comparable with the calculation of similar measures for other entities.
Management uses normalized EBITDAC to analyze the operating performance
of the business. Normalized EBITDAC as presented is not intended to
represent cash provided by operating activities, net earnings or other
measures of financial performance calculated in accordance with IFRS. It
is defined as Earnings before interest, taxes, depreciation,
amortization, and stock based compensation excluding foreign exchange
gains or losses which are primarily related to the US dollar activities
of the Company and can vary significantly depending on exchange rate
fluctuations, which are beyond the control of the Company.
3. Normalized EBITDAC per share is calculated as Normalized EBITDAC divided
by the weighted average shares outstanding for the period.

/T/

NEITHER THE TSX VENTURE EXCHANGE NOR ITS REGULATION SERVICES PROVIDER (AS THAT
TERM IS DEFINED IN THE POLICIES OF THE TSX VENTURE EXCHANGE) ACCEPTS
RESPONSIBILITY FOR THE ADEQUACY OR ACCURACY OF THIS RELEASE.

– END RELEASE – 29/05/2017

For further information:
James Horvath
President & CEO
Phone: 403-887-2074
[email protected]

COMPANY:
FOR: LONESTAR WEST INC.
TSX VENTURE SYMBOL: LSI

INDUSTRY: Energy and Utilities – Oil and Gas
RELEASE ID: 20170529CC0065

Press Release from Marketwired 1-866-736-3779

All press releases are written by the client and have NO affiliation with the news copy written by The Canadian Press. Any questions that arise due to the content or information provided in the press release should be directed to the company/organization
issuing the release, not to The Canadian Press.

GET ENERGYNOW’S DAILY EMAIL FOR FREE


Nominations for Small Business Week Calgary Awards Now Open

May 29, 2017 Nominations are Now Open for the 2017 Small Business Week Calgary Awards CALGARY – As a way to help businesses in a challenging economic time and to celebrate the best of business in Calgary, the Chamber is pleased to announce that nominations for this year’s Small Business Week Calgary Awards are now … Read more

GET ENERGYNOW’S DAILY EMAIL FOR FREE


Changfeng Announces First Quarter Financial Results for the Three Months Ended March 31, 2017

FOR: CHANGFENG ENERGY INC.
TSX VENTURE SYMBOL: CFY

Date issue: May 29, 2017
Time in: 6:18 PM e

Attention:

TORONTO, ONTARIO–(Marketwired – May 29, 2017) – Changfeng Energy Inc., (TSX
VENTURE:CFY) (“Changfeng” or the “Company”) announces that the Company has
filed its unaudited condensed interim consolidated financial results for the
first quarter ended March 31, 2017. The Company states that revenue had
increased 25%, gross margin increased 13% and net profit was also increased by
11% for the three months ended March 31, 2017 with compared to the same period
of 2016. The unaudited condensed interim consolidated financial results and
Management’s Discussion and Analysis can be downloaded from www.SEDAR.com or
from the Company’s website at www.changfengenergy.com.

Summary of the First Quarter of 2017 Condensed Consolidated Financial Results

/T/

—————————————————————————-

CAD’000 (For information
RMB’000 purposes and unaudited)
except
percentages Three months Three months
and per share ended ended
amounts Mar. 31 Mar. 31
2017 2016 Change % 2017 2016 Change %
——————————————— ——————————
Revenue 96,746 77,095 19,651 25% 18,585 16,198 2,387 15%
——————————————— ——————————
Gross profit 45,841 40,488 5,353 13% 8,806 8,506 300 4%
——————————————— ——————————
Profit for the
period 11,128 9,993 1,135 11% 2,138 2,100 38 2%
——————————————— ——————————
EBITDA (1) 24,177 23,802 375 2% 4,644 5,138 (494) -10%
—————————————————————————-
—————————————————————————-
Note:
(1) See Non-IFRS Financial Measures in this Press Release

/T/

Revenue for the three months ended March 31, 2017 was RMB96.7 million, an
increase of RMB19.7 million, or 25%, from RMB77.1 million for the same period
of 2016. This increase was mainly due to increases in gas sales and pipeline
installation and connection, as well as the sales from the newly added CNG
vehicle refueling station in Sanya City since May 2016.

Gas sales revenue for the three months ended March 31, 2017 was RMB60.2
million, an increase of RMB13.1 million or 28%, from RMB47.1 million for the
same period of 2016. The increase was mainly attributable to:

/T/

— the gas sales volume increased by 19% for Sanya region;
— the gas sales volume growth of 296% in Xiangdong district.

/T/

Pipeline installation and connection revenue for the three months ended March
31, 2017 was RMB23.0 million, an increase of RMB0.7 million or 3%, from RMB22.3
million for the same period of 2016. The increase was mainly attributable to:

/T/

— comparatively higher number of new commercial customers connected in

Xiangdong Region during the first three months ended March 31, 2017,
which was in a total of 7, an increase of 4 or 133%, from 3 for the same
period of 2016;
— significant higher number of new residential customers connected in
Xiangdong Region during the first three months ended March 31, 2017,
which was in a total of 406, an increase of 259 or 176%, from 147 for
the same period of 2016
— offset by a big drop in both residential and commercial customers
connected during the first three months ended March 31, 2017 in Sanya
Region, 1,292 newly connected residential customers, dropped from 5,107
or 75%, and 11 newly connected commercial customers, dropped from 16 or
31%, for the same period of 2016, resulting in only slight increase in
revenue of RMB0.6 million or 3% in Sanya Region.

/T/

Total revenue from CNG refueling retail stations for the three months ended
March 31, 2017 was RMB13.5 million, an increase of RMB5.8 million, or 76%, from
RMB7.7 million for the same period of 2016. Sales revenue for Changsha CNG
station dropped to RMB6.1 million, a decrease of RMB1.6million or 20%, from
RMB7.7 million for the same period of 2016. The drop was mainly due to local
market competition thus a dropped sales volume of 1.6 million m3, a decrease of
0.4 million m3 or 20%, from 2.0 million m3 for the same period of 2016. Sales
revenue from new Sanya CNG/LNG refueling retail station, which commenced its
operation in May 2016, was RMB7.4 million for the three months ended March 31,
2017, and the sales volume was 1.4 million m3.

Gross margin for the three months ended March 31, 2017 was RMB45.8 million, an
increase of RMB5.3 million, or 13%, from RMB40.5 million for the same period of
2016. The gross margin percentage of 47% for the three months ended March 31,
2017 was decreased from that of 53% for the same period of 2016.

General and administrative expenses for the three months ended March 31, 2017
were RMB18.4million, an increase of RMB4.1 million, or 28%, from RMB14.3
million for the same period of 2016. And as a percentage of sales, it is 19%
for the three months ended March 31, 2017 and 19% for the same period of 2016.

Selling and marketing expenses for the three months ended March 31, 2017 were
RMB5.8 million, an increase of RMB0.1 million, or 3%, from RMB5.7 million for
the same period of 2016. And there is a decrease as a percentage of sales to 6%
for the three months ended March 31, 2017 from 7% for the same period of 2016.
These expenses normally fluctuate with travel and business development
activities in mainland China as the Company seeks to develop new projects in
close proximity to the new national pipelines.

Net profit for the three months ended March 31, 2017 was RMB11.1 million, or
RMB0.18 per share (basic) and RMB 0.17 per share (diluted) compared to RMB10.0
million or RMB0.16 per share (basic and diluted) for the same period of 2016.

EBITDA (non-IFRS measure as identified and defined under section “Non-IFRS
Measures”) for the three months ended March 31, 2017 was RMB24.2 million, an
increase of RMB0.4 million, or 2%, from RMB23.8 million for the same period of
2016. EBITDA as a percentage of revenue for the three months ended March 31,
2017 was 25%, dropped from 31% for the same period of 2016.

Financial Position

Cash increased by RMB39.8 million to RMB182.2 million at March 31, 2017 from
RMB142.4 million at December 31, 2016. Cash change mainly originated from cash
inflow provided by operating activities of RMB37.6 million, and cash inflow of
RMB11.8 million from financing activities, but offset by cash outflow of RMB9.4
million used in investing activities.

Net cash provided by operations was RMB37.6 million for the three months ended
March 31, 2017 compared to RMB3.2 million for the same period of 2016.

Cash from financing activities during the three months ended March 31, 2017
primarily included cash withdrawals of RMB20.0 million from long term bank loan
and RMB14.0 million from short term bank loan, offsetting by repayments of
RMB2.3 million for long-term loan and of RMB20.0 million for bank indebtedness.

Cash used in investing activity included capital expenditures of RMB 0.6
million for deposit and RMB8.8 million for acquisition of property and
equipment for the three months ended March 31, 2017 compared to RMB9.9 million
for the same period of 2016. The capital expenditures were mainly related to
the purchase of equipment and on-going construction of pipeline networks to
connect new customers in the Sanya region and Xiangdong.

Changfeng will finance the majority of the upcoming construction of projects
under development in mainland China through its long-term bank loans with the
BOC, Sanya and BOC, Pingxiang, as well as operating cash flow from its existing
operations.

Non-IFRS Financial Measures

The Company uses certain financial measures that do not have any standardized
meaning prescribed by IFRS. Therefore, these financial measures may not be
comparable to similar measures presented by other issuers. Investors are
cautioned that these measures should not be construed as alternatives to net
income or to cash provided by operating, investing, and financing activities
determined in accordance with IFRS, as indicators of its performance. Changfeng
provide these measures to assist investors in determining its ability to
generate income and cash provided by operating activities and to provide
additional information on how these cash resources are used. These measures are
listed and defined below:

EBITDA

EBITDA is defined herein as income before income tax expense, interest expense,
depreciation and amortization, share of loss of investment in associate and
joint venture, as well as non-cash stock-based compensation expense. EBITDA
does not have any standardized meaning prescribed by IFRS and therefore may not
conform to the definition used by other companies.

A reconciliation of net income to EBITDA for each of the periods presented in
this MD&A as follows:

/T/

—————————————————————————-
In RMB’000 Q1 2017 Q1 2016 Change Change%
(except for % figures)
—————————————————————————-
Profit for the period 11,128 9,993 1,135 11%
Add (less):
Income tax 7,344 6,902 442 6%
Interest (income) loss (185) (79) (106) 133%
Share of loss of an associate 1 2 (1) -50%
Share of loss of a joint venture 0 590 (590) -100%
Amortization 4,134 3,941 193 5%
Interest on borrowing 1,755 2,453 (698) -28%
—————————————————————————-
EBITDA 24,177 23,802 375 2%
—————————————————————————-

/T/

Subsequent Event

On May 25, 2017, the Board of Directors of the Company (with Mr. Huajun Lin
(“Mr. Lin”) abstaining) approved a proposal to repay the loans advanced by Mr.
Lin to the Company with a cash payment of RMB 36.0 million (the “Cash
Payment”), subject to approval of the shareholders of the Company. In addition,
the Company has the right to request that Mr. Lin, directly or indirectly,
subscribe for common shares of the Company in an amount equal to the Cash
Payment if the Company’s common shares are not listed on the Hong Kong Stock
Exchange by June 30, 2019, at a price equal to the volume weighted average
price of the common shares of the Company on the TSX-V (or any other exchange
on which such common shares are then trading (collectively the “Exchange”)) for
the 30 trading days immediately prior to June 30, 2019, subject to the approval
of the Exchange.

Additional details regarding the proposal will be included in the Company’s
management information circular for the upcoming annual and special meeting of
shareholders of the Company, to be held on June 30, 2017 at 10 a.m.

About Changfeng Energy Inc.

Changfeng Energy Inc. is a natural gas service provider with operations located
throughout the People’s Republic of China. The Company services industrial,
commercial and residential customers, providing them with natural gas for
heating purposes and fuel for transportation. The Company has developed a
significant natural gas pipeline network as well as urban gas delivery
networks, stations, substations and gas pressure regulating stations in Sanya
City & Haitang Bay. Through its network of pipelines, the Company provides safe
and reliable delivery of natural gas to both homes and businesses. The Company
is headquartered in Toronto, Ontario and its shares trade on the Toronto
Venture Exchange under the trading symbol “CFY”. For more information, please
visit the Company website at www.changfengenergy.com

Forward-Looking Statements

Information set forth in this news release may involve forward-looking
statements under applicable securities laws, including, without limitation,
statements with respect to the proposal to repay the loans and the Company’s
right to request that Mr. Lin subscribe for common shares of the Company. The
forward-looking statements contained herein are expressly qualified in their
entirety by this cautionary statement. The forward-looking statements included
in this document are made as of the date of this document and the Company
disclaims any intention or obligation to update or revise any forward-looking
statements, whether as a result of new information, future events or otherwise,
except as expressly required by applicable securities legislation. Although
Management believes that the expectations represented in such forward- looking
statements are reasonable, there can be no assurance that such expectations
will prove to be correct, as actual results and future events could differ
materially from those anticipated in such statements. The forward-looking
statements contained in this press release are based on certain assumptions,
including, but not limited to the following: the Company has sufficient cash on
hand to make the Cash Payment, the Company would remain solvent following the
Cash Payment, the stability of general economic and market conditions, currency
exchange rates and interest rates, and that the risk factors the Company is
subject to, collectively, do not have a material adverse impact on the Company.
Such forward-looking statements involve known and unknown risks, uncertainties,
assumptions and other factors that may cause the actual results, performance or
achievements to differ materially from the anticipated results, performance or
achievements or developments expressed or implied by such forward-looking
statements, including the risk factors set forth in the Company’s securities
filings with the Canadian securities regulators. This news release does not
constitute an offer to sell or solicitation of an offer to buy any of the
securities described herein and accordingly undue reliance should not be put on
such.

Neither TSX Venture Exchange nor its Regulation Services Provider (as that term
is defined in the policies of the TSXV) accepts responsibility for the adequacy
or accuracy of this release.

– END RELEASE – 29/05/2017

For further information:
Mr. Yan Zhao CPA, CA
Chief Financial Officer
647.313.0066
[email protected]
OR
Ms. Ann S.Y. Lin
VP, Corporate Development and Corporate Secretary
647.313.0066
[email protected]

COMPANY:
FOR: CHANGFENG ENERGY INC.
TSX VENTURE SYMBOL: CFY

INDUSTRY: Energy and Utilities – Oil and Gas
RELEASE ID: 20170529CC0064

Press Release from Marketwired 1-866-736-3779

All press releases are written by the client and have NO affiliation with the news copy written by The Canadian Press. Any questions that arise due to the content or information provided in the press release should be directed to the company/organization
issuing the release, not to The Canadian Press.

GET ENERGYNOW’S DAILY EMAIL FOR FREE


Raise Production Inc. Announces Granting of Stock Options

FOR: RAISE PRODUCTION INC.TSX VENTURE SYMBOL: RPCDate issue: May 29, 2017Time in: 4:47 PM eAttention:
CALGARY, ALBERTA–(Marketwired – May 29, 2017) – Raise Production Inc. (TSX
VENTURE:RPC) (“Raise” or the “Company”) announces that it has granted 1,1…

GET ENERGYNOW’S DAILY EMAIL FOR FREE


Weekly Canadian Oil & Gas Industry Highlights – May 29, 2017

May 29, 2017 Presented by POIM Consulting Group Major /Interesting Projects Shell Canada Limited 4 new facility license in the KAYBOB area. RMP Energy Inc adding Compression to existing facility Elmworth 02-23-068-03W6 Plains Midstream Canada large Flare project at existing gas plant 02-23-055-22W4 PENGROWTH Energy Corporation large Bitumen satellite 2-24-58-5 W4 ARC Resources Ltd 4 … Read more

GET ENERGYNOW’S DAILY EMAIL FOR FREE


Husky Oil to proceed with West White Rose project off Newfoundland:’A happy day’

ST. JOHN’S, N.L. — One of the largest oil developments to be approved in Canada this year lit up Newfoundland and Labrador’s bleak economic outlook as Husky Energy announced an expanded West White Rose project.

“It’s a happy day,” Malcolm Maclean, senior Atlantic vice-president for Husky (TSX:HSE), told reporters Monday. There will be hundreds of jobs plus royalties, equity and tax benefits expected to top $3 billion for a province that has reeled since the oil price collapse.

“We’d like to start work almost immediately.”

The $2.2-billion project is to produce first oil in 2022, using a fixed wellhead platform tied to the SeaRose floating production, storage and offloading vessel about 350 kilometres east of St. John’s, N.L.

Peak production is estimated to reach rates of about 75,000 barrels per day by 2025.

“Increasing the amount of oil that we thought we could recover from the platform helped the economics,” Maclean said of a project that’s now larger than when the company delayed it in 2014 as oil prices tanked.

Brent crude fell from US$115 a barrel in mid-2014 to below US$30 before rebounding. It was trading Monday at around US$52.

“We’re confident we can recover more than twice the oil that was originally expected to be recovered from the field in 2005,” Maclean said. That initial amount was estimated at 230 million barrels.

“We’ve always liked our operations in the White Rose field and we see it becoming bigger and bigger,” Maclean said. The location and set-up allow for easier shipments, he added.

“Recently cargoes have been going from Newfoundland and Labrador to as far away as China. Western Canada has got issues with pipeline capacity which, fortunately, we don’t have.”

The new wellhead will be designed to last at least 25 years and could have another use: Husky also announced Monday an additional discovery well drilled about 11 kilometres from the SeaRose vessel.

The Northwest White Rose shows a light oil column of more than 100 metres. Maclean was tight-lipped otherwise, saying the company is still assessing the size of the find.

Premier Dwight Ball said construction on the concrete gravity structure will start in Argentia, N.L., this year. It will employ at least 700 people at peak, he said. Design and building of the accommodation module, helideck, life boat stations and flare boom will add hundreds more jobs, he said.

Maclean said the topsides will be built, as negotiated in 2013, in the Gulf of Mexico. A contractor has not been named.

Ball believes there is much more oil off Newfoundland to tap: “Our future is bright.”

Environmental activists say such reserves should be left in the ground in favour of cleaner energy sources. The province is building the $11.7-billion Muskrat Falls hydro project in Labrador but is also intent on exploiting its offshore oil.

“We have a world right now that still uses oil, still uses petroleum products,” Ball said. 

Last year’s call for bids by the Canada-Newfoundland and Labrador Offshore Petroleum Board drew eight bidders that committed to exploration work worth almost $758 million. Of eight parcels awarded, four were in the newly identified West Orphan Basin, two in the Flemish Pass Basin and two in the Jeanne D’Arc Basin where the White Rose, Hibernia and Terra Nova sites already operate.

First oil from the new Hebron development is to flow later this year.

Husky said incremental operating costs at West White Rose are expected to be less than $3 per barrel over the first 10 years with the tie-back to the SeaRose operation. It’s expected to create about 250 permanent platform jobs once operational.

“After much delay, it’s wonderful to see this happen here,” said Andrew Bell, chairman of the Newfoundland and Labrador Oil & Gas Industries Association.

“Not a lot of projects are getting sanctioned globally.”

Ivan Gedge, regional manager of the Atlantic Canada Regional Council of Carpenters, Millwrights and Allied Workers, said work at Argentia will help fill a major gap left as construction of the Hebron development wrapped up earlier this year. It will mean pay cheques for at least three years, he told reporters Monday.

“Hopefully it will keep people in the province, and keep our tradespeople working.”

Follow @suebailey on Twitter.

Sue Bailey, The Canadian Press

GET ENERGYNOW’S DAILY EMAIL FOR FREE


Navigating the Future of Unconventional Resources – NextShale 2017

By Knorr, P. Nakutnyy, P. Luo, Saskatchewan Research Council Saskatchewan was ranked first in Canada, and fourth in the world, for petroleum exploration and development investment potential, according to the Fraser Institute’s 2016 Annual Global Petroleum Survey. Much of the petroleum exploration and production activities take place in the province’s unconventional oil reservoirs located In the … Read more

GET ENERGYNOW’S DAILY EMAIL FOR FREE


‘Sign of the times’ as Hydro One Brampton rebrands

FOR: ALECTRA INC.
Date issue: May 29, 2017Time in: 12:01 PM eAttention:
Alectra Utilities working to be an ally to Brampton electricity customers
BRAMPTON, ON –(Marketwired – May 29, 2017) – The replacement of the familiar
Hydro One Brampton sign at…

GET ENERGYNOW’S DAILY EMAIL FOR FREE


CSE: 2017-0524 – Delist – Outrider Energy Corp. (MCF)

FOR: CANADIAN SECURITIES EXCHANGE (CSE)
Date issue: May 29, 2017Time in: 11:56 AM eAttention:
TORONTO, ONTARIO–(Marketwired – May 29, 2017) – The common shares of Outrider
Energy Corp. will be delisted at the market close, May 30, 2017.
Upon completi…

GET ENERGYNOW’S DAILY EMAIL FOR FREE


Primeline Completes Settlement of Zhejiang Gas and COSL Disputes

FOR: PRIMELINE ENERGY HOLDINGS INC.TSX VENTURE SYMBOL: PEHDate issue: May 29, 2017Time in: 9:08 AM eAttention:
HONG KONG, CHINA–(Marketwired – May 29, 2017) –
NOT FOR DISTRIBUTION TO U.S. NEWS WIRES SERVICES, OR DISSEMINATION IN THE
UNITED STATES.
Pr…

GET ENERGYNOW’S DAILY EMAIL FOR FREE


GrowMax Resources Announces First Quarter 2017 Results and New Director Nominees

FOR: GROWMAX RESOURCES CORP.
TSX VENTURE SYMBOL: GRO

Date issue: May 29, 2017
Time in: 8:00 AM e

Attention:

Working Capital of $46.6 million as at March 31, 2017

CALGARY, ALBERTA–(Marketwired – May 29, 2017) – GrowMax Resources Corp. (the
“Company” or “GrowMax Resources”) (TSX VENTURE:GRO) announces that it has filed
its condensed interim consolidated financial statements and Interim MD&A –
Quarterly Highlights relating to its first quarter 2017 results. These filings
can be accessed on SEDAR’s website at www.sedar.com and on the Company’s
website at www.growmaxcorp.com. In addition, the Company announces further
details regarding the extension and modification of its commitments related to
the Bayovar Property in Peru, and details of the Company’s upcoming annual and
special meeting of common shareholders, at which the Company intends to propose
two new directors for election, both with significant fertilizer industry
experience.

Stephen Keith, President of GrowMax Resources, stated, “We are pleased to
report that in addition to progressing our potash and phosphate projects in
Peru, we were able to limit spending in Q1/17 while monetizing non-core
available-for-sale financial assets, allowing us to increase our cash and
equivalents on hand to approximately $46.4 million as at March 31, 2017. The
Company’s strong working capital balance combined with the progress we continue
to make on our core Peruvian fertilizer assets has helped us to attract strong
new board members, which we believe further strengthens our positioning and
ability to execute our strategy of becoming a leading producer of potash and
phosphate fertilizer products in Peru.”

SUMMARY OF SELECTED FINANCIAL AND OPERATIONAL HIGHLIGHTS

The following Summary of Selected Financial and Operational Highlights have
been derived from the condensed interim consolidated financial statements and
Interim MD&A – Quarterly Highlights. Readers are encouraged to review the
entire condensed interim consolidated financial statements and Interim MD&A –
Quarterly Highlights. All amounts are in Canadian dollars unless otherwise
stated.

/T/

($ in thousands) March 31, 2017 December 31, 2016
—————————————————————————-
—————————————————————————-

Cash and cash equivalents $ 46,390 $ 42,896
Working capital(1) $ 46,637 $ 49,634

Three months ended March 31
2016
($ in thousands) 2017 Restated(2)
—————————————————————————-
—————————————————————————-
General and administrative expenses
(excluding stock-based compensation and
depreciation) $ (822) $ (970)

Foreign exchange gain (loss) $ (593) $ (998)

Capital expenditures, net $ (1,430) $ (1,727)

/T/

See notes (1) and (2) further below.

Bayovar Property Transfer Agreement Extension

In May 2017, a two-year extension and modification to the Company’s commitments
pursuant to the transfer agreement was approved. As a result, the following
commitments related to the project are outstanding as of the current date:

/T/

— Complete a revised economic study by March 2018;
— Commence production by May 2019;
— Payment of US$0.5 million payable over two years to a Peruvian state-

owned company, half of which will be distributed by the Peruvian state-
owned company to the local community;
— Produce a minimum of 70% of the annual sales volume set forth in the
applicable economic study; and
— Invest a minimum of US$19.8 million in the project from May 2016 to May
2019, of which the Company estimates that it has fulfilled approximately
US$3.9 million up to May 2017.

/T/

GrowMax Resources is focused on working towards reaching these commitments and
moving forward on the Bayovar Project.

Directors and Meeting of Common Shareholders

GrowMax is pleased to announce that the Company’s annual and special meeting of
common shareholders will be held at 3:00 P.M. (Calgary Time) on June 28, 2017
at The Metropolitan Centre, 333 – 4th Avenue S.W., Calgary, Alberta (the
“Shareholders Meeting”). A Notice of Meeting and Management Information
Circular (“Information Circular”) setting out the items of business as well as
other regulatory disclosures will be mailed to all shareholders of record as at
May 23, 2017. Shareholders are encouraged to attend the Shareholders Meeting in
person or to submit their proxies and voting instruction forms in the manner
set out in the Information Circular.

At the Shareholders Meeting, two new directors, Mr. John Van Brunt and Mr.
Stephen Paxton, are being proposed for election as directors of the Company.
Mr. Ken Geren elected not to stand for re-election as a director.

Mr. John Van Brunt is a chemical engineer and fertilizer industry executive
with more than 40 years of experience in the production and distribution of
agricultural products. He was a director of Rio Verde Minerals Development
Corporation from 2011 to the spring of 2013. Mr. Van Brunt was the Chief
Executive Officer of Agrium Inc. from 1993 until his retirement in September
2003. Prior thereto, he was the President of Cominco Fertilizers from 1991 to
2003. He has served on the Executive Committee of the International Fertilizer
Association (“IFA”) located in Paris between 2003 and 2005 and as the President
of the IFA from 2003 to 2005. Mr. Van Brunt has also served on the board of
directors of several private and public companies involved in the fertilizer
industry.

Mr. Steven Paxton is a former senior executive with The Mosaic Company and
predecessor companies and has over 35 years of global fertilizer sales and
marketing management experience. Mr. Paxton is currently a director of JDC
Phosphates, a private phosphate technology development company since March
2014. Prior thereto, Mr. Paxton was Vice President International Sales for The
Mosaic Company between October 2004 and June 2010 during which time he also
served as President and Director of the Phosphate Chemical Export Association
(PhosChem). During his 35 year tenure as an industry executive, he also served
on several boards of directors including the Canadian Potash Export
Association, Coromandel Fertilizer Pty. Ltd, Chinhae Chemical Company and IMC
Pacific Limited. He served as a phosphate industry consultant to the United
States Trade Representative for WTO negotiations with China. Mr. Paxton
graduated with a Bachelor of Science in Marketing from Indiana State University
in 1974, and from the Advanced Management Program at Northwestern University’s
Kellogg Graduate School of Business in 1998.

Abby Badwi, Executive Chairman, commented, “We are very pleased to have Mr. Van
Brunt and Mr. Paxton agreeing to join our board. Their vast collective
experience in the fertilizer business will be most valuable for the Company and
its forward growth plans. The board of GrowMax and I would also like to thank
Mr. Ken Geren for his time and effort as director of the Company since June
2015. His involvement in re-organizing the Company and its future direction was
very valuable.” Mr. Geren commented, “It has been my pleasure to serve on
GrowMax Resources’ board of directors. When I joined the board, my intention
was to help better align management and shareholder interests. I believe this
has largely been achieved. With the potential addition of two extremely strong
board members, which add valuable fertilizer industry experience, I am
comfortable stepping down from my position at this time.”

The Company would like to congratulate its director, Mr. Rakesh Kapur, Joint
Managing Director, Indian Farmers Fertiliser Cooperative Limited (IFFCO), on
being elected the Chairman of the International Fertilizer Association (“IFA”)
at IFA’s recent Annual Conference. Paris based IFA is the global Fertilizer
Association having approximately 500 Members Worldwide representing 68
countries.

Notes:

/T/

1. Working capital is calculated as current assets (March 31, 2017 – $48.7

million; December 31, 2016 – $52.4 million) less current liabilities
(March 31, 2017 – $2.1 million; December 31, 2016 – $2.8 million).
Working capital is a non-GAAP measure and is calculated as current
assets less current liabilities. Working capital is used to assess
liquidity and general financial strength. Working capital does not have
a standardized meaning prescribed by IFRS. It is unlikely for non-GAAP
measures to be comparable to similar measures presented by other
companies. Working capital should not be considered an alternative to,
or more meaningful than current assets or current liabilities as
determined in accordance with IFRS.
2. Restated to reflect discontinued operations. See note 17 of the March
31, 2017 condensed interim consolidated financial statements for further
information.

/T/

About GrowMax Resources Corp.

GrowMax Resources Corp. is a publicly listed Canadian company (Ticker GRO on
TSX-V) focused on exploration and development of phosphate and potassium-rich
brine resources on its Bayovar Property, which is located in the Sechura Desert
in northwestern Peru. The Company’s vision is to become a leading producer of
phosphate and potash fertilizer products in Peru.

GrowMax Resources owns approximately 92% of GrowMax Agri Corp., a private
company that owns 100% of the Bayovar Property, which currently covers
approximately 227,000 gross acres. The Indian Farmers Fertiliser Co-operative
Limited (IFFCO) and its affiliates own approximately 8% of GrowMax Agri Corp.

Forward-Looking Information

Certain statements contained in this Press Release may constitute
“forward-looking information” as such term is used in applicable Canadian and
US securities laws. Any information or statements contained herein that express
or involve discussions with respect to predictions, expectations, plans,
projections, objectives, assumptions or future events should be viewed as
forward-looking information. Such information relate to analyses and other
information that are based upon forecasts of future results, estimates of
amounts not yet determinable and assumptions of management. Such
forward-looking information involve known and unknown risks, uncertainties and
other factors which may cause the actual results, performance or achievements
of the Company to be materially different than those results, performance or
achievements expressed or implied by such forward-looking information.

In particular, statements (express or implied) contained herein or in the
Company’s Interim MD&A – Quarterly Highlights regarding the following should be
considered as forward-looking information: the Company’s goals, growth, plans,
strategy and objectives; progress on the Company’s assets; the Company’s
positioning and ability to execute its strategy of becoming a leading produce
of potash and phosphate fertilizer projects in Peru; the reaching of the
Company’s commitments and moving forward on the Bayovar Project; and the
election of new board members.

Additional forward-looking information is contained in the Company’s Interim
MD&A – Quarterly Highlights, and reference should be made to the additional
disclosures of the assumptions, risks and uncertainties relating to such
forward-looking information in that document.

There is no assurance that such forward-looking information will prove to be
accurate as actual results and future events could vary or differ materially
from those anticipated in such statements. Accordingly, readers should not
place undue reliance on forward looking statements contained in this Press
Release. This cautionary statement expressly qualifies the forward-looking
statements contained herein and in the Interim MD&A – Quarterly Highlights.

Forward-looking information is based on management’s beliefs, expectations,
estimates and opinions on the date statements are made and the Company
undertakes no obligation to update forward-looking information and whether the
beliefs, expectations, estimates and opinions upon which such forward-looking
information is based has changed, except as required by applicable law.

NEITHER THE TSX VENTURE EXCHANGE NOR ITS REGULATION SERVICES PROVIDER (AS THAT
TERM IS DEFINED IN THE POLICIES OF THE TSX VENTURE EXCHANGE) ACCEPTS
RESPONSIBILITY FOR THE ADEQUACY OR ACCURACY OF THE RELEASE.

– END RELEASE – 29/05/2017

For further information:
GrowMax Resources Corp.
Stephen Keith
President
+1 647 299 0046
www.growmaxcorp.com

COMPANY:
FOR: GROWMAX RESOURCES CORP.
TSX VENTURE SYMBOL: GRO

INDUSTRY: Agriculture – Farming, Energy and Utilities – Oil and Gas
RELEASE ID: 20170529CC0013

Press Release from Marketwired 1-866-736-3779

All press releases are written by the client and have NO affiliation with the news copy written by The Canadian Press. Any questions that arise due to the content or information provided in the press release should be directed to the company/organization
issuing the release, not to The Canadian Press.

GET ENERGYNOW’S DAILY EMAIL FOR FREE


Carlaw Capital V Corp. Announces Qualifying Transaction

FOR: CARLAW CAPITAL V CORP.TSX VENTURE SYMBOL: CVC.PDate issue: May 29, 2017Time in: 7:40 AM eAttention:
TORONTO, ONTARIO–(Marketwired – May 29, 2017) – Carlaw Capital V Corp.
(“Carlaw” or the “Corporation”) (TSX VENTURE:CVC.P) is pleased to announce…

GET ENERGYNOW’S DAILY EMAIL FOR FREE


Q1 2017 Results Published

FOR: PETROMAROC CORPORATION PLC
TSX VENTURE SYMBOL: PMA

Date issue: May 29, 2017
Time in: 4:00 AM e

Attention:

TORONTO, ONTARIO–(Marketwired – May 29, 2017) – PetroMaroc Corporation plc
(TSX VENTURE:PMA), an independent oil and gas company focused on Morocco (the
“Company” or “PetroMaroc”) is pleased to announce its financial and operating
results for the first quarter of 2017.

Commenting, D. Campbell Deacon, Chief Executive Officer of PetroMaroc, said:
“In early January 2017, the Company completed the sale and purchase agreement
with Sound Energy plc (“Sound Energy”), following which, PetroMaroc’s ownership
of consideration shares in Sound Energy enable the Company to be positioned to
leverage off Sound Energy’s operating capability in country and balance sheet
whilst retaining material upside with the Sidi Moktar Net Profit Interests. On
May 17, Sound Energy announced a rig has arrived at Sidi Moktar. Sound Energy
plan to complete a 2 stage workover through May 2017 – June 2017, which will
include (i) completion, perforation and testing of the Lower Liassic in Koba-1
and possible additional testing of the Argovian in Koba-1, and (ii) completion,
perforation and testing of the Lower Liassic in Kamar-1 and possible additional
testing of the Dogger in Kamar-1. Should the wells deliver a commercial flow
rate, Sound Energy will complete an Extended Well Test and assuming a
successful test, target first commercial gas to the domestic market, around the
end of 2017. …During Q1 2017, general and administrative costs totalled
US$0.20 million, representing a 79% decrease in comparison to 2016 (US$0.95
million), and a 61% decrease in comparison to 2015 (US$0.54 million).”

During the quarter the Company successfully executed settlement agreements with
almost all of its unsecured creditors.

PetroMaroc today filed its financial statements for the quarter ended March 31,
2017, together with its Management’s Discussion and Analysis in respect of the
Company’s financial results for the quarter ended March 31, 2017. These
documents are available on the PetroMaroc website at www.petromaroc.co or under
the Company’s profile on SEDAR at www.sedar.com.

Highlights

Financial:

/T/

— Unrestricted cash as at March 31, 2017, of US$1.3 million (US$2.1

million as at December 31, 2016).

— Subsequent to successful extension and renegotiation, the Company’s Cdn

$11.09 million principal amount of secured debentures principal and
interest are due and payable in full on January 31, 2018.
— The Series 1 New Debentures (principal amount Cdn $4,762,400) bear
interest at the rate of 10% per annum and are convertible, at the
option of the holder, into ordinary shares of the Company at a
conversion price equal to $0.06 per share in the first 12 months of
the term (January 1, 2017 to December 31, 2017) and $0.10 per share
in the last month of the term (January 1, 2018 to January 31, 2018).
The Series 1 New Debentures are convertible into an aggregate of
79,373,333 ordinary shares, assuming a conversion price of $0.06 per
share.
— The Series 2 New Debentures (principal amount Cdn $6,327,600) bear
interest at the rate of 15% per annum, with no right to convert into
ordinary shares of the Company.

— In January 2017, the Company repaid the Cdn $0.4 million unsecured loan

(& accrued interest).

— In February 2017, the Company disposed of 5,314,502 Sound Energy shares,

to provide capital to meet its obligations of the Cdn $4,407,056
Debenture accrued interest and fees to the December 31, 2016 maturity
date (Cdn $4,475,878 including the “stub” interest for the period
January 1, 2017 to February 7, 2017 on the Debentures). The net proceeds
received (net of proceeds above 50 pence being allocated equally between
the Company and Sound Energy, and net of transaction costs) totaled
US$4,072,050.

— Executed settlement agreements with almost all of its unsecured

creditors.

/T/

Operations:

/T/

— Sidi Moktar onshore:

— The sale and purchase agreement with Sound Energy completed on
January 9, 2017 with the Sound Energy shares closing at 75.75 pence
per share. The proceeds from a sale (in whole or in part) of the
21,258,008 Sound Energy ordinary shares will be shared between
PetroMaroc and Sound Energy, with PetroMaroc receiving all proceeds
from sale(s) up to 50 pence per consideration share, and sale
proceeds in excess of 50 pence per consideration share will be
shared equally between PetroMaroc and Sound Energy.
— The Company retains a 10% net profit interest in any future cash
flows from the Kechoula structure within the Sidi Moktar licences,
and the Company retains a 5% net profit interest in any future cash
flows from structures within the Sidi Moktar licences other than the
Kechoula structure.

— Zag onshore:

— The Company committed to its percentage share of further geophysical
studies and the drilling of one exploration well, subject to
receiving and approving a satisfactory proposal from San Leon
Morocco Limited (the “Operator”), as per the terms of the “First
Extension Period” as set out in the petroleum agreement (the “Zag
Petroleum Agreement”) dated June 18, 2009 between Office National
des Hydrocarbures et des Mines (“ONHYM”), the Operator and Longreach
Oil and Gas Ventures Limited. Following the joint venture not
completing the minimum work commitment of the First Extension
Period, a twelve month extension to the First Extension Period was
agreed by the joint venture, to May 2016. During the twelve month
extension the Company continued to seek a mutually agreed technical,
commercial and financial proposal to reduce its financial exposure
insofar as possible. During the quarter, in March 2017, ONHYM
advised the Operator and the Company that the bank guarantee had
been deemed forfeited, and in addition, that the joint venture
should pay the residual penalty (US$0.6 million net to the Company),
to ONHYM. The Company continues to accrue US$0.6 million penalty
costs based on its working interest in the joint venture as the
joint venture has not met the minimum work commitments required by
the licence. The Company has notified ONHYM that a “force majeure”
has occurred pursuant to the Zag Petroleum Agreement due to
financial, commercial and operational challenges on the licence over
a number of years. The Company will seek to work with ONHYM and the
Operator to expedite a mutually agreed resolution, however reserves
the right to preserve its rights, which may include legal
arbitration.
— Previously capitalised costs, which were impaired in 2014, continue
to remain impaired.

/T/

About PetroMaroc

PetroMaroc Corporation plc is an independent oil and gas exploration company.
PetroMaroc holds a substantial share ownership position in Sound Energy plc,
and net profit interests in the Sidi Moktar licence (onshore Morocco), which
the Company considers to be a committed long-term partner who will work to
unlock the hydrocarbon potential of the Essaouira region. PetroMaroc is a
public company and its common shares are listed on the TSX Venture Exchange
under the symbol “PMA”.

Special Note Regarding Forward-Looking Statements

This press release contains forward-looking statements. Such forward-looking
statements relate to future events or the Company’s future performance. All
statements other than statements of historical fact are forward-looking
statements. Forward-looking statements are often, but not always, identified by
the use of words such as “may”, “will”, “should”, “expect”, “plan”,
“anticipate”, “believe”, “estimate”, “predict”, “project”, “potential”,
“targeting”, “intend”, “could”, “might”, “continue” or the negative of these
terms or other similar terms. Forward-looking statements in this press release
include, but are not limited to, statements regarding the strength of the
ongoing relationship between the Company and Sound Energy, including the
ability of the Company to leverage off Sound Energy’s operating capabilities in
Morocco, the degree of success in connection with the proposed drilling of the
Kechoula structure to prove the commercial viability of Sidi Moktar and the
value of the net profit interests held by the Company thereon, the ability of
the Company to continue to successfully negotiate settlement agreements with
its trade creditors in respect to the Sidi Moktar drilling campaign, the value
of Sound Energy shares held by the Company which may impact the ability of the
Company to repay the principal and interest owing under the New Debentures on
maturity, the ability of the Company to negotiate with ONHYM to reduce its
potential exposure in respect of the Zag concession, the completion of
evaluations and processing and interpretation of data, the performance
characteristics of the Company’s interests in oil and gas properties, capital
expenditure programmes, supply and demand for oil, gas and commodities, prices
for oil and gas, drilling plans, and realization of the anticipated benefits of
acquisitions.

Forward-looking statements are only predictions. Forward-looking statements
involve known and unknown risks, uncertainties and other factors that may cause
actual results or events to differ materially from those anticipated in such
forward-looking statements. Some of the risks and other factors which could
cause results to differ materially from those expressed in the forward-looking
statements contained in this press release include, but are not limited to:
unsuccessful test results to be conducted by Sound Energy in respect of the
Sidi Moktar concession, the potential decline in the value of the shares in
Sound Energy held by the Company which may impact upon the ability of the
Company to repay the New Debentures on maturity, the general economic
conditions in Canada, the Kingdom of Morocco and globally; industry conditions,
including fluctuations in the price of oil and gas, governmental regulation of
the oil and gas industry, including environmental regulation; fluctuation in
foreign exchange or interest rates; risks inherent in oil and gas operations;
political risk, including geological, technical, drilling and processing
problems; unanticipated operating events which could cause commencement of
drilling and production to be delayed; the need to obtain consents and
approvals from industry partners, regulatory authorities and other
third-parties; stock market volatility and market valuations; competition for,
among other things, capital, acquisitions of reserves, undeveloped land and
skilled personnel; incorrect assessments of the value of acquisitions or
resource estimates; any future inability to obtain additional funding, when
required, on acceptable terms or at all; credit risk; changes in legislation;
any unanticipated disputes or deficiencies related to title matters; dependence
on management and key personnel; and risks associated with operating in and
being part of a joint venture.

Although the forward-looking statements contained in this press release are
based upon factors and assumptions which management of the Company believes to
be reasonable, the Company cannot assure that actual results will be consistent
with its expectations and assumptions. Undue reliance should not be placed on
the forward-looking statements contained in this news release as there can be
no assurance that the plans, intentions or expectations upon which they are
based will occur. These statements speak only as of the date of this press
release, and the Company does not undertake any obligation to publicly update
or revise any forward-looking statements except as expressly required by
applicable securities laws.

Neither the TSX Venture Exchange nor its Regulation Services Provider (as that
term is defined in policies of the TSX Venture Exchange) accepts responsibility
for the adequacy or accuracy of this release.

This news release does not constitute an offer to sell or a solicitation of an
offer to buy any securities of PetroMaroc in any jurisdiction in which such
offer, solicitation or sale would be unlawful. The securities referred to
herein have not been and will not be registered under the United States
Securities Act of 1933 (the “U.S. Securities Act”) or any state securities laws
and may not be offered or sold within the United States or to U.S. Persons (as
defined in the U.S. Securities Act) unless registered under the U.S. Securities
Act and applicable state securities laws, or an exemption from such
registration is available.

– END RELEASE – 29/05/2017

For further information:
PetroMaroc Corporation plc
Martin Arch
Chief Financial Officer
+44 (0) 20 3137 7756
www.petromaroc.co

COMPANY:
FOR: PETROMAROC CORPORATION PLC
TSX VENTURE SYMBOL: PMA

INDUSTRY: Energy and Utilities – Oil and Gas
RELEASE ID: 20170529CC0001

Press Release from Marketwired 1-866-736-3779

All press releases are written by the client and have NO affiliation with the news copy written by The Canadian Press. Any questions that arise due to the content or information provided in the press release should be directed to the company/organization
issuing the release, not to The Canadian Press.

GET ENERGYNOW’S DAILY EMAIL FOR FREE


Five things to watch for in the Canadian business world in the coming week

TORONTO — Five things to watch for in the Canadian business world in the coming week:

Canada’s Ocean Playground votes: It could be a close call Tuesday night in Nova Scotia’s provincial election. Both the governing Liberals and Progressive Conservatives have promised to cut taxes for small business and red tape (with the Tories vowing to cut two regulations for every new one introduced, ripping a page from Donald Trump). The NDP have painted themselves as the hero of the proletariat, committing to hiking the minimum wage to $15 and raising taxes on the province’s wealthiest.

Closing out the big banks: The big bank earnings wrap up this week with Scotiabank’s second-quarter results Tuesday, followed by National Bank of Canada the next day. The head honchos of BMO, CIBC, Royal Bank and TD have largely shrugged off nervousness about the housing market, pointing to strong loan books and early signs of cooling in Toronto.

Kinder Morgan awaits Wednesday: Kinder Morgan’s IPO for the Trans Mountain pipeline expansion is set to close Wednesday. The company’s goal is to raise $1.75 billion, which would make it one of the biggest IPOs on the Toronto Stock Exchange. Wednesday is also the deadline B.C. Green Leader Andrew Weaver has set for himself to decide whether to strike a deal with the Liberals or the NDP — a decision that could have ramifications on the project’s fate.

Macroeconomics junkies, take note: Statistics Canada reports the GDP figures for the first quarter on Wednesday and on Friday come the trade figures for April. The GDP result is expected to show the economy kicked off this year with a bang after growth in the fourth quarter of 2016 came in at an annualized pace of 2.6 per cent, providing a welcome handoff to the start of this year.

There are no solitudes: So says CMHC president Evan Siddall, who is set to give a speech Thursday before the Canadian Club of Toronto entitled, “No Solitudes: A Canadian National Housing Strategy.”

The Canadian Press

GET ENERGYNOW’S DAILY EMAIL FOR FREE


Trump’s budget renews debate on Arctic refuge oil drilling

ANCHORAGE, Alaska — President Donald Trump’s plan to help balance the federal budget features a new attempt to open the coastal plain of Alaska’s Arctic National Wildlife Refuge to petroleum drilling.

The effort is the latest chapter in a long-running political fight between two camps: environmentalists, who revere the plain as a maternity ward for polar bears, caribou and migratory birds; and politicians, including those in Alaska’s congressional delegation, who have campaigned for four decades on the promise of jobs and prosperity through “opening ANWR.”

The refuge covers 2,300 square miles (5,957 square kilometres), an area the size of West Virginia and Connecticut combined in Alaska’s northeast corner.

Some things to know about the debate:

WHAT’S THE HISTORY OF THE REFUGE?

Alaska Natives have used it as subsistence hunting grounds for thousands of years. President Dwight Eisenhower in 1960 signed legislation creating the refuge.

Congress in 1980 expanded it and declared much of it wilderness, but threw in a wild card: Recognizing the oil production potential, Congress declared that the coastal plain, tundra stretching from the Beaufort Sea to the foothills of the Brooks Range, should be studied. Another act of Congress and presidential approval can open it to drilling.

HOW MUCH OIL?

The U.S. Geological Survey estimates the coastal plain holds 10.4 billion barrels of oil — compared with 25 billion at the older Prudhoe Bay oil field to the west.

Republican U.S. Sen. Lisa Murkowski of Alaska calls the refuge’s coast plain North America’s greatest prospect for conventional oil production. The plain is 60 miles (97 kilometres) east of the trans-Alaska pipeline, which operates at one-quarter capacity as North Slope oil fields such as Prudhoe Bay have declined.

Alaska is draining billion-dollar savings accounts to pay for schools and roads and is anxious to find more revenue. Gov. Bill Walker says it’s frustrating to be denied access to billions of barrels of oil in an area specifically set aside to be evaluated for resource development within miles of a pipeline that’s three-quarters empty.

North Slope crude was selling for nearly $54 a barrel Tuesday. Alaska could benefit from jobs, additional taxes and federal revenue sharing if the refuge opens.

WHAT STANDS IN THE WAY OF DRILLING?

The refuge is about as wild a place as there is. There are no roads, no campgrounds, not even established trails. And the environmental community and some Alaska Native groups want to keep it that way.

Besides polar bears, the coastal plain is home to muskoxen, the nests of 200 species of migratory birds, and for part of the year, the vast Porcupine Caribou Herd — 197,000 animals that roam between the refuge and Canada’s Yukon and Northwest Territories.

Environmentalists say America should pivot toward renewable energy, not add to climate warming by burning oil extracted from wilderness and generating greenhouse gases.

“The fact it’s happening to what’s supposed to be a refuge for wildlife only adds insult to injury,” said Kristen Monsell, an attorney for the Center for Biological Diversity.

HAS CONGRESS VOTED ON OPENING THE REFUGE BEFORE?

Between the House and Senate, Congress has voted 49 times on the Arctic National Wildlife Refuge, according to the Alaska Wilderness League. Both chambers approved a bill to open the refuge in 1995, but President Bill Clinton vetoed it.

Murkowski is optimistic that a Trump administration and a Republican-controlled Senate and House present a new opportunity to open the area for development.

WHAT WOULD OPENING THE REFUGE DO FOR THE FEDERAL BUDGET?

Interior Secretary Ryan Zinke acknowledged Tuesday that the ANWR item in the president’s proposed budget is a placeholder.

Lease sales are not likely before 2022, Zinke said, and winning bids could generate $3.5 billion over 10 years. If companies find oil, production would generate royalty payments and federal and state taxes.

Zinke said America needs refuge oil in the trans-Alaska pipeline to reach Trump’s goal of “energy dominance” and to help balance the federal budget.

WHAT’S NEXT?

Murkowski has legislation pending that would open the refuge but limit oil company infrastructure, such as drilling pads and roads, to 3 square miles (8 square kilometres).

Environmentalists say that figure is misleading, because oil operations would require multiple drilling pads connected by roads and pipelines. They say Murkowski’s bill would create a spider web of industrial blight across the plain, and if it passes, they would sue to block it.

Dan Joling, The Associated Press


GET ENERGYNOW’S DAILY EMAIL FOR FREE


Methane, deficits and the civil service: three ways politics mattered this week

OTTAWA — Speculation filled the void left by the members of Parliament who vacated the capital for the week to spend time in their ridings.

Who would win the Conservative leadership? Do Prime Minister Justin Trudeau and the young, new French president Emmanuel Macron — who met together on the sidelines of the G7 summit this week —have the makings of a budding bromance? If the Ottawa Senators advance, is it OK to root for P.K. Subban (a moot point now, obviously)?

Whimsical calculations and conjecture aside, the week saw some concrete developments on climate change, deficits and the way the government manages its money.

Here are a few ways federal politics touched Canadians this week.

METHANE

Methane reductions are supposed to be the low-hanging fruit in the world of emissions and controlling climate change. But they’re proving to be tricky for Canada.

Environment Minister Catherine McKenna rolled out a draft of new rules Thursday that would force companies to control methane emissions by checking equipment for leaks, making repairs, using cleaner technologies and reporting their emissions levels back to Ottawa. The rules would be phased in over three years starting in 2020.

There is a cost. Between 2018 and 2035, the government estimates the measures would cost industry $3.3 billion — although it argues the cost of doing nothing and allowing climate change to continue unabated would be even more exorbitant.

Already there is resistance. Some companies are complaining about the expense — especially at a time when the oil patch is in a slump — and say they will be pushing for modifications to the regulations.

When it comes to the regulations, the government has put water in its wine before. Implementation has been delayed for three years now that U.S. President Donald Trump signed an executive order to reconsider methane cuts in the United States.

DEFICITS

The government’s preliminary fiscal numbers are out for 2016-17, and it looks like the Liberals have run up a deficit of $21.8 billion for the year. That’s a bit smaller than initially forecast — with the big caveat that end-of-year adjustments could change the final numbers when they are published in the fall.

The deficit comes mainly from an 8.2 per cent increase in spending compared to the previous year, attributable in part to fulfilling an election promise to increase child benefits, plus more benefits for a growing number of seniors and more employment insurance payouts.

But direct program expenses grew by 9.1 per cent, not much of which can be attributed to the Liberals’ vaunted infrastructure program, which will start growing this fiscal year. Rather, spending increased in a smattering of different government departments, such as Employment and Social Development and Indigenous and Northern Affairs.

The numbers are important because they are for the first full fiscal year completely under the purview of the Trudeau Liberals. And as the Conservatives choose a new leader, the one thing all candidates and their supporters agree on is that the deficit is too big.

Expect the new leader’s team to take a magnifying glass to the numbers.

SORTING OUT THE CIVIL SERVICE

What was once a problem that was painful to civil servants but seemed to have only a limited effect on the broader population has now become an expensive mess that refuses to go away.

The Phoenix pay system is so bogged down in bugs that the government announced this week it will spend $142 million over two years to hire 200 extra people — on top of 300 working on the system so far.

That brings the total cost overruns to $402 million, for a project that was only supposed to cost $300 million in the first place and was intended to pay for itself and save the government money over time.

Government unions are upset, MPs are hearing many complaints about poor management and there is much finger-pointing all around. The Liberals blame the Conservatives for cutting government capacity to handle the new system.

Heather Scoffield, Ottawa Bureau Chief, The Canadian Press

GET ENERGYNOW’S DAILY EMAIL FOR FREE


Colorado oil tank blast kills worker, spurs safety questions

DENVER — An oil tank explosion in northern Colorado killed a worker and burned three others, shooting up flames just miles away from an unrelated gas blast last month and prompting fresh questions about safety in one of Colorado’s largest industries — oil and gas extraction.

The fire flared Thursday when the workers completed upgrades to an oil tank battery, which is a collection of tanks that receive crude oil production from a well.

Anadarko Petroleum Co. said the facility in Mead, about 40 miles (64 kilometres) north of Denver, was not in service and the fire was under investigation.

The company also owns a well connected to a home explosion that killed two people in Firestone, a city a few miles from Mead. The April 17 blast was traced to a leaky well.

Anadarko says it will permanently shut down the Firestone well and two others in the neighbourhood. The pipeline was thought to be out of service, but investigators say it was still connected to a well near the home.

Democratic Gov. John Hickenlooper, a former petroleum geologist, said Friday that the two explosions apparently were not related. State agencies and the U.S. Occupational Safety and Health Administration were investigating the latest blast, he said.

“We will continue to work closely with investigating agencies and the industry to better understand the cause of this accident and take any necessary action to ensure that this doesn’t happen again,” Hickenlooper said.

Democratic state Rep. Mike Foote said the industry and government “have an obligation to treat these incidents not as isolated or freak accidents.”

The Sierra Club called for Anadarko to shutter all of its operations while state and federal authorities conduct a comprehensive review. The company did not respond.

A third safety accident related to the energy industry happened Thursday in northeast Colorado, near the Nebraska border. A leak of natural gas was discovered from an underground storage facility.

The leak occurred in a well that injects and withdraws gas from the facility owned by East Cheyenne Gas Storage. Logan County called all residents who live within 2 miles of the well and urged them to evacuate.

There were no injuries from the storage-tank leak.

___

Associated Press writers James Anderson and Nicholas Riccardi contributed to this report.

Kristen Wyatt, The Associated Press

GET ENERGYNOW’S DAILY EMAIL FOR FREE


US rig count rises 7 this week to 908; Colorado up 5

HOUSTON — The number of rigs exploring for oil and natural gas in the U.S. rose by seven this week to 908.

A year ago, 404 rigs were active.

Houston oilfield services company Baker Hughes said Friday that 722 rigs sought oil and 185 explored for natural gas this week. One was listed as miscellaneous.

Colorado added five rigs while Alaska, New Mexico, North Dakota and Oklahoma each gained one.

Texas lost one rig.

Arkansas, California, Kansas, Louisiana, Ohio, Pennsylvania, Utah, West Virginia and Wyoming were all unchanged.

The U.S. rig count peaked at 4,530 in 1981. It bottomed out last May at 404.

The Associated Press

GET ENERGYNOW’S DAILY EMAIL FOR FREE


The Latest: Colorado lawmakers urge probe of fatal oil blast

GREELEY, Colo. — The Latest on a fatal oil tank fire in northern Colorado (all times local):

11:35 a.m.

Two Colorado lawmakers are calling on the owner of an oil tank facility that was the scene of a fatal explosion to co-operate with state investigators to ensure it doesn’t happen again.

House Majority Leader KC Becker and Rep. Mike Foote, both Democrats, said Friday that the fire that killed one worker and injured three others was unacceptable — especially coming after a fatal house explosion in the region blamed on a natural gas pipe leak.

Foote says the industry and government “have an obligation to treat these incidents not as isolated or freak accidents.”

Anadarko Petroleum Co. says it’s investigating what caused Thursday’s blast in Mead, about 40 miles (64 kilometres) north of Denver.

An April 17 house explosion in nearby Firestone killed two people. Investigators blamed it on natural gas from a severed pipeline linked to an Anadarko-owned well.

___

11:15 a.m.

The oil tank battery that caught fire Thursday in Mead was not in operation when it caught fire Thursday, killing one and injuring three.

That’s according to the owner of the site, Anadarko Petroleum Company.

The company has not identified the workers. Anadarko says they were “finishing projects associated with a facility upgrade.” The company didn’t elaborate.

Anadarko says it is investigating what caused the fire.

An oil tank battery is a collection of tanks that receive crude oil production from a well.

___

10:15 a.m.

Colorado’s governor says it’s too soon for the state to take any action in response to a fatal oil tank explosion in Thursday.

The explosion at an oil tank battery in Mead killed one worker and injured three more.

Democratic Gov. John Hickenlooper is resisting calls from an environmental group to temporarily shut down all Colorado gas wells owned by Anadarko Petroleum Corporation. The company owns the site of Thursday’s explosion and another well that caused a fatal home explosion in Firestone. Two people were killed in that blast.

Hickenlooper told reporters Friday that it was too early for any government response pending an investigation into the Mead incident. He said, “Let’s see what happened first.”

The victims of the Mead explosion have not yet been named.

An oil tank battery is a collection of tanks that receive crude oil production from a well.

___

8 a.m.

A fatal oil tank battery fire in northern Colorado appears to be unrelated to a nearby home explosion last month caused by a leaky gas line.

Thursday’s blast in Mead killed one person and injured three others. All were working on a battery at the site owned by Anadarko Petroleum Corporation.

The explosion happened less than 4 miles away from the Firestone neighbourhood where an April 17 explosion killed two people. Investigators blamed that explosion on natural gas from a severed pipeline. Anadarko owns that well, too.

The Weld County Sheriff’s Department tells The Denver Channel that the two deadly incidents aren’t related.

Cpl. Matt Turner with the Weld County Sheriff’s Office tells the station that Thursday’s blast was “a completely separate incident all together.”

Thursday victims haven’t been identified.

The Associated Press


GET ENERGYNOW’S DAILY EMAIL FOR FREE


Stable gas prices expected to boost Memorial Day road trips

Stable gasoline prices are expected to fuel a slight increase in long trips this Memorial Day weekend.
The AAA auto club predicts that 39 million Americans will make a trip of at least 50 miles this weekend, up 2.7 per cent from the same holiday last …

GET ENERGYNOW’S DAILY EMAIL FOR FREE


Greenfields Petroleum Corporation Announces Financial Results and Operating Highlights for the Three Months Ended March 31, 2017

FOR: GREENFIELDS PETROLEUM CORPORATION
TSX VENTURE SYMBOL: GNF

Date issue: May 26, 2017
Time in: 5:30 PM e

Attention:

HOUSTON, TEXAS–(Marketwired – May 26, 2017) – Greenfields Petroleum
Corporation (the “Company” or “Greenfields”) (TSX VENTURE:GNF), an independent
exploration and production company with producing assets in Azerbaijan,
announces its financial results and operating highlights for the first quarter
of 2017. Selected financial and operational information is set out below and
should be read in conjunction with the Company’s complete financial statements
as of and for the three months ended March 31, 2017, with the notes thereto and
related management’s discussion and analysis (“MD&A”), which can be found on
Greenfields’ website at www.Greenfields-Petroleum.com and on SEDAR at
www.sedar.com. Except as otherwise indicated, all dollar amounts referenced
herein are expressed in United States dollars.

First Quarter 2017 Financial Results and Operating Highlights

/T/

— Bahar Energy Limited’s (“BEL”) entitlement sales volumes averaged 709

bbl/d for crude oil and 17,296 mcf/d for natural gas or 3,591 boe/d in
the first quarter 2017, which represents 83.6% of the gross entitlement
volumes delivered to the State Oil Company of the Azerbaijan (“SOCAR”).
As compared to the same quarter in 2016, average entitlement sales
volumes decreased 20% for oil, increased 27% for natural gas and
increased 14% for boe/d, which represented 83.2% of gross entitlement
volumes in the first quarter 2016. Gross entitlement volumes for both
years include 10% compensatory petroleum delivered to SOCAR at no
charge.

— For the first quarter 2017, BEL realized an average oil price of $48.20

per barrel. This reflects an increase from $30.84 per barrel for the
same period in 2016. BEL realized a natural gas price of $3.96 per mcf
for 2017 and 2016, which was a contractually constant fixed price.

— For the first quarter 2017, the Company realized a loss of $1.4 million

which represents a loss per share (basic and diluted) of $0.01. In
comparison, for the same period in 2016, the Company realized a net loss
of $3.6 million with a loss per share (basic and diluted) of $0.16.

/T/

Operating Highlights and Plans

/T/

— Gross entitlement volumes produced from the Exploration, Rehabilitation,

Development Production Sharing Agreement (“ERDPSA”) averaged 865 bbl/d
for crude oil, 20.7 mmcf/d for natural gas or 4,309 boe/d for the first
quarter 2017. Production was impacted by the slower pace of executing
scheduled workovers due to limited availability of crane barges as well
as lower than expected post-workover production results.

— During the first quarter 2017, operating expenses at Bahar Energy

Operating Company (“BEOC”) were mainly in line with budget while capital
expenditures were significantly under budget as a result of capital
projects being reduced in scope or delayed.

— In the Gum Deniz Oil Field, BEOC completed five capital and ten service

workovers during the first quarter 2017.

— In the Bahar Gas Field, BEOC completed one capital workover during the

first quarter 2017. The Bahar-83 well was completed with an initial
production rate of 2.2 mmcf/d. Two additional gas workovers were
initiated and are expected to be completed in the second quarter 2017.

— In the first quarter 2017, BEOC continued progress on several

construction projects, including platform refurbishment, causeway
structure reinforcement and facility and health, safety and environment
(HS&E) upgrades. BEOC’s construction department performed the majority
of this work, eliminating the need for third party contractors, which
resulted in improved efficiency and lower costs.

— The dynamic reservoir model simulation studies continued for both the

Bahar and Gum Deniz fields and are expected to be completed in mid-2017.
The results of these simulation studies will enable more thorough
evaluation of development options in the Bahar and Gum Deniz fields. A
new plan of development will follow completion of the studies.

— On March 3, 2017, BEOC signed an amendment to the gas sales agreement

(the “Amended GSA”) for the sale of non-associated natural gas produced
under the ERDPSA with SOCAR, which took effect April 1, 2017.

/T/

The original gas sales agreement (the “Original GSA”) for the sale of
non-associated natural gas from the Bahar Gas Field expired on October 1, 2015.
Natural gas sales had continued on a month to month basis on the terms set
forth in the Original GSA while a revised gas sales agreement was negotiated
with SOCAR. Due to the continued difficult economic conditions in Azerbaijan,
SOCAR has placed pressure on all production sharing agreement holders to lower
prices for natural gas sold to SOCAR for domestic consumption. The Amended GSA
extends the term of the arrangement by 5 years and establishes a fixed natural
gas price of $95/mcm ($2.69/mcf), which is reduced from the natural gas price
of $140/mcm ($3.96/mcf) in the Original GSA.

In addition, the Amended GSA expands SOCAR’s obligation to purchase
non-associated natural gas. Under the terms of the Original GSA, SOCAR
purchased only non-associated natural gas from Bahar Gas Field. Under the terms
of the Amended GSA, SOCAR has agreed to purchase non-associated natural gas
from the entire ERDPSA area.

/T/

— On April 19, 2017 BEL and SOCAR signed a protocol in respect of the

carry of certain costs and related issues (the “Protocol”) which
addresses the shortfall by SOCAR Oil Affiliate (“SOA”) in funding its
20% share of project expenditures incurred under the ERDPSA since April
2014. In accordance with the Protocol, SOA’s 20% share of project
expenditures will be funded from SOA’s entitlement share of profit
petroleum revenues and revenues generated from the sale of SOCAR’s
compensatory petroleum. Any funding deficiencies in SOA’s cash call
payments will be borne by BEL and added to the outstanding Carry 1
balance which will subsequently be reimbursed in accordance with the
terms of the ERDPSA through payment of SOA’s share of cost recovery
petroleum revenues to BEL.

— For the remainder of 2017, BEOC will focus on increasing gas production

from the Bahar Gas Field through a series of recompletions of existing
wells to improve project cash flows. Additionally, BEOC is initiating
programs to further reduce field operating costs while maintaining HS&E
standards.

/T/

Selected Financial Information

Revenues and operating results in the “Selected Financial Information” have
been adjusted to reflect the Company’s share of BEL. Upon the closing of the
acquisition of Baghlan Group Limited’s 66.67% interest in BEL on August 9,
2016, BEL became a wholly-owned subsidiary of the Company and the Company began
consolidating 100% of the revenues and operating results from BEL on a going
forward basis. Revenues for the three months ended March 31, 2016 presented in
the tables below have been adjusted to include the Company’s 33.33% share of
petroleum, natural gas and transportation revenues from BEL. Prior to the
acquisition, the Company’s share of BEL revenues was included in the income or
loss on Investment in Joint Venture under the equity method of accounting. The
combined financial and operating results have been presented only for
comparative purposes and do not reflect proper accounting practices under GAAP
for the three months ended March 31, 2016.

Greenfields Petroleum Corporation

/T/

—————————————————————–

Three months ended
(US$000’s, except as noted) March 31,
2017 2016
—————————————————————–
Financial

Revenues 9,238 2,800
Net loss (1,368) (3,602)
Per share, basic and diluted ($0.01) ($0.16)

—————————————————————–
Capital items

Cash and cash equivalents 1,891 906
Total assets 198,781 97,220
Working capital (48,189) (14,345)
Debt and shareholders’ equity 138,147 53,990
—————————————————————–
—————————————————————–

/T/

Bahar Energy Limited

/T/

—————————————————————————-

Company’s share
—————————————-
(US$000’s, except as noted) Three months ended March 31,
—————————————-
2017 2016 2017 2016
—————————————————————————-
Financial

Revenues 9,238 7,399 9,238 2,466

—————————————————————————-
Operating

Average Entitlement Sales Volumes
(1)
Oil and condensate (bbl/d) 709 886 709 295
Natural gas (mcf/d) 17,296 13,629 17,296 4,543
Barrel oil equivalent (boe/d) 3,591 3,158 3,591 1,052

Average Oil Price
Oil price ($/bbl) $48.20 $30.84 $48.20 $30.84
Net realization price ($/bbl) $47.24 $29.99 $47.24 $29.99
Brent oil price ($/bbl) $53.59 $33.84 $53.59 $33.84

Natural gas price ($/mcf) $3.96 $3.96 $3.96 $3.96

—————————————————————————-
—————————————————————————-
(1) Daily volumes represent the Company’s share of the entitlement volumes
of the contractor parties to the ERDPSA net of compensatory petroleum and
the government’s share of profit petroleum. Compensatory petroleum
represents 10% of gross production and continues to be delivered until
specific cumulative petroleum and natural gas production milestones are
attained. Daily volumes for the three months ended March 31, 2016 include
the Company’s 33.33% share of BEL entitlement volumes and 100% of BEL’s
entitlement for the three months ended March 31, 2017.

/T/

About Greenfields Petroleum Corporation

Greenfields is a junior oil and natural gas company focused on the development
and production of proven oil and gas reserves principally in the Republic of
Azerbaijan. The Company plans to expand its oil and gas assets through further
farm-ins, and acquisitions of Production Sharing Agreements from foreign
governments containing previously discovered but under-developed international
oil and gas fields, also known as “greenfields”. More information about the
Company may be obtained on the Greenfields website at
www.greenfields-petroleum.com.

Forward-Looking Statements

This press release contains forward-looking statements. More particularly, this
press release includes forward-looking statements concerning, but not limited
to: operational and development plans; the completion of workovers and
anticipated timing thereof; the Protocol and the expectations in relation
thereto; the Bahar and Gum Deniz field studies and the expectations in relation
thereto; production; and programs initiated by BEOC. In addition, the use of
any of the words “initial, “scheduled”, “can”, “will”, “prior to”, “estimate”,
“anticipate”, “believe”, “should”, “future”, “continue”, “may”, “expect”, and
similar expressions are intended to identify forward-looking statements. The
forward-looking statements contained herein are based on certain key
expectations and assumptions made by the Company, including, but not limited
to, expectations and assumptions concerning the success of optimization and
efficiency improvement projects, the availability of capital, current
legislation and regulatory regimes, receipt of required regulatory approval,
the success of future drilling and development activities, the performance of
existing wells, the performance of new wells, general economic conditions,
availability of required equipment and services, weather conditions and
prevailing commodity prices. Although the Company believes that the
expectations and assumptions on which the forward-looking statements are based
are reasonable, undue reliance should not be placed on the forward-looking
statements because the Company can give no assurance that they will prove to be
correct.

Since forward-looking statements address future events and conditions, by their
very nature they involve inherent risks and uncertainties most of which are
beyond the control of Greenfields. Should one or more of these risks or
uncertainties materialize, or should assumptions underlying the forward-looking
information prove incorrect, actual results, performance or achievements could
vary materially from those expressed or implied by the forward-looking
information. These risks include, but are not limited to, risks associated with
the oil and gas industry in general (e.g., operational risks in development,
exploration and production; delays or changes in plans with respect to
exploration or development projects or capital expenditures; the uncertainty of
reserve estimates; the uncertainty of estimates and projections relating to
production, costs and expenses; and health, safety, political and environmental
risks), commodity price and exchange rate fluctuations, changes in legislation
affecting the oil and gas industry and uncertainties resulting from potential
delays or changes in plans with respect to exploration or development projects
or capital expenditures. Additional risk factors can be found under the heading
“Risk Factors” in Greenfields’ Annual Information Form and similar headings in
the MD&A which may be viewed on www.sedar.com.

The forward-looking statements contained in this press release are made as of
the date hereof and Greenfields undertakes no obligation to update publicly or
revise any forward-looking statements or information, whether as a result of
new information, future events or otherwise, unless so required by applicable
securities laws. The Company’s forward-looking information is expressly
qualified in its entirety by this cautionary statement.

Abbreviations

/T/

bbls barrels mcf thousand cubic feet
bbls/d barrels per day mmcf million cubic feet
boe barrels of oil equivalent mcf/d thousand cubic feet per day
boe/d barrels of oil equivalent per mmcf/d million cubic feet per day
day
mcm million cubic meters

/T/

Notes to Oil and Gas Disclosures

Barrels of Oil Equivalent or “boe” may be misleading, particularly if used in
isolation. The volumes disclosed in this press release under the headings
“First Quarter 2017 Financial Results and Operating Highlights”, “Operating
Highlights and Plans” and “Selected Financial Information” use a 6mcf: 1boe, as
such is typically used in oil and gas reporting and is based on an energy
equivalency conversion method primarily applicable at the burner tip and does
not represent a value equivalency at the wellhead. The Company uses a 6mcf:
1boe ratio to calculate its share of entitlement sales from the Bahar project
for its financial reporting and reserves disclosure.

Neither the TSX Venture Exchange nor its Regulation Services Provider (as that
term is defined in the policies of the TSX Venture Exchange) accepts
responsibility for the adequacy or accuracy of this release.

– END RELEASE – 26/05/2017

For further information:
Greenfields Petroleum Corporation
John W. Harkins
Chief Executive Officer
(832) 234-0836
OR
A. Wayne Curzadd
Chief Financial Officer
(832) 234-0835
[email protected]
www.greenfields-petroleum.com

COMPANY:
FOR: GREENFIELDS PETROLEUM CORPORATION
TSX VENTURE SYMBOL: GNF

INDUSTRY: Energy and Utilities – Oil and Gas
RELEASE ID: 20170526CC0060

Press Release from Marketwired 1-866-736-3779

All press releases are written by the client and have NO affiliation with the news copy written by The Canadian Press. Any questions that arise due to the content or information provided in the press release should be directed to the company/organization
issuing the release, not to The Canadian Press.

GET ENERGYNOW’S DAILY EMAIL FOR FREE


Restructured and much smaller Penn West proposes name change to Obsidian Energy

CALGARY — Penn West Petroleum Ltd. (TSX:PWT) wants to change its name to Obsidian Energy Ltd. after surviving an accounting scandal, debt crisis and commodity price crash over the past three years.

David French, who took over as CEO of the Calgary oil and gas company in October, says shareholders will be asked to approve the change because the company no longer resembles the “old Penn West.”

In July 2014, Penn West announced that hundreds of millions of dollars in expenses had been improperly classified, forcing it to restate financial reports for 2012, 2013 and the first quarter of 2014.

The scandal resulted in class-action lawsuits by investors which were settled last year.

Meanwhile, the company embarked on a series of asset sales that allowed it to reduce net debt from almost $3 billion at the end of 2013 to $384 million as of March 31 this year.

Penn West is now a much smaller company with forecast production of 28,000 barrels of oil equivalent per day this year, down from 135,000 boepd in 2013. It also listed 407 employees at the end of 2016 versus 1,415 three years earlier.

The Canadian Press

GET ENERGYNOW’S DAILY EMAIL FOR FREE


Ottawa won’t impose national threshold for electric car purchases, says Garneau

MONTREAL — Ottawa has appointed an advisory group to develop a plan for getting more zero-emission vehicles on the road, but it won’t follow Quebec in requiring automakers to sell a minimum number of electric cars, Transport Minister Marc Garneau said Friday.

“We just decided that instead of giving ourselves a specific number what we would do is try to make the conditions more favourable for people to buy zero-emissions vehicles,” he said in an interview at an electric vehicle show.

The job of the new 22-member panel, which includes industry and other stakeholders, is to come up with options by next year for addressing the barriers to zero-emission vehicles (ZEV), including vehicle supply, cost, infrastructure readiness and public awareness.

Quebec has the country’s only legislation requiring automakers to sell a minimum number of electric, plug-in hybrid and hydrogen fuel-cell vehicles. Starting with the 2018 model year, 3.5 per cent of all auto sales in the province will have to be from those types of vehicles. The threshold rises to 15.5 per cent for 2025.

Companies that don’t meet the targets will have to buy credits from other automakers that do.

Automakers say it will be very challenging to meet the threshold because electric vehicles make up only a sliver of the market. In Canada, just 0.56 per cent of vehicles sold last year were electric. Quebec’s rate is about one per cent.

David Adams, president of the Global Automakers of Canada and a member of the new federal advisory group, said the government’s unwillingness to set a national threshold on electric vehicles makes sense.

“Whether it’s Quebec or the federal government we don’t disagree with the objective of moving towards the decarbonization of transportation, we just maybe are at odds sometimes in terms of how quickly we can get there and what means,” he said, adding there are less costly ways to reduce transportation emissions than favouring one technology.

Pollution Probe CEO Ingrid Thompson said the appointment of the panel on which her group is a member is an important step.

“This is a very good day for clean air in Canada and climate,” she said from Toronto.

Garneau also wouldn’t say if Ottawa is prepared to offer a federal purchase rebate on top of the thousands of dollars that are available in some provinces.

“These are questions that we are going to look at in the course of the next year as this advisory council comes back to us and tells us what are the winning conditions to increase sale of zero-emissions vehicles,” he said.

Quebec Natural Resources Minister Pierre Arcand applauded Ottawa’s commitment to work with provinces to develop a realistic approach to increase ZEV sales, but said a national rebate should be introduced.

“Of course it would certainly help,” he said, adding that the challenge is also to entice purchases of more electric trucks, which pollute 11 times less than those powered by diesel.

Thompson said any discussion of federal rebates is premature before letting the advisory group do its work.

The federal government estimates that cars and light trucks accounted for 12 per cent of the country’s total emissions in 2015.


Ross Marowits, The Canadian Press

GET ENERGYNOW’S DAILY EMAIL FOR FREE


Pipemakers in Regina vote to give union executive power to call strike

REGINA — Hundreds of unionized workers at Evraz North America’s steel plant in Regina have voted overwhelmingly in favour of strike action to back contract demands.

The vote by members of United Steelworkers Local 5890 took place Thursday at a special meeting to discuss the company’s contract proposals.

The union’s website says more than 99 per cent of the workers cast ballots in favour of job action.

The local said earlier this month that Evraz is proposing a five-year contract with no wage increases during the first three years, and a one-half-per-cent hike in the fourth and fifth years.

Union executives also said they would be applying for mediation in Calgary.

There was no immediate comment from Evraz on the outcome of the vote.

Kinder Morgan has said it plans to purchase about 250,000 tonnes of pipe for its Trans Mountain expansion from the Regina plant, with the material sourced from Evraz’s recycled metal operations in Alberta, Saskatchewan, Manitoba and Ontario.

Kinder Morgan said the purchase amounts to more than 75 per cent of the pipe it needs for the project, and is equivalent to 800 km of line construction.

Saskatchewan Premier Brad Wall has said Trans Mountain would help increase the value the province received for its oil because it would get it to the coast where it would gain access to world markets and better prices.

The Canadian Press

GET ENERGYNOW’S DAILY EMAIL FOR FREE


Calgary Businesses Could benefit Significantly From Federal Supercluster Initiative

CALGARY – There’s good news for Calgary businesses this week, as the Government of Canada announced their supercluster initiative for matching funds to jumpstart innovation in high-growth business sectors. “Superclusters provide opportunity for small and medium sized businesses with innovative ideas and products to access global companies as partners and customers,” said Zoe Addington, Director of … Read more

GET ENERGYNOW’S DAILY EMAIL FOR FREE


Canada is an International Leader in Methane Emissions Reductions: CAPP

FOR: CANADIAN ASSOCIATION OF PETROLEUM PRODUCERS (CAPP)
Date issue: May 26, 2017Time in: 10:36 AM eAttention:
CALGARY, ALBERTA–(Marketwired – May 26, 2017) – The Canadian Association of
Petroleum Producers (CAPP) welcomes Environment and Climate Chan…

GET ENERGYNOW’S DAILY EMAIL FOR FREE


Just Energy Marks 20 Years in the Retail Energy Space

FOR: JUST ENERGY GROUP INC.NYSE Symbol: JETSX Symbol: JEDate issue: May 26, 2017Time in: 8:45 AM eAttention:
HOUSTON, TX –(Marketwired – May 26, 2017) – Just Energy is excited to be
celebrating a milestone anniversary on May 26, 2017, as the indepen…

GET ENERGYNOW’S DAILY EMAIL FOR FREE


Razor Energy Corp. Announces Release of First Quarter 2017 Results and Executive Appointment

FOR: RAZOR ENERGY CORP.
TSX VENTURE SYMBOL: RZE

Date issue: May 26, 2017
Time in: 8:00 AM e

Attention:

CALGARY, ALBERTA–(Marketwired – May 26, 2017) – Razor Energy Corp. (“Razor” or
the “Company”) (TSX VENTURE:RZE) (www.razor-energy.com) is pleased to announce
its first quarter 2017 financial and operating results. Selected financial and
operational information is outlined below and should be read in conjunction
with Razor’s unaudited condensed consolidated interim financial statements and
management’s discussion and analysis for the quarter ended March 31, 2017 which
are available on SEDAR at www.sedar.com and the Company’s website.

The following tables summarize key financial and operating highlights
associated with the Company’s financial performance.

/T/

Three Months Ended
March 31,
($000’s unless otherwise stated) 2017 2016
—————————————————————————-
Production(1)
Oil (bbl/d) 2,032 –
Gas (mcf/d) 1,932 –
NGL (bbl/d) 721 –
—————————————————————————-
Total (boe/d) 3,075 –
—————————————————————————-
Oil and natural gas revenue
Oil and NGL sales 8,456 –
Natural gas sales 278 –
Other revenue 447 –
—————————————————————————-
Total revenue 9,181 –
—————————————————————————-
Weighted average number of shares outstanding (basic and
diluted) 10,048,376 –
Funds flow (2) 161 –
Funds flow per share (basic and diluted) 0.02 –
Net loss (1,829) –
Net loss per share (basic and diluted) (0.18) –
—————————————————————————-
Netback ($/boe)
Oil and gas sales 48.14 –
Other revenues 2.46 –
—————————————————————————-
Revenue 50.60
Royalty 9.04 –
Operating expenses 30.92 –
—————————————————————————-
Operating netback (2) 10.64 –
General and administrative costs 3.20 –
Acquisition and transaction costs 5.38 –
Interest expense 2.68 –
—————————————————————————-
Corporate netback (2) (0.62) –
—————————————————————————-
Capital expenditures 979 –
Net assets acquired 17,089 –
—————————————————————————-
—————————————————————————-
1) Production for 2017 represents the average daily production for the 59
days from February 1 to March 31, 2017.
2) Refer to “Non-IFRS measures”.

March 31, December 31,
($000’s) 2017 2016
—————————————————————————-
Total assets 103,056 83
Cash 9,526 8
Long-term debt (principal) 30,000 –
Net debt (1) 19,906 442
—————————————————————————-
—————————————————————————-
1) Refer to “Non-IFRS measures”.

/T/

HIGHLIGHTS

First Quarter 2017

/T/

— On January 31, completed a business combination with Vector Resources

Inc., including the name change to Razor Energy Corp., and a common
share consolidation of 20:1;
— Secured financing through a term loan facility of $30 million with the
Alberta Investment Management Corporation (“AIMCo”);
— Acquired producing light oil and gas assets in the Swan Hills area of
Alberta for $17.1 million, subject to customary adjustments;
— Average production of 3,075 boe/day (90% liquids) in the Swan Hills area
for the 59 day period between closing and March 31; and
— Expended $979,000 of capital primarily on well reactivations and
workovers.

/T/

Subsequent to First Quarter 2017

/T/

— Closed a common share equity financing for gross proceeds of $17.25

million; and
— Acquired light oil and gas assets in the Kaybob area of Alberta for $9.6
million, subject to customary adjustments.

/T/

EXECUTIVE APPOINTMENT

The Company is pleased to announce the appointment of Lisa Mueller to the
position of Vice President, New Ventures effective immediately. Ms. Mueller
adds significant engineering, commercial, and business development experience
to the Razor team. In her executive capacity, she will identify and develop
opportunities within the Company’s existing operations to augment hydrocarbon
production efficiencies and unlock value from other resources within our asset
portfolio.

ABOUT RAZOR

Razor is a light oil focused company operating predominantly in Alberta.
Razor’s full-cycle business plan provides an opportunity to reposition the
Company as a disciplined and high-growth junior E&P company. With an
experienced management team and a strong, committed Board of Directors, growth
is anticipated to occur through timely strategic acquisitions and operations.
Razor currently trades on TSX Venture Exchange under the ticker “RZE”.

READER ADVISORIES

FORWARD-LOOKING STATEMENTS: This press release may contain certain statements
that may be deemed to be forward-looking statements. Such statements relate to
possible future events. All statements other than statements of historical fact
may be forward-looking statements. Forward-looking statements are often, but
not always, identified by the use of words such as “anticipate”, “believe”,
“will”, “should”, “may”, and similar expressions. The forward-looking
statements are based on certain key expectations and assumptions made by the
Company, including but not limited to expectations and assumptions concerning
the availability of capital, current legislation, receipt of required
regulatory approval, the success of future drilling and development activities,
the performance of existing wells, the performance of new wells, the Company’s
growth strategy, general economic conditions, availability of required
equipment and services and prevailing commodity prices. Although the Company
believes that the expectations and assumptions on which the forward-looking
statements are based are reasonable, undue reliance should not be placed on the
forward-looking statements because the Company can give no assurance that they
will prove to be correct. Since forward-looking statements address future
events and conditions, by their very nature they involve inherent risks and
uncertainties. Actual results could differ materially from those currently
anticipated due to a number of factors and risks. These include, but are not
limited to, risks associated with the oil and gas industry in general (e.g.,
operational risks in development, exploration and production; delays or changes
in plans with respect to exploration or development projects or capital
expenditures; as the uncertainty of reserve estimates; the uncertainty of
estimates and projections relating to production, costs and expenses, and
health, safety and environmental risks), commodity price and exchange rate
fluctuations, changes in legislation affecting the oil and gas industry and
uncertainties resulting from potential delays or changes in plans with respect
to exploration or development projects or capital expenditures. Please refer to
the risk factors identified in the annual information form and management
discussion and analysis of the Company which is available on SEDAR at
www.sedar.com. The forward-looking statements contained in this press release
are made as of the date hereof and the Company undertakes no obligation to
update publicly or revise any forward-looking statements or information,
whether as a result of new information, future events or otherwise, unless so
required by applicable securities laws.

NON-IFRS MEASURES: This press release contains the terms “funds flow”, “net
debt”, “operating netback” and “corporate netback”, which do not have
standardized meanings prescribed by International Financial Reporting Standards
(“IFRS”) and therefore may not be comparable with the calculation of similar
measures by other companies. Funds flow represents cash flow from operating
activities before changes in non-cash working capital and decommissioning
expenditures. Management uses funds flow to analyze operating performance and
leverage. Net debt is calculated as the principal amount of long-term debt less
working capital (or plus working capital deficiency), with working capital
excluding mark-to-market risk management contracts. Management believes net
debt is a useful supplemental measure of the total amount of current and
long-term debt of the Company. Operating netback equals total petroleum and
natural gas sales less royalties and operating costs calculated on a boe basis.
Razor considers operating netback as an important measure to evaluate its
operational performance as it demonstrates its field level profitability
relative to current commodity prices. Corporate netback is calculated by
deducting general & administration costs, acquisition and transaction costs,
and interest from operating netback all calculated on a boe basis. Razor
considers corporate netback as an important measure to evaluate its overall
corporate performance.

ADVISORY PRODUCTION INFORMATION: Unless otherwise indicated herein, all
production information presented herein has presented on a gross basis, which
is the Company’s working interest prior to deduction of royalties and without
including any royalty interests.

BARRELS OF OIL EQUIVALENT: The term “boe” or barrels of oil equivalent may be
misleading, particularly if used in isolation. A boe conversion ratio of six
thousand cubic feet of natural gas to one barrel of oil equivalent (6 Mcf: 1
bbl) is based on an energy equivalency conversion method primarily applicable
at the burner tip and does not represent a value equivalency at the wellhead.
Additionally, given that the value ratio based on the current price of crude
oil, as compared to natural gas, is significantly different from the energy
equivalency of 6:1; utilizing a conversion ratio of 6:1 may be misleading as an
indication of value.

Neither the TSX Venture Exchange nor its Regulation Services Provider (as that
term is defined in the policies of the TSX Venture Exchange) accepts
responsibility for the adequacy or accuracy of this news release.

– END RELEASE – 26/05/2017

For further information:
Doug Bailey
President and Chief Executive Officer
OR
Kevin Braun
Chief Financial Officer
OR
Razor Energy Corp.
1250, 645 7th Avenue S.W.
Calgary, Alberta T2P 4G8
(403) 262-0242
www.razor-energy.com

COMPANY:
FOR: RAZOR ENERGY CORP.
TSX VENTURE SYMBOL: RZE

INDUSTRY: Energy and Utilities – Oil and Gas
RELEASE ID: 20170526CC0012

Press Release from Marketwired 1-866-736-3779

All press releases are written by the client and have NO affiliation with the news copy written by The Canadian Press. Any questions that arise due to the content or information provided in the press release should be directed to the company/organization
issuing the release, not to The Canadian Press.

GET ENERGYNOW’S DAILY EMAIL FOR FREE


WesternZagros Announces First Quarter 2017 Operational and Financial Results

FOR: WESTERNZAGROS RESOURCES LTD.
TSX VENTURE SYMBOL: WZR

Date issue: May 26, 2017
Time in: 7:30 AM e

Attention:

CALGARY, ALBERTA–(Marketwired – May 26, 2017) –

NOT FOR DISTRIBUTION TO U.S. NEWSWIRE SERVICES OR DISSEMINATION IN THE UNITED
STATES

WesternZagros Resources Ltd. (TSX VENTURE:WZR) (“WesternZagros” or “the
Company”) announced today its operating and financial results for the first
quarter ended March 31, 2017. All amounts set out in this news release are in
US dollars unless otherwise stated.

Commenting on the first quarter results and subsequent events, WesternZagros’s
Chief Executive Officer Simon Hatfield said:

“The leading news this quarter is of course our agreement with Crest to take
WesternZagros private. Given the current market conditions, the Crest offer
represents a significant premium to the share price at the time of the offer.
The Company encourages shareholders to take advantage of this offer.”

WesternZagros achieved several key financial and operational milestones during
the first quarter 2017 and to date, including:

/T/

— Corporate – On May 12, 2017, the Company entered into a definitive

agreement (“Arrangement Agreement”) with its largest shareholder, Crest
Energy International LLC (“Crest”) to take the Company private. Pursuant
to the Arrangement Agreement, an affiliate of Crest will provide the
Company with funds necessary to acquire all of the Company’s outstanding
common and preferred shares for CAD$0.28 per share, other than one
common share held by Crest which will be acquired by such Crest
affiliate. The transaction is to be completed by way of a plan of
arrangement under the Business Corporations Act (Alberta). The
shareholder meeting to approve the transaction is scheduled for July 5,
2017 and following a positive outcome at the meeting, is expected to
close in early July 2017.

— Financial – The Company ended the quarter with $22.5 million in cash and

cash equivalents.

Concurrent with the Arrangement Agreement, WesternZagros entered into a
bridge loan agreement with the same Crest affiliate pursuant to which
the Company has received funding of $30 million (the “Bridge Loan’) to
address its immediate financing requirements. In connection with
entering into the Arrangement Agreement and the funding of the Bridge
Loan, WesternZagros and Crest entered into an agreement to terminate the
prior undrawn $200 million credit facility dated August 14, 2014.

— Production – First quarter gross oil sales from the Sarqala field

averaged 4,942 barrels of light oil per day (“bbl/d”), of which
WesternZagros’s net oil sales were 1,333 bbl/d. Following the completion
of a planned acid stimulation completed at the end of March, the
Sarqala-1 well is currently producing at approximately 6,900 bbl/d.

— Revenue – Revenue recognized by WesternZagros during the first quarter

was $5.1 million with an average realized price of $42.83/bbl.
Subsequent to March 31, 2017, the Company received payment for all
remaining first quarter revenues, with no remaining outstanding
receivables for first quarter revenue.

— Garmian Development – The first Garmian development well has been

approved by the co-venturers and is expected to spud in July 2017 with a
budgeted net cost to WesternZagros of $18 to 22 million. This is the
Company’s first Garmian well located with the benefit of 3D seismic data
and is designed as a producing well for the Jeribe reservoir. The co-
venturers have also approved a facilities work program for 2017 in order
to debottleneck and expand the Sarqala production facility to an initial
estimated capacity of 10,000 bbl/d and then to further increase to an
estimated 15,000 bbl/d capacity by the end of the year.

— Kurdamir Development – WesternZagros and Repsol continue to advance

discussions with the KRG on finalizing the approval of the Kurdamir
Development Plan. The major outstanding matter is the finalization of
the gas sales agreement for phase 1 gas volumes applicable to the
Kurdamir project and the adjacent Topkhana project. The two projects are
to be developed concurrently with the sharing of top side facilities to
optimize capital costs.

— Impairment of E&E Expenditures – The Arrangement Agreement entered into

with Crest subsequent to the reporting date, providing for the
acquisition of all of the outstanding shares of the Company, presented
evidence that an indicator of impairment existed for exploration and
evaluation expenditures as at March 31, 2017. Based on the total
acquisition price, the estimated recoverable amount associated with the
Kurdamir Block was determined to be $20.8 million which resulted in the
recognition of a non-cash impairment loss of $254.1 million for the
first quarter of 2017. Refer to the section entitled “Impairment of E&E
Expenditures” in the Company’s MD&A dated May 25, 2017 for further
description.

/T/

First Quarter 2017 Results

WesternZagros has posted its operating and financial results for the first
quarter ended March 31, 2017 on its website. The financial statements, the
Management Discussion and Analysis, and the Annual Information Form are
available at www.westernzagros.com and on SEDAR at www.sedar.com.

Outlook

WesternZagros continues to focus on advancing development in accordance with
the approved Garmian FDP and securing KRG approval of the phased development
plan for the Kurdamir Block in line with market conditions and dependent upon
the sustainability of regular payments for production.

Following the successful acidization workover, the Company anticipates the
average daily productive capacity of Sarqala-1 will range from 6,850 to 10,000
bbl/d for the remainder of 2017. Assuming continuous production and payments
for the year, and an average Brent price of $50 to $55 per barrel,
WesternZagros estimates 2017 revenues of $24 to $33 million.

The Company has $22.5 million in cash and cash equivalents as at March 31,
2017, plus the Bridge Loan proceeds of $30 million received subsequent to March
31, 2017, to advance the field development plans with its co-venturers. The
Company continues its focus on strict cost management and estimates spending of
approximately $48 million for the remainder of 2017 to operate the Sarqala
production operations, advance the currently approved work programs of the
Garmian and Kurdamir blocks with its co-venturers and fund WesternZagros head
office costs. The first Garmian development well has been approved by the
co-venturers and is expected to spud in July 2017 with a budgeted net cost to
WesternZagros of $18 to 22 million. This is the Company’s first Garmian well
located with the benefit of 3D seismic data and is designed as a producing well
for the Jeribe reservoir. The co-venturers have also approved a facilities work
program for 2017 in order to debottleneck and expand the Sarqala production
facility to an initial estimated capacity of 10,000 bbl/d and then to further
increase to an estimated 15,000 bbl/d capacity by the end of the year and with
an estimated cost net to the Company of $6 million.

Liquidity and Capital Resources

As at March 31, 2017, WesternZagros had $22.5 million in cash and cash
equivalents. Subsequent to March 31, 2017, the Company received $30 million in
proceeds under the Bridge Loan concurrent with entering into the Arrangement
Agreement with Crest.

The Company’s remaining 2017 capital budget is estimated to be approximately
$48 million, including the Sarqala-2 well which has now been approved by the
Garmian Block co-venturers. However, the development plan for the Kurdamir
Block has not yet been approved by the KRG and the Company will continue to
evaluate, monitor and assess relevant factors which may impact anticipated
future capital requirements and spending, including the following:

/T/

— The results of the shareholder vote and other conditions to closing

under the Arrangement Agreement;
— The ability to access other sources of funding for development
activities in the Kurdistan Region, if required;
— The expected timing and scope of development activities based upon an
appropriate phasing reflective of the approved development plans,
current market conditions, and the political and security situation
within Iraq;
— The ability to export or to sell oil and natural gas in accordance with
the economic terms of the PSCs;
— The level of cash flow generated from sales of crude oil and stability
of payments;
— The continued participation of its co-venturers in development
activities;
— The current conditions of the oil and gas industry given the continued
volatility in world oil prices and its impact on further investment in
the industry and the Kurdistan Region;
— The timing for repayment of the Bridge Loan; and
— The current conditions in the financial markets, including the potential
for further market instability;

/T/

With the existing capital resources on hand, including the proceeds from the
Bridge Loan and expected revenue, the Company anticipates that it is fully
funded for currently planned activities for the next twelve months. However,
additional funding may be required by the Company in the future. The quantum
of, and timing for, such funding will be dependent upon the factors identified
above, and particularly the outcome of the negotiations and final approvals of
the Kurdamir FDP. The Company may delay certain phases of its development plans
if the ability to export or sell into the domestic market oil and natural gas,
and receive timely payment therefor, in accordance with the economic terms of
the PSCs is restricted, unavailable or uncertain, or if the political and
security situation within Iraq is not suitable. If the Arrangement Agreement
entered into with Crest is not completed for any reason, the sources for any
required additional funding may include potentially accessing the debt and/or
equity markets or seeking additional partnerships, farmouts or other strategic
arrangements.

About WesternZagros Resources Ltd.

WesternZagros is an international natural resources company focused on
acquiring properties and exploring for, developing and producing crude oil and
natural gas in Iraq. WesternZagros, through its wholly-owned subsidiaries,
holds a 40 percent working interest in two Production Sharing Contracts with
the Kurdistan Regional Government in the Kurdistan Region of Iraq.
WesternZagros’s shares trade in Canada on the TSX Venture Exchange under the
symbol “WZR”.

This news release certain forward-looking statements relating to, but not
limited to, anticipated capital and other commitments and the timing thereof,
expectations regarding the necessity for further funding and the timing and
potential sources thereof, operational information, development plans,
anticipated capacity of facilities, expected production rates, revenues and
petroleum costs (as defined in each PSC), statements regarding the plan of
arrangement under the Arrangement Agreement (the “Arrangement”) and the
anticipated timing for holding the required shareholder meeting and completing
the Arrangement. Forward-looking information typically contains statements with
words such as “anticipate”, “estimate”, “expect”, “potential”, “could”, or
similar words suggesting future outcomes. The Company cautions readers and
prospective investors in the Company’s securities to not place undue reliance
on forward-looking information as, by its nature, it is based on current
expectations regarding future events that involve a number of assumptions,
inherent risks and uncertainties, which could cause actual results to differ
materially from those anticipated by WesternZagros.

Forward looking information is not based on historical facts but rather on
management’s current expectations as well as assumptions made by, and
information currently available to management, concerning, among other things,
development plans, future capital and other expenditures (including the timing,
amount, nature and sources of funding thereof), the outcomes of future well
operations, drilling activity and testing, the installation and commissioning
of facilities, the ability to access financing as required, the continued
ability to sell production in the domestic or export markets and the quantum
and timing of payments to be received in connection therewith, anticipated
operating costs, future economic conditions, future currency and exchange
rates, continued political stability, continued security in the Kurdistan
Region, timely receipt of any necessary co-venturer, government or regulatory
approvals, the successful resolution of any disputes, the Company’s continued
ability to employ qualified staff and the continued participation of the
Company’s co-venturers in joint activities. In addition, budgets are based upon
WesternZagros’s current development plans and anticipated costs, both of which
are subject to change based on, among other things, the outcome of negotiations
with co-venturers and the government, the actual outcomes of well operations,
drilling activity and testing and the installation and commissioning of
facilities, unexpected delays, availability of future financing and changes in
market conditions. Although the Company believes the expectations and
assumptions reflected in such forward-looking information are reasonable, they
may prove to be incorrect. Forward-looking information involves significant
known and unknown risks and uncertainties. A number of factors could cause
actual results to differ materially from those anticipated by WesternZagros
including, but not limited to, risks associated with the oil and gas industry
(e.g. operational risks in development and production; inherent uncertainties
in interpreting geological data; changes in plans with respect to capital
expenditures; interruptions in operations together with any associated
insurance proceedings; the uncertainty of estimates and projections in relation
to timing, costs and expenses and health, safety and environmental risks), the
risk of commodity price and foreign exchange rate fluctuations, risks relating
to the ability to access the export or domestic markets and to receive payments
in accordance with the PSC terms on a timely basis, risks relating to the
ability to access financing as and when needed, the uncertainty associated with
any dispute resolution proceedings, the uncertainty associated with negotiating
with foreign governments and the risk associated with international activity,
including the lack of federal petroleum legislation, ongoing political disputes
and recent terrorist activities in Iraq in particular.

In respect of the forward-looking statements and information concerning the
completion of the Arrangement and the anticipated timing for completion of the
Arrangement, WesternZagros has provided such in reliance on certain assumptions
that it believes are reasonable at this time, including assumptions as to the
time required to prepare and mail meeting materials, the ability of the parties
to receive, in a timely manner and on satisfactory terms, the necessary
regulatory, court, shareholder, TSX Venture Exchange and other third party
approvals and the ability of the parties to satisfy, in a timely manner, the
other conditions to the completion of the Arrangement. These dates may change
for a number of reasons, including unforeseen delays in preparing meeting
materials; inability to secure necessary shareholder, regulatory, court or
other third party approvals in the time assumed or the need for additional time
to satisfy the other conditions to the completion of the Arrangement. Risks and
uncertainties that may cause such differences include but are not limited to:
the risk that the Arrangement may not be completed on a timely basis, if at
all; the conditions to the consummation of the Arrangement may not be
satisfied; the risk that the Arrangement may involve unexpected costs,
liabilities or delays; the possibility that legal proceedings may be instituted
against WesternZagros and/or others relating to the Arrangement and the outcome
of such proceedings; the possible occurrence of an event, change or other
circumstance that could result in termination of the Arrangement; risks
relating to the failure to obtain necessary shareholder and court approval;
other risks inherent in the oil and gas industry. Failure to obtain the
requisite approvals, or the failure of the parties to otherwise satisfy the
conditions to or complete the Arrangement, may result in the Arrangement not
being completed on the proposed terms, or at all. In addition, if the
Arrangement is not completed, the announcement of the Arrangement and the
dedication of substantial resources of WesternZagros to the completion of the
Arrangement could have a material adverse impact on WesternZagros’s share
price, its current business relationships and on the current and future
operations, financial condition and prospects of WesternZagros.

Readers are cautioned that the foregoing list of important factors is not
exhaustive and that these factors and risks are difficult to predict. The
forward-looking statements contained in this news release are made as of the
date of this news release and, except as required by law, WesternZagros does
not undertake any obligation to update publicly or to revise any of the
included forward-looking statements, whether as a result of new information,
future events or otherwise. The forward-looking statements contained in this
news release are expressly qualified by this cautionary statement. See the
“Risk Factors” section of the Company’s Annual Information Form (“AIF”) dated
March 14, 2017 filed on SEDAR at www.sedar.com for a further description of
these risks and uncertainties facing WesternZagros. Additional information
relating to WesternZagros is also available on SEDAR at www.sedar.com,
including the Company’s AIF.

Non-IFRS Measures

Field netback is a non-IFRS measure that represents the Company’s working
interest share of oil sales, after deducting royalties and operating expenses.
Management believes that the field netback is a useful measure to analyze
operating performance and provides an indication of the Company’s results of
business activities prior to other income and expenses. Field netback does not
have a standard meaning under IFRS and may not be comparable to similar
measures used by other companies. It should not be considered in isolation or
as a substitute for measures of performance prepared in accordance with IFRS
such as total income (loss) or cash flow from (used in) operating activities.
See the “Financial Performance” section of the Company’s MD&A dated May 25,
2017 for a reconciliation of field netback.

Reserves and Resources Advisory

In addition, statements relating to reserves and other resources contained
herein are deemed to be forward-looking statements, as they involve the implied
assessment, based on certain estimates and assumptions that the resources
described can be economically produced in the future. Future net revenue values
are estimated values only and do not represent fair market value. There is no
assurance that the forecast prices and cost assumptions, the initial phases of
the development plans as submitted to the KRG and anticipated future phases
contemplated in completing the full field development utilized in such
estimated values will be attained and variances could be material. The reserve
and resource estimates provided herein are estimates only and there is no
assurance that the estimated reserves and other resources will be recovered.
Actual reserves and other resources may be greater than or less than the
estimates provided herein. Terms related to resource classifications referred
to herein are based on the definitions and guidelines in the Canadian Oil and
Gas Evaluation Handbook which are as follows. The reserves have been evaluated
by Sproule International Limited (“Sproule”). Resources other than reserves
have been estimated by the Company and audited by Sproule.

“Reserves” are estimated remaining quantities of oil and natural gas and
related substances anticipated to be recoverable from known accumulations, as
of a given date, based on (a) analysis of drilling, geological, geophysical and
engineering data, (b) the use of established technology and (c) specified
economic conditions which are generally accepted as being reasonable and shall
be disclosed. Reserves are classified as Proved, Probable or Possible according
to the degree of certainty associated with the estimates. “Proved Reserves” are
those Reserves that can be estimated with a high degree of certainty to be
recoverable. It is likely that the actual remaining quantities recovered will
exceed the estimated Proved Reserves. If probabilistic methods are used, there
should be at least a 90 percent probability that the quantities actually
recovered will equal or exceed the estimated Proved Reserves. “Probable
Reserves” are those additional Reserves that are less certain to be recovered
than Proved Reserves. It is equally likely that the actual remaining quantities
recovered will be greater or less than the sum of the estimated Proved plus
Probable (2P) Reserves. If probabilistic methods are used, there should be at
least a 50 percent probability that the quantities actually recovered will
equal or exceed the sum of the estimated 2P Reserves. “Possible Reserves” are
those additional Reserves that are less certain to be recovered than Probable
Reserves. It is unlikely that the actual remaining quantities recovered will
exceed the sum of the estimated Proved plus Probable plus Possible (3P)
Reserves. If probabilistic methods are used, there should be at least a 10
percent probability that the quantities actually recovered will equal or exceed
the sum of the estimated 3P Reserves.

“Contingent Resources” are those quantities of petroleum estimated, as of a
given date, to be potentially recoverable from known accumulations using
established technology or technology under development, but which are not
currently considered to be commercially recoverable due to one or more
contingencies. Contingent Resources have an associated chance of development
(economic, regulatory, market and facility, corporate commitment or political
risks). The Contingent Resources estimates referred to herein have not been
risked for the chance of development. There is no certainty that the Contingent
Resources will be developed and, if developed, there is no certainty as to the
timing of such development or that it will be commercially viable to produce
any portion of the Contingent Resources.

“Prospective Resources” are those quantities of petroleum estimated, as of a
given date, to be potentially recoverable from undiscovered accumulations by
application of future development projects. Prospective Resources have both an
associated chance of discovery (geological chance of success) and a chance of
development (economic, regulatory, market, facility, corporate commitment or
political risks). The chance of commerciality is the product of these two risk
components. Unless otherwise indicated, the estimates referred to herein have
not been risked for either the chance of discovery or the chance of
development. There is no certainty that any portion of the Prospective
Resources will be discovered. If a discovery is made, there is no certainty
that it will be developed or, if it is developed, there is no certainty as to
the timing of such development or that it will be commercially viable to
produce any portion of the Prospective Resources.

Gross Block resource estimates presented herein represent the total volumes for
the indicated reservoirs attributable to 100 percent of the relevant block,
without any adjustment for the Company’s working interest therein whereas the
Working Interest (Gross) or Company Gross resource estimates presented
represent the Company’s 40 percent working interest (operating or
non-operating) share before deduction of royalty petroleum, profit petroleum,
production bonuses and capacity building support payments pursuant to the
provisions of the applicable Production Sharing Contract.

Best Estimate (P50) or (2C) is considered to be the best estimate of the
quantity that will actually be recovered. It is equally likely that the actual
remaining quantities recovered will be greater of less than the best estimate.
If probabilistic methods are used, there should be at least a 50 percent
probability that the quantities actually recovered will equal or exceed the
best estimate.

A barrel of oil equivalent (BOE) is determined by converting a volume of
natural gas to barrels using the ratio of 6 thousand cubic feet (Mcf) to one
barrel. BOEs may be misleading, particularly if used in isolation. A BOE
conversion ratio of 6 Mcf:1 BOE is based on an energy equivalency conversion
method primarily applicable at the burner tip and does not represent a value
equivalency at the wellhead. Given that the value ratio based on the current
price of oil as compared to natural gas is significantly different from the
energy equivalency of 6:1, utilizing a conversion on a 6:1 basis may be
misleading as an indication of value.

The section “Statement of Reserves and Other Oil and Gas Information”
(including Schedule A) contained in the Company’s AIF dated March 14, 2017
filed on SEDAR at www.sedar.com, contains additional detail with respect to the
Company’s resource assessments and the estimates of net present value
associated with its Reserves. This section includes the significant risks and
uncertainties associated with the volume estimates and the recovery and
development of the resources, the forecast prices and cost assumptions,
descriptions of the applicable projects and FDPs and the specific contingencies
which prevent the classification of the Contingent Resources as Reserves.
As indicated above, unless otherwise indicated, the estimates of Contingent
Resources and Prospective Resources contained in this document are presented on
an unrisked basis. Readers should refer to the AIF for the associated risked
estimates of Contingent Resources and Prospective Resources. Such risked
estimates are based upon the Company’s estimates of chance of commerciality set
forth therein which involves assessing various risks based upon a number of
assumptions and other factors. While the Company believes that such estimates
and underlying assumptions are reasonable, many of these assumptions are beyond
the Company’s control, are subject to change and may not, over time, prove to
be accurate. As such, the actual level of various risks (including those
currently identified and additional risks which may be identified in the
future) could prove to be greater and the chance of commerciality lower than
currently estimated and such differences could be material.

NEITHER THE TSX VENTURE EXCHANGE NOR ITS REGULATION SERVICES PROVIDER (AS THAT
TERM IS DEFINED IN POLICIES OF THE TSX VENTURE EXCHANGE) ACCEPTS RESPONSIBILITY
FOR THE ADEQUACY OR ACCURACY OF THIS RELEASE

– END RELEASE – 26/05/2017

For further information:
WesternZagros
Tony Kraljic
Senior VP Finance
(403) 693-7011
OR
WesternZagros
Lisa Harriman
Manager of Corporate Communications and Administration
(403) 693-7017
[email protected]
www.westernzagros.com

COMPANY:
FOR: WESTERNZAGROS RESOURCES LTD.
TSX VENTURE SYMBOL: WZR

INDUSTRY: Energy and Utilities – Oil and Gas
RELEASE ID: 20170526CC0004

Press Release from Marketwired 1-866-736-3779

All press releases are written by the client and have NO affiliation with the news copy written by The Canadian Press. Any questions that arise due to the content or information provided in the press release should be directed to the company/organization
issuing the release, not to The Canadian Press.

GET ENERGYNOW’S DAILY EMAIL FOR FREE


Kinder Morgan announces final investment decision on Trans Mountain pipeline

VANCOUVER — Kinder Morgan says it will proceed with the $7.4-billion Trans Mountain pipeline expansion as long as it secures satisfactory financing for the project through its initial public offering.

The Texas-based company, in conjunction with its indirect subsidiary Kinder Morgan Canada, announced Thursday its final investment decision on the project, which is conditional on the successful completion of the IPO.

The company has offered 102.9 million shares at a price of $17 per share in an effort to raise $1.75 billion. The public offering is set to close May 31.

The IPO would be one of the biggest ever on the Toronto Stock Exchange and Kinder Morgan spokesman Dave Conover says the company is confident it will be a success.

Conover said the timing of the public offering wasn’t intended to coincide with British Columbia’s provincial election which has created political uncertainty. The process is proceeding because the project’s financing contingency period, as specified in shipper agreements, concludes at the end of May.

B.C.’s election has left the anti-pipeline Greens holding the balance of power in a minority situation in the legislature, raising concerns they will use their influence to persuade whichever party forms the government to take measures to block the project. The Liberals and NDP are in negotiations with the Greens.

“We’re confident that we can work with whether it’s a Clark minority government or a new coalition government,” Conover said. “I’m sure that we’ll be talking to all three of the parties as the months unfold.”

Green Leader Andrew Weaver has previously said the party believes it has a responsibility to stop the federally approved project, which would triple the shipment capacity of Alberta oil products to British Columbia’s coast.

Alberta’s securities regulator is also reviewing Kinder Morgan’s regulatory filings after a request from Greenpeace, which said it believes the documents overestimate growth in Asian oil demand and don’t go far enough in disclosing risks related to climate change.

The project does have the support of Alberta Premier Rachel Notley, who has said opponents of the pipeline expansion have no power to stop it nor should they hold hostage the economy of another province.

Despite the opposition, Conover said the federal government, which has the authority to approve the project, already provided the necessary go-ahead last year.

B.C.’s Liberal government also negotiated a 20-year revenue-sharing agreement worth about $1 billion with Kinder Morgan before the election.

Conover said a new provincial government would have to take “pretty significant actions to repeal or override” the existing agreement.

Instead, he said he’s confident the company can address any concerns about the construction, safety or environmental implications of the project a new government may have within the existing framework.

Kinder Morgan says it’s expecting to begin construction for the project in September, with a completion date set for December 2019. 

The Canadian Press

GET ENERGYNOW’S DAILY EMAIL FOR FREE


Alberta Energy Regulator to reconsider Suncor tailings plan it rejected

CALGARY — Alberta’s energy watchdog has agreed to reconsider a plan by Suncor Energy to clean up its tailings ponds so as to take into account new technology the oilsands giant plans to use.

The Alberta Energy Regulator in March denied the Calgary-based company’s plan for its Millennium mine. But the regulator said in a letter to a Suncor vice-president this week that it has reviewed the company’s request for reconsideration and decided that it would be appropriate in this case.

Tailings ponds contain waste resulting from oilsands extraction and contain water, fine clay particles, residual bitumen and other chemicals. Alberta Energy estimates oilsands mining projects had created about 220 square kilometres of tailings ponds by the end of 2013.

Suncor (TSX:SU) had proposed to treat 75 per cent of its Millennium mine’s tailings by clumping fine particles together and covering that material with fresh water.

In its rejection of the plan, the energy regulator called water-capping an unproven method and said more information was needed about its risks, benefits, alternatives and reclamation timelines.

The regulator now says it was not aware at the time of technology Suncor plans to use and it should be considered in an assessment.

The method involves using flocculants and coagulants to separate particles from water and to firm them up before placing them at the bottom of a mined-out pit.

The pit is then filled with fresh water and made into a lake that can support an aquatic ecosystem and recreation. Suncor aims to keep harmful chemicals trapped beneath the lake bottom for good.

“At the time the applications were filed, our evaluation of that process was still in development, so we couldn’t describe the process in great detail in terms of how it would work,” said company spokeswoman Sneh Seetal.

The regulator said it accepts Suncor’s explanation for why it couldn’t share details prior to getting a patent.

“The AER would ask that Suncor inform the AER of any such restrictions and potential delays so as to avoid this situation in future,” the letter reads.

“Given these unusual circumstances, the AER will reconsider the applications.”  

The energy regulator introduced new rules last summer that require companies to have tailings ponds ready to reclaim within 10 years of the end of a mine’s life. Those rules replaced more stringent tailings pond regulations put in place in 2009 that the industry said it couldn’t meet.

Nina Lothian, a senior analyst at the clean-energy think tank Pembina Institute, said details about Suncor’s technology only address a small part of what was lacking in the company’s plan.

“It’s concerning that the AER reneged on their initial denial based on this one additional piece of information,” she said.  

“The issues that were raised on the Suncor plan are actually endemic of all the tailings management plans that have been submitted by industry.”

Tim Gray, executive director of Environmental Defence, said oilsands operators are proposing to use water-capping because it’s a relatively inexpensive way to deal with tailings.

“You just put more water on top of them and walk away and hope nature fixes it, but of course we don’t have any evidence to show that works,” he said.

“We’re creating this huge future environmental and financial liability for the Alberta and the Canadian taxpayer based on unproven technology.”


Lauren Krugel, The Canadian Press

GET ENERGYNOW’S DAILY EMAIL FOR FREE


Trump plan to sell off half of oil stockpile sparks debate

WASHINGTON — President Donald Trump’s proposal to sell nearly half the U.S. emergency oil stockpile is renewing debate about whether the Strategic Petroleum Reserve is still needed amid an ongoing oil production boom that has seen U.S. imports drop sharply in the past decade.

Trump’s budget, unveiled on Tuesday, calls for selling an additional 270 million barrels of oil over the next decade, raising an estimated $16.6 billion. The proposal, on top of planned auctions expected over the next few years, could push the reserve below 300 million barrels by 2025. It now is at 688 million barrels.

The petroleum reserve, created in the wake of the 1970s Arab oil embargo, stores oil at four underground sites in Texas and Louisiana. The reserve guards against disruptions in the flow of oil from the Middle East and other countries, and lawmakers from both parties have long warned against using it to raise money.

But some Republicans say North Dakota’s oil-rich Bakken region offers a de facto reserve that can be tapped if needed.

“You know the world’s changed a lot,” said Rep. John Shimkus, R-Ill., a senior member of the House energy committee. “We’re one of the largest oil producers in the world.”

Asked if he was worried that Trump’s proposal could deplete the reserve, Shimkus laughed. “Not when you have North Dakota and the Dakota (Access) Pipeline,” he said.

Not all Republicans agree. The petroleum reserve “is not an ATM for new spending,” Alaska Sen. Lisa Murkowski said in 2015 as the Obama administration proposed selling off a smaller of portion of the reserve to help fund a budget agreement.

Murkowski, who chairs the Senate energy committee, was reviewing Trump’s proposal but “is generally opposed to selling off emergency oil reserves, particularly as pay-fors for unrelated measures” a spokeswoman said Wednesday.

Sen. Maria Cantwell of Washington state, the senior Democrat on the energy panel, vowed to defeat Trump’s plan.

“We are not going to let Donald Trump auction off our energy security to the highest bidder,” she said.

“The SPR exists to keep energy available and affordable in times of crisis or natural disaster, which helps low-income communities most,” said Rep. Raul Grijalva of Arizona, the top Democrat on the House Natural Resources Committee.

Selling the reserve “to pay for tax cuts for the extremely rich is especially cruel,” Grijalva said, calling the plan a “short-sighted favour to oil billionaires.”

Richard Newell, a former head of the U.S. Energy Information Administration, said the plan could cause the United States to break its obligation as a member of the International Energy Agency to hold 90 days’ worth of oil imports on reserve. Currently, the SPR holds about 145 days’ worth of oil imports.

Budget director Mick Mulvaney said the proposed sale would not cause a security risk, citing increased oil production from fracking and other drilling techniques that have opened up areas once out of reach.

The sales should not affect global oil prices because they would be carefully staged over a decade, Mulvaney said.

“I don’t need to take this much of your money and bury it in the ground out in western Texas someplace for domestic security and national security reasons when we have domestic surpluses like we do,” he said at a budget briefing this week.

Jason Bordoff, director of Columbia University’s Center on Global Energy Policy, warned that selling off large parts of the reserve could cause a price spike if there’s a supply disruption in Venezuela or elsewhere.

“It would be foolish to sell off this 40-year-old strategic stockpile given continued risks to global oil supply, uncertainty about the longevity of the shale revolution and historically low levels of spare capacity held by OPEC countries to cushion supply shocks,” said Bordoff, who served as an energy adviser to President Barack Obama.

Energy analyst Kevin Book said sale of the whole 270 million barrels is unlikely, given congressional opposition, but said additional sales beyond those now scheduled are probable.

Rep. Greg Walden, R-Ore., chairman of the House Energy Committee, said the reserve “made sense when we were hostage, potentially, to others. But now with a changed landscape, it calls for a review.”

___

Follow Matthew Daly: http://twitter.com/MatthewDalyWDC

Matthew Daly, The Associated Press


GET ENERGYNOW’S DAILY EMAIL FOR FREE


MEG Energy provides Annual and Special Meeting voting results

FOR: MEG ENERGY CORP.TSX Symbol: MEGDate issue: May 25, 2017Time in: 8:05 PM eAttention:
CALGARY, AB –(Marketwired – May 25, 2017) – MEG Energy Corp. (TSX: MEG)
announces voting results from its Annual and Special Meeting of Shareholders
held on May…

GET ENERGYNOW’S DAILY EMAIL FOR FREE


Federal government’s methane emission reduction plan raises industry concerns

CALGARY — Tougher methane emission regulations unveiled Thursday are expected to create oil and gas services jobs, but have raised concern that the costs of implementation could further weaken an industry hit hard by two years of commodity price uncertainty.

The new restrictions to be phased in between 2020 and 2023 will require energy companies to regularly check equipment for leaks, make repairs, use cleaner technologies, monitor emission levels and report results to Ottawa.

The federal government estimates the regulations would cost industry $3.3 billion from 2018 to 2035, but says the costs of avoiding action on climate change would be more than four times that.

Mark Salkeld, CEO of the Petroleum Services Association of Canada, said the initiative would likely create jobs for his members, but noted the cost is too high when added to provincial and federal carbon price proposals.

“There’s more concern right now that it’s going to hurt the industry than there is excitement about opportunities,” he said.

Terry Abel, executive vice-president of the Canadian Association of Petroleum Producers, said his organization will be recommending changes to the proposed regulations that will reduce the cost of implementation by half or more while retaining the targets and timeline.

“Our industry is facing increased competition globally for capital … Any incremental cost just contributes to that overall competitiveness burden,” Abel said.

Methane is considered far more potent than carbon dioxide in trapping heat in the atmosphere. It is the main component of natural gas.

The United States and Canada agreed last year to jointly slash oil and gas methane emissions to between 40 and 45 per cent over 2012 levels by 2025.

Canada planned to implement regulations between 2018 and 2020 to reach the target, but Ottawa decided in April to delay for three years after U.S. President Donald Trump signed an executive order to reconsider the methane cuts.

The Trump order was blocked this month in the U.S. Senate, but Environment Minister Catherine McKenna said Thursday that Canada will follow the delayed schedule to ensure industry has sufficient time to implement the measures.

She added the 2025 target timeline also remains in place. The regulations are expected to be finalized next year.

“Today our climate plan is quickly moving into the implementation phase where we will see real results and spark real change,” McKenna said.

She said the new rules will be less stringent than those in the U.S., where federal law has restricted methane emissions since 2012 and oil and gas producing states like California, Colorado and Wyoming have added their own laws.

Environmentalists welcomed the new regulations, but said they don’t go far enough.

Diane Regas, executive director of the Environmental Defense Fund, said stronger rules are needed for Canada to meet its climate targets and match U.S. methane controls.

“This is a critical first step,” said Duncan Kenyon, a policy director at the Pembina Institute. “It’s going to start everyone thinking about how we’re actually make this happen in practise.”

The federal government said it is also moving ahead with regulations to reduce leaks of air pollutants from refineries, oilsands upgraders and petrochemical plants, estimating the cost to industry at $254 million.

McKenna wouldn’t directly answer the question of what the government will do if energy producers refuse or can’t afford to comply with the regulations, instead pointing out captured methane can be sold and thus provides a financial incentive to stop leaks.

She said provinces and territories will have the option to develop their own regulations if they achieve the same results.


Follow @HealingSlowly on Twitter.

Dan Healing, The Canadian Press

GET ENERGYNOW’S DAILY EMAIL FOR FREE


Relentless announces Financial and Operating results for the three months ended March 31, 2017

FOR: RELENTLESS RESOURCES LTD.
TSX VENTURE SYMBOL: RRL

Date issue: May 25, 2017
Time in: 6:40 PM e

Attention:

CALGARY, ALBERTA–(Marketwired – May 25, 2017) – Relentless Resources Ltd.
(“Relentless” or the “Company”) (TSX VENTURE:RRL) announces that it has issued
and filed on SEDAR its March 31, 2017 unaudited condensed interim financial
statements and related management’s discussion and analysis (“MD&A”).
Additional information about Relentless is available on SEDAR at www.sedar.com
or on the Company’s website at www.relentless-resources.com.

Corporate update

Relentless averaged 272 boed (58% oil and liquids) in Q1 2017, up 17% from the
same period last year, and up 42% from the previous quarter. Royalties payable
increased to $3.49/boe due to higher commodity pricing on variable crown
royalties. Operating costs were up 8% to $14.10/boe compared to the previous
quarter. General and administration costs (“G&A”) were down slightly compared
to the previous quarters at $4.82/boe.

On May 25, 2017, the Company renewed its revolving demand operating loan
facility (the “Facility”), with the principal amount at $3,000,000. The
Facility is available until May 31, 2018, at which time it may be extended, at
the lender’s option. Interest payable on amounts drawn under the Facility is at
the lender’s prime rate plus 2.0 percent. The Facility is collateralized by a
general security agreement and a first ranking charge on all lands of the
Company.

The two new Heathdale oil wells drilled and completed in Q4 2016 continue to
track with the Company’s expectations.

The 02/5-7-27-9 horizontal well is producing approximately 70 boed (80% oil).
The 6-12-27-10 W4 vertical step-out well is producing approximately 12 boed
(100% oil) after a recent sand clean-out and pump change.

The Heathdale oil property has been delineated with 5 vertical wells and
developed with 4 horizontal wells. The Company believes that there is a
significant medium gravity oil reserve captured at Heathdale that will be
further developed once the oil price recovers. All the necessary facilities are
in place to ramp production when feasible.

Relentless’ go forward capital program depends on the price of oil and natural
gas and the ability to finance. Without further increases to realized pricing,
the Company will defer any drilling projects to conserve reserves and cash flow
for future benefit. Relentless continues to explore various opportunities to
grow and enhance shareholder value.

Relentless is a unique low G&A, high insider ownership and conforming junior
oil and gas company with low risk, high working interest medium gravity oil
opportunities at Heathdale. The Company’s management and directors once again
thank you for your patience and continued support.

Cash flow, comprehensive loss and netbacks

/T/

—————————————————————————-
Three months ended
March 31, 2017 2016 % 2017 2016 %
Change ($/boe) ($/boe) Change
—————————————————————————-
Oil and natural gas
sales 925,887 481,013 92 37.87 23.03 64
Royalties (85,391) (32,376) 164 (3.49) (1.54) 127
—————————————————————————-
Revenue after
royalties 840,496 448,637 87 34.38 21.47 60
Production, operating
and transportation
expenses (344,679) (273,696) 26 (14.10) (13.09) 8
—————————————————————————-
Operating cash flow
(1) 495,817 174,941 183 20.28 8.38 142
General &
administrative
expenses (117,937) (109,742) 7 (4.82) (5.25) (8)
Interest and other
financing charges (18,239) (47,621) 62 (0.75) (2.28) 67
—————————————————————————-
Cash flow from
operations (1) 359,641 17,578 1,946 14.71 0.84 (1648)
Accretion (1,629) (16,213) (90) (0.07) (0.78) (91)
Depletion and
depreciation (254,296) (256,558) (1) (10.40) (12.28) (15)
Impairment (117,835) (122,866) (4) (4.82) (5.87) (18)
—————————————————————————-
Comprehensive loss (14,119) (378,059) (96) (0.58) (18.10) (97)
—————————————————————————-
$ Per Share – Basic (0.00) (0.01)
$ Per Share – Diluted (0.00) (0.01)
—————————————————————————-

/T/

(1) Non-IFRS measure

Daily production and commodity prices

/T/

—————————————————————————-

Three months ended March 31
—————————————————————————-
2017 2016 % Change
—————————————————————————-
Daily production
Oil and NGLs (bbl/d) 159 120 33
Natural gas (mcf/d) 675 674 0
—————————————————————————-
Oil equivalent (boe/d @ 6:1) 272 232 17
—————————————————————————-

Realized commodity prices ($CDN)
Oil and NGLs (bbl) $ 51.30 $ 31.58 62
Natural gas (mcf) $ 3.14 $ 2.32 35
—————————————————————————-
Oil equivalent (boe @ 6:1) $ 37.87 $ 23.03 64
—————————————————————————-

/T/

Forward-Looking Statements: All statements, other than statements of historical
fact, set forth in this news release, including without limitation, assumptions
and statements regarding the volumes and estimated value of the Company’s
proved and probable reserves, future production rates, exploration and
development results, financial results, and future plans, operations and
objectives of the Company are forward-looking statements that involve
substantial known and unknown risks and uncertainties. Some of these risks and
uncertainties are beyond management’s control, including but not limited to,
the impact of general economic conditions, industry conditions, fluctuation of
commodity prices, fluctuation of foreign exchange rates, environmental risks,
industry competition, availability of qualified personnel and management,
availability of materials, equipment and third party services, stock market
volatility, timely and cost effective access to sufficient capital from
internal and external sources. The reader is cautioned that assumptions used in
the preparation of such information, although considered reasonable by the
Company at the time of preparation, may prove to be incorrect. There can be no
assurance that such statements will prove to be accurate and actual results and
future events could differ materially from those anticipated in such statements.

These assumptions and statements necessarily involve known and unknown risks
and uncertainties inherent in the oil and gas industry such as geological,
technical, drilling and processing problems and other risks and uncertainties,
as well as the business risks discussed in the MD&A under the heading “Business
Risks”. The Company does not undertake any obligation, except as required by
applicable securities legislation, to update publicly or to revise any of the
included forward-looking statements, whether as a result of new information,
future events or otherwise.

Barrels of oil equivalent (boe) is calculated using the conversion factor of 6
mcf (thousand cubic feet) of natural gas being equivalent to one barrel of oil.
Boes may be misleading, particularly if used in isolation. A boe conversion
ratio of 6 mcf:1 bbl (barrel of oil) is based on an energy equivalency
conversion method primarily applicable at the burner tip and does not represent
a value equivalency at the wellhead. Given that the value ratio based on the
current price of crude oil as compared to natural gas is significantly
different from the energy equivalency of 6:1, utilizing a conversion on a 6:1
basis may be misleading as an indication of value. Boed means boe per day.

This news release provides certain financial measures that do not have a
standardized meaning prescribed by International Financial Reporting Standards
(“IFRS”). These non-IFRS financial measures may not be comparable to similar
measures presented by other issuers. Cash flow from operations and operating
cash flow are not recognized measures under IFRS. Management believes that in
addition to net income (loss), cash flow from operations and operating cash
flow are useful supplemental measures that demonstrate the Company’s ability to
generate the cash necessary to repay debt or fund future capital investment.
Investors are cautioned, however, that these measures should not be construed
as an alternative to net income (loss) determined in accordance with IFRS as an
indication of the Company’s performance. The Company’s method of calculating
these measures may differ from other companies and accordingly, they may not be
comparable to measures used by other companies. Cash flow from operations is
calculated by adjusting net income (loss) for other income, unrealized gains or
losses on financial derivative instruments, transaction costs, accretion, share
based compensation, impairment and depletion and depreciation. Operating cash
flow is calculated based on oil and gas revenue less royalties and operating
expenses.

Neither TSX Venture Exchange nor its Regulation Services Provider (as that term
is defined in the policies of the TSX Venture Exchange) accepts responsibility
for the adequacy or accuracy of this release.

About Relentless Resources Ltd.

Relentless is a Calgary based emerging oil and natural gas company, engaged in
the exploration, development, acquisition and production of natural gas and
light gravity crude oil reserves in Alberta, Canada. Relentless’s common shares
trade on the TSX Venture Exchange under the symbol RRL.

Relentless’s primary corporate objective is to achieve non-dilutive growth and
enhance shareholder value through internal prospect development, strategic
production acquisitions and prudent financial management.

– END RELEASE – 25/05/2017

For further information:
Relentless Resources Ltd.
Dan Wilson
CEO
(403) 532-4466 ext. 227 or Mobile: (403) 874-9862
(587) 955-9668 (FAX)
[email protected]
OR
Relentless Resources Ltd.
Ron Peshke
President
(403) 532-4466 ext. 223 or Mobile: (403) 852-3403
(587) 955-9668 (FAX)
[email protected]
www.relentless-resources.com

COMPANY:
FOR: RELENTLESS RESOURCES LTD.
TSX VENTURE SYMBOL: RRL

INDUSTRY: Energy and Utilities – Oil and Gas
RELEASE ID: 20170525CC0111

Press Release from Marketwired 1-866-736-3779

All press releases are written by the client and have NO affiliation with the news copy written by The Canadian Press. Any questions that arise due to the content or information provided in the press release should be directed to the company/organization
issuing the release, not to The Canadian Press.

GET ENERGYNOW’S DAILY EMAIL FOR FREE


Steel Reef Announces $0.0175 Per Common Share Dividend

FOR: STEEL REEF INFRASTRUCTURE CORP.
Date issue: May 25, 2017Time in: 6:36 PM eAttention:
CALGARY, ALBERTA–(Marketwired – May 25, 2017) – Steel Reef Infrastructure
Corp. (“Steel Reef”) is pleased to announce the declaration of a dividend of
$0.0175 p…

GET ENERGYNOW’S DAILY EMAIL FOR FREE


Trilogy Energy Corp. Announces Agreement to Sell Certain Duvernay Assets in the Kaybob Area for $60 Million and Provides an Update on Its Previously Announced Grande Prairie Area Disposition

FOR: TRILOGY ENERGY CORP.
TSX SYMBOL: TET

Date issue: May 25, 2017
Time in: 6:19 PM e

Attention:

CALGARY, ALBERTA–(Marketwired – May 25, 2017) – Trilogy Energy Corp.
(“Trilogy” or the “Company”) (TSX:TET) is pleased to announce that it has
entered into an agreement to sell certain Duvernay assets in the Kaybob area of
Alberta and provide an update on its previously announced asset sale in the
Grande Prairie area of Alberta.

Kaybob Duvernay Asset Sale

Trilogy has entered into a definitive agreement to sell approximately 9.75 net
sections of Duvernay mineral rights in its Kaybob Duvernay play and its 11.0%
interest in a non-operated gas plant for cash consideration of $60 million
(before adjustments).

The predominantly non-operated Duvernay sale assets have an average production
(net to Trilogy) of approximately 640 Boe/d (2.6 MMcf/d of natural gas and 200
Bbl/d of natural gas liquids) for the month of April, 2017. The transaction
includes Trilogy’s Total Proved Developed Producing reserves attributable to
such assets of approximately 879 MBoe as of December 31, 2016, based on the
year end reserves estimate completed by Trilogy’s independent reserves
evaluator. After completion of this sale, Trilogy will continue to hold a
substantial land position in the Kaybob area Duvernay play with approximately
175 net sections (112,000 net acres) of land in areas prospective for Duvernay
shale development.

The sale is effective May 1, 2017 and is expected to be completed on or about
May 31, 2017.

Grande Prairie Area Asset Sale Update

Trilogy also confirms that its previously announced sale of certain Valhalla
assets in the Grande Prairie area of Alberta for cash consideration of $50
Million (before adjustments) remains conditional pending purchaser’s receipt of
the Alberta Energy Regulator (“AER”) approvals for the transfer of the wells,
pipelines and facilities. The sale is effective May 1, 2017 and is expected to
be completed by the end of May provided the AER approvals are received.

Borrowing Base

Proceeds from the sale of the two transactions described above will be applied
to reduce Trilogy’s indebtedness under its revolving credit facility. Upon
closing of the Valhalla area asset sale, Trilogy’s borrowing base will be
reduced from $300 million to $290 million. Upon closing of the Duvernay asset
sale, Trilogy’s borrowing base will be reduced from $290 million to $285
million. Provided that both of these transactions close by the end of May,
2017, proforma, Trilogy will be drawn $175 million as at May 31, 2017 under its
revolving credit facility leaving Trilogy with capacity of $110 million under
such facility.

Production Outlook

After positive first quarter operational results and factoring in the impact of
the two above mentioned asset sales, Trilogy maintains its current average 2017
annual production guidance of 24,000 Boe/d.

About Trilogy

Trilogy is a petroleum and natural gas-focused Canadian energy corporation that
actively develops, produces and sells natural gas, crude oil and natural gas
liquids. Trilogy’s geographically concentrated assets are primarily high
working interest properties that provide abundant low-risk infill drilling
opportunities and good access to infrastructure and processing facilities, many
of which are operated and controlled by Trilogy. Trilogy’s common shares are
listed on the Toronto Stock Exchange under the symbol “TET”.

Forward-Looking Information

Certain information included in this news release constitutes forward-looking
statements under applicable securities legislation. Forward-looking statements
or information typically contain statements with words such as “anticipate”,
“believe”, “expect”, “plan”, “intend”, “estimate”, “propose”, “budget”, “goal”,
“objective”, “possible”, “probable”, “projected”, scheduled”, or state that
certain actions, events or results “may”, “could”, should”, “would,” “might”,
or “will” be taken, occur or be achieved, or similar words suggesting future
outcomes or statements regarding an outlook. Forward-looking statements or
information in this news release include, but are not limited to:

/T/

— the anticipated closing of transactions to sell certain of Trilogy’s

assets in its Kaybob Duvernay play and in the Grande Prairie area, the
timing thereof and the use of proceeds therefrom;
— the estimated reserves to be divested in the Kaybob Duvernay asset sale
and statements as to the prospectivity of Trilogy’s remaining Duvernay
acreage;
— the expected impact of these dispositions on Trilogy’s borrowing base
under its revolving credit facility and the resulting proforma drawings
and capacity thereunder;
— forecast 2017 annual production levels; and
— other statements regarding the Company’s business strategy and
objectives.

/T/

Such forward-looking statements or information are based on a number of
assumptions which may prove to be incorrect. In addition to other assumptions
identified in this document, assumptions have been made regarding, among other
things:

/T/

— the likelihood that the previously mentioned Kaybob Duvernay and Grande

Prairie asset dispositions will close as planned;
— future crude oil, natural gas, condensate, NGLs and other commodity
pricing and supply;
— funds flow from operations and cash flow consistent with expectations;
— current reserves estimates;
— credit facility availability and access to sources of funding for
Trilogy’s planned operations and expenditures;
— the ability of Trilogy to service and repay its debt when due;
— current production forecasts and the relative mix of crude oil, natural
gas and NGLs therein;
— geology applicable to Trilogy’s land holdings;
— the extent and development potential of Trilogy’s assets;
— the ability of Trilogy and its industry partners to obtain drilling and
operational results, improvements and efficiencies consistent with
expectations (including in respect of anticipated production volumes,
reserves additions and NGL yields);
— well economics;
— decline rates;
— foreign currency, exchange and interest rates;
— royalty rates, taxes and capital, operating, general & administrative
and other costs and expenses;
— assumptions regarding royalties and expenses and the applicability and
continuity of royalty regimes and government incentive programs to
Trilogy’s operations;
— general business, economic, industry and market conditions;
— projected capital investment levels and the successful and timely
implementation of capital projects;
— anticipated timelines and budgets being met in respect of drilling
programs and other operations;
— the ability of Trilogy to obtain equipment, services, supplies and
personnel in a timely manner and at an acceptable cost to carry out its
evaluations and activities;
— the ability of Trilogy to secure adequate product processing,
transportation, fractionation and storage capacity on acceptable terms
or at all and assumptions regarding the timing and costs of run-times,
outages and turnarounds;
— the ability of Trilogy to market its oil, natural gas, condensate, other
NGLs and other products successfully to current and new customers;
— expectation that counterparties will fulfill their obligations under
operating, processing, marketing and midstream agreements;
— the timely receipt of required regulatory approvals;
— the continuation of assumed tax regimes, estimates and projections in
respect of the application of tax laws and estimates of deferred tax
amounts, tax assets and tax pools; and
— the extent of Trilogy’s liabilities.

/T/

Although Trilogy believes that the expectations reflected in such
forward-looking statements or information are reasonable, undue reliance should
not be placed on forward-looking statements because Trilogy can give no
assurance that such expectations will prove to be correct. Forward-looking
statements or information are based on current expectations, estimates and
projections that involve a number of risks and uncertainties which could cause
actual results to differ materially from those anticipated by Trilogy and
described in the forward-looking statements or information. These risks and
uncertainties include but are not limited to:

/T/

— The possibility that the Kaybob Duvernay and Grande Prairie area assets

dispositions will not close when expected or at all;
— fluctuations in crude oil, natural gas, condensate and other natural gas
liquids and commodity prices;
— the ability to generate sufficient funds flow from operations and obtain
financing on acceptable terms to fund planned exploration, development,
construction and operational activities and to meet current and future
obligations ;
— uncertainties as to the availability and cost of financing;
— Trilogy’s ability to satisfy maintenance covenants within its credit and
debt arrangements;
— the risk and effect of a downgrade in Trilogy’s credit rating;
— fluctuations in foreign currency, exchange rates and interest rates;
— the risks of the oil and gas industry, such as operational risks in
exploring for, developing and producing crude oil, natural gas,
condensate and other natural gas liquids, and market demand;
— risks and uncertainties involving the geology of oil and gas;
— the uncertainty of reserves estimates and reserves life;
— the uncertainty of estimates and projections relating to future
production and NG yields as well as costs and expenses;
— the ability of Trilogy to add production and reserves through
development and exploration activities and acquisitions;
— Trilogy’s ability to secure adequate product processing, transmission,
transportation, fractionation and storage capacity on acceptable terms
and on a timely basis or at all;
— potential disruptions or unexpected technical difficulties in designing,
developing, or operating new, expanded, or existing pipelines or
facilities (including third party operated pipelines and facilities);
— risks inherent in Trilogy’s marketing operations, including credit and
other financing risks and the risk that Trilogy may not be able to enter
into arrangements for the sale of its sales volumes;
— volatile business, economic and market conditions;
— general risks related to strategic and capital allocation decisions,
including potential delays or changes in plans with respect to
exploration or development projects or capital expenditures and
Trilogy’s ability to react to same;
— availability of equipment, goods, services and personnel in a timely
manner and at an acceptable cost;
— health, safety, security and environmental risks;
— the timing and cost of future abandonment and reclamation obligations
and potential liabilities for environmental damage and contamination;
— risks and costs associated with environmental, regulatory and
compliance, including those potentially associated with hydraulic
fracturing, greenhouse gases and “climate change” and the cost to
Trilogy in order to comply with same;
— weather conditions;
— the possibility that government policies, regulations or laws may
change, including risks related to the imposition of moratoriums;
— the possibility that regulatory approvals may be delayed or withheld;
— risks associated with Trilogy’s ability to enter into and maintain
leases and licenses;
— uncertainty with regard to royalty payments and the applicability of and
changes to royalty regimes and incentive programs including, without
limitation, applicable royalty incentive regimes and the Modernized
Royalty Framework, the Emerging Resources Program and the Enhanced
Hydrocarbon Recovery Program, among others;
— imprecision in estimates of product sales, commodity prices, capital
expenditures, tax pools, tax deductions available to Trilogy, changes to
and the interpretation of tax legislation and regulations;
— uncertainty regarding results of objections to Trilogy’s exploration and
development plans by third party industry participants, aboriginal and
local populations and other stakeholders;
— risks associated with existing and potential lawsuits, regulatory
actions, audits and assessments;
— changes in land values paid by industry;
— risks associated with Trilogy’s mitigation strategies including
insurance and hedging activities;
— risks related to the actions and financial circumstances of Trilogy
agents and contractors, counterparties and joint venture partners,
including renegotiation of contracts;
— risks relating to cybersecurity, vandalism, and terrorism;
— the ability of management to execute its business plan; and

/T/

other risks and uncertainties described elsewhere in this document and in
Trilogy’s other filings with Canadian securities authorities, including its
Annual Information Form.

The forward-looking statements and information contained in this news release
are made as of the date hereof and Trilogy undertakes no obligation to update
publicly or revise any forward-looking statements or information, whether as a
result of new information, future events or otherwise, unless so required by
applicable securities laws.

Oil and Gas Advisory

This document contains disclosure expressed as “Boe/d” and “MBoe “. All oil and
natural gas equivalency volumes have been derived using the ratio of six
thousand cubic feet of natural gas to one barrel of oil (6:1). Equivalency
measures may be misleading, particularly if used in isolation. A conversion
ratio of six thousand cubic feet of natural gas to one barrel of oil is based
on an energy equivalency conversion method primarily applicable at the burner
tip and does not represent a value equivalency at the well head. For Q1 2017,
the ratio between Trilogy’s average realized oil price and the average realized
natural gas price was approximately 20:1 (“Value Ratio”). The Value Ratio is
obtained using the Q1 2017 average realized oil price of $61.36 (CAD$/Bbl) and
the Q1 2017 average realized natural gas price of $3.09 (CAD$/Mcf).This Value
Ratio is significantly different from the energy equivalency ratio of 6:1 and
using a 6:1 ratio would be misleading as an indication of value.

All reserves information in this News Release is gross reserves. Gross reserves
means Trilogy’s working interest (operating or non-operating) share before
deduction of royalties and without including any royalty interest of Trilogy.
Reserves estimates are based on the independent engineering evaluation prepared
by McDaniel & Associates Consultants Ltd. dated March 7, 2017, evaluating
Trilogy’s crude oil, natural gas and natural gas liquids reserves effective as
of December 31, 2016.

– END RELEASE – 25/05/2017

For further information:
For further information, please contact:
J.H.T. (Jim) Riddell, Chief Executive Officer
J.B. (John) Williams, President and Chief Operating Officer
M.G. (Mike) Kohut, Chief Financial Officer
OR
Trilogy Energy Corp.
#1400, 332 – 6th Avenue S.W.
Calgary, Alberta T2P 0B2
Phone: (403) 290-2900
Fax: (403) 263-8915

COMPANY:
FOR: TRILOGY ENERGY CORP.
TSX SYMBOL: TET

INDUSTRY: Energy and Utilities – Oil and Gas
RELEASE ID: 20170525CC0108

Press Release from Marketwired 1-866-736-3779

All press releases are written by the client and have NO affiliation with the news copy written by The Canadian Press. Any questions that arise due to the content or information provided in the press release should be directed to the company/organization
issuing the release, not to The Canadian Press.

GET ENERGYNOW’S DAILY EMAIL FOR FREE


OPEC and other nations extend output cuts

VIENNA — An alliance of many of the world’s biggest oil-producing nations extended their agreement to cut output for an additional nine months, an effort to support prices that seems futile in the face of growing production from the U.S.

Thursday’s decision by the 14-member OPEC cartel and 10 other countries led by Russia, means that the reductions of 1.8 million barrels a day agreed on in November will stay in place until March.

Saudi Oil Minister Khalid A. Al-Falih, who presided over the meeting, said he expected that the extension should reduce high crude inventories to a level corresponding to “the five-year average by the end of the year.”

Less oil on the market normally means higher value per barrel. But any uptick in prices may be modest and temporary.

The OPEC-non-OPEC alliance faces competition from U.S. shale producers. Many have returned to the market since crude prices have risen from last year’s lows to over $50 a barrel, and more are set to resume operations if crude prices go even higher.

That could increase supplies and push down prices again.

Investors seem to focus on that reality on Thursday, when they pushed the price of crude to levels seen before OPEC’s meeting in November. The U.S. benchmark for crude was down $1.87 a barrel at $49.49.

The upshot is that the price of oil — and derived products like fuel —is unlikely to increase much in coming months. That will be welcome news to consumers and energy-hungry businesses worldwide but could continue to strain the budgets of some of the more economically-troubled oil-producing nations, like Venezuela and Brazil.

The decision extends a cut of 1.2 million barrels a day by the Organization of the Petroleum Exporting Countries. Non-OPEC countries led by Russia chipped in with a further 600,000-barrel reduction.

George Jahn And Kiyoko Metzler, The Associated Press


GET ENERGYNOW’S DAILY EMAIL FOR FREE


The Latest: OPEC, other nations extend output cut to March

VIENNA — The Latest on OPEC’s talks on extending its production cut agreement (all times local):

6:10 p.m.

OPEC and other oil-producing nations have extended their output cuts for an additional nine months in an effort to shore up prices.

The decision, made Thursday at a high-level meeting of OPEC and non-OPEC ministers, means that the reductions of 1.8 million barrels a day agreed on in November will stay in place until March.

But any uptick in prices may be modest and temporary.

The alliance between OPEC and non-OPEC countries faces competition from U.S. shale producers. Many have returned to the market since crude prices have risen from last year’s lows to over $50 a barrel, and more are set to resume operations if crude prices go even higher.

That could increase supplies and push down prices.

The Associated Press


GET ENERGYNOW’S DAILY EMAIL FOR FREE


Junex Sells its Minority Oil Interest in Texas

FOR: JUNEX INC.
TSX VENTURE SYMBOL: JNX

Date issue: May 25, 2017
Time in: 4:15 PM e

Attention:

QUEBEC CITY, QUEBEC–(Marketwired – May 25, 2017) – Junex inc. (The “Company”
or “Junex”) (TSX VENTURE:JNX) announces that it has sold its 25% interest in a
block of licenses located in Schleicher County, Western Texas for a cash amount
of CAD$1,009,125.

“After having been involved in this project for several years, we concluded
that it was time to divest ourselves of this investment in which we were a
minority partner. The proceeds will contribute to the development of our Galt
oil and natural gas production project, where we plan to drill at least one new
horizontal well in 2017,” said Junex’s President and Chief Executive Officer,
Mr. Jean-Yves Lavoie.

Junex has already received a drilling permit from the Quebec Department of
Energy and Natural Resources for the Galt No 6 Hrz well and plans to start
drilling later this summer.

About Junex

Junex is a junior oil and gas exploration company that holds exploration
permits on more than 2.1 million acres of land in the Appalachian basin in the
Province of Quebec, including the Galt Oil Property on the Gaspe Peninsula in
eastern Quebec, landholdings on Anticosti Island in the Gulf of St. Lawrence
and landholdings in the St. Lawrence Lowlands between Montreal and Quebec City.
In parallel to its exploration efforts in Quebec, the company operates a
drilling services division.

Forward-Looking Statements and Disclaimer

Certain statements in this press release may be forward-looking.
Forward-looking statements are based on the best estimates available to Junex
at the time and involve known and unknown risks, uncertainties and other
factors that may cause Junex’s actual results, performance or achievements to
be materially different from any future results, performance or achievements
expressed or implied by such forward-looking statements. A description of the
risks affecting Junex’s business and activities appears under the heading
“Risks and Uncertainties” on pages 18 to 22 of Junex’s 2016 annual management’s
discussion and analysis, which is available on SEDAR at www.sedar.com. No
assurance can be given that any events anticipated by the forward-looking
information in this press release will transpire or occur, or if any of them do
so, what benefits that Junex will derive therefrom. In particular, no assurance
can be given as to the future financial performance of Junex. Junex disclaims
any intention or obligation to update or revise any forward-looking statements
in order to account for any new information or any other event. The reader is
warned against undue reliance on these forward-looking statements.

Neither the TSX Venture Exchange nor its Regulation Services Provider (as that
term is defined in the policies of the TSX Venture Exchange) accepts
responsibility for the adequacy or accuracy of this release.

– END RELEASE – 25/05/2017

For further information:
Junex Inc.
Mr. Jean-Yves Lavoie
President & Chief Executive Officer
418-654-9661
OR
Junex Inc.
Mr. Dave Pepin
Vice President – Corporate Affairs
418-654-9661

COMPANY:
FOR: JUNEX INC.
TSX VENTURE SYMBOL: JNX

INDUSTRY: Energy and Utilities – Oil and Gas
RELEASE ID: 20170525CC0091

Press Release from Marketwired 1-866-736-3779

All press releases are written by the client and have NO affiliation with the news copy written by The Canadian Press. Any questions that arise due to the content or information provided in the press release should be directed to the company/organization
issuing the release, not to The Canadian Press.

GET ENERGYNOW’S DAILY EMAIL FOR FREE


Acquisition of Point Loma Resources Ltd. Common Shares by Kevin R. Baker Q.C.

FOR: KEVIN R. BAKER Q.C.
Date issue: May 25, 2017Time in: 2:15 PM eAttention:
CALGARY, ALBERTA–(Marketwired – May 25, 2017) –
NOT FOR DISSEMINATION IN THE UNITED STATES. ANY FAILURE TO COMPLY WITH THIS
RESTRICTION MAY CONSTITUTE A VIOLATION OF U.S. S…

GET ENERGYNOW’S DAILY EMAIL FOR FREE


Jura Announces Results of Shareholder Meeting

FOR: JURA ENERGY CORPORATIONTSX VENTURE SYMBOL: JECDate issue: May 25, 2017Time in: 1:47 PM eAttention:
CALGARY, ALBERTA–(Marketwired – May 25, 2017) – Jura Energy Corporation
(“Jura”) (TSX VENTURE:JEC) today announced that at the annual and special

GET ENERGYNOW’S DAILY EMAIL FOR FREE


Pipeline Politics: Approving a Pipeline is NOT ENOUGH, Trudeau Must Use his Legal Authority to Get Shovels into the Ground – David Yager – Yager Management

          David Yager – Yager Management Ltd. Oilfield Service Management Consulting – Oil & Gas Writer – Energy Policy Analyst May 25, 2017 One doesn’t want to sound impatient or alarmist but things don’t appear to be working. Despite carbon taxes, emission caps, coal power generation phase-outs and government-funded low volume … Read more

GET ENERGYNOW’S DAILY EMAIL FOR FREE


Pyongyang gas price surge: Bad news for Kim Jong Un?

TOKYO — While world attention has focused on Kim Jong Un’s recent missile tests, a month-long surge in gasoline prices in Pyongyang is showing no signs of letting up — a puzzling problem that if allowed to drag on could be very bad news for the North Korean economy.

Prices have shot up to about $2.30 per kilogram, or about $6.44 a gallon, since the surge began in mid-April, when prices were in the $1.25-30 range. That means North Korea now has some of the highest prices in the world for gasoline. For comparison, the price in April last year was only about 80 cents per kilogram.

The cause and extent of the surge remains a mystery.

Officially, there has been no comment. There’s no obvious sign of less traffic on the streets, at least in Pyongyang, which is more affluent and developed than other North Korean cities. Taxis appear to be operating normally and have not raised their fares.

The North’s by now pervasive market economy, which is tolerated by the ruling regime in exchange for its own cut of the profits, has made fuel and the ability to transport goods and people so essential that demand for gasoline is not so sensitive to price.

But many gas stations around the capital, if they are selling fuel at all, have been limiting who they sell it to and how much each customer can buy. The long queues and mad dashes to fill gas tanks and large plastic storage cans that marked the beginning days of the surge appear to have subsided, though stations’ operations remain irregular and unpredictable.

North Korean gas stations generally belong to chains associated with large government enterprises or sometimes the military. Gas is also sold through more informal channels, including street-side stalls and the black-market. It is sold by weight in North Korea — thus the “per kilogram” rates.

Without official confirmation or data, it’s hard to conclusively say what is going on. Prices also tend to fluctuate from station to station.

Several possible scenarios could be in play.

It was rumoured last month that China had or was about to limit exports. That possibility, hinted at in a tabloid newspaper associated with China’s ruling party, could have set off the surge either because of an actual drop in supply or speculative buying in anticipation of a shortfall.

The incentive to hoard remains because of rumours Beijing will implement sanctions if Pyongyang conducts a nuclear test. It is unclear how informed North Koreans are about the possibility of another test soon, but satellite imagery widely reported abroad suggests one could come at any time.

The North Korean government itself might have pulled some of supply out of the market.

Pyongyang has been known to divert fuel to higher-priority uses — such as major construction projects or high-profile political events. Gas prices can also rise in tandem with the farming cycle, when more fuel is needed for tractors and pumps. All three could apply right now. North Korea completed construction of a major high-rise residential area in the capital and held a lavish celebration and military parade last month. This is also spring planting season.

The most ominous possibility is that the regime is preparing for some sort of emergency.

But there does not seem to be any strong evidence of that or of Chinese action to cut off supplies.

William Brown, an adjunct professor at Georgetown University and non-resident fellow at the Korea Economic Institute of America, said rumour-inspired hoarding is the likely culprit. The more central role played by capitalist-style markets in the North Korean economy, he believes, has amplified the impact of speculative buying and selling and the price-gouging in uncertain times that goes along with it.

It’s unclear if prices are also rising for diesel and kerosene, used to heat and keep the lights on in city apartments and machinery working in the fields.

An acute sensitivity to even the hint of Chinese sanctions — if that is behind the surge — would be telling.

The Soviet Union supplied crude oil to North Korea in the 1950s through the 1980s. China joined in early 1970s and now provides virtually all of the North’s supply. Brown said that includes a 50,000-ton delivery monthly via an 18-kilometre (11-mile) cross-border pipeline that is worth about $20 million at current Chinese export prices.

Beijing doesn’t require the North to pay and hasn’t included those shipments in official trade figures since 2014.

If Pyongyang had to start paying for that 50,000-ton freebie, the profit from sales of what it refines domestically would drop and it would have less money to spend on other things. The resulting scarcity of dollars would hurt the value of North Korea’s own currency, leading to inflation.

In any case, Brown said, the volatility of gasoline prices underscores the North’s dependence on markets that have expanded dramatically since Kim Jong Un took power more than five years ago. The rise of markets has led to better productivity and use of scarce goods, like gasoline, helping economic growth.

But, he added, it is at the same time “the bane of a socialist government.”

“Real money in private pockets, after all, is power,” he said.

___

Talmadge has been the AP’s Pyongyang bureau chief since 2013. Follow him on Twitter at twitter.com/EricTalmadge and Instagram at erictalmadge.

Eric Talmadge, The Associated Press


GET ENERGYNOW’S DAILY EMAIL FOR FREE


Cordy Oilfield Services Inc. Reports First Quarter 2017 Results

FOR: CORDY OILFIELD SERVICES INC.TSX VENTURE SYMBOL: CKKDate issue: May 25, 2017Time in: 12:20 PM eAttention:
CALGARY, ALBERTA–(Marketwired – May 25, 2017) – CORDY OILFIELD SERVICES INC.
(the “Corporation” or “Cordy”) (TSX VENTURE:CKK) released today…

GET ENERGYNOW’S DAILY EMAIL FOR FREE


Squatex to use Fire Creek engineering services

FOR: RESOURCES & ENERGY SQUATEX INC.
CSE SYMBOL: SQX
CSE SYMBOL: SQX.CN
CNSX SYMBOL: SQX

Date issue: May 25, 2017
Time in: 10:40 AM e

Attention:

BROSSARD, QUEBEC–(Marketwired – May 25, 2017) – The management of Resources &
Energy Squatex Inc. (CSE:SQX)(CSE:SQX.CN)(CNSX:SQX) (Squatex) is pleased to
announce that it has entered into an engineering services agreement with
Calgary based Fire Creek Ressources Ltd (Fire Creek).

For several years, Squatex has specialized in the technique of small diameter
drilling (slim hole) for its exploration. This technique represents a major
breakthrough in Quebec in terms of environmental impact because it uses less
water, less energy, and requires a much smaller area of land (90% less) than
traditional oil drilling techniques. Squatex wanted to add to its team
professionals with the same values of respect for the environment. Fire Creek
has more than 23 years of experience in more than 22 countries on 6 continents
and is recognized as a world leader in the engineering of all types of drilling
and related operations leading to the production of reservoir zones. Fire Creek
has specialists in various fields of oil and gas development and significant
amount of wells drilled safely and successfully, including in Quebec. Fire
Creek will be a major asset for the development of conventional reservoirs in
the Masse structure in the Lower St. Lawrence (see press release dated May 17th
2016).

Mr. Jean-Claude Caron, Executive Chairman and Chief Executive Officer of
Squatex comments: “Squatex is a 100% owned Quebec company with deep
environmental and social values. I maintain that the development of
hydrocarbons in Quebec can be done with respect for the environment and
communities. I believe Squatex, by developing innovative techniques, backed by
world-renowned professionals in its future exploration and production projects,
will become a benchmark in the field. In so doing, Quebec will have the chance
to become a leader in the clean and socially acceptable development of
hydrocarbons.”

The President of Squatex takes the opportunity to comment on a recent poll
commissioned by the Montreal Economic Institute (MEI) at Leger, which ran from
April 17 to 19, 2017 in all regions of Quebec: “The results show that 56% of
Quebeckers think we should develop our own hydrocarbon resources. It should be
noted that we consume 300,000 barrels per day of imported oil day in Quebec and
that the purchase of these barrels causes our economy to lose more than $ 20
million per day.” Mr. Caron adds: “Now that we have a law to regulate the
development of hydrocarbons, it would be time to take example from Norway and
develop our resources to use the income generated by the oil and gas sector to
achieve the energy transition in Quebec more quickly. We are fortunate to be
rich in natural resources, so accept to be a wealthy society and give ourselves
the means to become an example of good resource management while protecting the
environment.”

About Resources & Energy Squatex Inc.

Squatex is a junior oil and gas exploration company established in 2001 whose
principal activity is to carry out work and studies for the assessment and
development of its oil and gas potential of 656,093 Hectares under exploration
permits in Quebec. Squatex holds 224,933 ha (70% Net) of exploration permits in
the St. Lawrence Lowlands region and 431,160 ha (70% Net) of licenses in the
Lower St. Lawrence region.

Forward-Looking Statements

This press release contains statements that may constitute “forward-looking
information” within the meaning of applicable Canadian securities laws.
Forward-looking information may include, but is not limited to, statements
regarding future plans, costs, objectives or performance of Squatex, or the
assumptions underlying any of these elements. Forward-looking information
should not be interpreted as a guarantee of future performance or results and
is not necessarily a guide to the achievement of such performance or results or
the timing of such achievement performance or results. There can be no
assurance that events anticipated in the forward-looking information will occur
or will be produced, including the development of Squatex’s properties, or if
they are realized, the benefits that Squatex will derive from it. The
forward-looking information is based on information available at the time it is
made and / or in good faith with respect to future events and is subject to
known or unknown risks, uncertainties, assumptions and other unpredictable
factors, many of which are beyond the control of Squatex. Actual events or
results could differ materially from those anticipated in the forward-looking
statements. Squatex does not intend to update or revise any forward-looking
information contained in this press release to reflect future information,
events or circumstances or otherwise and does not undertake to update or revise
any forward-looking information contained in this press release, unless
required to do so by applicable law.

– END RELEASE – 25/05/2017

For further information:
Resources & Energy Squatex Inc.
Mr. Jean-Claude Caron, President
450-766-0861
[email protected]
OR
Resources & Energy Squatex Inc.
Mr. Mario Levesque, Director of Development
418-391-1155
[email protected]

COMPANY:
FOR: RESOURCES & ENERGY SQUATEX INC.
CSE SYMBOL: SQX
CSE SYMBOL: SQX.CN
CNSX SYMBOL: SQX

INDUSTRY: Energy and Utilities – Oil and Gas
RELEASE ID: 20170525CC0055

Press Release from Marketwired 1-866-736-3779

All press releases are written by the client and have NO affiliation with the news copy written by The Canadian Press. Any questions that arise due to the content or information provided in the press release should be directed to the company/organization
issuing the release, not to The Canadian Press.

GET ENERGYNOW’S DAILY EMAIL FOR FREE


PetroShale Announces Financial and Operating Results for First Quarter 2017

FOR: PETROSHALE INC.
TSX VENTURE SYMBOL: PSH
OTCQX SYMBOL: PSHIF

Date issue: May 25, 2017
Time in: 9:00 AM e

Attention:

CALGARY, ALBERTA–(Marketwired – May 25, 2017) – PetroShale Inc. (“PetroShale”
or the “Company”) (TSX VENTURE:PSH)(OTCQX:PSHIF) is pleased to announce its
financial and operating results for the three month period ended March 31,
2017. The Company’s unaudited consolidated financial statements and
corresponding Management’s Discussion and Analysis (MD&A) for the period are
available on SEDAR at www.sedar.com, on the OTCQX website at www.otcqx.com, and
on PetroShale’s website at www.petroshaleinc.com. Copies of the materials can
also be obtained upon request without charge by contacting the Company
directly. Please note, currency figures presented herein are reflected in
Canadian dollars, unless otherwise noted.

HIGHLIGHTS:

PetroShale continued to focus on developing its core land base in the North
Dakota Bakken / Three Forks play. The Company achieved a significant increase
in production as a result of its first operated well and participation in three
recently completed non-operated wells. The Company’s recent $110 million equity
financing is expected to allow PetroShale to continue to be aggressive in
acquiring more undeveloped land and drilling locations in its core area, and
increase production through additional drilling activity.

Since December 31, 2016, the Company:

/T/

— Achieved a significant increase in production to 3,213 boe/d, a 134%

increase over the first quarter of 2016 and 73% higher than the fourth
quarter of 2016.
— Generated operating netbacks of $30.45 per boe, an increase of 128% from
$13.35 per boe in the same quarter of 2016, due to a combination of
increased realized oil prices and decreased operating costs.
— Realized EBITDA of $8.0 million in the first quarter of 2017, compared
to $0.9 million in the corresponding quarter of 2016.
— Closed an equity offering that was fully subscribed (including the full
exercise of the over-allotment option) and generated gross proceeds of
$110 million.
— Increased the borrowing capacity under the Company’s senior credit
facility to US$30.9 million, from US$23.7 million, and extended the
renewal date to February 28, 2018.

/T/

RESULTS OF OIL AND GAS ACTIVITIES

/T/

Three months ended
—————————————————————————-
March 31, March 31,
2017 2016
—————————————————————————-
Sales volumes
—————————————————————————-
Crude Oil (Bbl/d) 2,655 1,194
Natural gas and NGLs (Mcf/d) 3,349 1,091
—————————————————————————-
Barrel of oil equivalent (Boe/d) (1) 3,213 1,376

Operating Netbacks ($/Boe)(1)
—————————————————————————-

Revenue $ 52,48 $ 31.98
Royalties (10.92) (6.57)
Operating costs (7.20) (9.58)
Production taxes (3.91) (2.48)
—————————————————————————-
Operating netback $ 30.45 $ 13.35
Operating netback, on a net of royalty basis $ 38.48 $ 16.84
—————————————————————————-
Note:
(1) See “Oil and Gas Advisory”.

/T/

MESSAGE FROM THE CEO

The beginning of 2017 has been one of the most significant periods in
PetroShale’s history with respect to execution of the Company’s strategy. We
realized a significant production increase following the successful drilling of
our first operated well (73% working interest) in the Antelope area, and our
$110 million equity financing in April has substantially enhanced our
liquidity.

As a result of the significant increase in production, we generated $7.6
million in funds flow from operations and $8.0 million of EBITDA in the first
quarter, which are substantial increases over $1.0 million and $0.9 million,
respectively in the same period of 2016.

Following completion of the equity financing, we have approximately US$78
million of undrawn capacity under our credit facilities, affording PetroShale
significant financial flexibility. We are seeking opportunities to enhance our
high-quality asset base within our core area and look forward to converting
more of our undeveloped acreage to production with additional drilling
locations in 2017 and 2018.

Our first quarter 2017 operating netback of $30.45 was positively impacted by
the strengthening of the WTI benchmark price and a reduction in both operating
expenses and Bakken price differentials. This netback demonstrates the quality
of our acreage and drilling locations. In addition, our per boe G&A expenses
were reduced by nearly half from Q1 2016 as a result of increased production
and stable overhead costs. We are seeing WTI prices continue to fluctuate but
we believe that our strong netbacks will continue to support economic
development of our assets.

With the strengthening of our financial position, we intend to pursue operated
positions in other drilling units in our core focus area. We continue to be
encouraged by the proven ability of our assets to generate positive impacts on
production, reserves and revenue growth.

We would like to thank PetroShale’s employees, directors and shareholders for
your continued support of our strategy and our Company, and we look forward to
updating you on our progress and achievements.

((signed))

M. Bruce Chernoff, Executive Chairman and CEO

About PetroShale

PetroShale is an oil company engaged in the acquisition, development and
consolidation of interests in the North Dakota Bakken / Three Forks.

Neither the TSX Venture Exchange nor its Regulation Services Provider (as that
term is defined in the policies of the TSX Venture Exchange) accepts
responsibility for the adequacy or accuracy of this release.

Note Regarding Forward-Looking Statements and Other Advisories

This press release contains forward-looking statements and forward-looking
information (collectively “forward-looking information”) within the meaning of
applicable securities laws relating to, among other things, available aspects
of management focus, objectives, strategies and business opportunities. More
particularly and without limitation, this press release contains
forward-looking information concerning: the Company’s expectation that its
recent equity financing will allow PetroShale to continue to be aggressive in
acquiring more undeveloped land and drilling locations in its core area, and
increase production through additional drilling activity; the Company’s
intention to convert more undeveloped acreage to production with additional
drilling locations in 2017 and 2018; the pursuit of operated positions in other
drilling units in the Company’s core focus area; PetroShale’s intention to seek
out land acquisition opportunities and to increase production through drilling
activities; the Company’s growth and development plans; and the general outlook
of the Company. PetroShale provided such forward-looking statements in reliance
on certain expectations and assumptions that it believes are reasonable at the
time, including expectations and assumptions concerning prevailing commodity
prices, liquidity, exchange rates, interest rates, applicable royalty rates and
tax laws; future production rates and estimates of operating costs; performance
of existing and future wells; reserve volumes; business prospects and
opportunities; the availability and cost of financing, labor and services; the
impact of increasing competition; ability to market oil and natural gas
successfully; and the Company’s ability to access capital.

Although the Company believes that the expectations and assumptions on which
such forward-looking information is based are reasonable, undue reliance should
not be placed on the forward-looking information because the Company can give
no assurance that they will prove to be correct. Forward-looking information
addresses future events and conditions, which by their very nature involve
inherent risks and uncertainties. The Company’s actual results, performance or
achievement could differ materially from those expressed in, or implied by, the
forward-looking information and, accordingly, no assurance can be given that
any of the events anticipated by the forward-looking information will transpire
or occur, or if any of them do so, what benefits the Company will derive
therefrom. Management has included the above summary of assumptions and risks
related to forward-looking information provided in this press release in order
to provide security holders with a more complete perspective on the Company’s
future operations and such information may not be appropriate for other
purposes.

Readers are cautioned that the foregoing lists of factors are not exhaustive.
Additional information on these and other factors that could affect our
operations or financial results are included in reports on file with applicable
securities regulatory authorities and may be accessed through the SEDAR website
(www.sedar.com). These forward-looking statements are made as of the date of
this press release and the Company disclaims any intent or obligation to update
publicly any forward-looking information, whether as a result of new
information, future events or results or otherwise, other than as required by
applicable securities laws.

Non-GAAP Measures:

Within this press release, references are made to “operating netback”, “EBITDA”
and “funds flow from operations”, which are not recognized measures under IFRS
and therefore may not be comparable to performance measures presented by
others. EBITDA means net income (loss) before taxes, depletion and depreciation
expense, exploration and evaluation expense, any impairments, finance expense,
any gain or loss on property dispositions, foreign exchange gain or loss,
share-based compensation expense and unrealized gain or loss on financial
derivatives. Operating netback means revenue less royalties, production taxes
and operating costs and has been presented on a per Boe basis. Management
believes that in addition to net income (loss) and cash flow from (used in)
operating activities, EBITDA and operating netback are useful supplemental
measures as they assist a reader in the determination of the Company’s
operating performance, leverage and liquidity. Funds flow from operations is
calculated based on cash flow from operating activities before changes in
non-cash working capital and decommissioning expenditures. Management utilizes
funds flow from operations as a key measure to assess the ability of the
Company to finance operating activities, capital expenditures and debt
repayments. Readers are cautioned, however, that these measures should not be
construed as an alternative to net income (loss) or cash flow from (used in)
operating activities and consolidated assets as determined in accordance with
IFRS as an indication of our performance or value.

Oil and Gas Advisory:

Where amounts are expressed on a barrel of oil equivalent (“Boe”) basis,
natural gas volumes have been converted to Boe using a ratio of 6,000 cubic
feet of natural gas to one barrel of oil (6 Mcf: 1 Bbl). This Boe conversion
ratio is based on an energy equivalency conversion method primarily applicable
at the burner tip and does not represent a value equivalency at the wellhead.
Given the value ratio based on the current price of crude oil as compared to
natural gas is significantly different from the energy equivalency of 6 Mcf: 1
Bbl, utilizing a conversion ratio at 6 Mcf: 1 Bbl may be misleading as an
indication of value. In this release, mboe refers to thousands of barrels of
oil equivalent, while mbbls refers to thousands of barrels of oil, and mmcf
refers to millions of cubic feet of natural gas.

All dollar figures included herein are presented in Canadian dollars, unless
otherwise noted.

– END RELEASE – 25/05/2017

For further information:
PetroShale Inc.
Attention: Executive Chairman and CEO
+1.303.297.1407
[email protected]
www.petroshaleinc.com
OR
Cindy Gray
5 Quarters Investor Relations, Inc.
403.828.0146
[email protected]

COMPANY:
FOR: PETROSHALE INC.
TSX VENTURE SYMBOL: PSH
OTCQX SYMBOL: PSHIF

INDUSTRY: Energy and Utilities – Oil and Gas
RELEASE ID: 20170525CC0043

Press Release from Marketwired 1-866-736-3779

All press releases are written by the client and have NO affiliation with the news copy written by The Canadian Press. Any questions that arise due to the content or information provided in the press release should be directed to the company/organization
issuing the release, not to The Canadian Press.

GET ENERGYNOW’S DAILY EMAIL FOR FREE


VIQ Announces Change of Reporting Currency to USD, Appoints New Interim CFO

FOR: VIQ SOLUTIONS INC.TSX VENTURE SYMBOL: VQSDate issue: May 25, 2017Time in: 9:00 AM eAttention:
MARKHAM, ONTARIO–(Marketwired – May 25, 2017) – VIQ Solutions Inc. (“VIQ” or
the “Company”) (TSX VENTURE:VQS), a global expert in secure digital media

GET ENERGYNOW’S DAILY EMAIL FOR FREE


WireIE’s expertise in digital oil and gas telecommunications a valuable asset for Argentinian projects

FOR: WIREIE

Date issue: May 25, 2017
Time in: 9:00 AM e

Attention:

TORONTO, ON–(Marketwired – May 25, 2017) – WireIE, a wholesale network
operator specialized in the deployment of MEF-Certified Carrier Ethernet
networks to Canada’s underserved markets, continues to expand its digital oil
and gas telecommunications network management expertise in South America.

WireIE is operating in the Argentinian Bajada de Anelo gas shale field within
the larger Vaca Muerta area. Using skilled local field technicians, WireIE is
providing its partners with the overall expertise to configure and deploy the
digital infrastructure necessary for project success.

“WireIE has been incredibly successful in providing integrated, reliable and
secure networks for oil and gas fields in Canada’s underserved regions,” says
Rob Barlow, President and Chief Executive Officer of WireIE. “We continue to
prove that our model can be applied to challenging regions anywhere because our
core set of capabilities has a high degree of flexibility and adaptability.”

“We specialize in finding solutions for challenging telecommunications
situations like the Bajada de Anelo shale fields,” says Jon D’Alessandro,
WireIE’s Executive Vice President of Network and Operations. “Through our Day 2
support service, we provide our partners in Argentina and elsewhere in South
America with continuous and integrated connectivity from their corporate
headquarters to their exploratory and production oil fields.”

WireIE’s Day 2 service targets oil and gas producers who operate in
increasingly remote and challenging locations, where it is difficult to staff
project sites with skilled workers. Keeping the communications network up and
running in the field can save companies thousands of dollars a day. As the
responsible authority for its clients on the digital aspects of project,
problem and incident management, WireIE lowers the risk of unplanned downtime
and allows for greater efficiency in production.

“We are pleased to see Canadian companies like WireIE pursue an active presence
in Argentina’s energy sector,” says Eleonore Rupprecht, Trade Commissioner with
Global Affairs Canada. “Argentina is one of Canada’s largest trading partners
in South America and Canadian businesses recognize the potential for increased
trade with Argentina.”

Having calculated a need for a total long-term investment of US $200 billion to
reverse its sustained energy crisis, the Argentinian government is encouraging
foreign investment in its Vaca Muerta shale fields.

About WireIE:

WireIE is a Canadian telecommunications carrier, specialized in the deployment
of MEF Certified Carrier Ethernet 2.0 networks to underserved markets. WireIE’s
proven network performance, backed by industry-leading SLAs, has been
established as the provider of choice for mission critical network
requirements, across all industry verticals. Believing in a strong partnership
model allows WireIE to focus on building missing components of broadband
network solutions while keeping the costs down and dramatically reducing
delivery times.

[email protected] WireIE.com Twitter.com/WireIE LinkedIn.com/WireIE

– END RELEASE – 25/05/2017

For further information:
For media inquiries, please contact:
Jaymie Scotto & Associates (JSA)
+1.866.695.3629
[email protected]

COMPANY:
FOR: WIREIE

INDUSTRY: Computers and Software – Hardware, Computers and Software
– Internet, Computers and Software – Networking, Computers and
Software – Peripherals, Computers and Software – Software, Telecom
– Cable and Satellite Services, Telecom – Networking, Telecom –
Telecommunication Equipment, Telecom – Telecommunication Services,
Telecom – Wireless/Mobile, Computers and Software – Security,
Computers and Software – Big Data
RELEASE ID: 20170525CC0047

Press Release from Marketwired 1-866-736-3779

All press releases are written by the client and have NO affiliation with the news copy written by The Canadian Press. Any questions that arise due to the content or information provided in the press release should be directed to the company/organization
issuing the release, not to The Canadian Press.

GET ENERGYNOW’S DAILY EMAIL FOR FREE


Eagle Energy Inc. Files Management Information Circular for Annual General Meeting

FOR: EAGLE ENERGY INC.TSX SYMBOL: EGLDate issue: May 25, 2017Time in: 8:00 AM eAttention:
Board of Directors Unanimously Recommends that Eagle Shareholders vote the
YELLOW form of proxy FOR Eagle’s Director Nominees
CALGARY, ALBERTA–(Marketwired – Ma…

GET ENERGYNOW’S DAILY EMAIL FOR FREE


Razor Energy Corp. Announces Closing of Previously Announced Strategic Light Oil Asset Acquisition and Updated 2017 Corporate Budget and Guidance

FOR: RAZOR ENERGY CORP.
TSX VENTURE SYMBOL: RZE

Date issue: May 25, 2017
Time in: 8:00 AM e

Attention:

CALGARY, ALBERTA–(Marketwired – May 25, 2017) – Razor Energy Corp. (“Razor” or
the “Company”) (TSX VENTURE:RZE) (www.razor-energy.com) is pleased to announce
the closing of the previously announced strategic acquisition of light oil
assets located in west central Alberta (the “Assets”) for cash consideration of
$9.6 million, subject to customary adjustments (the “Acquisition”). The Assets,
situated within Razor’s core area, are characterized by low decline, light oil
focused production, which is primarily operated with abundant infrastructure to
complement Razor’s existing asset portfolio.

THE ACQUISITION

The purchase price for the Acquisition was $9.6 million, prior to closing
adjustments (the “Purchase Price”). The Purchase Price was funded through a
prospectus financing (the “Offering”) through a syndicate of agents co-led by
Haywood Securities Inc. and Jett Capital Advisors, LLC, together with Canaccord
Genuity Corp., Eight Capital, National Bank Financial Inc., Acumen Capital
Finance Partners Limited and Macquarie Capital Markets Canada Ltd.
(collectively, the “Agents”) of 5,750,000 subscription receipts of the Company
(“Subscription Receipts”) at a price of $3.00 per Subscription Receipt for
aggregate gross proceeds of $17.25 million, including the full exercise of the
Agents’ over-allotment option, which closed on May 15, 2017.

In accordance with their terms, each Subscription Receipt was exchanged for one
common share of the Company (“Common Share”) and one-half of one Common Share
purchase warrant (“Warrant”) upon closing of the Acquisition and the aggregate
gross proceeds of the Offering were released from escrow. Holders of
Subscription Receipts are not required to take any action in order to receive
the Common Shares and Warrants to which they are entitled.

The Acquisition is complementary on a geographic, geological and operational
basis and in terms of product mix with Razor’s current assets and operations in
the Swan Hills areas. On a pro forma basis, using February 2017 field estimated
production, the Company anticipates production at or above 3,700 boe/d, of
which 85% is light oil and natural gas liquids.

The Acquisition enhances Razor’s existing asset base with similar reactivation
and re-entry opportunities, in addition to future drilling upside with proven
deliverability of light oil from the Montney formation. The primary fields
within the Assets include Kaybob South Triassic Units No. 1 and 2, Kaybob
Beaverhill Lake Unit No. 1 and Simonette/Karr Beaverhill Lake Oil Pools.

With 95,679 (33,542 net) acres of land, the majority held by production, Razor
foresees ample drilling opportunities comprised of both vertical and horizontal
wells. Management has currently identified over 15 net drilling locations
including the potential for future horizontal targets. The development of these
properties is expected to be part of the 2018 capital program.

ASSET SUMMARY(1)

/T/

Total purchase price $ 9.6 million
Current production (Feb 2017 field) 759 boe/d
Annual decline rate 15%
95,679 (33,542 net)
Land acres
Net locations 15 unbooked
Forecast 2017 operating netback(2) $ 10.82/boe
Reserves (Gross)
Proved developed producing (“PDP”) reserves(3) 1.5 MMboe
Total Proved (“TP”) reserves(1)(3) 2.8 MMboe
Total proved plus probable (“P+P”) reserves(3) 3.7 MMboe
P+P RLI(4) 13 years
Reserves Value Before Tax (PV10)(3):
PDP reserve value $ 22.5 million
TP reserve value $ 36.2 million
P+P reserve value $ 44.7 million
Run rate cash flow(5) $ 3.3 million

/T/

ACQUISITION METRICS(1)

/T/

Current production (Feb 2017 field) $ 12,652 per boe/d
Proved developed producing reserves(3) $ 6.46 per boe
Total proved reserves(3) $ 3.48 per boe
Total proved plus probable reserves(3) $ 2.62 per boe
Purchase price / PDP reserve value 43%
Purchase price / TP reserve value 27%
Purchase price / P+P reserve value 21%
Run rate cash flow(5) 3.20x

1. Subject to normal adjustments for a transaction of this nature and

adjustments related to the exercise of certain ROFRs.
2. Operating netback does not have any standard meaning prescribed by
International Financial Reporting Standards (“IFRS”) and therefore may
not be comparable with the calculation of similar measures for other
entities. Operating netback equals total petroleum and natural gas sales
less royalties and operating costs calculated on a boe basis. Razor
considers operating netback as an important measure to evaluate its
operational performance as it demonstrates its field level profitability
relative to current commodity prices. The estimated operating netback
was derived using the Company’s 2017 commodity price forecast of
US$52.50/Bbl WTI, $2.50/MCF AECO, and a US/Canadian dollar exchange rate
of $0.75 with the average operating netback calculated from the closing
date of the Acquisition to December 31, 2017. See “Reader Advisories –
Non-IFRS Measures”.Gross Company Reserves. Reserves based on the Kaybob
Assets Reserves Report effective December 31, 2016 prepared in
accordance with the requirements of the COGE Handbook as required by NI
51-101.
3. Gross Company Reserves means Razor’s working interest reserves following
completion of the Acquisition before the calculation of royalties, and
before the consideration of the Company’s royalty interests.
4. The reserve life index (“RLI”) is calculated by dividing total proved
plus probable reserves estimated at 3,683 MBoe with estimated current
production of the Kaybob Assets of 759 boe/d.
5. Run rate cash flow does not have any standard meaning prescribed by IFRS
and therefore may not be comparable with the calculation of similar
measures for other entities. Run rate cash flow is based on annualized
current production of 759 boe/d multiplied by the operating netback for
the Kaybob Assets of $10.82/boe (see Note 2 above).

/T/

2017 CAPITAL BUDGET AND REVISED GUIDANCE

Given the volatility in commodity prices and Razor’s ability to grow production
through high frequency / low capital intensive projects, Razor expects to take
a disciplined and conservative approach to the 2017 budget. The capital budget
will be reviewed continuously by management and the board of directors of the
Company (the “Board”) for changes in commodity price assumptions and project
economics. Razor remains steadfast in its conviction to maintain its financial
advantage and build a top-tier junior oil and gas company.

For fiscal 2017, the capital expenditure budget of $13.0 million, which was
approved by the Board prior to the Acquisition, remains unchanged. Razor
continues to invest in a combination of reactivations, re-entries, optimization
activities and waterflood management. These initiatives will be split between
Swan Hills and Kaybob areas at management’s discretion. In addition, the budget
addresses the Alberta Energy Regulator’s requirement under the Inactive Well
Compliance Program including end of life well and facility spending.

With innovative focus and disciplined capital deployment in its Swan Hills and
Kaybob areas, the Company is well positioned to execute on its growth strategy
while maintaining financial flexibility.

The Company’s 2017 revised financial and operating guidance and assumptions are
as follows:

/T/

—————————————————————————-
Average daily production 2017
—————————————————————————-

Light oil (bbls/d) 2,581
—————————————————————————-
NGLs (bbls/d) 716
—————————————————————————-
Natural gas (mcf/d) 3,319
—————————————————————————-
Oil equivalent (boe/d) 3,850
—————————————————————————-
Capital expenditures $13.0 million
—————————————————————————-
Term Loan (maturity January 31, 2021) $30.0 million
—————————————————————————-
Working capital, December 31, 2017 $13.5 million
—————————————————————————-
Net debt, December 31, 2017 (“Exit Net Debt”) $16.5 million
—————————————————————————-
Funds flow from operations in 2017 (“2017 FFO”)(1) $9.5 million
—————————————————————————-
Exit Net Debt to 2017 FFO(1) 1.7x
—————————————————————————-
Assumptions:
—————————————————————————-
WTI (US$/bbl) $52.50
—————————————————————————-
Exchange rate (US$/C$) 0.75
—————————————————————————-
Light sweet oil differential to WTI (C$/bbl) ($4.00)
—————————————————————————-
Average corporate oil quality discount (C$/bbl) ($3.00)
—————————————————————————-
AECO gas (C$/mcf) $2.50
—————————————————————————-

1. “Funds flow from operations” and “net debt” do not have any standardized

meaning prescribed by IFRS. See “Reader Advisories – Non-IFRS Measures”.

/T/

Razor plans to continue to pursue value-driven acquisitions with a view towards
consolidation of land and production within the Company’s existing project
areas in addition to complementary shallow, light oil horizons within its
Alberta core region. Razor remains focused on adding to its inventory of high
quality projects to sustain longer-term growth.

ABOUT RAZOR

Razor Energy Corp. is a light oil focused company operating predominantly in
Alberta. Razor’s full-cycle business plan provides an opportunity to reposition
the Company as a disciplined and high-growth junior E&P company. With an
experienced management team and a strong, committed Board, growth is
anticipated to occur through timely strategic acquisitions and operations.
Razor currently trades on TSX Venture Exchange under the ticker “RZE”.

READER ADVISORIES

FORWARD-LOOKING STATEMENTS: This press release contains forward-looking
statements. More particularly, this press release contains statements
concerning, but not limited to: the anticipated annual decline rate; capital
program of the Company, including expected production and cash flow related to
the Acquisition; expected number of future drilling locations related to the
Acquisition; the Company’s reactivation program; matters relating to the 2017
capital budget; the Company’s 2017 guidance; and the Company’s acquisition
strategy. In addition, the use of any of the words “anticipate”, “believe”,
“expect”, “plan”, “intend”, “estimate”, “potential”, “can”, “will”, “should”,
“continue”, “may”, “envision” and similar expressions are intended to identify
forward-looking statements. The forward-looking statements contained herein are
based on certain key expectations and assumptions made by the Company,
including but not limited to expectations and assumptions concerning the
availability of capital, current legislation, receipt of required regulatory
approval, the success of future drilling and development activities, the
performance of existing wells, the performance of new wells, the Company’s
growth strategy, general economic conditions, availability of required
equipment and services and prevailing commodity prices. Although the Company
believes that the expectations and assumptions on which the forward-looking
statements are based are reasonable, undue reliance should not be placed on the
forward-looking statements because the Company can give no assurance that they
will prove to be correct. Since forward-looking statements address future
events and conditions, by their very nature they involve inherent risks and
uncertainties. Actual results could differ materially from those currently
anticipated due to a number of factors and risks. These include, but are not
limited to, risks associated with the oil and gas industry in general (e.g.,
operational risks in development, exploration and production; delays or changes
in plans with respect to exploration or development projects or capital
expenditures; as the uncertainty of reserve estimates; the uncertainty of
estimates and projections relating to production, costs and expenses, and
health, safety and environmental risks), commodity price and exchange rate
fluctuations, changes in legislation affecting the oil and gas industry and
uncertainties resulting from potential delays or changes in plans with respect
to exploration or development projects or capital expenditures. Please refer to
the risk factors identified in the annual information form and management
discussion and analysis of the Company for the period ended December 31, 2016,
on SEDAR at www.sedar.com.

The forward-looking statements contained in this press release are made as of
the date hereof and the Company undertakes no obligation to update publicly or
revise any forward-looking statements or information, whether as a result of
new information, future events or otherwise, unless so required by applicable
securities laws.

NON-IFRS MEASURES: This press release contains the terms “funds flow from
operations”, “net debt”, “operating netback” and “run rate cash flow”, which do
not have standardized meanings prescribed by IFRS and therefore may not be
comparable with the calculation of similar measures by other companies. Funds
flow from operations represents cash flow from operating activities before
changes in non-cash working capital and decommissioning expenditures.
Management uses funds flow from operations to analyze operating performance and
leverage. Net debt is calculated as long-term debt less working capital (or
plus working capital deficiency), with working capital excluding mark-to-market
risk management contracts. Management believes net debt is a useful
supplemental measure of the total amount of current and long-term debt of the
Company. Operating netback equals total petroleum and natural gas sales less
royalties and operating costs calculated on a boe basis. Razor considers
operating netback as an important measure to evaluate its operational
performance as it demonstrates its field level profitability relative to
current commodity prices. The estimated operating netback was derived using the
Company’s 2017 commodity price forecast of US$52.50/Bbl WTI, $2.50/MCF AECO,
and a US/Canadian dollar exchange rate of $0.75 with the average operating
netback calculated from the closing date of the Acquisition to December 31,
2017. Run rate cash flow is based on annualized current production of 759 boe/d
multiplied by the operating netback for the Kaybob Assets of $10.82/boe.

ADVISORY ON PRODUCTION INFORMATION: Unless otherwise indicated herein, all
production information presented herein has presented on a gross basis, which
is the Company’s working interest prior to deduction of royalties and without
including any royalty interests.

DRILLING LOCATIONS. This press release discloses drilling inventory as unbooked
locations. Unbooked locations are internal estimates based on our prospective
acreage and an assumption as to the number of wells that can be drilled per
section based on industry practice and internal review. Unbooked locations do
not have attributed reserves or resources. Unbooked locations have been
identified by management as an estimation of the Company’s multi-year drilling
activities based on evaluation of applicable geologic, seismic, engineering,
production and reserves information. There is no certainty that the Company
will drill all unbooked drilling locations and if drilled, there is no
certainty that such locations will result in additional oil and gas reserves,
resources or production. The drilling locations on which Razor actually drill
wells will ultimately depend upon the availability of capital, regulatory
approvals, seasonal restrictions, oil and natural gas prices, costs, actual
drilling results, additional reservoir information that is obtained and other
factors. While certain of the unbooked drilling locations have been de-risked
by drilling existing wells in relative close proximity to such unbooked
drilling locations, other unbooked drilling locations are farther away from
existing wells where management has less information about the characteristics
of the reservoir and therefore there is more uncertainty whether wells will be
drilled in such locations and if drilled there is more uncertainty that such
wells will result in additional oil and gas reserves, resources or production.

BARRELS OF OIL EQUIVALENT: The term “boe” or barrels of oil equivalent may be
misleading, particularly if used in isolation. A boe conversion ratio of six
thousand cubic feet of natural gas to one barrel of oil equivalent (6 Mcf: 1
bbl) is based on an energy equivalency conversion method primarily applicable
at the burner tip and does not represent a value equivalency at the wellhead.
Additionally, given that the value ratio based on the current price of crude
oil, as compared to natural gas, is significantly different from the energy
equivalency of 6:1; utilizing a conversion ratio of 6:1 may be misleading as an
indication of value.

Neither the TSX Venture Exchange nor its Regulation Services Provider (as that
term is defined in the policies of the TSX Venture Exchange) accepts
responsibility for the adequacy or accuracy of this news release.

– END RELEASE – 25/05/2017

For further information:
Doug Bailey
President and Chief Executive Officer
OR
Kevin Braun
Chief Financial Officer
OR
Razor Energy Corp.
1250, 645 7th Avenue S.W.
Calgary, Alberta T2P 4G8
(403) 262-0242
www.razor-energy.com

COMPANY:
FOR: RAZOR ENERGY CORP.
TSX VENTURE SYMBOL: RZE

INDUSTRY: Energy and Utilities – Oil and Gas
RELEASE ID: 20170525CC0024

Press Release from Marketwired 1-866-736-3779

All press releases are written by the client and have NO affiliation with the news copy written by The Canadian Press. Any questions that arise due to the content or information provided in the press release should be directed to the company/organization
issuing the release, not to The Canadian Press.

GET ENERGYNOW’S DAILY EMAIL FOR FREE


Statoil Sells Common Shares of International Petroleum Corporation

FOR: STATOIL ASAOSLO SYMBOL: STLDate issue: May 25, 2017Time in: 8:00 AM eAttention:
STAVANGER, NORWAY–(Marketwired – May 25, 2017) – Statoil ASA (OSLO:STL)
(“Statoil”) announced today that it sold 22,805,892 Common Shares (“Shares”) of
International…

GET ENERGYNOW’S DAILY EMAIL FOR FREE


Touchstone Announces Proposed Admission to AIM and Conditional Placing of 20,000,000 Common Shares

FOR: TOUCHSTONE EXPLORATION INC.
TSX SYMBOL: TXP

Date issue: May 25, 2017
Time in: 7:00 AM e

Attention:

CALGARY, ALBERTA–(Marketwired – May 25, 2017) – Touchstone Exploration Inc.
(“Touchstone” or the “Company”) (TSX:TXP) announces that it is proposing to
raise approximately $2.552 million through a private placement (“Private
Placement”). A total of 20,000,000 new common shares have been conditionally
placed (“Placing Shares”), at an issue price of 7.25 pence sterling
(approximately C$0.1276) per Placing Share (“Placing Price”) with new United
Kingdom institutional investors.

In addition, the Company announces its intention to seek a dual listing by
applying for admission of its issued and to be issued common shares of no par
value (“Common Shares”) to trading on the AIM market of the London Stock
Exchange (“Admission”). Dealings are expected to commence on AIM on June 26,
2017.

The issuance of the Placing Shares is conditional on customary closing
conditions, including the Admission becoming effective and the approval of the
Private Placement by the Toronto Stock Exchange (“TSX”). The Company’s Common
Shares will continue to trade on the TSX along with AIM under the trading
symbol TXP. The Placing Price represents a 20 percent discount to C$0.1589,
which is the volume weighted average price of the Company’s Common Shares for
the five trading days ending May 17, 2017. A price protection form was filed
with the TSX on May 17, 2017. The Placing Price was negotiated at arm’s length
between the Company and the joint brokers.

Paul Baay, President and Chief Executive Officer of Touchstone said, “I am
delighted to announce our intention to dual list on AIM. We have a low risk,
cash-generative production company in a proven petroleum region. Our growth
strategy involves an initial program for the drilling of four new wells and 24
well recompletions in 2017, of which we are pleased to announce the first well
has reached target depth. I look forward to welcoming our new investors when
Touchstone lists on AIM.”

Touchstone believes the dual listing provides a number of advantages, which
includes:

/T/

— enhancing liquidity for the Company’s shareholders and providing direct

access to the London capital markets;
— enabling the Company to access a wider range of potential investors and
broaden its investor base;
— improving the Company’s ability to access further funding from
international capital markets and to finance the future growth of the
business consistent with its current strategy; and
— enhancing the Company’s reputation and financial standing within
Trinidad.

/T/

The gross proceeds of the Private Placement are expected to be approximately
$2.552 million which, together with existing cash balances, are expected to be
used in drilling and development operations in 2017, for settlement of fees in
respect of the transaction, and for general working capital purposes.

Shore Capital is acting as Nominated Adviser and Joint Broker to the Company
alongside GMP FirstEnergy who is acting as Joint Broker. Additional information
is available in the Appendix to the AIM Schedule One Pre-Admission
Announcement, which will be available on the Company’s website
(www.touchstoneexploration.com).

Publication of Competent Person’s Report (“CPR”)

In conjunction with the dual-listing of the Company’s Common Shares on AIM, the
Company appointed GLJ Petroleum Consultants Ltd. to prepare a CPR which
estimated the reserves associated with the Company’s interests in Trinidad as
at December 31, 2016. A summary of the gross reserves associated with the
Company’s interests in Trinidad are presented in the table below.

/T/

—————————————————————————-

Light and
Medium Oil Heavy Oil Total Oil
(Mbbl) (Mbbl) (Mbbl)
—————————————————————————-

Proved

Proved producing 3,955 651 4,606
Proved non-producing 735 213 948
Proved undeveloped 2,890 533 3,423
—————————————————————————-
Total Proved 7,580 1,397 8,977
Probable 5,914 808 6,772
—————————————————————————-
Total Proved Plus Probable 13,494 2,205 15,698
—————————————————————————-
Possible 4,020 657 4,678
—————————————————————————-
Total Proved Plus Probable Plus Possible 17,514 2,862 20,376
—————————————————————————-
Notes:
1. Gross Reserves are the Company’s working interest share of the remaining
reserves before deduction of any royalties.
2. Amounts may not add due to rounding.
3. See “Other Advisories”.

/T/

The CPR will be filed under the Company’s issuer profile on SEDAR
(www.sedar.com) and on the Company’s website (www.touchstoneexploration.com).

About Touchstone

Touchstone Exploration Inc. is a Calgary based company engaged in the business
of acquiring interests in petroleum and natural gas rights, and the
exploration, development, production and sale of petroleum and natural gas.
Touchstone is currently active in onshore properties located in the Republic of
Trinidad and Tobago. The Company’s common shares are traded on the Toronto
Stock Exchange under the symbol “TXP”.

Advisories

For reference purposes in this press release, one British pound has been
translated into Canadian dollars at a rate of 1 to 1.76.

Forward-Looking Statements

Certain information regarding Touchstone set forth in this press release,
including assessments by the Company’s Management of the Company’s plans and
future operations, contains forward-looking statements that involve substantial
known and unknown risks and uncertainties. All statements other than statements
of historical fact may be forward-looking statements. Forward-looking
statements are often, but not always, identified by the use of words such as
“seek”, “anticipate”, “plan”, “continue”, “estimate”, “expect”, “may”, “will”,
“project”, “predict”, “potential”, “targeting”, “intend”, “could”, “might”,
“should”, “believe” and other similar expressions. Statements relating to
“reserves” are deemed to be forward-looking statements, as they involve the
implied assessment, based on certain estimates and assumptions, that the
reserves described exist in the quantities predicted or estimated, and can be
profitably produced in the future. Such statements represent the Company’s
internal projections, estimates or beliefs concerning future growth, results of
operations based on information currently available to the Company based on
assumptions that are subject to change and are beyond the Company’s control,
such as: production rates and production decline rates, the magnitude of and
ability to recover oil and gas reserves, plans for and results of drilling
activity, well abandonment costs and salvage value, the ability to secure
necessary personnel, equipment and services, environmental matters, future
commodity prices, changes to prevailing regulatory, royalty, tax and
environmental laws and regulations, the impact of competition, future capital
and other expenditures (including the amount, nature and sources of funding
thereof), future financing sources, business prospects and opportunities, among
other things. Many factors could cause the Company’s actual results to differ
materially from those expressed or implied in any forward-looking statements
made by, or on behalf of, the Company.

In particular, forward-looking statements contained in this press release
include, but are not limited to, statements with respect to: the Private
Placement, including the number of Placing Shares, the Placing Price, the gross
proceeds generated therefrom and the anticipated uses of those proceeds; the
Admission, including the expected commencement of dealings thereunder and
benefits therefrom; projected production volumes; operating and development
costs; estimated reserves, including the life index thereof and the discounted
present value of future net revenues therefrom; exploration, development and
associated operational plans and strategies (including planned drilling and
recompletion programs), and the anticipated timing of, and sources of funding
for, such activities; and the terms of the Company’s contractual commitments
and the Company’s compliance therewith, including fulfilment of minimum work
obligations and repayment of loans.

The Company is exposed to numerous operational, technical, financial and
regulatory risks and uncertainties, many of which are beyond its control and
may significantly affect anticipated future results. The risk factors
applicable to the Company are set out in the Company’s Annual Information Form
dated March 21, 2017, which has been filed on SEDAR (www.sedar.com). Readers
are cautioned that the assumptions used in the preparation of such information,
although considered reasonable at the time of preparation, may prove to be
imprecise and as such, undue reliance should not be placed on forward-looking
statements. The Company does not undertake any obligation to update publicly or
to revise any of the included forward-looking statements, whether as a result
of new information, future events or otherwise, except as may be required by
applicable securities laws.

Other Advisories

The disclosure in this press release summarizes certain information contained
in the CPR and the Company’s December 31, 2016 reserves report, but represents
only a portion of the disclosure required under National Instrument 51-101 –
Standards for Disclosure of Oil & Gas Activities. Full disclosure with respect
to the Company’s reserves as at December 31, 2016 is contained in the Company’s
Annual Information Form for the year ended December 31, 2016 which is filed
under the Company’s issuer profile on SEDAR (www.sedar.com). All evaluations
and reviews of future net revenues use GLJ Petroleum Consultants Ltd.’s
standard price forecasts effective January 1, 2017 and are stated prior to any
provision for finance expenses or general and administrative costs and after
the deduction of estimated future capital expenditures and estimated future
well abandonment costs. It should not be assumed that the present worth of
estimated future net revenues contained in the CPR represent the fair market
value of the reserves. There is no assurance that the forecast prices and costs
assumptions will be attained and variances could be material. The recovery and
reserves estimates of crude oil provided herein are estimates only, and there
is no guarantee that the estimated reserves will be recovered. Actual crude oil
reserves may be greater than or less than the estimates provided herein.

Possible reserves are those additional reserves that are less certain to be
recovered than probable reserves. There is a 10% probability that the
quantities actually recovered will equal or exceed the sum of proved plus
probable plus possible reserves.

– END RELEASE – 25/05/2017

For further information:
Touchstone Exploration Inc.
Mr. Paul Baay
President and Chief Executive Officer
403.750.4487
OR
Touchstone Exploration Inc.
Mr. Scott Budau
Chief Financial Officer
403.750.4487
OR
Touchstone Exploration Inc.
Mr. James Shipka
Chief Operating Officer
403.750.4487
www.touchstoneexploration.com

COMPANY:
FOR: TOUCHSTONE EXPLORATION INC.
TSX SYMBOL: TXP

INDUSTRY: Energy and Utilities – Oil and Gas
RELEASE ID: 20170525CC0014

Press Release from Marketwired 1-866-736-3779

All press releases are written by the client and have NO affiliation with the news copy written by The Canadian Press. Any questions that arise due to the content or information provided in the press release should be directed to the company/organization
issuing the release, not to The Canadian Press.

GET ENERGYNOW’S DAILY EMAIL FOR FREE


Canadian Overseas Petroleum Ltd: Common Share Offering

FOR: CANADIAN OVERSEAS PETROLEUM LTD
TSX VENTURE SYMBOL: XOP
LSE SYMBOL: COPL

Date issue: May 25, 2017
Time in: 2:00 AM e

Attention:

CALGARY, AB–(Marketwired – May 24, 2017) – Canadian Overseas Petroleum Ltd
(TSX VENTURE: XOP) (LSE: COPL)

(TSXV: XOP) (LSE: COPL)

Canadian Overseas Petroleum Limited

Common Share Offering

Calgary, Canada, 25 May 2017- Canadian Overseas Petroleum Limited (the
“Company”) (TSXV: XOP) (LSE: COPL), is pleased to announce a Common Share
offering to raise gross proceeds of £ 3.25 million (the “Placing”),
pursuant to which the Company will issue 650,000,000 new common shares
(“Placing Shares”) at a price of 0.5 pence per Placing Share. Management,
including Arthur Millholland, President & CEO, representing approximately
3% of the existing share capital of the Company, and certain existing
shareholders, plan to participate in the Placing for an amount approximately
equal to their proportionate current holdings in the Company.

Full details of the Placing will be included in the Prospectus filed with the
UK Listing Authority, which is expected to be published later today and be
available on SEDAR and the Company’s website, http://canoverseas.com (subject
to certain access restrictions), shortly thereafter.

The Company intends to use the net proceeds of the Placing to fund the
Company’s on-going general and administrative expenses which principally covers
a full technical team including geologists, a geophysicist, reservoir
engineers, a drilling engineer and in-house Counsel, which are approximately
US$385,000 per month, as the Company seeks to progress its projects in West
Africa.

Mr. Arthur Millholland, President & CEO
Canadian Overseas Petroleum Limited
Tel: + 1 (403) 262 5441

Cathy Hume
CHF Investor Relations
Tel: +1 (416) 868 1079 ext. 231
Email: [email protected]

Harriet Jackson/Charles Goodwin
Yellow Jersey PR Limited
Tel: +44 (0) 75 4427 5882
Email: [email protected]

Broker: London Stock Exchange
Shore Capital Stockbrokers Limited
Edward Mansfield / Mark Percy
Phone: T: +44 20 7408 4090

Click on, or paste the following link into your web browser, to view the
associated PDF document.
http://www.rns-pdf.londonstockexchange.com/rns/1771G_1-2017-5-25.pdf

This information is provided by RNS
The company news service from the London Stock Exchange

– END RELEASE – 25/05/2017

For further information:
RNS
Customer
Services
0044-207797-4400
[email protected]
http://www.rns.com

COMPANY:
FOR: CANADIAN OVERSEAS PETROLEUM LTD
TSX VENTURE SYMBOL: XOP
LSE SYMBOL: COPL

INDUSTRY: Energy and Utilities – Oil and Gas
RELEASE ID: 20170525CC0004

Press Release from Marketwired 1-866-736-3779

All press releases are written by the client and have NO affiliation with the news copy written by The Canadian Press. Any questions that arise due to the content or information provided in the press release should be directed to the company/organization
issuing the release, not to The Canadian Press.

GET ENERGYNOW’S DAILY EMAIL FOR FREE


COURSE: Understanding and Optimizing Well Performance Course – June 21st-22nd 2017 – PEICE

PEICE will be offering a new two-day “Understanding and Optimizing Well Performance” course in Calgary, also available for remote participation via our Live Virtual Training platform on June 21st & 22nd 2017. This two day course is a concept and capability building course designed for engineers, technologists, service personnel and others involved directly or indirectly … Read more

GET ENERGYNOW’S DAILY EMAIL FOR FREE


Macro Enterprises Inc. Announces 2017 First Quarter Results

FOR: MACRO ENTERPRISES INC.TSX VENTURE SYMBOL: MCRDate issue: May 24, 2017Time in: 8:00 PM eAttention:
FORT ST. JOHN, BRITISH COLUMBIA–(Marketwired – May 24, 2017) – Macro
Enterprises Inc. (TSX VENTURE:MCR) –
/T/

GET ENERGYNOW’S DAILY EMAIL FOR FREE


Crescent Point Announces Annual General Meeting Voting Results

FOR: CRESCENT POINT ENERGY CORP.
TSX SYMBOL: CPG
NYSE SYMBOL: CPG

Date issue: May 24, 2017
Time in: 7:46 PM e

Attention:

CALGARY, ALBERTA–(Marketwired – May 24, 2017) – Crescent Point Energy Corp.
(“Crescent Point” or the “Company”) (TSX:CPG)(NYSE:CPG) held its annual general
meeting on May 24, 2017, in Calgary. Approximately 247 million shares,
representing 45.25% of common shares, were represented in person or by proxy at
the meeting.

During the regular business proceedings at the meeting, shareholders approved
the election of all nominated directors.

Full voting results for all resolutions are below. For comparison, the Company
has also included the voting results in favour of resolutions that were passed
at last year’s annual general meeting, which had 46.84% of common shares
represented in person or by proxy.

/T/

1. Fixing Number of Directors

/T/

The appointment of 10 board members for the ensuing year was approved by a show
of hands. Proxies and in-person votes were received as follows:

/T/

—————————————————————————-
Votes For Percent Against Percent 2016 Votes For
—————————————————————————-
244,038,359 99.02% 2,423,725 0.98% 99.68%
—————————————————————————-

2. Election of Directors

/T/

The 10 director nominees proposed by management were elected by a show of
hands. Proxies and in-person votes were received as follows:

/T/

—————————————————————————-

2016 Votes
Nominee Votes For Percent Withheld Percent For
—————————————————————————-
Rene Amirault 225,222,556 91.96% 19,692,511 8.04% 78.43%
Peter Bannister 228,096,881 93.13% 16,818,186 6.87% 98.53%
Laura A. Cillis 230,027,638 93.92% 14,887,429 6.08% 89.49%
D. Hugh Gillard 225,870,725 92.22% 19,044,342 7.78% 88.46%
Ted Goldthorpe 240,695,393 98.28% 4,219,674 1.72% N/A
Robert F. Heinemann 222,532,395 90.86% 22,382,672 9.14% 89.29%
Mike Jackson 232,957,004 95.12% 11,958,063 4.88% N/A
Barbara Munroe 229,394,691 93.66% 15,520,376 6.34% 99.59%
Gerald A. Romanzin 235,966,066 96.35% 8,949,001 3.65% 98.68%
Scott Saxberg 230,364,374 94.06% 14,550,693 5.94% 97.04%
—————————————————————————-

3. Appointment of Auditors

/T/

The appointment of PricewaterhouseCoopers LLP as Crescent Point’s auditors was
approved by a show of hands. Proxies and in-person votes were received as
follows:

/T/

—————————————————————————-
Votes For Percent Withheld Percent 2016 Votes For
—————————————————————————-
244,568,538 99.23% 1,893,546 0.77% 99.31%
—————————————————————————-

4. Advisory Vote on Executive Compensation

/T/

The resolution to accept the Company’s approach to executive compensation, the
full text of which is set forth in the Information Circular, was approved.
Proxies and in-person votes were received as follows:

/T/

—————————————————————————-
Votes For Percent Against Percent 2016 Votes For
—————————————————————————-
211,568,818 86.36% 33,422,825 13.64% 31.00%
—————————————————————————-

/T/

“Throughout 2016, our Board and Compensation Committee worked with shareholders
and incorporated their feedback in our revised compensation plan,” said Scott
Saxberg, president and CEO of Crescent Point. “We remain committed to being
transparent and accountable with our investors and value ongoing feedback.”

The biographies of Crescent Point’s board members and more details about the
Company’s corporate governance practices are available on
www.crescentpointenergy.com.

Crescent Point is one of Canada’s largest light and medium oil producers, based
in Calgary, Alberta. The Company is focused on growing its significant resource
base in the Williston Basin, southwest Saskatchewan and the Uinta Basin in
Utah. Crescent Point strives to maximize shareholder returns through its total
return strategy of long-term growth plus dividend income.

CRESCENT POINT ENERGY CORP.

Scott Saxberg, President and Chief Executive Officer

Crescent Point shares are traded on the Toronto Stock Exchange and New York
Stock Exchange under the symbol CPG.

– END RELEASE – 24/05/2017

For further information:
Crescent Point Energy Corp.
Ken Lamont
Chief Financial Officer
(403) 693-0020 or Toll-free (US & Canada): 888-693-0020
OR
Crescent Point Energy Corp.
Brad Borggard
Vice President, Corporate Planning and Investor Relations
(403) 693-0020 or Toll-free (US & Canada): 888-693-0020
(403) 693-0070 (FAX)
www.crescentpointenergy.com

COMPANY:
FOR: CRESCENT POINT ENERGY CORP.
TSX SYMBOL: CPG
NYSE SYMBOL: CPG

INDUSTRY: Energy and Utilities – Oil and Gas
RELEASE ID: 20170524CC0075

Press Release from Marketwired 1-866-736-3779

All press releases are written by the client and have NO affiliation with the news copy written by The Canadian Press. Any questions that arise due to the content or information provided in the press release should be directed to the company/organization
issuing the release, not to The Canadian Press.

GET ENERGYNOW’S DAILY EMAIL FOR FREE


Divestco Reports 2017 Q1 Results

FOR: DIVESTCO INC.
TSX VENTURE Symbol: DVT

Date issue: May 24, 2017
Time in: 6:28 PM e

Attention:

CALGARY, AB –(Marketwired – May 24, 2017) – (TSX VENTURE: DVT) – Divestco
Inc. (“Divestco” or the “Company”), an exploration services company dedicated
to providing a comprehensive and integrated portfolio of data, software and
services to the oil and gas industry worldwide, today announced its financial
and operating results for the three months ended March 31, 2017.

Financial Highlights

Overall Performance and Operational Results

/T/

—————————————————————————-
Financial Results (Thousands, Except Per Share Amounts)
—————————————————————————-

Three months ended March 31
—————————————————————————-
2017 2016 $ Change % Change
—————————————————————————-

Revenue $ 3,981 $ 3,137 $ 844 27%

Operating Expenses (1) 2,897 2,675 222 8%

Other Loss 22 69 (47) -68%
—————————————————————————-

EBITDA (2) 1,062 393 669 170%

Finance Costs 353 355 (2) -1%

Depreciation and Amortization (3) 3,103 1,432 1,671 117%
—————————————————————————-

Net Loss $ (2,394) $ (1,394) $ (1,000) N/A
Per Share – Basic and Diluted (0.04) (0.02) (0.02) N/A
—————————————————————————-

Funds from Operations $ 485 $ 397 $ 88 22%
Per Share – Basic and Diluted 0.01 0.01 – 0%
—————————————————————————-

Class A Shares Outstanding 66,884 67,252 N/A N/A

Weighted Average Shares
Outstanding

Basic and Diluted 66,884 67,211 N/A N/A
—————————————————————————-

/T/

/T/

(1) Includes salaries & benefits, general & administrative expenses and

share-based payments but excludes depreciation and amortization and
other losses (income)
(2) See the “Non GAAP Measures” section of the Company’s Management
Discussion and Analysis filed on the Company’s website and on SEDAR
(3) Increase in Q1 2017 from Q1 2016 is due to a new seismic survey
completed in Q1 2017. The Company’s policy is to amortize 40% of the
cost of a new seismic survey in the period of data delivery.

/T/

Q1 2017 vs. Q1 2016

Divestco generated revenue of $4.0 million in Q1 2017 compared to $3.1 million
in Q1 2016, an increase of $0.9 million (27%) mainly due to higher Seismic
Data segment revenue related to the completion of a new seismic survey.
Revenue in the Seismic Data segment ($2.6 million) increased by $1.7 million
(186%). Revenue in the Software & Data segment ($0.7 million) decreased by
$0.4 million (29%) and revenue in the Services segment ($0.6 million)
decreased by $0.6 million (47%). Operating expenses increased by $0.2 million
(8%) due to higher business taxes and royalties. Finance costs remained
unchanged. Depreciation and amortization was $3.1 million in Q1 2017 compared
to $1.4 million in Q1 2016, an increase of $1.7 million (117%) due to the
completion of a new seismic survey. Depreciation and amortization was $3.1
million in Q1 2017 compared to $1.4 million in Q1 2016, an increase of $1.7
million (117%) due to the completion of a new seismic survey.

Financial Position (1)

As at March 31, 2017, Divestco had a working capital deficiency of $0.1
million (December 31, 2016: $3.9 million deficiency), excluding deferred
revenue of $1.1 million (December 31, 2015: $1.7 million). The decrease in the
working capital deficit from the end of 2016 was due to the repayment of a
bridge loan in March 2017 and positive funds from operations.

/T/

(1) See the “Non GAAP Measures” section of the Company’s Management

Discussion and Analysis filed on the Company’s website and on SEDAR

/T/

Operations Update and Outlook

The improvement in West Texas Intermediate oil prices from a low of
US$33/barrel in March 2016 to a high of US$54/barrel in March 2017 has led to
increases in capital spending by the industry. With the recent announcements
of equity and debt financings, access to capital also seems to be improving
for our clients leading us to view the later part of the year in a more
favourable light. Divestco diligently monitors its operating expenses, and we
have reduced our costs by over 50% since 2014. Most of the austerity measures
that the Company put in place in response to the downturn are expected to
remain in place for the remainder of 2017 or until a change in activity levels
is realized.

Mr. Stephen Popadynetz, CEO and President commented: “Divestco has continued
to see improvements in the financial results in Q1 2017, completing the
quarter with $0.5 million in positive funds from operations and reducing our
working capital deficit by $3.8 million. We also negotiated new financing and
retired our $3.2 million bridge loan in March 2017. Our strategy of focussing
on international markets resulted in us being awarded several contracts which
we expect to complete over the next two quarters. Domestically, we continue to
see new opportunities within all our divisions and we are well positioned to
take advantage of the uptick in activity levels and capital spending plans.
After two long years of industry contraction, we are finally starting to see
opportunities for growth throughout our organization and for improved earnings
and financial stability.”

About the Company

Divestco is an exploration services company that provides a comprehensive and
integrated portfolio of data, software, and services to the oil and gas
industry. Through continued commitment to align and bundle products and
services to generate value for customers, Divestco is creating an unparalleled
set of integrated solutions and unique benefits for the marketplace.
Divestco’s breadth of data, software and services offers customers the ability
to access and analyze the information required to make business decisions and
to optimize their success in the upstream oil and gas industry. Divestco is
headquartered in Calgary, Alberta, Canada and trades on the TSX Venture
Exchange under the symbol “DVT”.

Additional information on the Company is available on its website at
Divestco.com and on SEDAR at sedar.com.

Neither TSX Venture Exchange nor its Regulation Services Provider (as that
term is defined in the policies of the TSX Venture Exchange) accepts
responsibility for the adequacy or accuracy of this news release.

This press release contains forward-looking information related to the
Company’s capital expenditures, projected growth, view and outlook with
respect to future oil and gas prices and market conditions, and demand for its
products and services. Statements that contain words such as “could’,
“should”, “can”, “anticipate”, “expect”, “believe”, “will”, “may” and similar
expressions and statements relating to matters that are not historical facts
constitute “forward-looking information” within the meaning applicable by
Canadian securities legislation. Although management of the Company believes
that the expectations reflected in such forward-looking information are
reasonable, there can be no assurance that such expectations will prove to
have been correct because, should one or more of the risks materialize, or
should the assumptions underlying forward-looking statements or
forward-looking information prove incorrect, actual results may vary
materially from those described in this press release as intended, planned,
anticipated, believed, estimated or expected. Readers should not place undue
reliance on forward-looking statements or forward-looking information. All of
the forward-looking statements and forward-looking information of the Company
contained in this press release are expressly qualified, in their entirety, by
this cautionary statement. Except where required by law, the Company does not
assume any obligation to update these forward-looking statements or
forward-looking information if conditions or opinions should change.

In particular, this press release contains forward-looking statements
pertaining to the following: Company’s ability to keep debt and liquidity at
acceptable levels, improve/maintain its working capital position and maintain
profitability in the current economy; availability of external and internal
funding for future operations; relative future competitive position of the
Company; nature and timing of growth; oil and natural gas production levels;
planned capital expenditure programs; supply and demand for oil and natural
gas; future demand for products/services; commodity prices; impact of Canadian
federal and provincial governmental regulation on the Company; expected levels
of operating costs, finance costs and other costs and expenses; future ability
to execute acquisitions and dispositions of assets or businesses; expectations
regarding the Company’s ability to raise capital and to add to seismic data
through new seismic shoots and acquisition of existing seismic data; treatment
under tax laws; and new accounting pronouncements.

These forward-looking statements are based upon assumptions including: future
prices for crude oil and natural gas; future interest rates and future
availability of debt and equity financing will be at levels and costs that
allow the Company to manage, operate and finance its business and develop its
software products and various oil and gas datasets including its seismic data
library, and meet its future obligations; the regulatory framework in respect
of royalties, taxes and environmental matters applicable to the Company and
its customers will not become so onerous on both the Company and its customers
as to preclude the Company and its customers from viably managing, operating
and financing its business and the development of its software and data; and
that the Company will continue to be able to identify, attract and employ
qualified staff and obtain the outside expertise as well as specialized and
other equipment it requires to manage, operate and finance its business and
develop its properties.

These forward-looking statements are subject to numerous risks and
uncertainties, certain of which are beyond the Company’s control, including:
general economic, market and business conditions; volatility in market prices
for crude oil and natural gas; ability of Divestco’s clients to explore for,
develop and produce oil and gas; availability of financing and capital;
fluctuations in interest rates; demand for the Company’s product and services;
weather and climate conditions; competitive actions by other companies;
availability of skilled labour; failure to obtain regulatory approvals in a
timely manner; adverse conditions in the debt and equity markets; and
government actions including changes in environment and other regulation.

– END RELEASE – 24/05/2017

For further information:

For more information please contact:
Divestco Inc.
(www.divestco.com)
Mr. Stephen Popadynetz
CEO and President
Tel 587-952-8152

Mr. Danny Chiarastella
CFO
Tel 587-952-8027

COMPANY:
FOR: DIVESTCO INC.
TSX VENTURE Symbol: DVT

INDUSTRY: Energy and Utilities – Oil and Gas
RELEASE ID: 20170524CC013

Press Release from Marketwired 1-866-736-3779

All press releases are written by the client and have NO affiliation with the news copy written by The Canadian Press. Any questions that arise due to the content or information provided in the press release should be directed to the company/organization
issuing the release, not to The Canadian Press.

GET ENERGYNOW’S DAILY EMAIL FOR FREE


DIVERGENT Energy Services Corp. Announces Acceptance of Director Resignation Pursuant to the Majority Voting Policy

FOR: DIVERGENT ENERGY SERVICES CORP.TSX VENTURE SYMBOL: DVGDate issue: May 24, 2017Time in: 6:09 PM eAttention:
CALGARY, ALBERTA–(Marketwired – May 24, 2017) –
NOT FOR DISSEMINATION IN THE UNITED STATES OF AMERICA
DIVERGENT Energy Services Corp. (TSX…

GET ENERGYNOW’S DAILY EMAIL FOR FREE


Raise Production Inc. Announces First Quarter 2017 Financial Results and Operations Update

FOR: RAISE PRODUCTION INC.
TSX VENTURE SYMBOL: RPC

Date issue: May 24, 2017
Time in: 5:48 PM e

Attention:

CALGARY, ALBERTA–(Marketwired – May 24, 2017) – Raise Production Inc. (TSX
VENTURE:RPC) (“Raise” or the “Company”) has released its financial results for
three months ended March 31, 2017.

PRESIDENT’S UPDATE

The Company is pleased to provide shareholders with an updated report on
current activities regarding its Horizontal Wellbore Production System (the
“System”) and recent developments related to its patent pending High Angle Lift
Solution (“HALS”).

Horizontal Pumping System (the “System”)

The System has worked flawlessly over the last few months with the downhole
pumps and surface unit controls giving continuous operation with the only
required down time for routine maintenance of compressors. The Company has been
implementing various optimization scenarios to assess what expected production
increases may be seen from this older wellbore. To date, we are confident that
all production is being produced from the toe area and not from the depleted
heel area and will be accretive to heel production once the well is
reconfigured to allow full productivity. Based on this deployment and in
additional discussions with Canadian and U.S. operators we are confident that
the vast majority of horizontal wellbores are disadvantaged in terms of
productivity from the toe area compared to the heel sections.

High Angle Lift Solution (“HALS”)

The Company has deployed the last prototype test of its HALS for a major E & P
company and, as stated in the last press release dated April 26, 2017 regarding
previous installs, this new install has again produced outstanding results.
Since the last press release, the Company has initiated a sales program to
identify and engage the best candidates to bring this technology to the right
market in the shortest time frame possible. The Company is excited to offer a
number of options to industry operators that will eventually lead to the
horizontal multiple pumps as the ultimate recovery method for stranded reserves
in the toe area of wellbores.

Future Opportunities

The Company continues to receive positive feedback from some U.S. operators
with interest in pursuing development of the System and the HALS for use in
U.S. basins. The Company continues to be in discussions with a number of
companies and will update shareholders as these talks progress.

RESULTS OF OPERATIONS

Statements of Loss and Comprehensive Loss

/T/

—————————————————————————-
—————————————————————————-

Three Months ended
March 31
2017 2016
—————————————————————————-

Revenue $ 7,400 $ 55,650

Cost of sales 6,999 38,471
—————————————————————————-
Gross margin 401 17,179
—————————————————————————-

Interest Income 2,859 5,964
—————————————————————————-

Expenses:

General and administration 291,890 361,828
Depreciation and amortization 27,219 34,464
Stock-based compensation 12,947 28,443
Finance costs 3,021 4,983
—————————————————————————-
335,077 429,718

—————————————————————————-

Net loss and comprehensive loss $ (331,817) $ (406,575)
—————————————————————————-
—————————————————————————-

Net loss per share – basic and diluted $ (0.00) $ (0.00)
—————————————————————————-
—————————————————————————-

/T/

Raise’s full unaudited condensed interim financial statements and management’s
discussion and analysis will be filed shortly on the Company’s profile on the
SEDAR website.

About Raise Production Inc.

The Company is an innovative oilfield service company that focuses its efforts
on the production service sector, utilizing its proprietary products to enhance
and increase ultimate production in both conventional and unconventional
horizontal oil and gas wells.

Neither TSX Venture Exchange nor its Regulation Services Provider (as that term
is defined in the policies of the TSX Venture Exchange) accepts responsibility
for the adequacy or accuracy of this news release.

Certain information included in this news release constitutes forward-looking
statements under applicable securities legislation. Forward-looking statements
or information typically contain or can be identified by statements that
include words such as “anticipate”, “assume”, “based”, “believe”, “can”,
“continue”, “depend”, “estimate”, “expect”, “forecast”, “if”, “intend”, “may”,
“plan”, “project”, “propose”, “result”, “upon”, “will”, “within” or similar
words suggesting future outcomes or statements regarding an outlook. Such
forward-looking statements or information are based on a number of assumptions
that may prove to be incorrect. Assumptions have been made regarding, among
other things: the ability of the Company to obtain required capital to continue
to finance its product development, the successful completion of further
product development and testing within predicted timelines or at all, the
ability to commercialize products and operations, the ability to adequately
protect proprietary information and technology from its competitors; the
ability to obtain partnering opportunities; the ability to attract and retain
key personnel and key collaborators; and the ability to successfully compete in
targeted markets.

The forward-looking statements contained in this news release are made as of
the date hereof and the Company does not undertake any obligation to publicly
update or revise any of the included forward-looking statements, except as
required by applicable Canadian securities law. Forward-looking statements are
based upon the current opinions, estimates, projections, assumptions and
expectations of management of the Company as at the effective date of such
statements and, in some cases, information supplied by third parties. Although
the Company believes that the expectations reflected in such forward-looking
statements are based upon reasonable assumptions and that information received
from third parties is reliable, it can give no assurance that those
expectations will prove to have been correct. By its nature, forward-looking
information involves numerous assumptions, known and unknown risks and
uncertainties, both general and specific, that contribute to the possibility
that the predictions, forecasts, projections and other forward-looking
statement will not occur. These risks and uncertainties include, but are not
limited to: the possibility that testing, deployment and commercialization of
the System and Rod Pumps may not be successfully completed for any reason
(including the failure to obtain the required approvals from regulatory
authorities) and regulatory changes. Accordingly, readers should not place
undue reliance upon the forward-looking statements contained in this news
release and such forward-looking statements should not be interpreted or
regarded as guarantees of future performance and actual results or developments
may differ materially from those projected in the forward-looking statements.
For more information on the Company, investors should review the Company’s
continuous disclosure filings that are available at www.sedar.com.

– END RELEASE – 24/05/2017

For further information:
Raise Production Inc.
Eric Laing
President and Chief Executive Officer
(403) 699-7675
[email protected]
OR
Raise Production Inc.
Susan Scullion
Chief Financial Officer
(403) 699-7675
[email protected]
www.raiseproduction.com

COMPANY:
FOR: RAISE PRODUCTION INC.
TSX VENTURE SYMBOL: RPC

INDUSTRY: Energy and Utilities – Oil and Gas
RELEASE ID: 20170524CC0072

Press Release from Marketwired 1-866-736-3779

All press releases are written by the client and have NO affiliation with the news copy written by The Canadian Press. Any questions that arise due to the content or information provided in the press release should be directed to the company/organization
issuing the release, not to The Canadian Press.

GET ENERGYNOW’S DAILY EMAIL FOR FREE


Canadian Utilities Limited Announces Conversion Results for Its Series Y Preferred Shares

FOR: CANADIAN UTILITIES LIMITED
TSX SYMBOL: CU
TSX SYMBOL: CU.X

Date issue: May 24, 2017
Time in: 5:35 PM e

Attention:

CALGARY, ALBERTA–(Marketwired – May 24, 2017) – Canadian Utilities Limited
(TSX:CU) (TSX:CU.X)

Canadian Utilities Limited announced today that after having taken into account
all election notices following the conversion deadline for the Cumulative
Redeemable Second Preferred Shares Series Y (“Series Y Preferred Shares”)
tendered for conversion into Cumulative Redeemable Second Preferred Shares
Series Z (“Series Z Preferred Shares”), the holders of Series Y Preferred
Shares are not entitled to convert their Series Y Preferred Shares into Series
Z Preferred Shares. There were approximately 508,379 Series Y Preferred Shares
tendered for conversion, which is less than the two million shares required to
give effect to conversions into Series Z Preferred Shares.

The Series Y Preferred Shares will continue to pay on a quarterly basis, for
the five-year period from and including June 1, 2017 to but excluding June 1,
2022, as and when declared by the Board of Directors of Canadian Utilities
Limited, a fixed dividend based on an annual dividend rate of 3.40%.

For more information on the terms of, and risks associated with an investment
in, the Series Y Preferred Shares, please see Canadian Utilities Limited’s
prospectus supplement dated September 15, 2011, which can be found under
Canadian Utilities Limited’s profile on SEDAR at www.sedar.com.

With approximately 5,400 employees and assets of $19 billion, Canadian
Utilities Limited is an ATCO company. ATCO is a diversified global corporation
delivering service excellence and innovative business solutions in Structures &
Logistics (workforce housing, innovative modular facilities, construction, site
support services, and logistics and operations management); Electricity
(electricity generation, transmission, and distribution); Pipelines & Liquids
(natural gas transmission, distribution and infrastructure development, energy
storage, and industrial water solutions); and Retail Energy (electricity and
natural gas retail sales). More information can be found at
www.canadianutilities.com.

Forward-Looking Information:

Certain statements contained in this news release may constitute
forward-looking information. Forward-looking information is often, but not
always, identified by the use of words such as “anticipate”, “plan”,
“estimate”, “expect”, “may”, “will”, “intend”, “should”, and similar
expressions.

Forward-looking information involves known and unknown risks, uncertainties and
other factors that may cause actual results or events to differ materially from
those anticipated in such forward-looking information.

The Company’s actual results could differ materially from those anticipated in
this forward-looking information as a result of regulatory decisions,
competitive factors in the industries in which the Company operates, prevailing
economic conditions, and other factors, many of which are beyond the control of
the Company.

The Company believes that the expectations reflected in the forward-looking
information are reasonable, but no assurance can be given that these
expectations will prove to be correct and such forward-looking information
should not be unduly relied upon.

Any forward-looking information contained in this news release represents the
Company’s expectations as of the date hereof, and is subject to change after
such date. The Company disclaims any intention or obligation to update or
revise any forward-looking information whether as a result of new information,
future events or otherwise, except as required by applicable securities
legislation.

– END RELEASE – 24/05/2017

For further information:
Media & Investor Inquiries:
B.R. (Brian) Bale
Senior Vice President & Chief Financial Officer
403-292-7502

COMPANY:
FOR: CANADIAN UTILITIES LIMITED
TSX SYMBOL: CU
TSX SYMBOL: CU.X

INDUSTRY: Energy and Utilities – Utilities, Energy and Utilities –
Pipelines
RELEASE ID: 20170524CC0071

Press Release from Marketwired 1-866-736-3779

All press releases are written by the client and have NO affiliation with the news copy written by The Canadian Press. Any questions that arise due to the content or information provided in the press release should be directed to the company/organization
issuing the release, not to The Canadian Press.

GET ENERGYNOW’S DAILY EMAIL FOR FREE


Epsilon Annouces Election of Board of Directors

FOR: EPSILON ENERGY LTD.
TSX SYMBOL: EPS

Date issue: May 24, 2017
Time in: 4:11 PM e

Attention:

HOUSTON, TEXAS–(Marketwired – May 24, 2017) – Epsilon Energy Ltd. (“Epsilon”
or the “Company”) (TSX:EPS) is pleased to announce that all the nominees listed
in its Management Information Circular dated April 25, 2017 were elected as
directors of Epsilon, until the next annual meeting of shareholders. The
detailed results of the vote held Wednesday, May 24, 2017 are set out below.

Election of Directors

An amendment was passed to increase the number of directors from six to seven.
The appointment of Deloitte & Touche as auditors passed as well as the new
Share Compensation Plan. Each of the following seven nominees proposed by
management was elected as a director of Epsilon.

/T/

—————————————————————————-
Nominee % For % Withheld
—————————————————————————-

John Lovoi 97.5% 2.5%
Matthew Dougherty 99.3% 0.7%
Ryan Roebuck 100.0% 0.0%
Adrian Montgomery 100.0% 0.0%
Michael Raleigh 100.0% 0.0%
Jacob Roorda 100.0% 0.0%
Tracy Stephens 100.0% 0.0%
—————————————————————————-

/T/

About Epsilon

Epsilon Energy Ltd. is a North American onshore exploration and production
company with a current focus on the Marcellus Shale of Pennsylvania.

Special note for news distribution in the United States

The securities described in the news release have not been registered under the
United Stated Securities Act of 1933, as amended, (the “1933 Act”) or state
securities laws. Any holder of these securities, by purchasing such securities,
agrees for the benefit of Epsilon Energy Ltd. (the “Corporation”) that such
securities may not be offered, sold, or otherwise transferred only (A) to the
Corporation or its affiliates; (B) outside the United States in accordance with
applicable state laws and either (1) Rule 144(as) under the 1933 Act or (2)
Rule 144 under the 1933 Act, if applicable.

– END RELEASE – 24/05/2017

For further information:
Epsilon Energy Ltd.
Michael Raleigh
Chief Executive Officer
281-670-0002
[email protected]

COMPANY:
FOR: EPSILON ENERGY LTD.
TSX SYMBOL: EPS

INDUSTRY: Energy and Utilities – Oil and Gas
RELEASE ID: 20170524CC0059

Press Release from Marketwired 1-866-736-3779

All press releases are written by the client and have NO affiliation with the news copy written by The Canadian Press. Any questions that arise due to the content or information provided in the press release should be directed to the company/organization
issuing the release, not to The Canadian Press.

GET ENERGYNOW’S DAILY EMAIL FOR FREE


OPEC likely to extend output cuts into next year

VIENNA — The OPEC oil cartel and other producers, notably Russia, are this week expected to extend last year’s production cut in a concerted attempt to prevent oil prices from falling.

With prices likely to fall because of an oversupply in the market if they don’t, both Russia, and OPEC oil giant Saudi Arabia have spoken out in favour of an extension ahead of Thursday’s meeting.

Last November, in a groundbreaking move to push prices higher, the 13-country Organization of the Petroleum Exporting Countries agreed to cut production by 1.2 million barrels a day, while non-OPEC countries chipped in a with a further 600,000 reduction. That deal, which has helped shore up oil prices, is due to expire at the end of June.

Saudi Energy Minister Khalid al-Falih noted a “trend” among participants to prolong the cuts for nine months, while OPEC Secretary General Mohammad Barkindo said there is “growing consensus” for an extension. Non-OPEC countries will attend the meeting, including Russia’s Energy Minister Alexander Novak.

There’s even speculation that there may even be an agreement for deeper cuts.

In the longer term, there are concerns among OPEC countries that higher oil prices may end up being counterproductive as they encourage U.S. shale gas producers to re-enter the market — a development that could weigh on oil prices.

Despite last year’s production cuts, oil prices have risen by less than OPEC hoped for. At around $50 a barrel, benchmark crude is up from the sub-$30 levels reached in early 2016. Still, prices are around half the levels reached in 2014. Financial information firm IHS Markit sees OPEC revenues showing a modest gain this year after dropping from their peak of $1.2 trillion in 2012. The total, it said “will be less than half the level of 2012, when prices were more than double current levels.”

U.S. output since last year’s cut has increased by nearly a million barrels a day to a daily 9 million barrels. That already puts American production up there with Saudi Arabia and Russia and cuts further into OPEC’s past ability to play a role in setting prices and supplies

More than 400 oil rigs are now working U.S. shale fields — an increase of more than 120 per cent compared to a year ago. And U.S. producers are poised to expand more.

Additional psychological pressure on OPEC is coming from U.S. President Donald Trump. As part of his proposed budget, he called Tuesday for the sale of half of the country’s strategic oil reserves, which stands at 688 million barrels.

It is unclear if Congress will approve the initiative. Even if it does, the drawdown would extend over 10 years. Still, for OPEC, the timing of the proposal was unfavourable, coming just two days before the ministers meet.

George Jahn, The Associated Press


GET ENERGYNOW’S DAILY EMAIL FOR FREE


WATCH: Liberal Recommendation to Re-locate National Energy Board is Political Dynamite: Rex Murphy

According to Rex Murphy, the Liberal government’s recommendation to move the National Energy Board from Alberta to Ottawa and replace it with two new agencies is political dynamite.  Watch his commentary HERE:

GET ENERGYNOW’S DAILY EMAIL FOR FREE


Denmark’s Dong Energy sells its oil, gas business to INEOS

COPENHAGEN — Denmark’s Dong Energy has reached an agreement to divest its oil and gas business to privately held chemicals group INEOS, saying it has reached its goal announced in November of transforming itself “into a leading, pure play renewables company.”

Copenhagen-based Dong Energy says the deal means “an unconditional payment” of $1.05 billion on a cash and debt-free basis.

Dong Energy said Wednesday the deal also includes contingent payments of $150 million related to a western Denmark plant and up to $100 million subject to the development of an oil and gas field off Shetland.

The deal is subject to regulatory approvals.

The Danish government has a 50.1-per cent share in Dong Energy.

The Associated Press

GET ENERGYNOW’S DAILY EMAIL FOR FREE


Iran, Spanish company sign $615 million deal for oil pipes

TEHRAN, Iran — Iran on Wednesday signed a deal worth $615 million — or euros 550 million — with a Spanish-Iranian consortium under which the group will provide pipes used in Iran’s oil industry.

It was the first major deal for Iran’s oil industry since President Hassan Rouhani’s re-election last week to another term in office on a platform of reform and greater openness to the international community. The consortium, which includes Spain’s Tubacex S.A. and Iran’s Foolad Isfahan Company, will produce pipes made of a corrosion resistant alloy for a network of 600 kilometres, or about 370 miles, over three years.

The statement said the pipes will be produced using Japan’s JFE Steel Corporation technology, and that the know-how will eventually be given to the Iranians.

At a ceremony marking the signing, Iran’s Oil Minister Bijan Zanganeh said he was “delighted that a deal worth more than 550 million euros is being signed.”

“The Iranian manufacturer is happier than us and perhaps our foreign partner is the happiest party of all today, to have secured itself a long-term market” in Iran, Zanganeh added.

The minister said that during the years of punitive sanctions over Iran’s nuclear program, the industry faced a severe shortage of pipes and were the sanctions still in place, “we would be unable to produce them now.”

“I think it is the biggest tender we have had in this industry for a lot of years,” said Antonio Rafael, deputy CEO of Tubacex. “It is very professionally managed.”

Iran has been trying to renovate its oil industry since the 2015 landmark nuclear deal with world powers. The country exports 2 million barrels of oil per day, which compromises more than 30 per cent of the country’s annual budget.

The Associated Press

GET ENERGYNOW’S DAILY EMAIL FOR FREE


Sexual Harassment in the Workplace: What Employers Need to Know & Do! – Wendy Ferguson – BHRLR, CPHR

          A Commentary by Wendy Ferguson – BHRLR, CPHR – Ferguson HR Consulting This week I want to discuss a perpetual cultural and workplace issue – sexual harassment.  If I could label myself an advocate in just one area in the realm of HR, it would be here.  Sexual harassment can … Read more

GET ENERGYNOW’S DAILY EMAIL FOR FREE


Alectra awarded for Customer Information System implementation

FOR: ALECTRA INC.

Date issue: May 24, 2017
Time in: 12:00 PM e

Attention:

“CS Week” organization recognizes utility’s excellence in CIS
implementation

VAUGHAN, ON –(Marketwired – May 24, 2017) – Alectra Utilities was recognized
Wednesday by CS Week for the best implementation of a customer information
system (CIS) by one of its legacy utilities.

Alectra Utilities, recently created following the merger of four Ontario
electricity distribution companies, was presented with the CS Week 2017
Expanding Excellence Award, which honors outstanding contributions and
innovation in utility customer service in four award categories, including
best CIS implementation for a large utility.

Alectra’s legacy utility, PowerStream, in May 2015 replaced its over
30-year-old customer information system with Oracle Customer Care and Billing
(CC&B) in an effort to better serve customers residing or operating a business
in York Region and Simcoe County.

The implementation of the CC&B system was a major project for Alectra’s legacy
utility, which involved integration with over 22 interfaces to support the
company’s business operations. The three year project was staffed with 42 full
time project employees in addition to the on-going support of the operational
organization.

Using lessons learned, Alectra has now begun the consolidation of its four
legacy CIS systems onto a common CC&B platform across its broader service
territory. A new dedicated project team has been established to achieve this
goal.

“The team demonstrated a proactive approach to project management in our
initial conversion to CC&B and it will be this strength that we expect will
contribute to our success going forward,” said Eileen Campbell, VP, Customer
Service for Alectra with project co-leads Linas Medelis, Director, Customer
Service Excellence and William Schmidt, VP, Information Technology. “We share
this honour with our vendors as well as our dedicated staff who remain
customer-focused in everything that they do.”

All North American utility companies including gas, electric, water,
wastewater, sanitation and retail electric/gas were eligible to participate in
the Expanding Excellence Awards program. Nominated projects were evaluated
based upon budget adherence, schedule adherence, operational efficiency after
go-live, innovation, and improved service levels.

About Alectra’s Family of Companies

Alectra’s family of energy companies distributes electricity to nearly one
million customers in Ontario’s Greater Golden Horseshoe Area and provides
innovative energy solutions to these and thousands more across Ontario. The
Alectra family of companies includes Alectra Inc. (Mississauga), Alectra
Utilities Corporation (Hamilton) and Alectra Energy Solutions (Vaughan).

Image Available: http://www.marketwire.com/library/MwGo/2017/5/24/11G139592/Images/alec05242-092587f136a594c5a12ff06054b7f0d0.jpg

– END RELEASE – 24/05/2017

For further information:

Media Contact
Eric Fagen
Email – [email protected]
Media Phone Line – 1-844-372-4400

COMPANY:
FOR: ALECTRA INC.

INDUSTRY: Energy and Utilities – Pipelines, Energy and Utilities – Utilities
RELEASE ID: 20170524CC006

Press Release from Marketwired 1-866-736-3779

All press releases are written by the client and have NO affiliation with the news copy written by The Canadian Press. Any questions that arise due to the content or information provided in the press release should be directed to the company/organization
issuing the release, not to The Canadian Press.

GET ENERGYNOW’S DAILY EMAIL FOR FREE


East West Announces Success at the Cheal-E8 Exploration Well

FOR: EAST WEST PETROLEUM CORP.
TSX VENTURE SYMBOL: EW

Date issue: May 24, 2017
Time in: 9:00 AM e

Attention:

VANCOUVER, BRITISH COLUMBIA–(Marketwired – May 24, 2017) – East West Petroleum
Corp. (TSX VENTURE:EW) (“East West” or the “Company”) – Mr. Dylan Sidoo,
Director, is pleased to announce the successful drilling and flow testing of
the Cheal-E8 exploration well, which will now be tied-in to existing
infrastructure as a permanent producer. The Company has a 30% interest in this
well.

The Company’s joint venture partner and operator, TAG Oil Ltd. (“TAO”) drilled
Cheal-E8 on the Cheal East permit (PEP 54877) in the Taranaki Basin of New
Zealand. The well was drilled and completed on time and on budget to a total
measured depth of over 2,000 meters. The primary objective of Cheal-E8 was to
test the potential of the Urenui formation, with the deeper Mt. Messenger
formation as the secondary objective. Net pay of approximately 17 meters of
Urenui sands and 4 meters of Mt. Messenger sands was recorded.

Following the completion of the Urenui zone, Cheal-E8 naturally free flowed oil
and gas on choke at an average rate of 318 boe/d over a four and a half day
test. No water production was observed during the test.

The Mt. Messenger formation is also estimated to be commercial, and will be
completed in the future.

The Company’s next well will be Cheal-D1, which will also be drilled on the
Cheal East permit and is scheduled for drilling in July 2017. Construction of
the Cheal-D1 well pad is currently underway and is proceeding on schedule. The
Cheal-D1 pad is located near, and will be used to explore, the northern portion
of the Cheal E permit.

In Romania, completion and testing work is ongoing on the first well in the Ex7
Periam block. The Company will provide an update once the operator completes
the scheduled work.

David Sidoo, CEO, commented, “I am pleased with the results of the E8 well in
New Zealand and look forward to providing further updates on the work program
in Romania. The ongoing work augers well for building our resource base and
augmenting our cash flow.”

About East West Petroleum Corp.

East West Petroleum Corp. (www.eastwestpetroleum.ca) is a TSX Venture Exchange
listed company established in 2010 to invest in international oil & gas
opportunities. East West has built a diverse portfolio of attractive
exploration assets covering a gross area of over one million acres. The Company
has its primary focus on two key areas: New Zealand, where it has established
production and cash flow and is evaluating a low risk exploration play, and
Romania where it is fully carried on a seismic surveying and 12 well
exploration program. In New Zealand, East West holds an interest in three
exploration permits near to existing commercial production in the Taranaki
Basin, operated by TAG Oil Ltd. The Company also has interests in four
exploration concessions covering 1,000,000 acres in the prolific Pannonian
Basin of western Romania with Naftna Industrija Srbije (“NIS”).

Forward-looking information is subject to known and unknown risks,
uncertainties and other factors that may cause the Company’s actual results,
level of activity, performance or achievements to be materially different from
those expressed or implied by such forward-looking information. Such factors
include, but are not limited to: the ability to raise sufficient capital to
fund exploration and development; the quantity of and future net revenues from
the Company’s reserves; oil and natural gas production levels; commodity
prices, foreign currency exchange rates and interest rates; capital expenditure
programs and other expenditures; supply and demand for oil and natural gas;
schedules and timing of certain projects and the Company’s strategy for growth;
competitive conditions; the Company’s future operating and financial results;
and treatment under governmental and other regulatory regimes and tax,
environmental and other laws.

Prospective Resources are those quantities of petroleum estimated, as of a
given date, to be potentially recoverable from undiscovered accumulations by
application of future development projects. Prospective resources have both an
associated chance of discovery and a chance of development. Prospective
Resources are further subdivided in accordance with the level of certainty
associated with recoverable estimates assuming their discovery and development
and may be subclassified based on project maturity. Best estimate resources are
considered to be the best estimate of the quantity that will actually be
recovered from the accumulation. If probabilistic methods are used, this term
is a measure of central tendency of the uncertainty distribution (most
likely/mode, P50/median, or arithmetic average/mean). As estimates, there is no
certainty that any portion of the resources will be discovered. If discovered,
there is no certainty that it will be commercially viable to produce any
portion of the resources that the estimated reserves or resources will be
recovered or produced.

BOEs may be misleading, particularly if used in isolation. A BOE conversion
ratio of 6 mcf: 1bbl is based on an energy equivalency conversion method
primarily applicable at the burner tip and does not represent a value
equivalency at the wellhead.

This list is not exhaustive of the factors that may affect our forward-looking
information. These and other factors should be considered carefully and readers
should not place undue reliance on such forward-looking information. The
Company disclaims any intention or obligation to update or revise
forward-looking information, whether as a result of new information, future
events or otherwise.

Neither the TSX Venture Exchange nor its Regulation Services Provider (as that
term is defined in the policies of the TSX Venture Exchange) accepts
responsibility for the adequacy or accuracy of this release.

– END RELEASE – 24/05/2017

For further information:
East West Petroleum Corp.
Max Sali
Corporate Development
+1 604 682 1558
+1 604 683 1585 (FAX)
[email protected]

COMPANY:
FOR: EAST WEST PETROLEUM CORP.
TSX VENTURE SYMBOL: EW

INDUSTRY: Energy and Utilities – Oil and Gas
RELEASE ID: 20170524CC0025

Press Release from Marketwired 1-866-736-3779

All press releases are written by the client and have NO affiliation with the news copy written by The Canadian Press. Any questions that arise due to the content or information provided in the press release should be directed to the company/organization
issuing the release, not to The Canadian Press.

GET ENERGYNOW’S DAILY EMAIL FOR FREE


Point Loma Resources Announces Investment Agreement with Evenergy Company Limited for proceeds of $4,020,000

FOR: POINT LOMA RESOURCES LTDTSX VENTURE Symbol: PLXDate issue: May 24, 2017Time in: 8:00 AM eAttention:
CALGARY, AB –(Marketwired – May 24, 2017) – Point Loma Resources Ltd. (TSX
VENTURE: PLX) (the “Corporation” or “Point Loma”) is pleased to annou…

GET ENERGYNOW’S DAILY EMAIL FOR FREE


BeWhere Holdings Inc. Reports 1st Quarter Financial Results and Provides 2017 update

FOR: BEWHERE HOLDINGS INC.TSX VENTURE SYMBOL: BEWOTCQB SYMBOL: BEWFFDate issue: May 24, 2017Time in: 7:30 AM eAttention:
TORONTO, ONTARIO–(Marketwired – May 24, 2017) – BeWhere Holdings Inc. (TSX
VENTURE:BEW)(OTCQB:BEWFF) (“BeWhere” or the “Company”)…

GET ENERGYNOW’S DAILY EMAIL FOR FREE


Manitok Energy Inc. Announces Amended Terms for the Lease Issuance and Drilling Commitment Agreement

FOR: MANITOK ENERGY INC.
TSX VENTURE SYMBOL: MEI

Date issue: May 24, 2017
Time in: 7:30 AM e

Attention:

CALGARY, ALBERTA–(Marketwired – May 24, 2017) –

THIS PRESS RELEASE IS NOT FOR PUBLICATION OR DISSEMINATION IN THE UNITED
STATES. FAILURE TO COMPLY WITH THIS RESTRICTION MAY CONSTITUTE A VIOLATION OF
UNITED STATES SECURITIES LAW.

Manitok Energy Inc. (the “Corporation” or “Manitok”) (TSX VENTURE:MEI) is
pleased to announce amended terms of its Lease Issuance and Drilling Commitment
Agreement (the “Agreement”) with an Alberta based royalty company (the
“Company”). Summary of the key terms of the revised Agreement are as follows:

In the amended Agreement, Manitok has agreed to:

/T/

— the early surrender of approximately 148,000 acres of undeveloped leased

lands located mostly in the northern end of the Entice block in
Manitok’s Beiseker and Strathmore areas and the payment of cash
consideration of approximately $1,998,520, with $350,000 having been
paid immediately on the execution of Agreement and the remainder to be
paid by Manitok following the completion of its previously announced
plan of arrangement with Craft Oil Ltd. which is anticipated to be
closed on or about June 6, 2017 (the “Arrangement”);
— assign its existing gross overriding royalty (“GORR”) on Section 28-41-
07 W5M at Willesden Green, Alberta, grant a 4% GORR on its working
interests on developed and undeveloped lands at Willesden Green, Alberta
and grant a 4% GORR on its working interest on undeveloped lands at
Stolberg, Alberta, and related tax pools; and
— convey its proprietary interest in various 2D and 3D seismic data sets
and related tax pools while obtaining a concurrent 15 year seismic data
licence to such 2D and 3D seismic data.

/T/

In the amended Agreement, the Company has agreed to:

/T/

— adjust the remaining drilling and completion expenditure commitment from

$56.0 million to $24.0 million, with $8 million required by December 31,
2017 and the remainder by August 31, 2018;
— conditional upon closing of the Arrangement, extend the primary term on
1,554 hectares (3,885 acres) of undeveloped land at Wayne, Alberta that
were previously due to expire on June 15, 2017; the renewed primary term
will extend these leases for an additional three (3) years; and
— adjust the Agreement terms to provide Manitok with the option to extend
the primary term associated with all undeveloped leased lands within the
Agreement (expiring on April 30, 2018) for an additional thirty-two (32)
months to December 31, 2020 at $600/hectare with no capital commitment
in the future, versus the previous $400/hectare plus future capital
commitment.

/T/

The land under the Agreement held by Manitok has become its core area of
operation. The Corporation has taken the production in the Entice area from
zero to a peak of approximately 3,200 boe/d in December 2016, during the early
development phase of its operations. Currently Manitok has identified a
development drilling inventory of approximately 56 Lithic Glauconitic oil
horizontal locations and approximately 46 Basal Quartz oil horizontal locations
on the Carseland and Wayne area lands continued to be held under the Agreement
in this area. The amended terms of the Agreement will enable the Corporation to
continue to develop this prolific core area in a financially stable manner.

About Manitok

Manitok is a public oil and gas exploration and development company focused on
Lithic Glauconitic light oil in southeast Alberta and Cardium light oil in west
central Alberta. The Corporation utilizes its expertise, combined with the
latest recovery techniques, to develop the remaining oil and liquids-rich
natural gas pools in its core areas of the Western Canadian Sedimentary Basin.

For further information on Manitok view Manitok’s website at
www.manitokenergy.com.

Barrels of Oil Equivalent

The term barrels of oil equivalent (“boe”) may be misleading, particularly if
used in isolation. Per boe amounts have been calculated using a conversion
ratio of six thousand cubic feet (6 mcf) of natural gas to one barrel (1 bbl)
of crude oil. The boe conversion ratio of 6 mcf to 1 bbl is based on an energy
equivalency conversion method primarily applicable at the burner tip and does
not represent a value equivalency at the wellhead. Given that the value ratio
based on the current price of crude oil as compared to natural gas is
significantly different from the energy equivalency of 6:1, utilizing a
conversion on a 6:1 basis may be misleading as an indication of value.

Forward-looking Information Cautionary Statement

This press release contains forward-looking statements. More particularly, this
press release contains statements concerning the timing and completion of the
Arrangement, management estimated development drilling inventory and the
potential outcome of the amended terms of the Agreement to Manitok’s future
operations.

The forward-looking statements in this press release are based on certain key
expectations and assumptions made by Manitok, including expectations and
assumptions concerning the prevailing market conditions, the intentions of its
lenders, commodity prices, and the availability of capital.

Although Manitok believe that the expectations and assumptions on which the
forward-looking statements are based are reasonable, undue reliance should not
be placed on the forward-looking statements because Manitok can give no
assurance that they will prove to be correct. Since forward-looking statements
address future events and conditions, by their very nature they involve
inherent risks and uncertainties. Actual results could differ materially from
those currently anticipated due to a number of factors and risks. These
include, but are not limited to, risks associated with adverse market
conditions, the inability of Manitok to complete the Arrangement at all or on
the terms announced, not obtaining the required court, shareholder and
regulatory approvals for the Arrangement, a lender not approving the amendment
to a credit facility and the risks associated with the oil and gas industry in
general (e.g., operational risks in development, exploration and production;
delays or changes in plans with respect to exploration or development projects
or capital expenditures; the uncertainty of reserves estimates; the uncertainty
of estimates and projections relating to production, costs and expenses; and
health, safety and environmental risks), uncertainty as to the availability of
labour and services, commodity price and exchange rate fluctuations, unexpected
adverse weather conditions, general business, economic, competitive, political
and social uncertainties, capital market conditions and market prices for
securities and changes to existing laws and regulations. More information about
certain of these risks are set out in the documents filed from time to time
with the Canadian securities regulatory authorities, available on Manitok’s
SEDAR profiles at www.sedar.com.

Forward-looking statements are based on estimates and opinions of management of
Manitok at the time the statements are presented. Manitok may, as considered
necessary in the circumstances, update or revise such forward-looking
statements, whether as a result of new information, future events or otherwise,
but Manitok undertake no obligation to update or revise any forward-looking
statements, except as required by applicable securities laws.

Neither the TSX Venture Exchange nor its Regulation Services Provider (as that
term is defined in the policies of the TSX Venture Exchange) accepts
responsibility for the adequacy or accuracy of this release.

– END RELEASE – 24/05/2017

For further information:
Manitok Energy Inc.
Massimo M. Geremia
President & Chief Executive Officer
403-984-1751
[email protected]
www.manitokenergy.com

COMPANY:
FOR: MANITOK ENERGY INC.
TSX VENTURE SYMBOL: MEI

INDUSTRY: Energy and Utilities – Oil and Gas
RELEASE ID: 20170524CC0014

Press Release from Marketwired 1-866-736-3779

All press releases are written by the client and have NO affiliation with the news copy written by The Canadian Press. Any questions that arise due to the content or information provided in the press release should be directed to the company/organization
issuing the release, not to The Canadian Press.

GET ENERGYNOW’S DAILY EMAIL FOR FREE


Weekly Canadian Oil & Gas Industry Highlights – May 23, 2017

May 15, 2017 Presented by POIM Consulting Group Major /Interesting Projects SURGE ENERGY INC. building 4 Oil satellite – multiwall Batteries GRANDE PRAIRIE VALHALLa 04-19-074-08W6 Tourmaline Oil Corp Large Gas battery – multiwell DRAYTON VALLEY_SUNDANCE_14-22-054-23W5 Penn West Exploration 3 new compressor projects Canadian Natural Resources Limited Large Oil Satellite – multiwell GRANDE PRAIRIE WEMBLEY 03-11-073-09W6 … Read more

GET ENERGYNOW’S DAILY EMAIL FOR FREE


Shale Is Just a Scapegoat for Weaker Oil Prices: Jason Schenker

May 23, 2017 (Bloomberg Prophets)  When the Organization of the Petroleum Exporting Countries gathers in Vienna this week, members and non-OPEC oil producers are likely to extend the production cuts put in place in November as a way to shore up prices, which have been choppy this month. Whatever the final details look like, a … Read more

GET ENERGYNOW’S DAILY EMAIL FOR FREE


Serinus Energy Inc.: Sabria Field in Tunisia Temporarily Shut-in

FOR: SERINUS ENERGY INC.TSX SYMBOL: SENWARSAW SYMBOL: SENDate issue: May 22, 2017Time in: 1:00 PM eAttention:
CALGARY, ALBERTA–(Marketwired – May 22, 2017) – Serinus Energy Inc.
(“Serinus”, “SEN” or the “Company”) (TSX:SEN)(WARSAW:SEN) announces that…

GET ENERGYNOW’S DAILY EMAIL FOR FREE


Shale Production in North America: A Grooved Perspective – NextShale 2017

Produced water transportation and disposal costs pose the biggest challenge to shale producers’ financial bottom line. According to IHS-Markit, produced water management can represent half of a shale well’s operating expenses and these costs will rise as focus shifts to growth. To put a lid on these inflating costs, shale producers are building their own … Read more

GET ENERGYNOW’S DAILY EMAIL FOR FREE


Global Petroleum Show (DMG Energy Events) Annouces Digital Marketing Partnership with EnergyNow.ca

Digital Marketing Partnership     The Global Petroleum Show (DMG Energy Events) https://globalpetroleumshow.com is pleased to announce that they have entered into an exclusive partnership with Enerpoint iMedia Corp. (EnergyNow.ca (http://www.energynow.ca) & EnergyNow SHOWCASE Digital Directory (http://www.showcasedirectory.energy/) as their Digital Marketing Partner for the Global Petroleum Show 2017 through 2019. This partnership will also extend to other DMG energy events as well. As the Global Petroleum Show’s … Read more

GET ENERGYNOW’S DAILY EMAIL FOR FREE


Sunshine Oilsands Ltd.: Notice of Annual Meeting of Shareholders

FOR: SUNSHINE OILSANDS LTD.HKSE SYMBOL: 2012Date issue: May 22, 2017Time in: 6:03 AM eAttention:
To Be Held at 9:00 A.M. on June 27, 2017 (Hong Kong Time) and 7:00 P.M. on June
26, 2017 (Calgary Time)
HONG KONG, CHINA and CALGARY, ALBERTA–(Marketwir…

GET ENERGYNOW’S DAILY EMAIL FOR FREE


Sunshine Oilsands Ltd.: Notice of Special Meeting of Shareholders

FOR: SUNSHINE OILSANDS LTD.HKSE SYMBOL: 2012Date issue: May 22, 2017Time in: 5:43 AM eAttention:
HONG KONG, CHINA and CALGARY, ALBERTA–(Marketwired – May 22, 2017) – Notice is
Hereby Given that the special meeting (the “Special Meeting”) of the holde…

GET ENERGYNOW’S DAILY EMAIL FOR FREE


Africa Oil Provides Update on Maersk Farmout Transaction

FOR: AFRICA OIL CORP.TSX SYMBOL: AOIOMX SYMBOL: AOIDate issue: May 22, 2017Time in: 2:00 AM eAttention:
VANCOUVER, BRITISH COLUMBIA–(Marketwired – May 22, 2017) – Africa Oil Corp.
(“Africa Oil”, “AOC” or the “Company”) (TSX:AOI)(OMX:AOI) is pleased t…

GET ENERGYNOW’S DAILY EMAIL FOR FREE


Trans Mountain IPO comes at awkward time for energy giant Kinder Morgan

CALGARY — Kinder Morgan’s plan to raise money for its Trans Mountain expansion through an initial public offering could not come at a more awkward time.

In addition to ongoing protests and federal court challenges, a vote recount in B.C. could tilt the balance of power, giving the Greens or NDP a chance to bog down the $7.4-billion project. The recount begins Monday.

Alberta’s securities regulator is also reviewing Kinder Morgan’s regulatory filings upon a request from Greenpeace, who said it believes the documents overestimate growth in Asian oil demand and don’t go far enough in disclosing climate change-related risks.

The energy giant faces a big hurdle in its goal of raising $1.75 billion in what would be one of the biggest IPOs ever on the Toronto Stock Exchange. It is expecting to complete the offering in the last week of this month.

Goldman Sachs analyst Theodore Durbin said in a note the IPO move was a “surprise,” since Kinder Morgan management had previously said a joint venture would be preferred.

Adam Scott, a senior campaigner with environmental group Oil Change International, said he took it as a sign that the company was struggling to raise funds when it scrapped plans for a joint venture.

“There’s still substantial legal risk to the project,” said Scott. “There’s also reputational risk. I think that may be why there’s no equity firms willing to step up and take a chunk.”

Kinder Morgan didn’t respond to a request for comment on financing issues, but said it was moving ahead with all aspects of planning for the project. In filings it said the IPO was the “superior path” over the joint venture.

Terry Marshall, senior vice-president of corporate finance at Moody’s Investors Services, said there are advantages for Kinder Morgan with the IPO, including maintaining greater control of the project and the profits that would come from it, as well as likely securing a better valuation.

“It’s economically a very attractive project,” said Marshall. “It’s just getting it built in this environment is challenging.”

Opponents have also expanded their campaign against Trans Mountain, shifting their sights to the financial institutions backing it.

The Treaty Alliance Against Tar Sands Expansion launched a divestment campaign earlier this month against 17 banks that fund oilsands pipelines. Those banks include CIBC, BMO, Scotiabank, TD Bank and RBC.

“I don’t think it scares people away,” said Marshall. “It’s unfortunate, the banks are well aware of it, but I don’t think those protests, in and of themselves, would prevent the financing from being provided.”

Still, Jeffrey Harris, founder of venture capital firm Global Reserve Group, said the potential project risks could change the financial picture for some investors.

“They change their expected rate of return, and because of that, some projects that may have gotten funding may not get funding because people see it as a little more risky,” said Harris.

“I don’t know anybody who says, ‘Oh my God, Canada, don’t go there.’ It’s not that by any means,” he added. “It’s the change in the economics that will attract capital or not.”

Robert Johnston, chief executive of political risk consultancy Eurasia Group, said he sees campaigns targeting the financing of Trans Mountain as more of a nuisance than a serious threat.

“If the case against Kinder Morgan is that there’s no market in Asia, I think that case would be pretty easy to disprove,” he said.

But issues relating to climate change are taking on greater importance at the financial level, Johnston said.

“Carbon disclosure is well beyond a hassle. It’s a material risk,” he said. “It’s something companies have to factor into their cost base and be transparent about.”

Adnan Amin, director-general of the International Renewable Energy Agency, said the risk of fossil fuel infrastructure becoming stranded assets is increasing with the rapid expansion of renewable energy projects.

“Investing in very heavy, long-term expensive infrastructure for the future needs to be reassessed very thoroughly,” said Amin. 

Kinder Morgan still has yet to render a final investment decision on the project, which would triple the capacity of an existing pipeline from Edmonton to Burnaby, B.C. But it has said it is aiming to start construction in September.

Ian Bickis, The Canadian Press


GET ENERGYNOW’S DAILY EMAIL FOR FREE


Sunshine Oilsands Ltd.: Voluntary Announcement- Increase in Shareholding in the Company by Non-Executive Vice Chairman

FOR: SUNSHINE OILSANDS LTD.HKSE SYMBOL: 2012Date issue: May 21, 2017Time in: 8:19 AM eAttention:
HONG KONG, CHINA and CALGARY, ALBERTA–(Marketwired – May 21, 2017) – The Board
of Directors of Sunshine Oilsands Ltd. (a corporation incorporated under t…

GET ENERGYNOW’S DAILY EMAIL FOR FREE


Trudeau says he’ll work with provinces on Trans Mountain pipeline expansion

SURREY, B.C. — Prime Minister Justin Trudeau says he’ll work with British Columbia and Alberta to move ahead with his government’s agenda of creating jobs while transitioning toward a lower-carbon economy.

Trudeau was asked on Friday about the possibility that B.C. could wind up with a government that opposes the Trans Mountain pipeline expansion. He suggested that the province’s NDP and Greens, who oppose the project, are “wrong” in their position.

“Canadians understand that we need to both protect the environment and build a better economy at the same time. Anyone proposing a false choice around that is wrong,” he said at an event in Surrey.

The final count from the recent provincial election, including absentee ballots, will be completed next week and the Greens are poised to hold the balance of power if a minority government is confirmed.

After general and advance votes were tallied May 9, the pro-pipeline Liberals held 43 seats, short of the 44 needed for a majority, while the NDP won 41 seats and the Greens took three. But there are a handful of ridings that were decided by fewer than 300 votes and there are 176,000 absentee ballots still to be counted.

NDP Leader John Horgan has vowed to use “every tool in the toolbox” to stop the Trans Mountain expansion, but he hasn’t been specific about what those tools are.

Alberta Premier Rachel Notley has said that no province has the power to stop Kinder Morgan Canada’s expansion of the pipeline that runs from the Edmonton area to Burnaby and which her government staunchly supports.  

Trudeau did not directly answer a question about whether her statement was true, but he said he has a very positive relationship with the provinces and will work constructively with them.

The federal government approved the $7.4-billion expansion late last year, shortly after announcing a $1.5-billion ocean protection plan.

Alberta has obtained intervener status in court challenges of the project filed by municipalities and First Nations in southwest B.C.

Political scientist Richard Johnston of the University of British Columbia has said interprovincial pipelines fall under federal jurisdiction, so there is little that B.C. could do to stop the project.

Trudeau was at a Surrey recreation centre to promote his government’s Canada Child Benefit. He met with parents and played with a large rainbow parachute with a group of rambunctious children.

He then met with people at a Filipino restaurant in Surrey before visiting Abbotsford’s Gur Sikh Temple along with Defence Minister Harjit Sajjan.

The temple, founded in 1912, is the oldest Sikh place of worship in North America, Trudeau said after speaking a few words in Punjabi.

The prime minister told a large crowd gathered outside the temple that Canadians need to remember the 1914 Komagata Maru incident in order to avoid past mistakes. The ship carrying 376 people from Punjab was not allowed to dock in Vancouver’s harbour.

“They caught a glimpse of the Canadian dream and we turned them away,” he said. “Save for a few, the passengers were forced to turn around and go back to India. The consequences that awaited them there were tragic.”

Trudeau apologized for the incident in the House of Commons last year.

— Follow @ellekane on Twitter.

Laura Kane, The Canadian Press

GET ENERGYNOW’S DAILY EMAIL FOR FREE


Jura Announces Director Resignation

FOR: JURA ENERGY CORPORATIONTSX VENTURE SYMBOL: JECDate issue: May 19, 2017Time in: 6:29 PM eAttention:
CALGARY, ALBERTA–(Marketwired – May 19, 2017) – Jura Energy Corporation (TSX
VENTURE:JEC) (“Jura”) today announced that Shahzad Ashfaq, director o…

GET ENERGYNOW’S DAILY EMAIL FOR FREE


Total Energy Services Inc. and Savanna Energy Services Corp. Announce Proposed Amalgamation of Savanna and 2043324 Alberta Ltd.

FOR: TOTAL ENERGY SERVICES INC.TSX SYMBOL: TOTAND SAVANNA ENERGY SERVICES CORP.TSX SYMBOL: SVYDate issue: May 19, 2017Time in: 5:03 PM eAttention:
CALGARY, ALBERTA–(Marketwired – May 19, 2017) – Savanna Energy Services Corp.
(“Savanna”) (TSX:SVY) and…

GET ENERGYNOW’S DAILY EMAIL FOR FREE


LOGiQ Asset Management Ltd. Declares Distributions

FOR: LOGIQ ASSET MANAGEMENT INC.
TSX SYMBOL: LGQ

Date issue: May 19, 2017
Time in: 5:00 PM e

Attention:

TORONTO, ONTARIO–(Marketwired – May 19, 2017) – LOGiQ Asset Management Ltd.
(the “Manager”) (TSX:LGQ) announces monthly distributions with record date of
May 31, 2017 for each of the following funds:

/T/

—————————————————————————-

Distribution Distribution
Amount per Amount Current
Fund Name TSX Ticker Unit Annualized Price(i) Yield(i)
—————————————————————————-
LOGiQ Advantage
Bond Fund (Class A
& F) MBB.UN $0.05833 $0.70 $8.81 7.95%
—————————————————————————-
LOGiQ Advantage Oil
& Gas Income Fund AOG.UN $0.01125 $0.135 $2.76 4.89%
—————————————————————————-
LOGiQ Advantage VIP
Income Fund AV.UN $0.035 $0.42 $10.57 3.97%
—————————————————————————-
LOGiQ VIP Income
Fund VIP.UN $0.035 $0.42 $9.65 4.35%
—————————————————————————-
Low Volatility
Canadian Equities
Income Fund LOW.UN $0.05 $0.60 $9.70 6.19%
—————————————————————————-
Voya Diversified
Floating Rate
Senior Loan Fund
(Class A) IFL.UN $0.05 $0.60 $8.09 7.42%
—————————————————————————-
Voya Diversified
Floating Rate
Senior Loan Fund
(Class U) Not Listed U.S.$0.05 U.S.$0.60 U.S. $8.40 7.14%
—————————————————————————-
Voya Floating Rate
Senior Loan Fund
(Class A) ISL.UN $0.0417 $0.50 $9.21 5.43%
—————————————————————————-
Voya Floating Rate
Senior Loan Fund
(Class U) ISL.U U.S.$0.0417 U.S.$0.50 U.S. $8.24 6.07%
—————————————————————————-
Voya High Income
Floating Rate Fund
(Class A) IHL.UN $0.05417 $0.65 $7.90 8.23%
—————————————————————————-
Voya High Income
Floating Rate Fund
(Class U) Not Listed U.S.$0.05417 U.S.$0.65 U.S. $8.22 7.91%
—————————————————————————-
(i)TSX price as at May 18, 2017. Prices and yields shown are for Class A
units only unless specified otherwise.

/T/

Record dates and payment dates are as follows:

/T/

Record Date Payment Date
May 31, 2017 June 14, 2017

/T/

For further information, please contact your financial advisor, call LOGiQ’s
Sales and Marketing support line at 416-583-2300 (toll-free at 1-800-513-3868),
or visit our website at www.logiqasset.com.

The Manager is a wholly-owned subsidiary of LOGiQ Asset Management Inc.
(TSX:LGQ). LOGiQ Asset Management Inc. is a diversified asset management
company with a suite of retail mutual funds, closed end funds, hedge funds and
segregated institutional funds. LOGiQ Asset Management is headquartered in
Toronto.

– END RELEASE – 19/05/2017

For further information:
LOGiQ’s Sales and Marketing support line
416-583-2300 (toll-free at 1-800-513-3868)
www.logiqasset.com

COMPANY:
FOR: LOGIQ ASSET MANAGEMENT INC.
TSX SYMBOL: LGQ

INDUSTRY: Financial Services – Investment Services and Trading
RELEASE ID: 20170519CC0069

Press Release from Marketwired 1-866-736-3779

All press releases are written by the client and have NO affiliation with the news copy written by The Canadian Press. Any questions that arise due to the content or information provided in the press release should be directed to the company/organization
issuing the release, not to The Canadian Press.

GET ENERGYNOW’S DAILY EMAIL FOR FREE


ThreeD Capital Inc. Announces Completion of Private Placement to Raise $380,000

FOR: THREED CAPITAL INC.CSE SYMBOL: IDKDate issue: May 19, 2017Time in: 4:00 PM eAttention:
TORONTO, ONTARIO–(Marketwired – May 19, 2017) – ThreeD Capital Inc. (the
“Company”) (CSE:IDK) is pleased to announce that it has completed a
non-brokered priv…

GET ENERGYNOW’S DAILY EMAIL FOR FREE


Petroteq Energy Inc. Announces Shares for Debt Transactions

FOR: PETROTEQ ENERGY INC.TSX VENTURE SYMBOL: PQEOTCQX SYMBOL: MCWEDDate issue: May 19, 2017Time in: 3:51 PM eAttention:
TORONTO, ONTARIO–(Marketwired – May 19, 2017) – Petroteq Energy Inc. (formerly
MCW Energy Group Limited) (the “Company”) (TSX VENT…

GET ENERGYNOW’S DAILY EMAIL FOR FREE


High Arctic Declares Monthly Dividend

FOR: HIGH ARCTIC ENERGY SERVICES INC.
TSX SYMBOL: HWO

Date issue: May 19, 2017
Time in: 12:00 PM e

Attention:

CALGARY, ALBERTA–(Marketwired – May 19, 2017) –

NOT FOR DISTRIBUTION TO U.S. NEWSWIRE SERVICES OR FOR DISSEMINATION IN THE
UNITED STATES. ANY FAILURE TO COMPLY WITH THIS RESTRICTION MAY CONSTITUTE A
VIOLATION OF U.S. SECURITIES LAW

High Arctic Energy Services Inc. (TSX:HWO) (“High Arctic” or the “Corporation”)
is pleased to announce that its Board of Directors has approved a monthly
dividend payment of $0.0165 per share to holders of common shares. The dividend
is payable on June 14, 2017 to holders of High Arctic common shares of record
at the close of business on May 31, 2017. The ex-dividend date is May 29, 2017.
The dividend is designated as an “eligible dividend” for Canadian Income Tax
purposes.

About High Arctic

High Arctic is a publicly traded company listed on the Toronto Stock Exchange
under the symbol “HWO”. The Corporation’s principal focus is to provide
drilling and specialized well completion services, equipment rentals and other
services to the oil and gas industry.

High Arctic’s largest operation is in Papua New Guinea where it provides
drilling and specialized well completion services and supplies rig matting,
camps and drilling support equipment on a rental basis. The Canadian operation
provides well servicing, well abandonment, snubbing and nitrogen services and
equipment on a rental basis to a large number of oil and natural gas
exploration and production companies operating in Western Canada.

– END RELEASE – 19/05/2017

For further information:
High Arctic Energy Services Inc.
Thomas Alford
Interim President & CEO
587-318-3826
[email protected]
OR
High Arctic Energy Services Inc.
Brian Peters
Chief Financial Officer
587-318-2218
[email protected]

COMPANY:
FOR: HIGH ARCTIC ENERGY SERVICES INC.
TSX SYMBOL: HWO

INDUSTRY: Energy and Utilities – Oil and Gas
RELEASE ID: 20170519CC0035

Press Release from Marketwired 1-866-736-3779

All press releases are written by the client and have NO affiliation with the news copy written by The Canadian Press. Any questions that arise due to the content or information provided in the press release should be directed to the company/organization
issuing the release, not to The Canadian Press.

GET ENERGYNOW’S DAILY EMAIL FOR FREE


DIVERGENT Energy Services Announces Release of Q1 Interim Results

FOR: DIVERGENT ENERGY SERVICES CORP.TSX VENTURE SYMBOL: DVGDate issue: May 19, 2017Time in: 10:36 AM eAttention:
CALGARY, ALBERTA–(Marketwired – May 19, 2017) –
NOT FOR DISSEMINATION IN THE UNITED STATES OF AMERICA
DIVERGENT Energy Services Corp. (“D…

GET ENERGYNOW’S DAILY EMAIL FOR FREE


Cub Energy Announces Issuance of Stock Options

FOR: CUB ENERGY INC.TSX VENTURE SYMBOL: KUBDate issue: May 19, 2017Time in: 7:30 AM eAttention:
HOUSTON, TEXAS–(Marketwired – May 19, 2017) – Cub Energy Inc. (“Cub” or the
“Company”) (TSX VENTURE:KUB) announces today the issuance of 2.5 million commo…

GET ENERGYNOW’S DAILY EMAIL FOR FREE


Computer Modelling Group Announces Year End Results – Part 1

FOR: COMPUTER MODELLING GROUP LTD.
TSX SYMBOL: CMG

Date issue: May 19, 2017
Time in: 7:00 AM e

Attention:

CALGARY, ALBERTA–(Marketwired – May 19, 2017) – Computer Modelling Group Ltd.
(“CMG” or the “Company”) (TSX:CMG) is very pleased to report our financial
results for the fiscal year ended March 31, 2017.

Management’s Discussion and Analysis

This Management’s Discussion and Analysis (“MD&A”) for Computer Modelling Group
Ltd. (“CMG”, the “Company”, “we” or “our”), presented as at May 18, 2017,
should be read in conjunction with the audited consolidated financial
statements and related notes of the Company for the years ended March 31, 2017
and 2016. Additional information relating to CMG, including our Annual
Information Form, can be found at www.sedar.com. The financial data contained
herein have been prepared in accordance with International Financial Reporting
Standards (“IFRS”) and, unless otherwise indicated, all amounts in this report
are expressed in Canadian dollars.

Corporate Profile

CMG is a computer software technology company serving the oil and gas industry.
The Company is a leading supplier of advanced process reservoir modelling
software with a blue chip customer base of international oil companies and
technology centers in approximately 60 countries. The Company also provides
professional services consisting of highly specialized support, consulting,
training, and contract research activities. CMG has sales and technical support
services based in Calgary, Houston, London, Dubai, Bogota and Kuala Lumpur.
CMG’s Common Shares are listed on the Toronto Stock Exchange (“TSX”) and trade
under the symbol “CMG”.

Vision, Business and Strategy

CMG’s vision is to be the leading developer and supplier of dynamic reservoir
modelling systems in the world. Early in its life CMG made the strategic
decision to focus its research and development efforts on providing solutions
for the simulation of difficult hydrocarbon recovery techniques, a decision
that created the foundation for CMG’s dominant market presence today in the
simulation of advanced hydrocarbon recovery processes. CMG has demonstrated
this commitment by continuously investing in research and development and
working closely with its customers to develop simulation tools relevant to the
challenges and opportunities they face today. This includes CoFlow, the newest
generation of reservoir and production system simulation software. Our target
is to develop a dynamic system that does more than optimize reservoir recovery;
it will model the entire hydrocarbon reservoir system, including production
systems.

Since its inception almost 40 years ago, CMG has remained focused on assisting
its customers in unlocking the value of their hydrocarbon reservoirs. With
petroleum production using conventional methods on the decline, the petroleum
industry must use more difficult and costly advanced process extraction
methods, while being faced with more governmental and regulatory requirements
over environmental concerns. CMG’s success can, in turn, be correlated with the
oil industry becoming more reliant on the use of simulation technology due to
the maturity of conventional petroleum reservoirs and the complexities of both
current and emerging production processes. In addition, as producers continue
to look for ways to operate efficiently in a low oil price environment, we
believe they will continue to seek reservoir simulation solutions to enhance
production from their existing and new assets. CMG will continue to provide the
most advanced reservoir simulation tools to assist companies with their
reservoir planning, management and optimization.

CMG’s success can specifically be attributed to a number of factors: advanced
physics, ongoing enhancements to the Company’s already robust product line,
improved computational speed, parallel computing ability, ease of use features
of the pre- and post-processor applications, cost effectiveness of the CMG
solution for customers, and the knowledge base of CMG’s personnel to support
and advance its software.

CMG currently licenses reservoir simulation software to more than 600 oil and
gas companies, consulting firms and research institutions in approximately 60
countries. In combination with its principal business of licensing its
software, CMG also provides professional services consisting of highly
specialized consulting, support, training, and funded research activities for
its customers. While the generation of professional services revenue
specifically tied to the provision of consulting services is not regarded as a
core part of CMG’s business, offering this type of service is important to CMG
operationally. CMG performs a limited amount of specialized consulting
services, which are typically of a highly complex and/or experimental nature.
These studies provide hands-on practical knowledge, allowing CMG staff to test
the boundaries of our software, and provide us the opportunity to increase
software license sales to both new and existing customers. In addition,
providing consulting services is important from the customer service
perspective as it enables our customers to become more proficient users of
CMG’s software. The funded research revenue is derived from the customers who
partner with CMG to assist in the development, testing and refinement of new
simulation technologies.

In addition to consulting, we allocate significant resources to training, which
is an instrumental part of our company’s success, as it enables our customers
to become more efficient and effective users of our software. Our training is
continuous in nature and it helps us in developing and maintaining long-term
relationships with our customers.

CMG remains committed to advancing its technological superiority over its
competition. CMG firmly believes that, to be the dominant supplier of dynamic
reservoir modelling systems in the world, it must be responsive to customers’
needs today and accurately predict their needs in the future.

CMG invests a significant amount of resources each year toward maintaining its
technological superiority. During fiscal 2017, CMG maintained a consistent
level of spending on research and development compared to the previous fiscal
year (representing 22% of total revenue). The continued investment by CMG in
its current product suite offering helps to ensure that its existing proven
technology continues to be industry-leading. These significant levels of
investment, in combination with developing CoFlow, are targeted strategies to
achieve our vision to be the leading developer and supplier of dynamic
reservoir modelling systems in the world.

Overall Performance

Key Performance Drivers and Capability to Deliver Results

One of the challenges the petroleum industry faces in trying to overcome
barriers to production growth is the continuing need for breakthrough
technologies. The facts facing the petroleum industry today are that brand new
fields are increasingly difficult to find, especially on a large scale, and
that there is a large number of mature fields and unconventional prospects
where known petroleum reserves exist; the question is how to economically
extract the petroleum reserves in place while utilizing environmentally
conscious processes. These challenges have been made even more formidable given
that the current economic environment and global political climate have led to
increased uncertainty regarding capital markets and commodity prices.

The petroleum industry utilizes reservoir simulation to provide both vital
information and a visual interpretation on how reservoirs will behave under
various recovery techniques. With this visualization and reservoir simulation
modelling, reservoir professionals receive assistance in predicting the physics
and chemistry of fluid flows, drilling locations, well operating conditions,
risks, and best case economics of oil and gas property investment.
Understanding the science of how a petroleum reservoir will react to difficult
hydrocarbon recovery processes through simulation prior to spending the capital
on drilling wells and injecting expensive chemicals and steam, for instance, is
far less costly and risky than trying the various techniques on real wells.

In a low oil price environment, producers have shifted their focus to
lower-cost assets, improving production margins and low-cost enhanced oil
recovery (EOR), instead of drilling new wells. Reservoir simulation is a
cost-effective and high-value tool to reduce risks, improve recovery processes,
increase margins and incremental recovery.

CMG’s existing product suite of software is the market leader in the simulation
of difficult hydrocarbon recovery techniques. To maintain this dominant market
position, CMG actively participates in research consortia that experiment with
new petroleum extraction processes and technologies. CMG then incorporates the
simulation of new recovery methods into its product suite and focuses on
overcoming existing technological barriers to advance speed and ease of use,
amongst other benefits, in its software.

During fiscal 2017, CMG’s research and development team made significant
performance improvements in our simulators by introducing hybrid parallel
computing, which allows our customers to run larger problems faster on a
network of computers. We also successfully beta-tested cloud computing with
more than one top-tier public cloud provider, which is becoming increasingly
important as customers gravitate towards the flexibility, economics, capacity,
in-place upgradeability and the many other benefits of the cloud. During the
year we also introduced additional features in GEM, the generalized
Equation-of-State compositional reservoir simulator, to allow it to perform
simulations of reservoirs using chemical EOR techniques. These types of
advanced features allow CMG to maintain our leadership position in simulation
of advanced recovery methods, particularly as we see continued use of various
types of EOR techniques globally.

The development of CoFlow, the newest generation of reservoir and production
system simulation software, is a significant project for CMG. From its
inception to December 31, 2016, CoFlow was a joint project with partners Shell
International Exploration and Production B.V. and Petroleo Brasileiro S.A.
(“Petrobras”). Effective January 1, 2017, Petrobras’ financial participation in
the joint development project has ended. In response to Petrobras’ end of its
financial participation, CMG reduced the headcount of the CoFlow development
team by eight employees and contractors in January 2017. Under the new
five-year agreement between CMG and Shell Global Solutions International B.V.
(“Shell”), CMG is responsible for the research and development costs of CoFlow,
while Shell will provide a fixed fee contribution for the continuing
development of the software. CMG, through its participation in this project,
will have full commercialization rights to the developed technology, while
Shell and Petrobras will have unlimited perpetual CoFlow licenses. To date, the
project has represented over 475 man-years of development. The CoFlow team
consists of 54 full-time equivalent persons made up of 40 CMG employees and an
additional 14 partner staff members working remotely from their offices in the
Netherlands and the United States.

In February 2017, we released the most recent version of CoFlow, R11, to Shell
and Petrobras to be used on their selected target assets. R11 made material
progress in improving the runtime performance in identified areas, and there
will be continued work in this area in future releases. Currently, CMG is in
the process of identifying additional customers for trial modelling work using
CoFlow.

CMG is in a very strong financial position with $44.0 million in working
capital, no bank debt and a long history of generating earnings and cash from
operating activities. In addition to its financial resources, CMG’s real
strength lies in the outstanding quality and dedication of its employees in all
areas of the Company.

Our focus will remain on licensing software to both existing and new customers
and, with diversification of our geographic profile, we plan to strengthen our
position in the global marketplace. Approximately 90% of our software license
revenue is derived from our annuity and maintenance contracts, which generally
represent a recurring source of revenue. We continue to be profitable despite
the ongoing economic challenges in the oil and gas industry. During fiscal
2017, we have suspended employee recruitment and reduced headcount and
discretionary spending to control costs. As a result of ongoing adverse
economic conditions in Venezuela and in the oil and gas industry in general, we
decided to close our office in Caracas in May 2016. Our customers in the region
continue to be supported from other locations, mainly the office in Bogota.

During the fiscal year ended March 31, 2017, our EBITDA represented 46% of
total revenue, which demonstrates our continuous ability to effectively manage
corporate costs.

We continue to return value to our shareholders in the form of regular
quarterly dividend payments. During the year ended March 31, 2017, we paid
dividends of $0.40 per share, which is consistent with the prior fiscal year.

We are confident that our sustainable business model driven by superior
technology, commitment to research and development initiatives, and
customer-oriented approach will continue contributing to CMG’s future success.

Annual Performance

/T/

($ thousands, unless otherwise
stated) March 31, 2017 March 31, 2016 March 31, 2015
—————————————————————————-
—————————————————————————-

Annuity/maintenance licenses 65,263 67,805 63,431
Perpetual licenses 4,971 7,169 13,405
—————————————————————————-
Software licenses 70,234 74,974 76,836
Professional services 4,863 5,824 8,025
—————————————————————————-
Total revenue 75,097 80,798 84,861
Operating profit 33,321 36,036 41,516
Operating profit (%) 44% 45% 49%
EBITDA(1) 34,414 37,418 43,099
Net income for the year 24,269 25,302 32,648
Cash dividends declared and
paid 31,697 31,514 31,462
Total assets 106,725 101,413 106,456
Total shares outstanding 79,482 78,819 78,487
Trading price per share at
March 31 10.35 10.14 12.72
Market capitalization at March
31 822,634 799,220 998,353
—————————————————————————-
Per share amounts – ($/share)
Earnings per share – basic 0.31 0.32 0.42
Earnings per share – diluted 0.31 0.32 0.41
Cash dividends declared and
paid 0.40 0.40 0.40
—————————————————————————-
—————————————————————————-
(1) EBITDA is defined as net income before adjusting for depreciation
expense, finance income, finance costs, and income and other taxes. See
“Non-IFRS Financial Measures”.

/T/

Quarterly Performance

/T/

Fiscal 2016(1)
($ thousands, unless otherwise
stated) Q1 Q2 Q3 Q4
—————————————————————————-
—————————————————————————-

Annuity/maintenance licenses 16,738 16,790 17,297 16,980
Perpetual licenses 2,563 1,095 2,729 782
—————————————————————————-
Software licenses 19,301 17,885 20,026 17,762
Professional services 2,139 1,240 1,191 1,254
—————————————————————————-
Total revenue 21,440 19,125 21,217 19,016
Operating profit 10,494 8,160 10,342 7,040
Operating profit (%) 49 43 49 37
EBITDA 10,824 8,519 10,686 7,389
Profit before income and other taxes 9,742 9,365 10,974 5,550
Income and other taxes 2,941 2,599 3,121 1,668
Net income for the period 6,801 6,766 7,853 3,882
Cash dividends declared and paid 7,876 7,891 7,871 7,876
—————————————————————————-
Per share amounts – ($/share)
Earnings per share – basic 0.09 0.09 0.10 0.05
Earnings per share – diluted 0.09 0.08 0.10 0.05
Cash dividends declared and paid 0.10 0.10 0.10 0.10
—————————————————————————-
—————————————————————————-

Fiscal 2017(2)
($ thousands, unless otherwise
stated) Q1 Q2 Q3 Q4
—————————————————————————-
—————————————————————————-

Annuity/maintenance licenses 16,893 15,379 18,378 14,613
Perpetual licenses 579 521 835 3,036
—————————————————————————-
Software licenses 17,472 15,900 19,213 17,649
Professional services 1,345 1,027 1,082 1,409
—————————————————————————-
Total revenue 18,817 16,927 20,295 19,058
Operating profit 8,975 6,905 9,811 7,630
Operating profit (%) 48 41 48 40
EBITDA 9,277 7,189 10,081 7,867
Profit before income and other taxes 9,212 7,119 10,176 7,685
Income and other taxes 2,398 2,128 2,917 2,480
Net income for the period 6,814 4,991 7,259 5,205
Cash dividends declared and paid 7,896 7,929 7,930 7,942
—————————————————————————-
Per share amounts – ($/share)
Earnings per share – basic 0.09 0.06 0.09 0.07
Earnings per share – diluted 0.09 0.06 0.09 0.07
Cash dividends declared and paid 0.10 0.10 0.10 0.10
—————————————————————————-
—————————————————————————-
(1) Q1, Q2, Q3 and Q4 of fiscal 2016 include $1.0 million, $0.3 million,
$0.7 million, and $0.9 million, respectively, in revenue that pertains
to usage of CMG’s products in prior quarters.
(2) Q1, Q2, Q3 and Q4 of fiscal 2017 include $1.8 million, $0.3 million,
$3.7 million, and $0.7 million, respectively, in revenue that pertains
to usage of CMG’s products in prior quarters.

/T/

GET ENERGYNOW’S DAILY EMAIL FOR FREE


Computer Modelling Group Announces Year End Results – Part 3

During the three months ended March 31, 2017, on a geographic basis, Canada
experienced a decrease in total software license sales, which was partially
offset by increases in the Eastern Hemisphere and South America, as compared to
the same period of the previous fiscal year.

During the year ended March 31, 2017, on a geographic basis, total software
license sales decreased in all geographic segments, with the exception of South
America, as compared to the previous fiscal year.

The Canadian market (representing 27% of total annual software license revenue)
experienced a 15% and 18% decrease in annuity/maintenance license revenue
during the three months and year ended March 31, 2017, respectively, compared
to the same periods of the previous fiscal year, due to a reduction in
licensing by some customers. No perpetual sales were realized in Canada during
the three months ended March 31, 2017. Fewer perpetual sales were realized
during the year ended March 31, 2017, compared to the previous fiscal year.

The United States market (representing 24% of total annual software license
revenue) experienced a 2% and 5% decrease in annuity/maintenance license
revenue during the three months and year ended March 31, 2017, respectively,
compared to the same periods of the previous fiscal year, due to decreased
spending by existing customers. Perpetual license revenue for the three months
ended March 31, 2017 was comparable to the same period of the previous fiscal
year. Perpetual license revenue decreased by 83% during the year ended March
31, 2017, compared to the previous fiscal year, as a result of a significant
perpetual sale in the first quarter of the previous fiscal year.

South America (representing 17% of total annual software license revenue)
experienced a decrease of 9% in annuity/maintenance license revenue during the
three months ended March 31, 2017, compared to the same period of the previous
fiscal year, due to decreased spending by some customers. Annuity/maintenance
license revenue for the year ended March 31, 2017 increased by 62%, compared to
the previous fiscal year. Our revenue in South America can be significantly
impacted by the variability of the amounts recorded from a customer for whom
revenue is recognized only when cash is received (see the discussion about
revenue earned in the current quarter that pertains to usage of products in
prior quarters on the next page, above the “Quarterly Software License Revenue”
graph). The most recent payments from this customer were recognized during the
quarter ended December 31, 2016. No payments were received from this customer
during the year ended March 31, 2016. To provide a normalized comparison, if we
remove the revenue from this particular customer from the year ended March 31,
2017, we note that the annuity/maintenance license revenue decreased by 14%
instead of increasing by 62%.

More perpetual sales were realized in South America during the three months
ended March 31, 2017, compared to the same period of the previous fiscal year,
resulting in a 187% increase. On a year-to-date basis, perpetual license
revenue was comparable to the previous fiscal year.

The Eastern Hemisphere (representing 32% of total annual software license
revenue) experienced a 24% and 8% decrease in annuity/maintenance license
revenue during the three months and year ended March 31, 2017, respectively,
compared to the same periods of the previous fiscal year. While some of the
decrease in both periods is due to reduced licensing by some customers, a
portion of the quarter-over-quarter decrease is also due to the timing of
finalizing certain contracts that come up for renewal in the fourth quarter of
each fiscal year. Since some of those contracts were still under negotiation as
at March 31, 2017, no revenue was recognized on them in the three months ended
March 31, 2017.

The Eastern Hemisphere experienced a 464% increase in perpetual license revenue
during the three months ended March 31, 2017, compared to the same period of
the previous fiscal year, as a result of several large perpetual sales realized
in Asia and the Middle East. During the year ended March 31, 2017, the Eastern
Hemisphere realized fewer perpetual sales, leading to an 11% decrease in
perpetual license revenue compared to the previous fiscal year.

As footnoted in the Quarterly Performance table, in the normal course of
business CMG may complete the negotiation of certain annuity/maintenance
contracts and/or fulfill revenue recognition requirements within a current
quarter that includes usage of CMG’s products in prior quarters. This situation
particularly affects contracts negotiated with countries that face increased
economic and political risks leading to the revenue recognition criteria being
satisfied only at the time of the receipt of cash. The dollar magnitude of such
contracts may be significant to the quarterly comparatives of our
annuity/maintenance license revenue stream and, to provide a normalized
comparison, we specifically identify the revenue component where revenue
recognition is satisfied in the current period for products provided in
previous quarters.

To view the Quarterly Software License Revenue ($thousands) chart, please visit
the following link: http://media3.marketwire.com/docs/1095079_graph.jpg

Deferred Revenue

/T/

Fiscal Fiscal
2017 2016 $ change % change
($ thousands)
—————————————————————————-
—————————————————————————-
Deferred revenue at:
Q1 (June 30) 26,154 27,006 (852) -3%
Q2 (September 30) 20,787 22,608 (1,821) -8%
Q3 (December 31) 18,916 17,243 1,673 10%
Q4 (March 31) 38,232 (1) 33,629 4,603 14%
—————————————————————————-
—————————————————————————-
(1) Includes current deferred revenue of $36.3 million and long-term
deferred revenue of $1.9 million.

/T/

CMG’s deferred revenue consists primarily of amounts for pre-sold licenses. Our
annuity/maintenance revenue is deferred and recognized on a straight-line basis
or according to usage over the life of the related license period, which is
generally one year or less. Amounts are deferred for licenses that have been
provided and revenue recognition reflects the passage of time.

The above table illustrates the normal trend in the deferred revenue balance
from the beginning of the calendar year (which corresponds with Q4 of our
fiscal year), when most renewals occur, to the end of the calendar year (which
corresponds with Q3 of our fiscal year). Our fourth quarter corresponds with
the beginning of the fiscal year for most oil and gas companies, representing a
time when they enter a new budget year and sign/renew their contracts.

Deferred revenue as at Q4 of fiscal 2017 increased by 14% compared to Q4 of
fiscal 2016. The deferred revenue balance at March 31, 2017 includes a number
of contracts that were not included in the deferred revenue balance in the
comparative quarter, because the contracts were finalized and invoiced prior to
March 31, 2017, whereas in the previous fiscal year the contracts were
finalized and invoiced subsequent to March 31, 2016.

Professional Services Revenue

CMG recorded professional services revenue of $1.4 million for the three months
ended March 31, 2017, which represented an increase of $0.2 million compared to
the same period of the previous fiscal year. The increase was due to the new
CoFlow development agreement with Shell, which entitles CMG to higher contract
research revenue compared the old joint venture agreement. The increase in
contract research revenue was offset by lower consulting revenue due to a
decline in project activity by our customers.

Professional services revenue for the year ended March 31, 2017 was $4.9
million, which represented a decrease of $1.0 million compared to the same
periods of the previous fiscal year, primarily due to a decline in project
activity by our customers, partially offset by higher contract research revenue.

Professional services revenue consists of specialized consulting, training, and
contract research activities. CMG performs consulting and contract research
activities on an ongoing basis, but such activities are not considered to be a
core part of our business and are primarily undertaken to increase our
knowledge base and hence expand the technological abilities of our simulators
in a funded manner, combined with servicing our customers’ needs. In addition,
these activities are undertaken to market the capabilities of our suite of
software products with the ultimate objective to increase software license
sales. Our experience is that consulting activities are variable in nature as
both the timing and dollar magnitude of work are dependent on activities and
budgets within customer companies.

Expenses

/T/

Three months ended March 31, 2017 2016 $ change % change
($ thousands)
—————————————————————————-
—————————————————————————-

Sales, marketing and professional
services 5,259 6,071 (812) -13%
Research and development 4,587 4,208 379 9%
General and administrative 1,582 1,697 (115) -7%
—————————————————————————-
Total operating expenses 11,428 11,976 (548) -5%
—————————————————————————-
—————————————————————————-

Direct employee costs(1) 9,096 9,634 (538) -6%
Other corporate costs 2,332 2,342 (10) 0%
—————————————————————————-
11,428 11,976 (548) -5%
—————————————————————————-
—————————————————————————-

Year ended March 31, 2017 2016 $ change % change
($ thousands)
—————————————————————————-
—————————————————————————-

Sales, marketing and professional
services 19,353 21,450 (2,097) -10%
Research and development 16,423 16,865 (442) -3%
General and administrative 6,000 6,447 (447) -7%
—————————————————————————-
Total operating expenses 41,776 44,762 (2,986) -7%
—————————————————————————-
—————————————————————————-

Direct employee costs(1) 33,214 36,026 (2,812) -8%
Other corporate costs 8,562 8,736 (174) -2%
—————————————————————————-
41,776 44,762 (2,986) -7%
—————————————————————————-
—————————————————————————-
(1) Includes salaries, bonuses, stock-based compensation, benefits,
commissions, and professional development. See “Non-IFRS Financial
Measures”.

/T/

CMG’s total operating expenses decreased by 5% and 7% for the three months and
year ended March 31, 2017, compared to the same periods of the previous fiscal
year, mainly due to a decrease in direct employee costs.

Direct Employee Costs

As a technology company, CMG’s largest area of expenditure is its people.
Approximately 80% of the total operating expenses for the year ended March 31,
2017 related to direct employee costs, consistent with the same period of the
previous fiscal year. Staffing levels in the current fiscal year were lower
compared to the previous fiscal year. At March 31, 2017, CMG’s full-time
equivalent staff complement was 199 employees and consultants, down from 212
full-time equivalent employees and consultants at March 31, 2016, mainly due to
the closure of the Venezuelan office and the reduction of the CoFlow
development team. Direct employee costs decreased during the three months and
year ended March 31, 2017, compared to the same periods of the previous fiscal
year, due to lower bonuses, lower stock-based compensation expense and the
closure of the Venezuelan office in May of 2016.

Other Corporate Costs

Other corporate costs remained flat during the three months ended March 31,
2017 and decreased by 2% during the year ended March 31, 2017, compared to the
same periods of the previous fiscal year, mainly due to less travel for
business and training and lower depreciation, partially offset by increased
operating costs of the Colombian branch.

Research and Development

/T/

Three months ended March 31, 2017 2016 $ change % change
($ thousands)
—————————————————————————-
—————————————————————————-

Research and development (gross) 4,891 4,623 268 6%
SR&ED credits (304) (415) 111 -27%
—————————————————————————-
Research and development 4,587 4,208 379 9%
—————————————————————————-
—————————————————————————-

Research and development as a % of
total revenue 24% 22%
—————————————————————————-
—————————————————————————-

Year ended March 31, 2017 2016 $ change % change
($ thousands)
—————————————————————————-
—————————————————————————-

Research and development (gross) 17,842 18,366 (524) -3%
SR&ED credits (1,419) (1,501) 82 -5%
—————————————————————————-
Research and development 16,423 16,865 (442) -3%
—————————————————————————-
—————————————————————————-

Research and development as a % of
total revenue 22% 21%
—————————————————————————-
—————————————————————————-

/T/

CMG maintains a belief that its strategy of growing long-term value for
shareholders can only be achieved through continued investment in research and
development. CMG works closely with its customers to provide solutions to
complex problems related to proven and new advanced recovery processes.

The above research and development costs include $1.9 million and $6.0 million
of costs for CoFlow for the three months and year ended March 31, 2017,
respectively, (2016 – $1.5 million and $5.9 million, respectively). See
discussion under “Commitments, Off Balance Sheet Items and Transactions with
Related Parties”.

Research and development costs (gross) increased by 6% during the three months
ended March 31, 2017, compared to the same period of the previous fiscal year,
as a result of the new agreement with our CoFlow partner Shell, under which CMG
is responsible for a larger share of CoFlow costs starting January 1, 2017.

GET ENERGYNOW’S DAILY EMAIL FOR FREE


Computer Modelling Group Announces Year End Results – Part 6

Sales Variability Risk

CMG’s software license revenue consists of annuity/maintenance software
licensing, which is generally for a term of one year or less, and perpetual
software licensing, whereby the customer purchases the-then-current version of
the software and has the right to use that version in perpetuity. Software
licensing under perpetual sales is a significant part of CMG’s business but is
more variable in nature as the purchase decision, and its timing, fluctuate
with customers’ needs and budgets. CMG has found that a number of customers
prefer to acquire perpetual software licenses rather than leasing the software
on an annual basis. The experience over the last few years is that a number of
these customers are purchasing additional licenses to allow more users to
access CMG technology in their operations. CMG has found that a large
percentage of its customers who have acquired perpetual software licenses are
subsequently purchasing maintenance licenses to ensure they have access to
current CMG technology.

The variability in sales of perpetual licenses may cause significant
fluctuations in the Company’s quarterly and annual financial results, and these
results may not meet the expectations of analysts or investors. Accordingly,
the Company’s past results may not be a good indication of its future
performance.

CMG’s customers are both domestic and international oil and gas companies and
for the years ended March 31, 2017 and 2016, no customer represented revenue in
excess of 10% of total revenue.

Foreign Exchange Risk

CMG’s reported results are affected by the exchange rate between the Canadian
dollar and the US dollar as approximately 78% (2016 – 76%) of product revenues
in fiscal 2017 were denominated in US dollars. Approximately 26% of CMG’s total
costs in fiscal 2017 (2016 – 28%) were denominated in US dollars, which
provides a partial economic hedge against the fluctuation in currency exchange
between the US and the Canadian dollar on revenues. CMG’s residual revenues and
costs are primarily denominated in Canadian dollars, and its policy is to
convert excess US dollar cash into Canadian dollars when received.

Geopolitical Risk

CMG sells its products and services in approximately 60 countries and maintains
offices in Canada, the United States, the United Kingdom, the United Arab
Emirates, Colombia and Malaysia. Some of these countries have greater economic,
political and social risks than North America. Some of those risks include:

/T/

— Costs associated with the use of foreign agents and contractors;
— Difficulties in collecting accounts receivable;
— Currency restrictions and exchange rate fluctuations;
— The burdens of complying with a wide variety of foreign laws;
— Changes in laws governing existing operations and contracts;
— Changes to taxation policies dramatically increasing tax costs to the

Company;
— Possible social, labor, political, and economic instability;
— Economic and legal sanctions;
— Non-compliance with applicable anti-corruption and bribery laws.

/T/

Any disruption in our ability to complete a sale cycle, including disruption of
travel to customers’ locations to provide training and support, and the cost of
reorganizing daily activities of foreign operations, could have an adverse
effect on CMG’s business, financial condition and operational results. CMG
mitigates the potential adverse effect on sales by invoicing for the full
license term in advance for the majority of software license sales and by
invoicing as frequently as the contract allows for consulting and contract
research services. CMG consults with tax advisors on complex tax issues and
engages professional tax firms to review its tax filings in foreign
jurisdictions. CMG closely monitors the business and regulatory environments of
the countries in which it conducts operations to minimize the potential impact
on costs and operations.

Non-compliance with applicable anti-corruption and bribery laws could subject
the Company to onerous penalties and the costs of prosecution. CMG has
established business practices and internal controls to minimize the potential
occurrence of any irregular payments. In addition, the Company has established
well-defined anti-corruption and bribery policies and procedures that each
employee and contractor is required to sign indicating their compliance.

Competition Risk

Competition is a risk for CMG as it is for almost every company in every
sector. The reservoir simulation software industry currently consists of three
major suppliers (including CMG) and a number of small suppliers. Some of the
other suppliers, including two major suppliers, offer products or oil field
services outside the scope of reservoir simulation. Some potential customers
may prefer to deal with such multi-service suppliers, while others prefer an
independent supplier, such as CMG.

Although competition is very active, CMG believes that its proven technology
and the comprehensive scope of its products, combined with its international
presence and recognition as a major independent supplier, provide distinct
competitive advantages.

Sustaining competitive advantage is another issue, which CMG addresses by
making a significant ongoing commitment to research and development spending.
CMG expended $16.4 million (2016 – $16.9 million) in product research and
development in its most recently completed fiscal year.

The introduction by competitors of products embodying new technology and the
emergence of new industry standards and practices could render CMG’s products
obsolete and unmarketable and could exert price pressures on existing products,
which could have negative effects on the Company’s business, operating results
and financial condition.

There is a significant barrier for new entrants into the reservoir simulation
software industry. The cost of entry is substantial as a significant investment
in research and development is required. In addition, to become a major
supplier, a significant time investment is required to build up quality
relationships with potential customers.

Labour Risk

The Company’s continued success is substantially dependent on the performance
of its key employees and officers. The loss of the services of these personnel
as well as failure to attract additional key personnel could have a negative
impact upon the Company’s business, operating results and financial condition.
Due to high levels of competition for qualified personnel, there can be no
assurance that the Company will be successful in retaining and attracting such
personnel. The Company attempts to overcome this by offering an attractive
compensation package and providing an environment that provides the
intellectual and professional stimulation sought by our employee group.

Intellectual Property Risk

CMG regards its software as proprietary and attempts to protect it with
copyrights, trademarks and trade secret measures, including restrictions on
disclosure and technical measures. Despite these precautions, it may be
possible for third parties to copy CMG’s programs or aspects of its trade
secrets. CMG has no patents, and existing legal and technical precautions
afford only limited practical protection. CMG could incur substantial costs in
protecting and enforcing its intellectual property rights. Moreover, from time
to time third parties may assert patent, trademark, copyright and other
intellectual property rights to technologies that are important to CMG. In such
an event, CMG may be required to incur significant costs in litigating a
resolution to the asserted claim. There can be no assurance that such a
resolution would not require that CMG pay damages or obtain a license of a
third party’s proprietary rights in order to continue licensing its products as
currently offered, or, if such a license is required, that it will be available
on terms acceptable to CMG.

CMG does not know of any infringement of any third party’s patent rights,
copyrights, trade secrecy rights or other intellectual property disputes in the
development or support of its products.

Cyber Risk

CMG is dependent on information technology (“IT”) infrastructure to process,
transmit and store electronic information, to advertise, inform and train
around CMG’s products and services, to manage business operations and for the
functioning and/or delivery of the Company’s products and services. CMG’s IT
infrastructure is composed of hardware, software, networks, data center
facilities, web servers, and all related equipment required to operate. Natural
disasters, energy blackouts, operating malfunction, software virus or malware,
cyber security attacks, human error, employee misconduct or other sources could
result in the temporary or permanent loss of any or all parts of CMG’s IT
infrastructure. Any such incident or breach could create system disruptions or
slowdowns. In such an event, the information stored in CMG’s IT infrastructure
could be accessed, publicly disclosed, lost, or stolen, which could subject CMG
to liability and cause the Company to incur significant costs to eliminate or
alleviate the problem. Additionally, such occurrences could cause negative
publicity and harm to CMG’s reputation. CMG mitigates such risks by ensuring
the core network is not connected to the Internet, firewalling the servers that
are connected to the Internet, restricting access to information through user
authentication, completing frequent back-ups of data, and having a disaster
recovery plan in place.

Although CMG has implemented disaster recovery plans and extensive technology
security initiatives to prevent, detect and address these threats, it is
virtually impossible to entirely mitigate these risks. To date, CMG has not
experienced any material losses relating to cyber attacks or other information
security breaches.

CMG’s website collects limited user information; the website is not used for
e-commerce transactions, and CMG neither receives nor retains financial
information from its website users. CMG’s products are not known to have any
security vulnerabilities. CMG’s products are engineering decision-making tools
and are not employed in a cyber security (mitigation or defensive) role, as
part of our client’s IT infrastructure. CMG’s software releases are scanned for
software viruses and malware, confirming a lack thereof, prior to delivery to
clients.

Tax Liability Risk

With operations and sales in various countries, CMG is subject to taxes in
several jurisdictions around the world. Significant judgment is required in
determining the Company’s worldwide liability for income, indirect and other
taxes, as well as potential penalties and interest. Although management
believes that all expenses and tax credits claimed by the Company, including
research and development expenses and foreign tax credits, are reasonable,
deductible and have been correctly determined, tax authorities may disagree
with the treatment of items reported by the Company, the result of which could
have a material adverse effect on our financial condition and results of
operations. CMG mitigates these risks by staying informed of changes in tax
legislation, consulting with tax advisors on complex tax issues and having
professional tax firms review the Company’s tax filings.

CMG conducts operations worldwide through subsidiaries in various tax
jurisdictions pursuant to transfer pricing arrangements with its subsidiaries.
If two or more affiliated companies are located in different countries, the tax
laws or regulations of each country generally will require that transfer prices
be the same as those between unrelated companies dealing at arm’s length. While
we believe that we operate in compliance with applicable transfer pricing laws
and intend to continue to do so, a tax authority in one or more jurisdictions
could challenge the validity of our related-party transfer pricing
methodologies, which could result in adjustments in favor of the taxing
authority. To address this risk, CMG engages local professional tax firms to
review the Company’s transfer pricing agreements and dealings with foreign tax
authorities.

Disclosure Controls and Procedures and Internal Control over Financial Reporting

Management is responsible for establishing and maintaining disclosure controls
and procedures (“DC&P”) and internal control over financial reporting (“ICFR”)
as defined under National Instrument 52-109.

At March 31, 2017, the Chief Executive Officer (“CEO”) and the Chief Financial
Officer (“CFO”) concluded that the design and operation of the Company’s DC&P
were effective (in accordance with the COSO control framework (2013)) and that
material information relating to the Company, including its subsidiaries, was
made known to them and was recorded, processed, summarized and reported within
the time periods specified under applicable securities legislation. Further,
the CEO and the CFO concluded that the design and operation of the Company’s
ICFR were effective at March 31, 2017 in order to provide reasonable assurance
regarding the reliability of financial reporting and the preparation of
financial statements for external purposes in accordance with IFRS. It should
be noted that while the Company’s CEO and CFO believe that the Company’s
disclosure controls and procedures and internal controls over financial
reporting provide a reasonable level of assurance that they are effective, they
do not expect that such controls and procedures will prevent all errors and
fraud. A control system, no matter how well conceived or operated, can provide
only reasonable, not absolute, assurance that the objectives of the control
system are met.

During the year ended March 31, 2017, there have been no significant changes to
the Company’s ICFR that have materially affected, or are reasonably likely to
materially affect, the Company’s ICFR.

Non-IFRS Financial Measures

This MD&A includes certain measures which have not been prepared in accordance
with IFRS such as “EBITDA”, “direct employee costs” and “other corporate
costs.” Since these measures do not have a standard meaning prescribed by IFRS,
they are unlikely to be comparable to similar measures presented by other
issuers. Management believes that these indicators nevertheless provide useful
measures in evaluating the Company’s performance.

“Direct employee costs” include salaries, bonuses, stock-based compensation,
benefits, commission expenses, and professional development. “Other corporate
costs” include facility-related expenses, corporate reporting, professional
services, marketing and promotion, computer expenses, travel, and other
office-related expenses. Direct employee costs and other corporate costs should
not be considered an alternative to total operating expenses as determined in
accordance with IFRS. People-related costs represent the Company’s largest area
of expenditure; hence, management considers highlighting separately corporate
and people-related costs to be important in evaluating the quantitative impact
of cost management of these two major expenditure pools. See “Expenses” heading
for a reconciliation of direct employee costs and other corporate costs to
total operating expenses.

“EBITDA” refers to net income before adjusting for depreciation expense,
finance income, finance costs, and income and other taxes. EBITDA should not be
construed as an alternative to net income as determined by IFRS. The Company
believes that EBITDA is useful supplemental information as it provides an
indication of the results generated by the Company’s main business activities
prior to consideration of how those activities are amortized, financed or
taxed. See “EBITDA” heading for a reconciliation of EBITDA to net income.

Forward-looking Information

Certain information included in this MD&A is forward-looking. Forward-looking
information includes statements that are not statements of historical fact and
which address activities, events or developments that the Company expects or
anticipates will or may occur in the future, including such things as
investment objectives and strategy, the development plans and status of the
Company’s software development projects, the Company’s intentions, results of
operations, levels of activity, future capital and other expenditures
(including the amount, nature and sources of funding thereof), business
prospects and opportunities, research and development timetable, and future
growth and performance. When used in this MD&A, statements to the effect that
the Company or its management “believes”, “expects”, “expected”, “plans”,
“may”, “will”, “projects”, “anticipates”, “estimates”, “would”, “could”,
“should”, “endeavours”, “seeks”, “predicts” or “intends” or similar statements,
including “potential”, “opportunity”, “target” or other variations thereof that
are not statements of historical fact should be construed as forward-looking
information. These statements reflect management’s current beliefs with respect
to future events and are based on information currently available to management
of the Company. The Company believes that the expectations reflected in such
forward-looking information are reasonable, but no assurance can be given that
these expectations will prove to be correct and such forward-looking
information should not be unduly relied upon.

With respect to forward-looking information contained in this MD&A, we have
made assumptions regarding, among other things:

GET ENERGYNOW’S DAILY EMAIL FOR FREE


Computer Modelling Group Announces Year End Results – Part 7

/T/

— Future software license sales
— The continued financing by and participation of the Company’s CoFlow

partner and it being completed in a timely manner
— Ability to enter into additional software license agreements
— Ability to continue current research and new product development
— Ability to recruit and retain qualified staff

/T/

Forward-looking information is not a guarantee of future performance and
involves a number of risks and uncertainties, only some of which are described
herein. Many factors could cause the Company’s actual results, performance or
achievements, or future events or developments, to differ materially from those
expressed or implied by the forward-looking information including, without
limitation, the following factors which are discussed in greater detail in the
“Business Risks” section of this MD&A:

/T/

— Economic conditions in the oil and gas industry
— Reliance on key customers
— Foreign exchange
— Economic and political risks in countries where the Company currently

does or proposes to do business
— Increased competition
— Reliance on employees with specialized skills or knowledge
— Protection of proprietary rights

/T/

Should one or more of these risks or uncertainties materialize, or should
assumptions underlying the forward-looking statements prove incorrect, actual
results, performance or achievement may vary materially from those expressed or
implied by the forward-looking information contained in this MD&A. These
factors should be carefully considered and readers are cautioned not to place
undue reliance on forward-looking information, which speaks only as of the date
of this MD&A. All subsequent forward-looking information attributable to the
Company herein is expressly qualified in its entirety by the cautionary
statements contained in or referred to herein. The Company does not undertake
any obligation to release publicly any revisions to forward-looking information
contained in this MD&A to reflect events or circumstances that occur after the
date of this MD&A or to reflect the occurrence of unanticipated events, except
as may be required under applicable securities laws.

This Management’s Discussion and Analysis was reviewed and approved by the
Audit Committee and Board of Directors and is effective as of May 18, 2017.

Outlook

During fiscal 2017, our annuity and maintenance license revenue declined by 4%.
Decreases in Canada, the United States and the Eastern Hemisphere were
partially offset by an increase in South America as a result of receiving
payments from a customer for whom revenue is recognized only when cash is
received. The majority of the declines were a result of reduced licensing by
customers that have been negatively affected by the economic downturn in the
oil and gas industry. The largest decrease has been experienced in Canada,
while the decrease in the Eastern Hemisphere comes as a result of both declines
and delays in closing of contracts in Asia and Europe. Fewer perpetual sales
were made in fiscal 2017 as a result of budgetary cuts by our customers.

In the second half of fiscal 2017 we noted a hint of positive sentiment in the
industry with the price of oil stabilizing in the US$45 to US$50 per barrel
range, shifting the focus of some petroleum producers from cost-cutting
measures to value creation. While we are encouraged by these positive
indicators, reductions in budgets and activity levels by our customers over the
past couple of years have affected the utilization levels of our software
during fiscal 2017, resulting in lower revenue and necessitating cost
reductions.

During fiscal 2017, we demonstrated fiscal restraint by reducing costs by 7%,
which allowed us to maintain operating profit at 44% of total revenue and EBITA
at 46% of total revenue. We believe that the achievement of such margins under
difficult economic conditions is impressive.

In an environment of low commodity prices and credit constraints, it is more
important than ever for petroleum producers to increase the cost effectiveness
and overall efficiency of their operations. CMG will continue to provide
advanced process simulation and employ leading edge technologies to help these
companies to get the most out of every dollar spent. We will continue to defend
and grow our market share and maintain our leadership position in advanced
reservoir simulation through investment in R&D, continuous advancement of
technologies and unparalleled customer support while exercising fiscal
prudence.

During the fourth quarter we released the most recent version of CoFlow, R11,
to Shell and Petrobras to be used on their selected target assets. R11 has made
material progress in improving the runtime performance, and there will be
continued focus on performance and robustness of CoFlow in future releases. At
the end of December 2016, Petrobras ended its financial participation in the
project, and CMG entered into a new five-year agreement with Shell for
continued development of CoFlow. We have also commenced the process of
identifying additional customers for trial modelling work. CoFlow will provide
one-vendor solution for integrated asset modelling by combining both reservoir
and production networks.

During fiscal 2017, our new headquarters in Calgary was substantially completed
and will be leased by us for the next 20 years. The new building features
training facilities for customers and brings together our entire team in one
location. We invested just over $15 million into the new building
infrastructure over the past three fiscal years. Following the investment in
the new headquarters, our capital expenditures are expected to recede to their
normal levels of a couple of million dollars a year.

We ended fiscal 2017 with a strong balance sheet, no debt and $63.2 million in
cash. During the fourth quarter, CMG’s Board of Directors declared a quarterly
dividend of $0.10 per share.

Kenneth M. Dedeluk

President and Chief Executive Officer

May 18, 2017

Consolidated Statements of Financial Position

/T/

(thousands of Canadian $) March 31, 2017 March 31, 2016
—————————————————————————
—————————————————————————

Assets
Current assets:

Cash 63,239 72,680
Trade and other receivables (note 13(a)) 25,305 21,093
Prepaid expenses 1,236 1,222
Prepaid income taxes (note 10) 72 3,173
—————————————————————————
89,852 98,168
Property and equipment (note 4) 16,873 3,245
—————————————————————————
Total assets 106,725 101,413
—————————————————————————
—————————————————————————

Liabilities and shareholders’ equity
Current liabilities:

Trade payables and accrued liabilities (note
5) 9,331 7,527
Income taxes payable (note 10) 190 800
Deferred revenue 36,303 33,629
—————————————————————————
45,824 41,956
Deferred revenue 1,929 –
Deferred tax liability (note 10) 254 199
—————————————————————————
—————————————————————————
Total liabilities 48,007 42,155
—————————————————————————

Shareholders’ equity:

Share capital (note 11) 71,859 66,007
Contributed surplus 11,433 10,397
Deficit (24,574) (17,146)
—————————————————————————
Total shareholders’ equity 58,718 59,258
—————————————————————————
Total liabilities and shareholders’ equity 106,725 101,413
—————————————————————————
—————————————————————————

/T/

Subsequent events (notes 11(b) and 20)

See accompanying notes to consolidated financial statements.

/T/

Approved by the Board

Frank L. Meyer Robert F. M. Smith
Director Director

/T/

Consolidated Statements of Operations and Comprehensive Income

/T/

Years Ended March 31, 2017 2016
(thousands of Canadian $ except per share
amounts)
—————————————————————————
—————————————————————————

Revenue (note 6) 75,097 80,798
—————————————————————————

Operating expenses

Sales, marketing and professional services 19,353 21,450
Research and development (note 7) 16,423 16,865
General and administrative 6,000 6,447
—————————————————————————
41,776 44,762
—————————————————————————
Operating profit 33,321 36,036

Finance income (note 9) 871 549
Finance costs (note 9) – (954)
—————————————————————————
Profit before income and other taxes 34,192 35,631
Income and other taxes (note 10) 9,923 10,329
—————————————————————————

Net and total comprehensive income 24,269 25,302
—————————————————————————

Earnings Per Share
Basic (note 11(e)) 0.31 0.32
Diluted (note 11(e)) 0.31 0.32
—————————————————————————
—————————————————————————

/T/

See accompanying notes to consolidated financial statements.

Consolidated Statements of Changes in Equity

/T/

Common Contributed Retained Total
(thousands of Canadian $) Share Capital Surplus Deficit Equity
—————————————————————————
—————————————————————————

Balance, April 1, 2015 59,397 8,561 (4,502) 63,456
Total comprehensive income for
the year – – 25,302 25,302
Dividends paid – – (31,514) (31,514)
Shares issued for cash on
exercise of stock options
(note 11(b)) 6,002 – – 6,002
Common shares buy-back (notes
11(b) & (c)) (474) – (6,432) (6,906)
Stock-based compensation:
Current period expense – 2,918 – 2,918
Stock options exercised
(note 11(b)) 1,082 (1,082) – –
—————————————————————————
Balance, March 31, 2016 66,007 10,397 (17,146) 59,258
—————————————————————————
—————————————————————————

Balance, April 1, 2016 66,007 10,397 (17,146) 59,258
Total comprehensive income for
the year – – 24,269 24,269
Dividends paid – – (31,697) (31,697)
Shares issued for cash on
exercise of stock options
(note 11(b)) 4,925 – – 4,925
Stock-based compensation:
Current period expense (note
11 (d)) – 1,963 – 1,963
Stock options exercised
(note 11(b)) 927 (927) – –
—————————————————————————
Balance, March 31, 2017 71,859 11,433 (24,574) 58,718
—————————————————————————
—————————————————————————

/T/

See accompanying notes to consolidated financial statements.

Consolidated Statements of Cash Flows

/T/

Years ended March 31, 2017 2016
(thousands of Canadian $)
—————————————————————————
—————————————————————————

Operating activities

Net income 24,269 25,302
Adjustments for:
Depreciation (note 4) 1,093 1,382
Income and other taxes (note 10) 9,923 10,329
Stock-based compensation (note 11(d)) 2,144 2,918
Interest income (note 9) (551) (549)
—————————————————————————
—————————————————————————
36,878 39,382
Changes in non-cash working capital:
Trade and other receivables (4,233) 5,983
Trade payables and accrued liabilities (1,585) (226)
Prepaid expenses (14) 49
Deferred revenue 4,603 966
—————————————————————————
—————————————————————————
Cash provided by operating activities 35,649 46,154
Interest received 574 556
Income taxes paid (7,378) (15,045)
—————————————————————————
Net cash provided by operating activities 28,845 31,665
—————————————————————————
—————————————————————————

Financing activities
Proceeds from issue of common shares 4,925 6,002
Dividends paid (31,697) (31,514)
Common shares buy-back (note 11(c)) – (6,906)
—————————————————————————
Net cash used in financing activities (26,772) (32,418)
—————————————————————————
—————————————————————————

Investing activities
Property and equipment additions (note 4) (11,514) (1,909)
—————————————————————————
Decrease in cash (9,441) (2,662)
Cash, beginning of year 72,680 75,342
—————————————————————————
Cash, end of year 63,239 72,680
—————————————————————————
—————————————————————————

/T/

GET ENERGYNOW’S DAILY EMAIL FOR FREE


Computer Modelling Group Announces Year End Results – Part 11

(ii) Fair values of financial instruments

The carrying values of cash, trade and other receivables, trade payables and
accrued liabilities approximate their fair values due to the short-term nature
of these instruments.

Overview:

The Company is exposed to risks of varying degrees of significance and
likelihood, which could affect its ability to achieve its strategic objectives
for growth. The main objectives of the Company’s risk management process are to
ensure that risks are properly identified and that the capital base is adequate
in relation to those risks. The principal financial risks to which the Company
is exposed are described below:

(a) Credit Risk:

Credit risk is the risk of an unexpected loss if a customer or third party to a
financial instrument fails to meet its contractual obligation and arises
principally from the Company’s trade and other receivables. The amounts
reported in the statements of financial position for trade receivables are net
of allowances for bad debts, estimated by the Company’s management based on
prior experience and their assessment of the current economic environment.

The Company’s trade receivables consist primarily of balances from customers
operating in the oil and gas industry, both domestically and internationally,
as the Company sells its products and services in approximately 60 countries
worldwide. Some of these countries have greater economic and political risk
than experienced in North America, and as a result there may be greater risk
associated with sales in those jurisdictions. The Company manages this risk by
invoicing for the full license term in advance for the majority of software
license sales and by invoicing as frequently as the contract allows for
consulting and contract research services. In cases where collectability is not
deemed probable, revenue is recognized upon receipt of cash, providing all
other criteria have been met. Historically, the Company has not experienced any
significant losses related to individual customers or groups of customers in
any particular geographic area; therefore, no allowance for doubtful accounts
has been established at March 31, 2017 and 2016.

As at March 31, 2017, the Company has a concentration of credit risk with 15
domestic and international customers who represent 82% of trade receivables
(2016 – 12 customers; 79%).

The carrying amount of trade and other receivables represents the maximum
credit exposure. The maximum exposure to credit risk at March 31, 2017 was
$25.3 million (2016 – $21.1 million). The aging of trade and other receivables
at the reporting date was:

/T/

(thousands of $) March 31, 2017 March 31, 2016
—————————————————————————-
—————————————————————————-
Current 7,626 6,067
31-60 days 13,394 11,038
61-90 days 2,516 1,830
Over 90 days 1,769 2,158
—————————————————————————-
Balance, end of year 25,305 21,093
—————————————————————————-
—————————————————————————-

/T/

The Company assesses the creditworthiness of its customers on an ongoing basis
and it regularly monitors the amount and age of balances outstanding. Payment
terms with customers are 30 days from invoice date; however, industry practice
can extend these terms. Accordingly, the Company views the credit risks on
these amounts as normal for the industry.

The Company minimizes the credit risk of cash by depositing only with a
reputable financial institution in highly liquid interest-bearing cash accounts.

(b) Market Risk:

Market risk is the risk that changes in market prices of the foreign exchange
rates and interest rates will affect the Company’s income or the value of its
financial instruments.

(i) Foreign Exchange Risk

The Company operates internationally and primarily prices its products in
either the Canadian or US dollar. This gives rise to exposure to market risks
from changes in the foreign exchange rates between the Canadian and US dollar.
Approximately 78% (2016 – 76%) of the Company’s revenues for the year ended
March 31, 2017 were denominated in US dollars, and at March 31, 2017,
approximately US $20.8 million (2016 – US $15.0 million) of the Company’s
working capital was denominated in US dollars. The Company currently does not
use derivative instruments to hedge its exposure to those risks, but as
approximately 26% (2016 – 28%) of the Company’s total costs are also
denominated in US dollars, they provide a partial economic hedge against the
fluctuation in this currency exchange. In addition, the Company manages levels
of foreign currency held by converting excess US dollars into Canadian dollars
at spot rates.

The Company’s operations are exposed to currency risk on US-dollar denominated
financial assets and liabilities with fluctuations in the rate recognized as
foreign exchange gains or losses in the consolidated statement of operations
and comprehensive income. It is estimated that a one cent change in the US
dollar would result in a net change of approximately $152,000 to equity and net
income for the year ended March 31, 2017. A weaker US dollar with respect to
the Canadian dollar will result in a negative impact, while the reverse would
result from a stronger US dollar.

(ii) Interest Rate Risk

The Company has significant cash balances and no interest-bearing debt. The
Company’s policy is to invest excess cash in interest-bearing deposits and/or
guaranteed investment certificates issued by a reputable financial institution.
The Company is exposed to interest cash flow risk from changes in interest
rates on its cash balances. Based on the March 31, 2017 cash balance, each 1%
change in the interest rate on the Company’s cash balance would change equity
and net income for the year ended March 31, 2017 by approximately $462,000.

(c) Liquidity Risk:

Liquidity risk is the risk that the Company is not able to meet its financial
obligations as they fall due or can do so only at excessive cost. The Company
manages liquidity risk through the management of its capital structure as
outlined in note 12. The Company’s growth is financed through a combination of
the cash flows from operations and its cash balances on hand. Given the
Company’s available liquid resources as compared to the timing of the payments
of its liabilities, management assesses the Company’s liquidity risk to be low.
The Company monitors its expenditures by preparing annual budgets that are
periodically updated. At March 31, 2017, the Company has significant cash
balances in excess of its obligations and approximately $0.8 million of the
line of credit (note 15) available for its use.

14. Commitments:

(a) Research Commitments:

Until January 1, 2017, the Company was the operator of a joint project, a
collaborative effort with its partners Shell International Exploration and
Production B.V. and Petroleo Brasileiro S.A. (“Petrobras”), to jointly develop
CoFlow, the newest generation of reservoir and production system simulation
software (note 18).

Effective January 1, 2017, Petrobras’ financial participation in the joint
development project has ended. Under the new five-year agreement between CMG
and Shell Global Solutions International B.V. (“Shell”), CMG is responsible for
the research and development costs of CoFlow, while Shell will provide a fixed
fee contribution for the continuing development of the software . The Company’s
revenue and costs associated with CoFlow are estimated to be $4.0 million and
$8.3 million, respectively, for fiscal 2018.

(b) Lease Commitments:

The Company has operating lease commitments relating to its office premises
with the minimum annual lease payments as follows:

/T/

Years ended March 31, 2017 2016
(thousands of $)
—————————————————————————-
—————————————————————————-
Less than one year 4,333 2,482
Between one and five years 19,335 17,566
More than five years 82,304 81,969
—————————————————————————-
105,972 102,017
—————————————————————————-
—————————————————————————-

/T/

The Company leases a number of properties under operating leases. During the
year ended March 31, 2017, $2.8 million (2016 – $2.7 million) was recognized as
an expense in the statement of operations and comprehensive income in respect
of operating leases related to office premises.

The Company entered into a twenty year operating lease commitment relating to
its new Calgary headquarters commencing in calendar 2017. The minimum annual
lease payments have been reflected in the above schedule. The Company invested
$15.3 million in infrastructure for the new headquarters over the last three
fiscal years, of which $13.9 million was incurred in the year ended March 31,
2017 ($10.1 million of that was paid in cash and the remaining $3.8 million is
included in trade payables and accrued liabilities as at March 31, 2017). The
total budget for infrastructure is $16.0 million, and the remainder of the
budget is expected to be spent in the first quarter of fiscal 2018.

15. Line Of Credit:

The Company has arranged for a $1.0 million line of credit with its principal
banker, which can be drawn down by way of a demand operating credit facility or
may be used to support letters of credit. As at March 31, 2017, US $215,000
(2016 – US $215,000) had been reserved on this line of credit for letters of
credit supporting performance bonds.

16. Segmented Information:

The Company is organized into one operating segment represented by the
development and licensing of reservoir simulation software. The Company
provides professional services, consisting of support, training, consulting and
contract research activities, to promote the use and development of its
software; however, these activities are not evaluated as a separate business
segment.

Revenues and property and equipment of the Company arise in the following
geographic regions:

/T/

(thousands of $) Revenue Property and equipment
—————————————————————————-
—————————————————————————-
Years ended March 31, As at March 31,
2017 2016 2017 2016
—————————————————————————-
Canada 21,459 26,121 16,463 2,694
United States 16,928 19,103 192 248
South America 13,065 9,837 173 245
Eastern Hemisphere(1) 23,645 25,737 45 58
—————————————————————————-
75,097 80,798 16,873 3,245
—————————————————————————-
—————————————————————————-
(1) Includes Europe, Africa, Asia and Australia.

/T/

No customer represented 10% or more of total revenue in the years ended March
31, 2017 and 2016.

17. Subsidiaries:

CMG is the beneficial owner of the entire issued share capital and controls all
the votes of its subsidiaries. The principal activities of all the subsidiaries
are the sale and support for the use of CMG’s software licenses. Transactions
between subsidiaries are eliminated on consolidation.

The following is the list of CMG’s subsidiaries:

/T/

Subsidiary Country of Incorporation
—————————————————————————-
—————————————————————————-
Computer Modelling Group Inc. United States
CMG Middle East FZ LLC Dubai, United Arab Emirates
CMG (Europe) Limited United Kingdom
—————————————————————————-
—————————————————————————-

/T/

18. Joint Operation:

Until January 1, 2017, the Company was the operator of a joint project, a
collaborative effort with its partners Shell International Exploration and
Production B.V. and Petrobras, to jointly develop CoFlow, the newest generation
of reservoir and production system simulation software. Accordingly, until
January 1, 2017, the Company recorded its proportionate share of costs incurred
on the project (37.04%) as research and development costs within the
consolidated statement of operations and comprehensive income.

Effective January 1, 2017, Petrobras’ financial participation in the joint
development project ended. Under the new five-year agreement between CMG and
Shell, CMG is responsible for the research and development costs of CoFlow,
while Shell will provide a fixed fee contribution. The new agreement with Shell
does not meet the definition of a joint arrangement, and as of January 1, 2017,
the Company discontinued the use of proportionate consolidation to account for
CoFlow.

During the first nine months of the current fiscal year, under the
proportionate consolidation method, CMG recorded $4.1 million (year ended March
31, 2016 – $5.9 million) of CoFlow costs in its consolidated statement of
operations and comprehensive income.

Additionally, under the previous arrangement the Company was entitled to charge
its partners for various services provided as operator, which were recorded in
revenue as professional services and amounted to $2.1 million for the first
nine months of the current fiscal year (year ended March 31, 2016 – $2.8
million).

For the three months ended March 31, 2017, subsequent to discontinuing
proportionate consolidation, CoFlow revenue of $1.1 million was recorded to
professional services revenue and CoFlow costs of $1.9 million were recorded to
research and development expenses.

19. Related Parties:

(a) Intercompany Transactions:

The Company has three wholly owned subsidiaries (note 17) that have
intercompany transactions under the normal course of operations and are
eliminated upon consolidation.

(b) Key Management Personnel Compensation:

The key management personnel of the Company are the members of the Company’s
executive management team and Board of Directors and control approximately 4.7%
of the outstanding shares of CMG at March 31, 2017.

In addition to their salaries and director fees, as applicable, directors and
executive officers also participate in the Company’s stock option plan or SAR
plan (note 11(d)), which are available to almost all employees of the Company.

Key management personnel compensation comprised the following:

/T/

Years ended March 31, 2017 2016
(thousands of $)
—————————————————————————-
—————————————————————————-
Salaries, bonus and employee benefits 4,136 4,215
Stock-based compensation 644 829
—————————————————————————-
4,780 5,044
—————————————————————————-
—————————————————————————-

/T/

20. Subsequent Event:

On May 18, 2017, the Board of Directors declared a quarterly cash dividend of
$0.10 per share on its Common Shares, payable on June 15, 2017, to all
shareholders of record at the close of business on June 7, 2017.

– END RELEASE – 19/05/2017

For further information:
Computer Modelling Group Ltd.
Kenneth M. Dedeluk
President & CEO
(403) 531-1300
[email protected]
OR
Computer Modelling Group Ltd.
Sandra Balic
Vice President, Finance & CFO
(403) 531-1300
[email protected]
www.cmgl.ca

COMPANY:
FOR: COMPUTER MODELLING GROUP LTD.
TSX SYMBOL: CMG

INDUSTRY: Computers and Software – Software, Energy and Utilities –
Equipment
RELEASE ID: 20170519CC0003

Press Release from Marketwired 1-866-736-3779

All press releases are written by the client and have NO affiliation with the news copy written by The Canadian Press. Any questions that arise due to the content or information provided in the press release should be directed to the company/organization
issuing the release, not to The Canadian Press.

GET ENERGYNOW’S DAILY EMAIL FOR FREE


Bonterra Energy Corp. Announces Approval of All Resolutions at Annual and Special Meeting of Shareholders and Voting Results

FOR: BONTERRA ENERGY CORP.TSX SYMBOL: BNEDate issue: May 19, 2017Time in: 7:00 AM eAttention:
CALGARY, ALBERTA–(Marketwired – May 19, 2017) – Bonterra Energy Corp.
(www.bonterraenergy.com) (TSX:BNE) announced that at its annual and special
meeting of…

GET ENERGYNOW’S DAILY EMAIL FOR FREE


PSAC Applauds Government of Alberta for Loans to Create Jobs in Beleaguered Oil and Gas Services Sector

Calgary, Alberta – The Petroleum Services Association of Canada (PSAC) welcomes the announcement today by the Government of Alberta of a $235 million loan to the Orphan Well Association (OWA) that will accelerate the decommissioning of orphan wells and sites and get oilfield services workers back to work. “PSAC is pleased that our intense advocacy … Read more

GET ENERGYNOW’S DAILY EMAIL FOR FREE


Alberta aims to speed up orphan well clean up with $235-million loan

CARSTAIRS, Alta. — Alberta’s NDP government is trying to speed up the cleanup of old, orphaned oil and gas wells with a $235-million loan.

The province announced legislation Thursday that will allow it to lend the money to the Orphan Well Association.

The industry-funded, not-for-profit group manages the shutting and cleanup of oil and gas sites where there is no longer anyone legally responsible for those tasks, often because a company has gone out of business.

“The number of orphaned wells in Alberta is a growing problem that has been made much worse by the collapse in oil prices,” Alberta Premier Rachel Notley said at a rural property north of Calgary.

A well was first drilled on the land just outside Carstairs, Alta., in 1980 and passed through the hands of 10 different owners over the years. It was orphaned in October 2015. A storage tank and pumpjack still remain even though nothing is being produced.

Notley said $30 million earmarked in the recent federal budget will cover the interest costs of its loan, which it expects to be repaid over 10 years.

“By using this funding from the federal government to backstop a loan this large, we’re able to get much more favourable rates than the Orphan Well Association could access on its own,” she said.

The repayment will come out of the association’s existing levy. Its budget is set to double from $30 million to $60 million in the 2019-20 fiscal year.

The idea came up when Prime Minister Justin Trudeau met Notley, other provincial officials and the industry in February 2016.

The province estimates the loan will help create up to 1,650 new jobs over the next three years. Work could begin as early as the summer.

As of March, the Orphan Well Association had a list of 2,084 wells to be dealt with. It closed 185 last year.

To date, industry spent $250 million to reclaim 600 sites, said association chair Brad Herald.  

“The government of Alberta’s assistance will accelerate that work, returning properties to their original state at a much faster pace.”  

In Alberta there are 83,000 inactive wells, which are no longer producing but not necessarily orphaned.

There are another 69,000 abandoned wells, which have been plugged, cut and capped so that they’re safe.  

The Petroleum Services Association of Canada lobbied for government funds to accelerate the decommissioning of dormant wells. It initially asked Ottawa for $500 million in infrastructure spending, but later amended its request.

PSAC president and CEO Mark Salkeld welcomed the loan, especially while costs are low and workers are available.

“The funding and strategies announced today will go a long way in helping PSAC members retain and rehire employees, keep equipment active and at the same time ramp up the efforts required to take care of oil and gas wells that no longer have owners.”

The move helps address the major environmental risk that comes with having so many neglected wells, said Nikki Way, an analyst at the Pembina Institute, an environmental think-tank.

“It’s a positive step in addressing the problem of orphan wells and we look forward to seeing more proactive rules to ensure that there are adequate funds collected in the future.”

Lauren Krugel, The Canadian Press

GET ENERGYNOW’S DAILY EMAIL FOR FREE


Crew Energy Inc. Announces Annual Meeting Results for Election of Directors

FOR: CREW ENERGY INC.TSX SYMBOL: CRDate issue: May 18, 2017Time in: 7:47 PM eAttention:
CALGARY, ALBERTA–(Marketwired – May 18, 2017) – Crew Energy Inc. (TSX:CR)
(“Crew” or “the Company”) is pleased to announce the voting results for the
election of …

GET ENERGYNOW’S DAILY EMAIL FOR FREE


Canadian Equipment Rentals Corp. Announces Stock Option Grants

FOR: CANADIAN EQUIPMENT RENTALS CORP.TSX VENTURE SYMBOL: CFLDate issue: May 18, 2017Time in: 7:30 PM eAttention:
CALGARY, ALBERTA–(Marketwired – May 18, 2017) – Canadian Equipment Rentals
Corp. (the “Company”) (TSX VENTURE:CFL) announces that today o…

GET ENERGYNOW’S DAILY EMAIL FOR FREE


Trudeau talks tech with Washington governor; pipeline protesters gather outside

SEATTLE — Prime Minister Justin Trudeau continued his efforts to promote Canada’s technology sector to officials in Washington state on Thursday, meeting with Gov. Jay Inslee a day after attending the secretive Microsoft CEO Summit.

Trudeau and Inslee discussed, among other issues, the development of the Cascadia Innovation Corridor, an initiative that aims to strengthen technology industry ties between British Columbia and Washington.

The pair also spoke about trade and investment opportunities and innovation in the energy sector, said Trudeau’s office. In brief remarks before the meeting, the prime minister said Washington and Canada share a lot in common.

“We’re both strongly engaged on issues of climate change, on issues of openness to trade, on leadership on refugees as well and an understanding that diversity can be a real source of strength,” he said.

Inslee said the state and country share an “incredible commitment” to defeating climate change and a recognition that they can grow their economies at the same time.

“It is a great pleasure to know we have a national leader in the North American economy that is committed to that,” he said.

But protesters clad in yellow hazardous material suits that read “Keystone XL Toxic Cleanup Crew” gathered outside the hotel to criticize Trudeau’s environmental record, arguing his support of pipelines is at odds with any global warming promises he has made.

Chanting “Tar sands or clean lands, Trudeau you have a choice,” the group of about a dozen people demanded that the prime minister rescind his support of Keystone XL and the Trans Mountain expansion, two pipelines that have generated considerable debate in the U.S.

Janene Hampton of the Colville Okanagan Tribe in northern Washington said Trudeau claims he cares about indigenous people yet he sides with companies that want to build pipelines that threaten the water sources of Aboriginal Peoples.

“He’s approving these pipelines and the things that they’re asking for. He’s supporting the corporations. He says that he’s an indigenous peoples’ ally. Well, that’s not being an ally,” she said.

Protester Mike Foster said he’s especially concerned about the Trans Mountain pipeline expansion from Alberta to the West Coast and the impact that increased tanker traffic will have on Washington state’s endangered killer whale population.

“We have 78 orca whales left in Puget Sound and the number of tankers coming through these waters would be increased 700 per cent,” he said.

Kinder Morgan Canada’s $7.4 billion pipeline expansion, approved by Trudeau’s government last year, would increase the number of tankers in coastal waters seven-fold, from about five per month to 34 per month.

In 2015, former U.S. president Barack Obama rejected the Keystone XL pipeline, which would run from Alberta to Nebraska, but President Donald Trump overturned the decision this year.

After leaving Seattle, Trudeau was set to visit video-game producer Electronic Arts’ Capture Lab in Burnaby, B.C. The lab allows the company to record human movement, upon which it can model its animated characters.

On Wednesday, he addressed the closed-door CEO Summit at Microsoft’s sprawling headquarters in Redmond, just outside Seattle. His office said he was there to promote investment in Canada’s technology sector and draw global talent north.

— Follow @ellekane on Twitter.

Laura Kane, The Canadian Press

GET ENERGYNOW’S DAILY EMAIL FOR FREE


Pine Cliff Energy Ltd. Announces Results of Shareholders’ Meeting and Stock Option Grant

FOR: PINE CLIFF ENERGY LTD.TSX SYMBOL: PNEDate issue: May 18, 2017Time in: 7:27 PM eAttention:
CALGARY, ALBERTA–(Marketwired – May 18, 2017) – Pine Cliff Energy Ltd. (“Pine
Cliff” or the “Company”) (TSX:PNE) is pleased to announce all matters present…

GET ENERGYNOW’S DAILY EMAIL FOR FREE


Blackbird Energy Inc. Provides Operations Update Regarding Its Previous Completion Programs, Its Planned Capital Program at Pipestone and the Roll-Out of Stage Completions

FOR: BLACKBIRD ENERGY INC.TSX VENTURE SYMBOL: BBIDate issue: May 18, 2017Time in: 7:23 PM eAttention:
CALGARY, ALBERTA–(Marketwired – May 18, 2017) – Blackbird Energy Inc.
(“Blackbird” or the “Company”) (TSX VENTURE:BBI) is pleased to provide an
oper…

GET ENERGYNOW’S DAILY EMAIL FOR FREE


Prairie Provident Announces Voting Results from Annual Meeting of Shareholders

FOR: PRAIRIE PROVIDENT RESOURCES INC.
TSX SYMBOL: PPR

Date issue: May 18, 2017
Time in: 6:48 PM e

Attention:

CALGARY, ALBERTA–(Marketwired – May 18, 2017) – Prairie Provident Resources
Inc. (“Prairie Provident” or the “Company”) (TSX:PPR) is pleased to announce
the results of shareholder voting at its annual meeting held May 18, 2017, at
which resolutions re-electing the board of directors and appointing the
Company’s auditors were approved. Approximately 71.9% of the common shares
outstanding were represented in person or by proxy at the meeting. The detailed
voting results are set out below.

Election of Directors

Each of the following seven nominees was elected as a director of Prairie
Provident for the ensuing year, to hold office until the close of the next
annual meeting of shareholders.

/T/

—————————————————————————-

Votes
Director Nominee Votes For Percent Withheld Percent
—————————————————————————-
Patrick McDonald (Chair) 77,274,267 94.2% 4,796,321 5.8%
—————————————————————————-
David Fitzpatrick 77,270,983 94.2% 4,799,605 5.8%
—————————————————————————-
Terence (Tad) Flynn 77,272,767 94.2% 4,797,821 5.8%
—————————————————————————-
Tim Granger 77,273,242 94.2% 4,797,346 5.8%
—————————————————————————-
Derek Petrie 77,540,161 94.5% 4,530,427 5.5%
—————————————————————————-
Ajay Sabherwal 77,268,442 94.2% 4,802,146 5.8%
—————————————————————————-
Rob Wonnacott 77,377,417 94.3% 4,693,171 5.7%
—————————————————————————-

/T/

Appointment of Auditors

Ernst & Young LLP were appointed as auditors of the Company for the ensuing
year, to hold office until the close of the next annual meeting of
shareholders.

/T/

—————————————————————————-

Votes
Votes For Percent Withheld Percent
—————————————————————————-
82,649,322 99.6% 326,849 0.4%
—————————————————————————-

/T/

About Prairie Provident

Prairie Provident is a Calgary-based company engaged in the exploration and
development of oil and natural gas properties in Alberta. The Company’s
strategy is to grow organically in combination with accretive acquisitions of
conventional oil prospects, which can be efficiently developed. Prairie
Provident’s operations are primarily focused at Wheatland and Princess in
Southern Alberta targeting the Ellerslie and the Lithic Glauc formations, along
with an early stage waterflood project at Evi in the Peace River Arch. Prairie
Provident protects its balance sheet through an active hedging program and
manages risk by allocating capital to opportunities offering maximum
shareholder returns.

– END RELEASE – 18/05/2017

For further information:
Prairie Provident Resources Inc.
Tim Granger
President and Chief Executive Officer
(403) 292-8110
[email protected]
www.ppr.ca

COMPANY:
FOR: PRAIRIE PROVIDENT RESOURCES INC.
TSX SYMBOL: PPR

INDUSTRY: Energy and Utilities – Oil and Gas
RELEASE ID: 20170518CC0115

Press Release from Marketwired 1-866-736-3779

All press releases are written by the client and have NO affiliation with the news copy written by The Canadian Press. Any questions that arise due to the content or information provided in the press release should be directed to the company/organization
issuing the release, not to The Canadian Press.

GET ENERGYNOW’S DAILY EMAIL FOR FREE


Tribes fighting pipeline drop appeal but battle continues

BISMARCK, N.D. — American Indian tribes who are still fighting the Dakota Access oil pipeline in court have dropped an appeal of a federal judge’s decision that allowed final construction to proceed on the project that is just two weeks from operating commercially.

U.S. District Judge James Boasberg in early March refused to stop completion of the pipeline based on the claims of Sioux tribes that it threatens water they consider sacred. The Cheyenne River Sioux appealed the decision to the U.S. Court of Appeals for the District of Columbia Circuit, which refused to grant an emergency order stopping oil from flowing while the appeal was decided.

Developer Energy Transfer Partners finished construction on the pipeline and began filling it with oil in late March. Spokeswoman Vicki Granado confirmed this week that the line fill process has been completed.

“Our commercial operations begin June 1, whereby we will begin transporting crude per our contracts with shippers,” she said.

With oil already in the line, Cheyenne River attorneys in late April submitted a motion to voluntarily dismiss their claim in the appeals court, and the motion was granted Monday.

The pipeline will move North Dakota oil 1,200 miles through South Dakota and Iowa to a distribution point in Illinois. ETP maintains the pipeline is safe, but the Cheyenne River, Standing Rock, Yankton and Oglala Sioux tribes in the Dakotas fear environmental harm. They’re continuing to fight the project in federal court in Washington, D.C., hoping to convince Boasberg to shut down the pipeline.

___

Follow Blake Nicholson on Twitter at https://twitter.com/NicholsonBlake

Blake Nicholson, The Associated Press

GET ENERGYNOW’S DAILY EMAIL FOR FREE


Petrus Resources Ltd. Announces Results of Directors Vote

FOR: PETRUS RESOURCES LTD.TSX SYMBOL: PRQDate issue: May 18, 2017Time in: 5:41 PM eAttention:
CALGARY, ALBERTA–(Marketwired – May 18, 2017) – Petrus Resources Ltd.
(“Petrus”) (TSX:PRQ) is pleased to announce that the nominees listed in Petrus’
inform…

GET ENERGYNOW’S DAILY EMAIL FOR FREE


Savanna Energy Services Corp. Announces Executive Appointment

FOR: SAVANNA ENERGY SERVICES CORP.
TSX SYMBOL: SVY

Date issue: May 18, 2017
Time in: 5:15 PM e

Attention:

CALGARY, ALBERTA–(Marketwired – May 18, 2017) – Savanna Energy Services Corp.
(“Savanna”) (TSX:SVY) is pleased to announce the appointment of Lyle Whitmarsh
as President of Savanna. Mr. Whitmarsh currently serves on the Board of
Directors of Savanna and will assume the duties of President effective June 1,
2017.

Mr. Whitmarsh is a seasoned industry executive with over 33 years of experience
in the oil and gas industry, most recently having served as President and Chief
Executive Officer of a TSX listed contract drilling company operating in
Canada, the United States and internationally.

Daniel Halyk, Chairman of Savanna and President & CEO of Total Energy Services
Inc. (“Total”), stated: “Mr. Whitmarsh brings a wealth of industry and
management experience to Savanna and I welcome the opportunity to work with
Lyle as Total completes the integration of Savanna into the Total corporate
family. Lyle’s strong operating knowledge and leadership skills will be of
significant value as we look to compete in the global energy industry.”

About Savanna

Savanna is a leading contract drilling and oilfield services company operating
in North America and Australia providing a broad range of drilling, well
servicing and related services.

The TSX has neither approved nor disapproved of the information contained
herein.

– END RELEASE – 18/05/2017

For further information:
Savanna Energy Services Corp.
Daniel Halyk
Chairman
(403) 216-3921

COMPANY:
FOR: SAVANNA ENERGY SERVICES CORP.
TSX SYMBOL: SVY

INDUSTRY: Energy and Utilities – Equipment, Energy and Utilities –
Oil and Gas
RELEASE ID: 20170518CC0103

Press Release from Marketwired 1-866-736-3779

All press releases are written by the client and have NO affiliation with the news copy written by The Canadian Press. Any questions that arise due to the content or information provided in the press release should be directed to the company/organization
issuing the release, not to The Canadian Press.

GET ENERGYNOW’S DAILY EMAIL FOR FREE


PetroMaroc Announces Grant of Stock Options

FOR: PETROMAROC CORPORATION PLCTSX VENTURE SYMBOL: PMADate issue: May 18, 2017Time in: 4:21 PM eAttention:
TORONTO, ONTARIO–(Marketwired – May 18, 2017) – PetroMaroc Corporation plc
(TSX VENTURE:PMA), an independent oil and gas company focused on Mor…

GET ENERGYNOW’S DAILY EMAIL FOR FREE


Appulse Corporation: Reporting results for the First Quarter of 2017

FOR: APPULSE CORPORATIONTSX VENTURE SYMBOL: APLDate issue: May 18, 2017Time in: 4:16 PM eAttention:
CALGARY, ALBERTA–(Marketwired – May 18, 2017) – Appulse Corporation
(“Appulse”) (TSX VENTURE:APL) today reported a net income of $14,000 for the
three…

GET ENERGYNOW’S DAILY EMAIL FOR FREE


Gen III Oil Corporation Announces Grant of Stock Options

FOR: GEN III OIL CORPORATIONTSX VENTURE SYMBOL: GIIIDate issue: May 18, 2017Time in: 4:14 PM eAttention:
VANCOUVER, BRITISH COLUMBIA–(Marketwired – May 18, 2017) – Gen III Oil
Corporation (the “Company”) (TSX VENTURE:GIII) announces that it has grant…

GET ENERGYNOW’S DAILY EMAIL FOR FREE


Computer Modelling Group Declares Quarterly Dividend

FOR: COMPUTER MODELLING GROUP LTD.
TSX SYMBOL: CMG

Date issue: May 18, 2017
Time in: 3:55 PM e

Attention:

CALGARY, ALBERTA–(Marketwired – May 18, 2017) – The Board of Directors of
Computer Modelling Group Ltd. (TSX:CMG) (“CMG” or the “Company”) announces a
dividend of $0.10 per Common Share on CMG’s Common Shares. The dividend will be
paid on June 15, 2017 to shareholders of record at the close of business on
June 7, 2017.

Computer Modelling Group Ltd. is a computer software technology and consulting
company serving the oil and gas industry. CMG, recognized by oil and gas
companies worldwide as a leading developer of reservoir modelling software, has
sales and technical support services based in Calgary, Houston, London, Dubai,
Bogota, and Kuala Lumpur. CMG is the leading supplier of advanced processes
reservoir modelling software in the world with a blue chip client base of
international oil companies and technology centers in approximately 60
countries. The Company’s shares are listed on the Toronto Stock Exchange under
the trading symbol “CMG.”

All dividends paid by Computer Modelling Group Ltd. to holders of Common Shares
in the capital of Computer Modelling Group Ltd. will be treated as eligible
dividends within the meaning of such term in section 89(1) of the Income Tax
Act (Canada), unless otherwise indicated.

– END RELEASE – 18/05/2017

For further information:
Kenneth M. Dedeluk
President & CEO
(403) 531-1300
[email protected]
OR
Sandra Balic
Vice President, Finance & CFO
(403) 531-1300
[email protected]
www.cmgl.ca

COMPANY:
FOR: COMPUTER MODELLING GROUP LTD.
TSX SYMBOL: CMG

INDUSTRY: Computers and Software – Software, Energy and Utilities –
Equipment
RELEASE ID: 20170518CC0084

Press Release from Marketwired 1-866-736-3779

All press releases are written by the client and have NO affiliation with the news copy written by The Canadian Press. Any questions that arise due to the content or information provided in the press release should be directed to the company/organization
issuing the release, not to The Canadian Press.

GET ENERGYNOW’S DAILY EMAIL FOR FREE


The B.C. Option For Pacific Oil And Gas Exports Nobody Has Ever Heard About – David Yager – Yager Management

          David Yager – Yager Management Ltd. Oilfield Service Management Consulting – Oil & Gas Writer – Energy Policy Analyst May 18, 2017 For an industry and province all but obsessed with its lack of pipeline access to Pacific tidewater, this is surely the most attractive oil and gas export option … Read more

GET ENERGYNOW’S DAILY EMAIL FOR FREE


Nancy Southern to Be Inducted Into the Canadian Business Hall of Fame

FOR: ATCO LTD.
TSX SYMBOL: ACO.X
TSX SYMBOL: ACO.Y

Date issue: May 18, 2017
Time in: 12:33 PM e

Attention:

CALGARY, ALBERTA–(Marketwired – May 18, 2017) – Today, after leading her
company through unprecedented global growth over more than a decade, ATCO’s
Chair, President & Chief Executive Officer, Nancy Southern, will be inducted as
a Companion into the Canadian Business Hall of Fame. Ms. Southern follows in
the footsteps of her father and ATCO’s founder, R.D. Southern, an international
business pioneer who was inducted into the Canadian Business Hall of Fame 22
years ago.

“It is a singular honour for me to accept this recognition on behalf of the
people of ATCO, for it is truly their collective commitment that has allowed
ATCO to excel,” said Ms. Southern. “I am humbled by the legendary
accomplishments of the leaders of industry who are past and present recipients
of this award and I feel truly privileged to be named alongside them.”

Ms. Southern was appointed Chair of ATCO and its subsidiary, Canadian
Utilities, in December 2012 and has been President & Chief Executive Officer of
ATCO since January 2003. Over the course of her career, she has served with
some of the world’s most prestigious and influential organizations. She is a
member of The U.S. Business Council, a member of the American Society of
Corporate Executives, and a Canadian member of The Trilateral Commission. She
is also a member of the Premier of Alberta’s Advisory Committee on the Economy,
the Business Council of Canada, and the Rideau Hall Foundation Board of
Directors.

In addition to her exceptional business leadership, Ms. Southern has long
played a leading role in advocating on a range of social issues – most notably,
the rights of Canada’s Indigenous peoples and the role of women in business.
She is an Honorary Chief of the Kainai (Blood Tribe of Alberta) and was given
the name Aksistoowa’paakii, or Brave Woman in 2012. In 2015, at the request of
German Chancellor Angela Merkel, Ms. Southern joined 100 other global leaders
for the G7 Forum for Dialogue with Women in Berlin.

With approximately 7,000 employees and assets of $20 billion, ATCO is a
diversified global corporation delivering service excellence and innovative
business solutions in Structures & Logistics (workforce housing, innovative
modular facilities, construction, site support services, and logistics and
operations management); Electricity (electricity generation, transmission, and
distribution); Pipelines & Liquids (natural gas transmission, distribution and
infrastructure development, energy storage, and industrial water solutions);
and Retail Energy (electricity and natural gas retail sales). More information
can be found at www.ATCO.com.

– END RELEASE – 18/05/2017

For further information:
Media Inquiries:
Spencer Forgo
Manager, External Communications
(403) 662-8467

COMPANY:
FOR: ATCO LTD.
TSX SYMBOL: ACO.X
TSX SYMBOL: ACO.Y

INDUSTRY: Energy and Utilities – Equipment, Energy and Utilities –
Utilities, Manufacturing and Production – Packaging and Containers,
Energy and Utilities – Pipelines
RELEASE ID: 20170518CC0064

Press Release from Marketwired 1-866-736-3779

All press releases are written by the client and have NO affiliation with the news copy written by The Canadian Press. Any questions that arise due to the content or information provided in the press release should be directed to the company/organization
issuing the release, not to The Canadian Press.

GET ENERGYNOW’S DAILY EMAIL FOR FREE


2017 First Quarter Financial & Operating Results

FOR: PAN ORIENT ENERGY CORP.
TSX VENTURE SYMBOL: POE

Date issue: May 18, 2017
Time in: 8:30 AM e

Attention:

CALGARY, ALBERTA–(Marketwired – May 18, 2017) – Pan Orient Energy Corp. (“Pan
Orient”) (TSX VENTURE:POE) reports 2017 first quarter consolidated financial
and operating results. Please note that all amounts are in Canadian dollars
unless otherwise stated and BOPD refers to barrels of oil per day.

The Corporation is today filing its unaudited consolidated financial statements
as at and for the three months ended March 31, 2017 and related management’s
discussion and analysis with Canadian securities regulatory authorities. Copies
of these documents may be obtained online at www.sedar.com or the Corporation’s
website, www.panorient.ca.

Commenting today on Pan Orient’s 2017 first quarter results, President and CEO
Jeff Chisholm stated: “Despite the recent weather related delay to the
commencement of drilling of the AYU-1X exploration well at the East Jabung PSC
in Sumatra, Indonesia, significant progress has been made towards the drilling
of this prospect with the access road completed in March and the first phase of
rig mobilization started on May 8th”.

2017 FIRST QUARTER HIGHLIGHTS

/T/

— The AYU-1X exploration well at the Anggun prospect of the East Jabung

Production Sharing Contract (“PSC”) is estimated to commence drilling
late in the second quarter of 2017.

— The Batu Gajah PSC expired on January 15, 2017. Information on nearby

wells indicated that the Akeh-1 accumulation was much more complex and
substantially smaller than first believed and highly unlikely to achieve
commercial thresholds set by the Government of Indonesia, as a result,
Pan Orient elected not to drill the Akeh-2 appraisal well and allowed
the PSC to expire.

— Oil sales, net to Pan Orient’s 50.01% equity interest in the Thailand

Joint Venture, were 245 BOPD in the first quarter of 2017 and generated
$0.9 million in funds flow from operations ($40.79 per barrel).

— The 2017 Thailand capital program will include one exploration well and

a multi-well work-over program.

— Total corporate funds flow used in operations in the first quarter of

2017 was $0.2 million and the net loss attributable to common
shareholders was $1.5 million.

— Pan Orient continues to maintain a strong financial position for

upcoming planned exploration activities during 2017 at the East Jabung
PSC in Indonesia and at Concession L53 in Thailand with working capital
and non-current deposits at March 31, 2017 of $47.3 million and no long-
term debt.

/T/

2017 FIRST QUARTER OPERATING RESULTS

/T/

— Net loss attributable to common shareholders for the first quarter of

2017 was $1.5 million ($0.03 loss per share) compared to a net loss
attributable to common shareholders of $2.2 million ($0.04 per share) in
the first quarter of 2016.

— For the first quarter of 2017, the Company reported total corporate

funds flow used in operations, which includes the economic results of
the 50.01% equity interest in the Thailand joint venture, of $0.2
million ($0.04 loss per share). This compares with total corporate funds
flow from operations for the fourth quarter of 2016 of $1.2 million
($0.02 per share). This change is primarily due to a reduction in
foreign exchange losses and a recovery of income tax in Canada.

— Pan Orient reports capital expenditures of $0.9 million in the first

quarter of 2017, with $0.7 million in Indonesia at the East Jabung PSC
and $0.2 million in Canada related to the operations at the Sawn Lake
Steam Assisted Gravity Drainage (“SAGD”) project of Andora. In addition,
Pan Orient’s share of Thailand joint venture capital expenditures was
$0.1 million, which was recorded in Investment in Thailand Joint
Venture.

— At March 31, 2017 Pan Orient had $47.3 million of working capital and

non-current deposits. Working capital and non-current deposits consisted
of $44.4 million of cash, $4.3 million of non-current deposits, $0.1
million of Canadian taxes receivable, other receivables of $0.4 million
and net of accounts payable of $1.9 million. In addition, Pan Orient’s
Investment in Thailand Joint Venture includes $3.1 million of Thailand
working capital and non-current deposits and $2.0 million of equipment
inventory to be utilized for future Thailand Joint Venture operations.

— Pan Orient had outstanding capital commitments as at March 31, 2017 of

$2.0 million in Indonesia associated with the Company’s 49%
participating interest in the East Jabung PSC. In Canada, capital
commitments are $0.2 million with respect to contracted natural gas
pipeline tie-in and tariff charges associated with the Sawn Lake SAGD
demonstration project of Andora that continue until October 2018.

— Pan Orient renewed the normal course issuer bid in April 2017 and Pan

Orient is authorized to purchase, for cancellation, up to 4,512,964 of
its common shares during the period from April 12, 2017 to April 12,
2018. No common shares have been repurchased under the renewed normal
course issuer bid.

— Results Net to Pan Orient’s 50.01% Interest in the Thailand Joint

Venture for Concession L53

— Pan Orient holds a 50.01% equity interest in Pan Orient Energy
(Siam) Ltd. (“POS”) which is classified in the financial statements
as a jointly controlled Joint Venture and Pan Orient’s 50.01% equity
interest in the working capital, assets, capital expenditures,
liabilities and operations of POS are recorded as Investment in
Thailand Joint Venture.

— Average oil sales of 245 BOPD during the first quarter of 2017
generated $0.9 million in funds flow from operations, or $40.79 per
barrel. This compares to 290 BOPD in the fourth quarter of 2016 (a
16% decrease) and $37.30 per barrel in funds flow from operations (a
9% increase). The average realized sales price per barrel increased
from $60.22 in the fourth quarter of 2016 to $65.50 in the first
quarter of 2017.

— Per barrel amounts during the first quarter of 2017 represented a
realized price for oil sales of $65.50, transportation expenses of
$1.59, operating expenses of $10.77, general and administrative
expenses of $9.18 and a 5% royalty to the Thailand government of
$3.23. Oil sales revenue during this period was allocated 33% to
expenses for transportation, operating, and general &
administrative, 5% to the government of Thailand for royalties, and
62% to the Thailand Joint Venture. No Thailand petroleum income
taxes or Special Remuneratory Benefit tax was recorded during the
quarter.

— Oil sales in April 2017 at Concession L53 were 241 BOPD.

— POS received approval for the 1.96 square kilometer L53-B production
license in April 2017 and is currently about to commence the
approximately six month production Environmental Impact Assessment
that is required prior to the start of production.

— Indonesia

— At the East Jabung PSC, where Pan Orient is non-operator with a 49%
ownership interest, preparations are underway for the drilling of
the AYU-1X exploration well at the Anggun prospect pursuant to the
terms of the 2015 farm-out agreement. The access road was completed
in March and the first phase of rig mobilization started on May 8,
2017.

— Capital expenditures of $0.7 million during the first quarter of
2017 related to seismic reprocessing at the East Jabung PSC.

— The Batu Gajah PSC, where Pan Orient was operator with a 77%
ownership interest, expired on January 15, 2017. As a result, the
Company reported in the fourth quarter of 2016 a $102.3 million
impairment charge of Batu Gajah Exploration and Evaluation assets,
offset by a $22.6 million associated reduction in accumulated other
comprehensive income related to foreign currency translation
resulting in a net impairment expense of $79.7 million.

— Sawn Lake Alberta Heavy Oil (Operated by Andora, in which Pan Orient has

a 71.8% ownership)

— Andora is completing detailed engineering for its proprietary
Thermal System and Process for Producing Steam from Oilfield
Produced Water (“Produced Water Boiler”).

— An application for a potential expansion at the demonstration
project site to 3,200 BOPD was submitted in April 2016 and Andora is
awaiting approval of the application. It is expected that a
reactivation of the demonstration project facility and wellpair
would be part of a potential commercial expansion to 3,200 BOPD. The
expansion application requests the drilling of up to seven
additional SAGD wellpairs which are tied into the existing
demonstration project facility. The facility would be expanded to
generate the additional necessary steam, and it is anticipated that
additional steam generation would include the test installation of
Andora’s proprietary produced water boiler. Andora believes that its
produced water boiler could achieve significant benefits for Sawn
Lake SAGD field development. An expansion is dependent on regulatory
approval, completion of detailed engineering and a higher commodity
price environment to support project economics and financing.

— Capital expenditures for the Sawn Lake project during the first
quarter of 2017 were $0.2 million related to drilling of a core well
associated with lease retention, engineering design work associated
with the Produced Water Boiler, and capitalized expenses during the
quarter.

/T/

OUTLOOK

INDONESIA

East Jabung PSC, Onshore Sumatra Indonesia (Pan Orient 49% ownership & Non
Operator)

Drilling of the AYU-1X exploration well, the first exploration well at the
Anggun prospect of the East Jabung PSC, is now estimated to commence
approximately late in the second quarter of 2017. The results of the AYU-1X
exploration well will have a significant impact on Pan Orient’s future
strategy, which will be addressed upon completing analysis after the drilling
of the AYU-1X well.

THAILAND

Concession L53 Onshore (Pan Orient Energy (Siam) Ltd., in which Pan Orient has
50.01% ownership)

The 2017 Thailand capital program will include one exploration well in
approximately the third quarter of 2017 and well work-overs throughout the
remainder of the year.

CANADA

Sawn Lake (Operated by Andora, in which Pan Orient has a 71.8% ownership)

Pan Orient continues to move forward with long lead time steps towards
potential future development at Sawn Lake. It is recognized that the need for
stable crude oil prices, and specifically higher Western Canada Select
reference prices, will have a significant impact on any decision regarding the
timing and extent of future development. The first steps will be receiving
approval for the Sawn Lake expansion and completing detailed engineering for
Andora’s proprietary Produced Water Boiler.

Corporate

Pan Orient continues to maintain a strong cash balance denominated mainly in
United States dollar deposits that will allow the Company to conduct key
exploration and development activities and ensure financial flexibility. During
2017, Pan Orient will continue to review its worldwide exploration and
development asset portfolio with the aim of maximizing corporate value and the
best allocation of its significant financial resources. These activities range
from the potential divestment of existing assets to the ongoing screening of
new venture and corporate opportunities.

Pan Orient is a Calgary, Alberta based oil and gas exploration and production
company with operations currently located onshore Thailand, Indonesia and in
Western Canada.

This news release contains forward-looking information. Forward-looking
information is generally identifiable by the terminology used, such as
“expect”, “believe”, “estimate”, “should”, “anticipate” and “potential” or
other similar wording. Forward-looking information in this news release may
include, but is not limited to, references to: renewal, extension or
termination of oil concessions and production sharing contracts; other
regulatory approvals; well drilling programs and drilling plans; the benefits
of patented technology; estimates of reserves and potentially recoverable
resources, information on future production and project start-ups; potential
purchases of common shares under the normal course issuer bid; and sufficiency
of financial resources. By their very nature, the forward-looking statements
contained in this news release require Pan Orient and its management to make
assumptions that may not materialize or that may not be accurate. The
forward-looking information contained in this news release is subject to known
and unknown risks and uncertainties and other factors, which could cause actual
results, expectations, achievements or performance to differ materially,
including without limitation: imprecision of reserve estimates and estimates of
recoverable quantities of oil, changes in project schedules, operating and
reservoir performance, the effects of weather and climate change, the results
of exploration and development drilling and related activities, demand for oil
and gas, commercial negotiations, other technical and economic factors or
revisions and other factors, many of which are beyond the control of Pan
Orient. Although Pan Orient believes that the expectations reflected in its
forward-looking statements are reasonable, it can give no assurances that the
expectations of any forward-looking statements will prove to be correct.

Neither TSX Venture Exchange nor its Regulation Services Provider (as that term
is defined in the policies of the TSX Venture Exchange) accepts responsibility
for the adequacy or accuracy of this release.

/T/

—————————
Three Months Ended
Financial and Operating Summary March 31,
——————-
(thousands of Canadian dollars except where %
indicated) 2017 2016 Change
—————————————————————————-
FINANCIAL
—————————————————————————-
Financial Statement Results – Excluding 50.01%
Interest in Thailand Joint Venture (Note 1)
Net loss attributed to common shareholders (1,514) (2,221) -32%
Per share – basic and diluted $ (0.03) $ (0.04) -31%
Cash flow from operating activities (Note 2) (1,730) (197) 778%
Per share – basic and diluted $ (0.03) $ (0.00) 100%
Cash flow used in investing activities (Note 2) (807) (2,340) -66%
Per share – basic and diluted $ (0.01) $ (0.04) -63%
Working capital 43,018 49,006 -12%
Working capital & non-current deposits 47,344 53,151 -11%
Long-term debt – –
Shares outstanding (thousands) 54,885 54,885 0%
Capital Commitments (Note 3) 2,212 2,635 16%
Contingencies (Note 4)
—————————————————————————-
Working Capital and Non-current Deposits
Beginning of period 49,818 79,160 -37%
Funds flow used in operations (excluding
Thailand Joint Venture) (1,085) (2,409) -55%
Special Distribution (Note 6) – (21,954) -100%
Consolidated capital expenditures (Note 7) (937) (1,626) -42%
Amounts advanced to Thailand Joint Venture 24 (20) -220%
Disposal of petroleum and natural gas assets
(Note 8) – 105 -100%
Settlement of decommissioning liabilities (430) – 100%
Foreign operations – unrealized foreign
exchange impact (46) (105) -56%
—————————
End of period 47,344 53,151 -11%
—————————————————————————-
—————————————————————————-
Economic Results – Including 50.01% Interest in
Thailand Joint Venture (Note 9)
Total corporate funds flow used in operations
(Note 5) (172) (2,066) -92%
Per share – basic and diluted $ (0.00) $ (0.04) -92%
Total corporate funds flow used in operations by
region (Note 5)
Canada (Note 10) (589) (2,189) -73%
Thailand (Notes 11) (15) (8) 88%
Indonesia (481) (212) 127%
—————————
Funds flow used in operations (excluding
Thailand Joint Venture) (1,085) (2,409) -55%
Share of Thailand Joint Venture (Note 9) 913 343 166%
—————————
Total corporate funds flow used in operations (172) (2,066) -92%
————————————————-===========================
Petroleum and natural gas properties
Capital expenditures (Note 7) 1,031 1,653 -38%
Disposition (Note 8) – (105) -100%
Capital Expenditures (Note 7)
Canada (Note 10) 235 1,071 -78%
Indonesia 702 555 26%
—————————
Consolidated capital expenditures 937 1,626 -42%
Share of Thailand Joint Venture capital
expenditures 94 27 248%
—————————
Total capital expenditures 1,031 1,653 -38%
—————————————————————————-
—————————————————————————-
Investment in Thailand Joint Venture
—————————————————————————-
Beginning of period 32,795 35,088 -7%
Net loss from Joint Venture (178) (558) -68%
Other comprehensive gain (loss) from Joint
Venture 723 (1,073) -167%
Amounts advanced to (received from) Joint
Venture (24) 20 -220%
—————————
End of period 33,316 33,477 0%
—————————————————————————-
—————————————————————————-

—————————
Three Months Ended
March 31,
——————-
(thousands of Canadian dollars except where
indicated) 2017 2016 Change
—————————————————————————-
Thailand Operations
—————————————————————————-
Economic Results – Including 50.01% Interest in
Thailand Joint Venture from February 2, 2015
onwards (Note 9)
Oil sales (bbls) 22,014 24,442 -10%
Average daily oil sales (BOPD) by Concession L53 245 269 -9%
Average oil sales price, before transportation
(CDN$/bbl) $ 65.50 $ 37.07 77%
Reference Price (volume weighted) and
differential
Crude oil (Brent $US/bbl) $ 53.72 $ 33.53 60%
Exchange Rate $US/$Cdn 1.35 1.40 -4%
Crude oil (Brent $Cdn/bbl) $72.58 $ 47.05 54%
Sale price / Brent reference price 90% 79% 15%
Funds flow from (used in) operations (Note 5)
Crude oil sales 1,442 906 59%
Government royalty (71) (45) 58%
Transportation expense (35) (36) -3%
Operating expense (237) (300) -21%
—————————
Field netback 1,099 525 109%
General and administrative expense (Note 12) (202) (191) 6%
Interest income 1 -100%
Foreign exchange loss 1 – 100%
—————————
Thailand – Funds flow from operations 898 335 168%
—————————
—————————
Funds flow from (used in) operations / barrel
(CDN$/bbl) (Note 5)
Crude oil sales $ 65.50 $ 37.07 77%
Government royalty (3.23) (1.84) 75%
Transportation expense (1.59) (1.47) 8%
Operating expense (10.77) (12.27) -12%
—————————
Field netback 49.92 21.48 132%
General and administrative expense (Note 12) (9.18) (7.81) 17%
Interest Income – 0.04 -100%
Foreign exchange loss 0.05 – 100%
—————————
Thailand – Funds flow from operations $ 40.79 $ 13.71 198%
—————————
—————————
Government royalty as percentage of crude oil
sales 5% 5% 0%
Income tax & SRB as percentage of crude oil sales – – 0%
As percentage of crude oil sales
Expenses – transportation, operating, G&A and
other 33% 58% -25%
Government royalty, SRB and income tax 5% 5% 0%
Funds flow from operations, before interest
income 62% 37% 25%
—————————————————————————-
Financial Statement PresentationResults –
Excluding 50.01% Interest in Thailand Joint
Venture from February 2, 2015 onwards (Note 1)
General and administrative expense (Notes 11 &
12) (15) (8) 88%
—————————
Funds flow from (used in) consolidated
operations (15) (8) 88%
—————————
—————————
Fund flow Included in Investment in Thailand
Joint Venture
Net loss from Thailand Joint Venture (178) (558) -68%
Add back non-cash items in net loss 1,091 901 21%
—————————
Funds flow from Thailand Joint Venture 913 343 166%
—————————
—————————
Thailand – Economic funds flow from operations
(Note 9) 898 335 168%
—————————————————————————-
—————————————————————————-
Canada Operations (Note 10)
—————————————————————————-
Interest income 59 46 28%
General and administrative expenses (Note 12) (560) (467) 20%
Foreign exchange loss (236) (1,187) -80%
Current income tax 148 (581) -125%
—————————
Canada – Funds flow used in operations (589) (2,189) -73%
—————————————————————————-
Indonesia Operations
—————————————————————————-
General and administrative expense (Note 12) (499) (170) 194%
Exploration expense (Note 13) (5) (114) -96%
Foreign exchange gain 23 72 -68%
—————————
Indonesia – Funds flow used in operations (481) (212) 127%
—————————————————————————-
—————————————————————————-
(1) Pan Orient holds a 50.01% equity interest in Pan Orient Energy (Siam)
Ltd. as a joint arrangement where the Company shares joint control with
the 49.99% equity interest holder. The resulting joint arrangement is
classified as a Joint Venture under IFRS 11 and is accounted for using
the equity method of accounting where Pan Orient’s 50.01% equity
interest in the assets, liabilities, working capital, operations and
capital expenditures of Pan Orient Energy (Siam) Ltd. are recorded in
Investment in Thailand Joint Venture.

(2) As set out in the Consolidated Statements of Cash Flows in the

unaudited Interim Condensed Consolidated Financial Statements of Pan
Orient Energy Corp.

(3) Refer to Commitments in Note 11 of the March 31, 2017 Notes to the

unaudited Interim Condensed Consolidated Financial Statements and Note
10 of the March 31, 2016 Notes to the unaudited Interim Condensed
Consolidated Financial Statements.

(4) Refer to Contingencies in Note 12 of the March 31, 2017 Notes to the

unaudited Interim Condensed Consolidated Financial Statements and Note
11 of the March 31, 2016 Notes to the unaudited Interim Condensed
Consolidated Financial Statements.

(5) Total corporate funds flow from operations is cash flow from operating

activities prior to changes in non-cash working capital and
decommissioning expenditures plus the corresponding amount from the
Thailand operations which is recorded in Joint Venture for financial
statement purposes. This measure is used by management to analyze
operating performance and leverage. Funds flow as presented does not
have any standardized meaning prescribed by IFRS and therefore it may
not be comparable with the calculation of similar measures of other
entities. Funds flow is not intended to represent operating cash flow
or operating profits for the period nor should it be viewed as an
alternative to cash flow from operating activities, net earnings or
other measures of financial performance calculated in accordance with
IFRS.

(6) On February 16, 2016, the Company paid a return of capital special

distribution of $0.40 per share to common shareholders.

(7) Cost of capital expenditures, excluding decommissioning provision and

the impact of changes in foreign exchange rates.

(8) In 2016, the joint venture partners in Andora’s Sawn Lake SAGD

demonstration project purchased the SAGD reservoir data.

(9) For the purpose of providing more meaningful economic results from

operations for Thailand, and for comparison to previous periods, the
amounts presented include 50.01% of results of the Thailand Joint
Venture.

(10) The Sawn Lake project in Alberta has not yet proven that it is

commercially viable and all related costs and revenues are being
capitalized as exploration and evaluation assets until commercial
viability is achieved.

(11) The nominal amount of G&A shown in the first quarters of 2016 and 2017

for Thailand operations related to G&A of the holding company of Pan
Orient Energy (Siam) Ltd.

(12) General & administrative expenses, excluding non-cash accretion on

decommissioning provision and stock-based payments.

(13) Exploration expense relates to exploration costs associated with the

Citarum and Batu Gajah PSCs in Indonesia.

(14) Tables may not add due to rounding.

/T/

– END RELEASE – 18/05/2017

For further information:
Pan Orient Energy Corp.
Jeff Chisholm
President and CEO (located in Bangkok, Thailand)
[email protected]
OR
Pan Orient Energy Corp.
Bill Ostlund
Vice President Finance and CFO
(403) 294-1770, Extension 233

COMPANY:
FOR: PAN ORIENT ENERGY CORP.
TSX VENTURE SYMBOL: POE

INDUSTRY: Energy and Utilities – Oil and Gas
RELEASE ID: 20170518CC0024

Press Release from Marketwired 1-866-736-3779

All press releases are written by the client and have NO affiliation with the news copy written by The Canadian Press. Any questions that arise due to the content or information provided in the press release should be directed to the company/organization
issuing the release, not to The Canadian Press.

GET ENERGYNOW’S DAILY EMAIL FOR FREE


Pennine closes private placement, signs credit facility with Ionian Refining and Trading Company BVI

FOR: PENNINE PETROLEUM CORPORATIONTSX VENTURE SYMBOL: PNNDate issue: May 18, 2017Time in: 7:01 AM eAttention:
CALGARY, ALBERTA–(Marketwired – May 18, 2017) –
NOT FOR DISTRIBUTION TO U.S. NEWSWIRE SERVICES OR FOR DISSEMINATION IN THE
UNITED STATES
Pen…

GET ENERGYNOW’S DAILY EMAIL FOR FREE


Solar Alliance Targets Massachusetts as First New Market Under Crius Solar Origination Agreement

FOR: SOLAR ALLIANCE ENERGY INC.OTC PINK Symbol: SAENFDate issue: May 18, 2017Time in: 6:00 AM eAttention:
Expansion will drive significant new sales volume
VANCOUVER, BC –(Marketwired – May 18, 2017) – Solar Alliance Energy Inc.
(‘Solar Alliance’) o…

GET ENERGYNOW’S DAILY EMAIL FOR FREE


Sunshine Oilsands Ltd.: Increase in Shareholding in the Company by Chairman and Major Shareholder

FOR: SUNSHINE OILSANDS LTD.HKSE SYMBOL: 2012Date issue: May 18, 2017Time in: 5:43 AM eAttention:
HONG KONG, CHINA and CALGARY, ALBERTA–(Marketwired – May 18, 2017) – The Board
of Directors of Sunshine Oilsands Ltd. (“the Corporation” or “Sunshine”)
(…

GET ENERGYNOW’S DAILY EMAIL FOR FREE


Alberta changes carbon tax rebates after bereaved families get repayment demands

EDMONTON — Alberta is bringing in new rules to make amends to 4,400 families who lost a loved one and were ordered to pay back their carbon tax rebate.

“For a relatively small number of families, the program didn’t work as it should have,” Finance Minister Joe Ceci said Wednesday.

“These families received bluntly worded letters from the Canada Revenue Agency asking them to repay all or part of the rebate because the death of a loved one changed their eligibility.

“Grieving families should not face the indignity of a collection letter demanding the repayment of a benefit that is supposed to make their lives better.”

Ceci made the changes in a tax statutes amendment bill introduced in the legislature Wednesday afternoon.

The province will no longer seek the return of rebates due to death. Those received the rebate on behalf of a loved one and paid it back will be reimbursed.

All rebates will be dispatched quarterly. Some smaller amounts had been paid out in a lump sum.

The payouts are tied to a broad-based carbon tax the province introduced Jan. 1 which increased costs at gasoline pumps and on home heating bills. The tax is intended to pay for initiatives and programs to move Alberta to a more environmentally friendly economy.

Middle- and low-income earners — about six in 10 households — receive rebates on a sliding scale to give them incentives to go green, but they’re not punished if they don’t.

In January, the province delivered some lump sum rebates in a program administered through the Canada Revenue Agency. By March, some Albertans were saying they were receiving collection letters from Ottawa demanding repayment after a death.

There were stories of a collection demand on a cancer-stricken mom who used her $180 carbon tax rebate to buy gifts for her kids before she died.

A senior whose wife died said he got a letter demanding he return the carbon tax rebate she had received.

A daughter taking care of the estate of her deceased mother received a notice to repay the $100 rebate.

Ceci said he has spoken personally with some of those affected.

“I want them to know we understand their frustration,” he said. “As soon as we became aware of this issue in March, we took action.”

Ceci said the Canada Revenue Agency was doing its job properly in sending out the letters and the fault lay with his department.

“I had not anticipated that.”

The government says 1.2 million carbon levy repayments totalling $150 million have been sent out so far this year.

Eligibility is based on household income and the number of people in a home. Data comes from personal income tax information.

Rebates are issued in January, April, July, and October and the minimum rebate entitlement is $100.

Dean Bennett, The Canadian Press

GET ENERGYNOW’S DAILY EMAIL FOR FREE


First Nations vow to use courts and other means if necessary to stop Keystone XL

CALGARY — A coalition of aboriginal groups from Canada and the U.S. has signed a declaration against the Keystone XL pipeline, vowing to use the courts and whatever other means necessary to block the controversial project.

At a signing ceremony in Calgary Wednesday, leaders of the Blackfoot Confederacy and Great Sioux Nation representing tribes in both countries called for more dialogue and consultations on the project, which would run through their traditional lands.

“It’s our responsibility to protect, and get involved, advocate and prevent this type of threat from crossing traditional Blackfoot lands,” said Chief Stanley Charles Grier of the Piikani nation at the ceremony.

Chairman Brandon Sazue of the Crow Creek Sioux Tribe in South Dakota said they hope to use the “right way” of opposing the pipeline, including the courts and negotiations, but as a last means he and others are prepared to protest like they did against the Dakota Access Pipeline.

Councilwoman Casey Camp-Horinek of the Ponca Nation of Oklahoma, who was arrested at the Dakota Access protests alongside Sazue, said she’s also ready to protest again.

“We are hoping to find a peaceful resolution,” said Camp-Horinek, “but all of us understand that if it’s necessary for us to create a camp again, and to stand in opposition, we’ll do that.”

She said she’s opposed to the pipeline because it and other resource extraction and development projects have threatened her people.

Earlier this year, U.S. President Donald Trump revived the pipeline proposed by TransCanada Corp. (TSX:TRP) when he granted it a presidential permit, reversing Barack Obama’s rejection in 2015.

TransCanada maintains the US$8 billion pipeline, set to run 1,900 kilometres between Hardisty, Alta., and Nebraska, will be environmentally safe create jobs, and boost the economy.

The project still requires regulatory approval in Nebraska, while environmental groups have challenged the U.S. federal approval in court.


Ian Bickis, The Canadian Press

GET ENERGYNOW’S DAILY EMAIL FOR FREE


Leucrotta Exploration Inc. Announces Closing of Acquisition

FOR: LEUCROTTA EXPLORATION INC.
TSX VENTURE SYMBOL: LXE

Date issue: May 17, 2017
Time in: 7:06 PM e

Attention:

CALGARY, ALBERTA–(Marketwired – May 17, 2017) –

THIS PRESS RELEASE IS NOT FOR PUBLICATION OR DISSEMINATION IN THE UNITED
STATES, FAILURE TO COMPLY WITH THIS RESTRICTION MAY CONSTITUTE A VIOLATION OF
UNITED STATES SECURITIES LAW

Leucrotta Exploration Inc. (“Leucrotta” or the “Company”) (TSX VENTURE:LXE) is
pleased to announce that, further to its press release dated April 5, 2017
wherein the Company announced that it had agreed to acquire 18.5 net sections
of undeveloped land (the “Lands”) located within the Corporation’s core area
encompassing 116 gross (105 net) sections of the Lower Montney Turbidite Light
Oil Resource Play pursuant to a purchase and sale agreement and a land swap
agreement for aggregate cash consideration of $36 million (subject to certain
customary purchase price adjustments) with respect to the majority of the Lands
(the “Land Acquisition”) and the swap of certain non-core sections of the
Corporation’s lands located in Two Rivers area of British Columbia with respect
to the balance of the Lands, the Company has closed the Land Acquisition. For
further details please see Leucrotta’s press release dated April 5, 2017 and
its short form prospectus dated April 19, 2017, both of which are available
under Leucrotta’s System for Electronic Document Analysis and Retrieval (SEDAR)
profile at www.sedar.com.

ABOUT LEUCROTTA EXPLORATION INC.

Leucrotta Exploration Inc. is a Montney focused producer with lands located in
the Doe/Mica area in northeast British Columbia. Leucrotta’s current acreage in
the area is approximately 100,500 gross (90,200 net) acres or approximately 157
gross (141 net) sections of Montney land. Current production is approximately
2,700 boe/d (25% oil & NGLs). Leucrotta’s shares are listed on the TSX Venture
Exchange under the symbol “LXE”.

Neither the TSX Venture Exchange nor its Regulation Services Provider (as that
term is defined in the policies of the TSX Venture Exchange) accepts
responsibility for the adequacy or accuracy of this release.

– END RELEASE – 17/05/2017

For further information:
Leucrotta Exploration Inc.
Robert Zakresky
President and Chief Executive Officer
(403) 705-4525
OR
Leucrotta Exploration Inc.
Nolan Chicoine
Vice President, Finance and Chief Financial Officer
(403) 705-4525
OR
Leucrotta Exploration Inc.
700, 639 – 5th Ave SW
Calgary, Alberta T2P 0M9
(403) 705-4525
(403) 705-4526 (FAX)
www.leucrotta.ca

COMPANY:
FOR: LEUCROTTA EXPLORATION INC.
TSX VENTURE SYMBOL: LXE

INDUSTRY: Energy and Utilities – Oil and Gas
RELEASE ID: 20170517CC0089

Press Release from Marketwired 1-866-736-3779

All press releases are written by the client and have NO affiliation with the news copy written by The Canadian Press. Any questions that arise due to the content or information provided in the press release should be directed to the company/organization
issuing the release, not to The Canadian Press.

GET ENERGYNOW’S DAILY EMAIL FOR FREE


Weaver says Greens will fight pipeline, calls Clark’s Liberals ‘reckless’

VICTORIA — British Columbia’s three Green members will use their increased political clout to fight Kinder Morgan’s $7.4-billion Trans Mountain pipeline expansion project, party leader Andrew Weaver says.

Weaver reaffirmed the Greens’ election campaign promises Wednesday to oppose the pipeline and the B.C. government’s $8.8-billion Site C hydroelectric dam as the party enters high-stakes political negotiations with the New Democrats and Liberals over Green support.

The final results of last week’s B.C. election remain inconclusive after Christy Clark’s Liberals and John Horgan’s New Democrats failed to win a majority in the 87-seat legislature. The current standings have 43 Liberals, 41 New Democrats and three Greens.

Elections BC, the agency that administers provincial elections, reports that almost 180,000 absentee ballots remain to be counted. The final tally, including recounts in two ridings, Vancouver-False Creek and Courtenay-Comox, is expected to be announced next week.

Weaver said his members believe it’s their responsibility to stop the federally-approved Kinder Morgan project.

“We believe we need to support the First Nations in B.C. who are in court now,” he said.

Weaver said the Greens will seek intervener status to support a pending legal challenge by First Nations and municipalities opposed to the project.

Alberta Premier Rachel Notley said Tuesday her province had been given intervener status in the same legal action. One province or region can’t hold hostage the economy of another province, she said.

The Federal Court of Appeal application, launched by several First Nations, environmental groups and the cities of Burnaby and Vancouver, seeks to have the approval of the pipeline expansion project by the National Energy Board thrown out.

The Kinder Morgan project would double the pipeline and triple the available capacity between Alberta and B.C., allowing for up to 890,000 barrels of crude to be shipped every day.

Weaver said the Greens strongly reject the B.C. Liberal government’s support for the project.

“The fact we’re being told to ship diluted bitumen in our coastal waters is just reckless,” he said. “The government is reckless for agreeing to it.”

Clark said Tuesday that B.C. negotiated $1.5 billion worth of environmental protections and services with the federal government in exchange for provincial support for the pipeline project. The Liberals also negotiated a 20-year revenue-sharing agreement worth about $1 billion with Kinder Morgan.

Weaver said the National Energy Board approval process for the pipeline was flawed and Clark’s demand that five conditions be met before her government approved the expansion was “pure political spin.” 

Clark said she is willing to collaborate with the Greens and the New Democrats to ensure a working government.

The NDP leader has said his party won’t work with the Liberals, but he believes the New Democrats and Greens share many common positions, including halting the Kinder Morgan pipeline.

Weaver said he is prepared to enter face-to-face negotiations with both parties.

He suggested the Greens and NDP appear more aligned on issues surrounding the environment and electoral and campaign-finance reforms.

Weaver, who said he negotiated faculty contracts at the University of Victoria, said he will head up the four-person Green negotiating team. Norman Spector, a chief aide to both former prime minister Brian Mulroney and former B.C. premier Bill Bennett, was recruited to provide political advice to the Green negotiators.

Dirk Meissner, The Canadian Press

GET ENERGYNOW’S DAILY EMAIL FOR FREE


Sales of Crown oil and gas drilling rights surge in B.C. and Alberta

CALGARY — Sales of Crown drilling rights in Alberta and B.C. have already delivered more money to provincial treasuries this year than last year, when they generated record low returns.

Oil and gas producers in Alberta have paid out a total of $138 million in drilling rights auctions so far this year, more than the $137 million they spent in all of 2016.

In British Columbia, they’ve spent $63 million, more than quadruple the $15 million last year.

The figures illustrate growing oilpatch confidence in light of stronger commodity prices this year as well as burgeoning production from Western Canadian shale oil and gas wells.

TD Securities analyst Juan Jarrah says in a report that the Alberta sales are being driven by companies exploring the west-central part of the province where they’ve discovered a shallower and more oil-rich leg of the extensive Duvernay shale formation.

The Kaybob Duvernay, located farther north, has attracted most of the investment in the play so far and was considered the driving force behind Alberta’s record-setting $3.5 billion in drilling rights sales in 2011.

The best year for drilling rights sales in B.C. was 2008, when the province raised $2.7 billion.

The Canadian Press

GET ENERGYNOW’S DAILY EMAIL FOR FREE


Oilfield services M&A picks up as battered drillers seek lower costs, scale

CALGARY — Canadian drillers and other oilfield service providers have stepped up merger and acquisition activity, with more deals expected in coming months, as players battered by more than two years of weak oil prices look to lower costs and strengthen finances by scaling up.

Crude prices have stabilized from the lows of early 2016 and the big energy companies that hire drillers are increasing spending from depressed levels. That has spurred some drillers and related service companies to rehire staff and redeploy equipment after cutting costs to the bone during the downturn.

But many still find it tough to raise capital, increasing the pressure to do deals, said Alf Sailer, managing director of M&A advisory services for ATB Financial.

“The pace of M&A transactions, it really has picked up,” said Sailer, who sees the trend continuing.

“The lenders are still nervous about oilfield service companies and the equity investors are also still nervous. We’re not seeing either of those warm up to the oilfield services business yet.”

Source Energy Services (TSX:SHLE) and STEP Energy Services (TSX:STEP) recently raised money in initial public offerings that fell short of expectations, Sailer said, noting both have since traded at less than their IPO prices.

On Monday, Calgary-based Secure Energy Services (TSX:SES) said it will pay $26 million in a cash-and-shares deal for smaller rival Ceiba Energy Services, which had announced a review of alternatives last fall. Interim Ceiba CEO Ron Sifton said the company decided it was too small to compete profitably in the oilfield disposal business and its depressed share price meant it couldn’t raise equity to grow bigger. Adding debt was not an option.

“Our balance sheet was tapped out,” he said.

Driller CWC Energy Services (TSX:CWC) announced a similar process this month to find a way to grow again while reducing its high level of debt.

“We’ve come through two, two-and-a-half years of just sitting and trying to figure out how to survive,” said CEO Duncan Au.

The recent consolidation trend started with a low-profile swap. Canada’s largest drilling rig contractor by market capitalization, Precision Drilling (TSX:PD), agreed in December to trade its Canadian coil tubing operations plus $12 million to Essential Energy Services (TSX:ESN) in return for Essential’s service rig business.

At its annual meeting on Wednesday, Precision CEO Kevin Neveu said the swap was an “opportunistic” transaction not likely to be repeated, but he agreed there are great deals available for buyers of oilfield services.

“The entire space is undervalued right now,” he said. “Drilling, pressure pumping, everybody’s got very low (stock market) valuations, ourselves included. So I’d say there are bargains everywhere.”

Since January, High Arctic Energy Services (TSX:HWO) bought Tervita’s production services division, driller Total Energy Services (TSX:TOT) won a hostile takeover bid for rival Savanna Energy Services (TSX:SVY) and fracking firms Trican Well Service (TSX:TCW) and Canyon Services Group (TSX:FRC) agreed to a share-swap merger deal worth $637 million.

In April, the Petroleum Services Association of Canada updated its drilling forecast for 2017 to 6,680 wells, a 60 per cent increase over its November forecast. It attributed the change to stronger crude prices after the Organization of Petroleum Exporting Countries and other nations agreed to curtail production in December.

Since then, however, higher American production has weighed on prices.

Oilfield services analyst Aaron MacNeil of AltaCorp Capital said increased oilfield activity this winter helped Canadian service companies reactivate parked equipment, but the market is still oversupplied, making it difficult to raise prices after the deep cuts of the past two years.

“Companies below a specific size have been challenged to generate cash flow, even in a better activity scenario, so I think you’re seeing a willingness to at least have a conversation about consolidation,” he said. “You do need scale to be more profitable.”

The Canadian Association of Oilwell Drilling Contractors said its drilling membership has fallen from 45 companies to 36 since 2014, with one more likely to be lost when the Total-Savanna deal is finalized.

Spokesman John Bayko said not all of the members were lost because of the downturn — the 2015 merger of Trinidad Drilling Ltd. (TSX:TDG) and CanElson Drilling, for instance, likely would have occurred anyway — but some small drillers have dropped out as a cost-saving measure.


Follow @HealingSlowly on Twitter.

Dan Healing, The Canadian Press


GET ENERGYNOW’S DAILY EMAIL FOR FREE


Precision Drilling Corporation Announces Voting Results from the 2017 Annual and Special Meeting of Shareholders

FOR: PRECISION DRILLING CORPORATIONTSX SYMBOL: PDNYSE SYMBOL: PDSDate issue: May 17, 2017Time in: 5:17 PM eAttention:
CALGARY, ALBERTA–(Marketwired – May 17, 2017) – Precision Drilling Corporation
(“Precision” or “Company”) (TSX:PD)(NYSE:PDS) held it…

GET ENERGYNOW’S DAILY EMAIL FOR FREE


Cub Energy Inc. Announces Q1 2017 Financial and Operational Results

FOR: CUB ENERGY INC.TSX VENTURE SYMBOL: KUBDate issue: May 17, 2017Time in: 5:06 PM eAttention:
HOUSTON, TEXAS–(Marketwired – May 17, 2017) – Cub Energy Inc. (“Cub” or the
“Company”) (TSX VENTURE:KUB), a Ukraine-focused upstream oil and gas company,

GET ENERGYNOW’S DAILY EMAIL FOR FREE


Enerflex Announces Two New Directors

FOR: ENERFLEX LTD.
TSX SYMBOL: EFX

Date issue: May 17, 2017
Time in: 5:01 PM e

Attention:

CALGARY, ALBERTA–(Marketwired – May 17, 2017) – The Board of Directors of
Enerflex Ltd. (TSX:EFX) (“Enerflex” or the “Company”), is pleased to announce
the appointment of Ms. Maureen Cormier Jackson and Mr. Kevin Reinhart to the
Board.

Ms. Cormier Jackson has over 35 years of executive, financial, and operational
expertise in the oil and gas industry. Ms. Cormier Jackson’s career spanned
numerous roles at Suncor Energy Inc. which provided experience in the areas of
accounting and financial controls, environment, health, and safety (EHS),
project management, and ultimately as Senior Vice President, Chief Process and
Information Officer. Ms. Cormier Jackson is retired and currently serves on
Penn West Petroleum Ltd.’s Board of Directors. Ms. Cormier Jackson is a
Chartered Professional Accountant and resides in Calgary, Alberta.

Mr. Reinhart brings to Enerflex extensive executive and financial experience in
international energy company operations. After an early career in public
accounting, Mr. Reinhart joined Nexen Inc. and held a number of senior roles in
financial reporting, treasury, risk management, corporate planning, and
business development before becoming Nexen’s Chief Financial Officer and
ultimately interim President and Chief Executive Officer. Mr. Reinhart’s
extensive international expertise will bring additional strength to Enerflex.
Mr. Reinhart is retired and has served as a director of three publicly-listed
companies. He is a Chartered Professional Accountant and resides in Calgary,
Alberta.

“Ms. Cormier Jackson and Mr. Reinhart bring enhanced depth to our Board with
their extensive experience in energy sector accounting, finance, major
projects, risk management, and international business,” said Stephen J.
Savidant, Chairman of the Enerflex Board of Directors. “We are very pleased to
have the benefit of that experience and to expand the Board to support our
growth.”

Ms. Cormier Jackson and Mr. Reinhart join the current slate of Enerflex
directors comprised of Messrs. Robert S. Boswell, W. Bryon Dunn, J. Blair
Goertzen, H. Stanley Marshall, Stephen J. Savidant, and Michael A. Weill and
Ms. Helen J. Wesley.

About Enerflex

Enerflex Ltd. is a single source supplier of natural gas compression, oil and
gas processing, refrigeration systems, and electric power generation equipment
– plus related engineering and mechanical service expertise. The Company’s
broad in-house resources provide the capability to engineer, design,
manufacture, construct, commission, and service hydrocarbon handling systems.
Enerflex’s expertise encompasses field production facilities, compression and
natural gas processing plants, refrigeration systems, and electric power
equipment servicing the natural gas production industry.

Headquartered in Calgary, Canada, Enerflex has approximately 1,800 employees
worldwide. Enerflex, its subsidiaries, interests in associates, and
joint-ventures operate in Canada, the United States, Argentina, Bolivia,
Brazil, Colombia, Mexico, Peru, Australia, the United Kingdom, the United Arab
Emirates, Oman, Bahrain, Indonesia, Malaysia, and Thailand. Enerflex’s shares
trade on the Toronto Stock Exchange under the symbol “EFX”. For more
information about Enerflex, go to www.enerflex.com.

– END RELEASE – 17/05/2017

For further information:
For investor and media inquiries, please contact:
Enerflex Ltd.
J. Blair Goertzen
President & Chief Executive Officer
403.236.6852
OR
Enerflex Ltd.
D. James Harbilas
Executive Vice President & Chief Financial Officer
403.236.6857
www.enerflex.com

COMPANY:
FOR: ENERFLEX LTD.
TSX SYMBOL: EFX

INDUSTRY: Energy and Utilities – Equipment, Energy and Utilities –
Oil and Gas
RELEASE ID: 20170517CC0077

Press Release from Marketwired 1-866-736-3779

All press releases are written by the client and have NO affiliation with the news copy written by The Canadian Press. Any questions that arise due to the content or information provided in the press release should be directed to the company/organization
issuing the release, not to The Canadian Press.

GET ENERGYNOW’S DAILY EMAIL FOR FREE


Just Energy Reports Fourth Quarter and Full Year Fiscal 2017 Results

FOR: JUST ENERGY GROUP INC.
NYSE SYMBOL: JE
TSX SYMBOL: JE

Date issue: May 17, 2017
Time in: 5:00 PM e

Attention:

Fiscal 2017 Base EBITDA of $224.5 million increases 8%

Achieves targeted net debt ratio of 1.8x

Provides fiscal 2018 guidance

TORONTO, ONTARIO–(Marketwired – May 17, 2017) – Just Energy Group, Inc.
(TSX:JE)(NYSE:JE), a leading retail energy provider specializing in electricity
and natural gas commodities, energy efficiency solutions, and renewable energy
options, today announced results for its fourth quarter and full fiscal year
2017.

Key Fiscal 2017 Highlights:

/T/

— Sales of $3,757.1 million decreased 8% from sales of $4,105.9 million in

the prior year, primarily a result of the decrease in customer base and
lower impact from foreign currency translation.

— Total attrition rate improved to 15% and the total renewal rate improved

to 65% during fiscal 2017.

— Gross margin of $696.0 million decreased 1% year-over-year, driven by a

mix of factors related to foreign currency and the decrease in customer
base, partially offset by higher margin realization resulting from
ongoing margin improvement initiatives.

— Base EBITDA of $224.5 million increased 8% year-over-year. 2017 Base

EBITDA includes $11.3 million of additional prepaid commission expense
compared to last year, excluding this additional expense item, Base
EBITDA increased 14% to $235.8 million in fiscal 2017.

— Base Funds from Operations (“Base FFO”) of $127.8 million decreased 8%

from the $138.2 million reported in the prior year. The payout ratio on
Base Funds from Operations for fiscal 2017 was 60%.

— Cash and short-term investments were $83.6 million as of year ended

March 31, 2017, a decrease of 34% from $127.6 million reported in the
previous year, primarily attributable to the redemption of long-term
debt during fiscal 2017.

— Long-term debt of $498.1 million as of March 31, 2017 decreased 25% from

$660.5 million as of March 31, 2016. Book value of net debt was 1.8x for
the Base EBITDA, significantly improved from 2.6x just one year ago.

Financial highlights
For the three months ended March 31
(thousands of dollars, except where indicated and per share amounts)

% increase
Fiscal 2017 (decrease) Fiscal 2016

Sales $ 947,281 (12)% $ 1,075,880
Gross margin 175,412 (14)% 204,289
Administrative expenses 32,448 (34)% 49,504
Selling and marketing expenses 53,727 (14)% 62,259
Finance costs (net of non-cash
finance charges) 12,279 (25)% 16,436
Profit (loss)(1) (38,220) NMF(3) 30,893
Profit (loss) per share available
to shareholders – basic (0.30) 0.16
Profit (loss) per share available
to shareholders – diluted (0.30) 0.14
Dividends/distributions 20,344 9% 18,730
Base EBITDA(2) 75,018 11% 67,345
Base Funds from Operations(2) 28,588 (35)% 43,822
Payout ratio on Base Funds from
Operations(2) 71% 43%
Total gross customer (RCE)
additions 228,000 (10)% 253,000
Total net customer (RCE) additions (25,000) 47% (47,000)

For the years ended March 31
(thousands of dollars, except where indicated and per share amounts)

% increase
Fiscal 2017 (decrease) Fiscal 2016
——————————————
Sales $ 3,757,054 (8)% 4,105,860
Gross margin 695,971 (1)% 702,288
Administrative expenses 168,433 (1)% 170,330
Selling and marketing expenses 226,308 (12)% 257,349
Finance costs (net of non-cash
finance charges) 54,879 (4)% 57,069
Profit(1) 470,883 NMF(3) 82,494
Profit (loss) per share available
to shareholders – basic 3.02 0.44
Profit (loss) per share available
to shareholders – diluted 2.42 0.43
Dividends/distributions 76,751 3% 74,792
Base EBITDA(2) 224,499 8% 207,629
Base Funds from Operations(2) 127,758 (8)% 138,199
Payout ratio on Base Funds from
Operations(2) 60% 54%
Embedded gross margin(2) 1,757,000 (8)% 1,917,600
Total customers (RCEs) 4,202,000 (7)% 4,520,000
—————————————————————————-
(1)Profit (loss) includes the impact of unrealized gains (losses), which
represents the mark to market of future commodity supply acquired to cover
future customer demand. The supply has been sold to customers at fixed
prices, minimizing any realizable impact of mark to market gains and
losses.
(2)See the definition included in Just Energy’s Management’s Discussion and
Analysis
(3)Not a meaningful figure.

/T/

“Fiscal 2017 was an important year for Just Energy from a financial,
operational, and strategic positioning perspective,” commented Just Energy’s
Co-CEO, Deb Merril. “Our business performed well, delivering solid earnings
growth while generating meaningful cash flow. In parallel with our strong
results, we pursued several strategic measures to position the Company for
continued long-term success.”

“For the fiscal year, we achieved our guidance; overcoming a tough comparison
to the strong 2016, and our attrition rate continued to improve. We also
achieved a dividend payout ratio of 60% and a net debt to Base EBITDA ratio of
1.8x, and both important metrics are now well within our targeted ranges. We
achieved these objectives while navigating a difficult market environment where
we are experiencing lower than anticipated levels of customer switching
activity due to relative price stability in gas and electricity markets, and
the effect of increased competition that typically occurs in
low-commodity-price environments. Our business is healthy and able to withstand
prolonged periods such as 2017, without hindering our ability to pursue our
long-term strategy.”

Co-CEO, James Lewis added, “We are experiencing great customer acceptance of
our growing product suite, new channels and long-term loyalty programs, and our
geographic expansion efforts remain on track. Our attrition rate in the
Consumer and Commercial businesses improved two percentage points during the
year, and our total renewal rate improved three percentage points during the
year. These improvements are a reflection of initiatives undertaken to improve
our products, margin and customer experience. The momentum of improvements to
gross and net additions for the fourth quarter indicates we are on track to
return to positive customer growth in fiscal 2018 and beyond.”

“We are entering an exciting time for Just Energy. We have successfully
transformed the profitability profile of the business, while also repairing our
balance sheet and overall financial position. These successes allow us to pivot
from a period of internal repair to a period of investing in our prolonged
growth. We enter fiscal 2018 capable of delivering more value to customers than
ever in our history and we are squarely on the path to future sustained growth.”

Co-CEO, Deb Merril concluded, “Looking ahead, we are aggressively pursuing a
growth strategy centred on increasing the number of customer contracts,
expanding our geographic presence, transforming our brand, enhancing our sales
channels, pursuing strategic acquisitions, and providing new products and
structures that meet the changing needs of today’s consumers.”

“In fiscal 2018, we believe we will achieve net customer additions and deliver
Base EBITDA in the range of $210 million to $220 million. While the Base EBITDA
guidance reflects a decline over 2017 results, it demonstrates solid
performance in our base business combined with significant investment in the
form of up-front commissions related to customer growth, investments to seed
our new international operations, and further investments in product and
geographic growth initiatives. Looking to fiscal 2019 and beyond, we believe
the business will return to growth as the successful execution of our strategy
continues to generate great interest in our offerings and results in sustained
growth.”

Fourth Quarter Operating Performance

To view the Fourth Quarter Operating Performance chart, please visit the
following link: http://media3.marketwire.com/docs/JustEnergyChart1.pdf.

/T/

— Sales decreased by 12% to $947.3 million from $1,075.9 million recorded

in the fourth quarter of fiscal 2016 reflecting the 8% decrease in
customer base of the Consumer gas division and lower impact from foreign
currency translation, offset by improvements in the Commercial
division’s customer base.

— Gross margin was $175.4 million, a decrease of 14% from the prior

comparable quarter. The decrease is attributable to decline in the
Consumer gas division’s customer base and a $9.6 million decrease from
the impact of foreign currency, partially offset by gross margin
improvement initiatives in the Commercial division.

— Administrative expenses decreased by 34% from $49.5 million to $32.4

million as a result of lower employee-related expenses, a decrease in
legal provisions, and impact from foreign currency translation.

— Selling and marketing expenses were $53.7 million, a 14% decrease from

$62.3 million reported in the prior comparable quarter. This decrease is
largely attributable to lower commission expense due to a reduction in
gross customer additions in the current quarter, as well as decreased
residual commission costs.

— Total finance costs amounted to $16.7 million, a decrease of 18% from

$20.3 million last year. The lower finance costs was a result of the 25%
decrease in long-term debt.

— Base EBITDA was $75.0 million, an 11% increase from $67.3 million in the

prior comparable quarter. The Company’s reported Base EBITDA for the
fourth quarter of fiscal 2017 includes $2.1 million less prepaid
commission expenses as well as a net decrease of $0.7 million resulting
from the impact of foreign currency translation.

— Base FFO was $28.6 million, down 35% compared to $43.8 million in 2016

as a result of higher income taxes from the exhaustion of non-capital
loss carry forward in both Canada and the U.K.

/T/

Fiscal 2017 Operating Performance

To view the Fiscal 2017 Operating Performance chart, please visit the following
link: http://media3.marketwire.com/docs/JustEnergyChart2.pdf.

/T/

— Sales for fiscal year 2017 was $3,757.1 million, an 8% decrease from the

prior year. The Consumer and Commercial divisions’ sales decreased by 4%
and 13%, respectively, due to the 7% decrease in customer base and the
decrease associated with foreign currency translation.

— Gross margin for fiscal year 2017 was $696.0 million, a 1% decrease from

the prior year, driven by unfavorable foreign exchange and partially
offset by margin improvement initiatives. Gross margin for the Consumer
division decreased to $512.9 million, down 5%, and the gross margin for
the Commercial division increased by 12% to $183.1 million.

— Just Energy continued to add new customers at higher margins than

customers lost during the fiscal year through attrition and renewals, as
illustrated in the table below.

ANNUAL GROSS MARGIN PER RCE

Fiscal Number of Fiscal Number of
2017 customers 2016 customers
—————————————–

Consumer customers added and
renewed $ 207 881,000 $ 207 888,000
Consumer customers lost 197 552,000 196 592,000
Commercial customers added and
renewed 84 867,000 84 1,202,000
Commercial customers lost 79 605,000 66 732,000
—————————————–

— Administrative expenses for fiscal year 2017 decreased by 1% from $170.3

million to $168.4 million as a result of lower employee-related expenses
and a decrease in legal provision accruals. Selling and marketing
expenses for fiscal year 2017 were $226.3 million, a 12% decrease from
$257.3 million reported in the prior year. The decrease in selling and
marketing expenses is due to lower commission costs associated with
lower gross customer additions, as well as decreased residual commission
expenses

— Total finance costs for fiscal year 2017 were $78.1 million, an increase

of 8% from $72.5 million in the prior year. The increase in finance
costs was largely a result of the loss of $4.4 million on the redemption
of the 6.0% convertible debentures as well as the additional $2.9
million one-time interest cost associated with early redemption of the
senior unsecured notes.

— Base EBITDA was $224.5 million for fiscal year 2017, an increase of 8%

from $207.6 million in the prior year.

— Base EBITDA for fiscal year 2017 includes $29.2 million of prepaid
commission expenses, an increase from $17.9 million included in the
prior year. Excluding this incremental $11.3 million of selling
expense, Base EBITDA increased by 14% to $235.8 million in
comparison to $207.6 million reported for the prior year.

/T/

Customer Aggregation

/T/

April 1, Failed to March 31, %
2016(1) Additions Attrition renew 2017 decrease

—————————————————————————-
Consumer
Energy
Gas 661,000 120,000 (131,000) (39,000) 611,000 (8)%
Electricity 1,234,000 335,000 (263,000) (120,000) 1,186,000 (4)%
—————————————————————————-
Total Consumer
RCEs 1,895,000 455,000 (394,000) (159,000) 1,797,000 (5)%
—————————————————————————-
Commercial
Energy
Gas 251,000 54,000 (22,000) (22,000) 261,000 4%
Electricity 2,374,000 330,000 (168,000) (392,000) 2,144,000 (10)%
—————————————————————————-
Total
Commercial
RCEs 2,625,000 384,000 (190,000) (414,000) 2,405,000 (8)%
—————————————————————————-
Total RCEs 4,520,000 839,000 (584,000) (573,000) 4,202,000 (7)%
—————————————————————————-
(1)The balance as at April 1, 2016 has been adjusted for customers who
have either grown above 15 RCEs (becoming a Commercial customer) or have
fallen below 15 RCEs (becoming a Consumer customer) during the fiscal
year 2016. At the beginning of each fiscal year, Just Energy will adjust
the opening balances to reflect any changes in allocation of customers
between the Consumer and Commercial divisions as a result of the
increases or decreases in the annual consumption.

— Just Energy’s total RCE base is currently 4.2 million, a 7% decrease

from one year ago. The Consumer base also includes 55,000 smart
thermostats that are bundled with a commodity contract and tend to have
lower attrition and higher overall profitability. Further expansion of
smart-thermostats continues to be a key driver for growth for Just
Energy.

— Net RCE additions for the fourth quarter of 2017 increased 47% year-

over-year. The increase in the net RCE additions was primarily the
result of strong customer additions in the U.K. market. Sequentially,
net RCE additions improved 70% from a negative 84,000 net additions in
the third quarter of 2017 to a negative 25,000 net additions in the
fourth quarter of 2017, with positive net RCE additions in the Consumer
division.

— Gross RCE additions in fiscal 2017 were 839,000, a decrease of 28%

compared to 1,158,000 RCEs added in fiscal 2016.

— Consumer RCE additions of 455,000 decreased 13% from the 523,000
added in the prior year, primarily due to market conditions as the
commodity prices were lower and, therefore, more competitive across
all markets as well as a decrease in RCE additions through door-to
door-marketing.

— Commercial RCE additions of 384,000 decreased from the 635,000 gross
RCE additions in the prior year as a result of competitiveness in
pricing and a more disciplined pricing strategy

— Just Energy’s geographical footprint continues to diversify outside of

North America. During fiscal year 2017, the U.K. operations increased
their RCE base by 14% to 350,000 RCEs with strong growth for the
Consumer RCE bases.

— Net RCE additions were a negative 318,000 for fiscal 2017, down from net

additions of negative 166,000 in 2016, primarily as a result of the
lower RCE additions in North America.

— The combined attrition rate for Just Energy was 15% for the year, a one

percentage point decrease from the 16% reported a year prior.

— Both the Consumer and Commercial attrition rates decreased two
percentage points to 24% and 7%, respectively. Both decreases are a
result of Just Energy’s focus on becoming the customers’ “trusted
advisor” and providing a variety of energy management solutions to
its customer base to drive customer loyalty.

— The renewal rate for fiscal 2017 was 65%, up three percentage points

from 62% in fiscal 2016.

— The Consumer renewal rate increased by five percentage points to
79%, while the Commercial renewal rate decreased by one percentage
point to 56%. The decline in Commercial renewal rates reflected a
very competitive market for Commercial renewals with competitors
pricing aggressively and Just Energy’s focus on improving retained
customers’ profitability rather than pursuing low margin growth.

/T/

Balance Sheet & Liquidity

The Company remains committed to improving its balance sheet through the
pursuit of aggressive debt reductions. As of March 31, 2017, Just Energy’s book
value net debt was 1.8x Base EBITDA, which has significantly improved from 2.6x
one year ago.

/T/

— Cash and short-term investments were $83.6 million as of year ended

March 31, 2017, a decrease of 34% from $127.6 million reported in the
previous year. The decrease in cash is primarily attributable to the
redemption of long-term debt during fiscal 2017.

— Long-term debt of $498.1 million as of March 31, 2017 decreased 25% from

$660.5 million as of March 31, 2016. This decrease is a result of the
early redemption of the 6.0% convertible debentures with a book value of
$311.0 million as at March 31, 2016 and the repayment of the remaining
$80 million on the senior unsecured notes, offset by the issuance of the
6.75% convertible debentures with a book value of $145.6 million and a
withdrawal of $68.3 million on the credit facility.

— Base FFO for fiscal year 2017 were $127.8 million, a decrease of 8%

compared with $138.2 million in the prior fiscal year. Base FFO
decreased due to higher current income taxes resulting from increased
taxable income in Canada and the U.K. coupled with full utilization of
loss carry forwards in prior years and an additional one-time finance
cost of $2.9 million related to the repayment of the senior unsecured
notes.

— The payout ratio on Base FFO was 60% for fiscal year 2017, compared to

54% reported in fiscal 2016.

— Dividends and distributions for fiscal year 2017 were $76.8 million, an

increase of 3% from the prior fiscal year, reflecting the initiation of
dividend payments to preferred shareholders following the issuance in
February 2017, which amounted to $1.7 million.

/T/

Outlook

Just Energy continues to deploy its strategy to become a world-class consumer
enterprise delivering superior value to its customers through a range of energy
management solutions and a multi-channel approach. Growth plans centre on
geographic expansion, structuring superior product value propositions, and
enhancing the portfolio of energy management offerings.

In fiscal 2018, management believes that the Company will deliver Base EBITDA
in the range of $210 million to $220 million. These expectations reflect
continued solid performance in the base business, offset by significant
investments to seed Just Energy’s international operations, further investments
in product and geographic growth initiatives, and up-front commissions related
to customer growth in fiscal 2018.

While the opex investments in growth will present a challenge to fiscal 2018,
management expects to still return to growth in Base EBITDA for fiscal 2019 and
beyond, returning to the double-digit percentage growth as delivered in the
past. This expectation is in line with Just Energy’s previous performance under
the current leadership team (fiscal 2015-2017) when the Company delivered a
Base EBITDA CAGR of 10.2% or 14.8% prior to the deduction related to Commercial
customer acquisition costs.

The Company’s balance sheet improvement initiatives have resulted in
significantly improved debt ratios, and management remains committed to
maintaining these levels throughout this period of growth investment.

The repositioned business model has improved the Company’s ability to drive
profitability and cash generation, thus providing management with the
confidence and freedom to commit to future dividend distributions at the
current $0.50 per common share level and to maintain the preferred shares
dividend.

Earnings Call

The Company will host a conference call and live webcast to review the fourth
quarter results beginning at 10:00 a.m. Eastern Standard Time on May 18th, 2017
followed by a question and answer period. Rebecca MacDonald, Executive Chair,
President & Co-Chief Executive Officers James Lewis and Deb Merril, and Chief
Financial Officer Pat McCullough will participate on the call.

Just Energy Conference Call and Webcast

/T/

— Thursday, May 18th, 2017
— 10:00 a.m. EST

/T/

Those who wish to participate in the conference call may do so by dialing
1-888-465-5079 and entering pass code 7009356#. The call will also be webcast
live over the internet at the following link:
http://event.onlineseminarsolutions.com/wcc/r/1357730-1/5FF4034F544B855A5723B091
5E568910

An audio tape rebroadcast will be available starting at 12:30 p.m. EST May
18th, 2017 until June 17th, 2017 at 11:59 p.m. EST. To access the rebroadcast
please dial 1-888-843-7419 and enter the participant code 7009356#.

About Just Energy Group Inc.

Established in 1997, Just Energy (NYSE:JE)(TSX:JE) is a leading retail energy
provider specializing in electricity and natural gas commodities, energy
efficiency solutions, and renewable energy options. With offices located across
the United States, Canada, the United Kingdom and Germany, Just Energy serves
approximately two million residential and commercial customers providing homes
and businesses with a broad range of energy solutions that deliver comfort,
convenience and control. Just Energy Group Inc. is the parent company of Amigo
Energy, Green Star Energy, Hudson Energy, Just Energy Solar, Tara Energy and
TerraPass.

FORWARD-LOOKING STATEMENTS

Just Energy’s press releases may contain forward-looking statements including
statements pertaining to customer revenues and margins, customer additions and
renewals, customer attrition, customer consumption levels, general and
administrative expenses, dividends, distributable cash and treatment under
governmental regulatory regimes. These statements are based on current
expectations that involve a number of risks and uncertainties which could cause
actual results to differ from those anticipated. These risks include, but are
not limited to levels of customer natural gas and electricity consumption,
rates of customer additions and renewals, rates of customer attrition,
fluctuations in natural gas and electricity prices, changes in regulatory
regimes and decisions by regulatory authorities, competition and dependence on
certain suppliers. Additional information on these and other factors that could
affect Just Energy’s operations, financial results or dividend levels are
included in Just Energy’s annual information form and other reports on file
with Canadian securities regulatory authorities which can be accessed through
the SEDAR website at www.sedar.com, on the U.S. Securities Exchange
Commission’s website at www.sec.gov or through Just Energy’s website at
www.justenergygroup.com.

Neither the Toronto Stock Exchange nor the New York Stock Exchange has approved
nor disapproved of the information contained herein.

– END RELEASE – 17/05/2017

For further information:
Pat McCullough
Chief Financial Officer
Just Energy
713-933-0895
[email protected]
OR
Michael Cummings
Investor Relations
Alpha IR Group
617-461-1101
[email protected]

COMPANY:
FOR: JUST ENERGY GROUP INC.
NYSE SYMBOL: JE
TSX SYMBOL: JE

INDUSTRY: Energy and Utilities – Oil and Gas , Financial Services –
Personal Finance
RELEASE ID: 20170517CC0076

Press Release from Marketwired 1-866-736-3779

All press releases are written by the client and have NO affiliation with the news copy written by The Canadian Press. Any questions that arise due to the content or information provided in the press release should be directed to the company/organization
issuing the release, not to The Canadian Press.

GET ENERGYNOW’S DAILY EMAIL FOR FREE


Enbridge Energy School Challenge – Peel District School Board Takes the Top Three Spots

FOR: ENBRIDGE GAS DISTRIBUTION INC.
Date issue: May 17, 2017Time in: 2:23 PM eAttention:
TORONTO, ONTARIO–(Marketwired – May 17, 2017) – Enbridge Gas Distribution
(Enbridge) is proud to announce and congratulate the winners of the Enbridge
Energy Sch…

GET ENERGYNOW’S DAILY EMAIL FOR FREE


Canadian Natural Resources Limited Announces Normal Course Issuer Bid

FOR: CANADIAN NATURAL RESOURCES LIMITEDTSX SYMBOL: CNQNYSE SYMBOL: CNQDate issue: May 17, 2017Time in: 5:00 AM eAttention:
CALGARY, ALBERTA–(Marketwired – May 17, 2017) – Canadian Natural Resources
Limited (“Canadian Natural”) (TSX:CNQ) (NYSE:CNQ) an…

GET ENERGYNOW’S DAILY EMAIL FOR FREE


Africa Oil Announces Emekuya-1 Oil Discovery in Kenya

FOR: AFRICA OIL CORP.TSX SYMBOL: AOIOMX SYMBOL: AOIDate issue: May 17, 2017Time in: 2:00 AM eAttention:
VANCOUVER, BRITISH COLUMBIA–(Marketwired – May 17, 2017) – Africa Oil Corp.
(“Africa Oil”, “AOC” or the “Company”) (TSX:AOI)(OMX:AOI) is pleased t…

GET ENERGYNOW’S DAILY EMAIL FOR FREE


Westcore Energy Ltd. Announces Closing of $600,000 Equity Financing

FOR: WESTCORE ENERGY LTD.TSX VENTURE SYMBOL: WTRDate issue: May 16, 2017Time in: 10:20 PM eAttention:
SASKATOON, SASKATCHEWAN–(Marketwired – May 16, 2017) – Westcore Energy Ltd.
(“Westcore” or the “Company”) (TSX VENTURE:WTR) is pleased to announce t…

GET ENERGYNOW’S DAILY EMAIL FOR FREE


B.C. can’t hold economy ‘hostage,’ Notley says in defence of Trans Mountain

CALGARY — Opponents of the Trans Mountain pipeline expansion have no power to stop it, Alberta Premier Rachel Notley said Tuesday in her strongest rebuke yet since the outcome of the British Columbia election cast doubt over the project.

“We understand that some oppose the twinning of the pipeline and I respect their opinions,” Notley told a news conference in Edmonton.

“But I fundamentally disagree with the view that one province or even one region can hold hostage the economy of another province, or in this case, the economy of our entire country.”

A week ago, Christy Clark’s Liberals came out of the B.C. election one seat shy of a majority government, though recounts and absentee ballots could change the outcome.

B.C.’s NDP, which promised to use “every tool in the tool box” to stop the Kinder Morgan project, won 41 seats. That leaves the Greens, which also oppose the development, holding the balance of power with three seats.

“It’s our view that there are no tools available for a province to overturn or otherwise block a federal government decision to approve a project that is in the larger national interest,” Notley said.

“If there were such tools, Canada would be less a country and more a combination of individual fiefdoms, fighting with each other for advantage.”

The NDP premier’s comments came a day after the Federal Court of Appeal granted Alberta intervener status in a lawsuit filed by municipalities and First Nations against the Trans Mountain project.

Notley said her government will make the case that it has taken measures to reduce the environmental effects of the oil and gas industry and that it’s important for the country that the project go forward.

Both the City of Vancouver and the City of Burnaby, along with numerous First Nations and two advocacy groups, have filed what is now a combined lawsuit expected to be heard in October.

They oppose the project over concerns of a tanker or pipeline leak, the consequences increased tanker traffic would have on marine life and the higher upstream emissions of petroleum from the oilsands.

The Tsleil-Waututh Nation, one of the applicants of the lawsuit, opposed Alberta’s intervener status.

Construction on the Trans Mountain expansion is expected to begin in September, though it still needs a final investment decision.

Ian Bickis, The Canadian Press

GET ENERGYNOW’S DAILY EMAIL FOR FREE


Canadian Equipment Rentals Corp. Announces 2017 First Quarter Results

FOR: CANADIAN EQUIPMENT RENTALS CORP.
TSX VENTURE SYMBOL: CFL

Date issue: May 16, 2017
Time in: 7:24 PM e

Attention:

CALGARY, ALBERTA–(Marketwired – May 16, 2017) – Canadian Equipment Rentals
Corp. (the “Company”) (TSX VENTURE:CFL) today announced its financial and
operating results for the three months ended March 31, 2017.

“With the completion of the corporate restructuring and refinancing of debt,
the Company is now moving forward under a much lower cost structure and with a
clearly defined strategy to be a leading surface and accommodation rental
company in Western Canada” said Ken Olson, Canadian Equipment Rentals Corp.,
CFO. “We are pleased with the Company’s operational performance in the first
quarter of 2017 and with the current demand for rental equipment in the second
quarter. The increase in drilling and completion activity in Western Canada
thus far in 2017 suggests the industry is emerging from its multi-year
contraction and is beginning to show signs of recovery. As the Company
continues to strengthen its balance sheet by paying down debt with cash from
operations, it will become well positioned to take advantage of the improving
market environment.”

Highlights

Amounts in the following tables are presented in thousands of dollars, except
for per share amounts and percentages.

/T/

—————————————————————————-
—————————————————————————-

Three months ended
March 31
(in $000s) 2017 2016
—————————————————————————-
Revenue 4,442 3,311
Adjusted EBITDA(1,2) 1,128 1,131
Adjusted EBIT(1,2) (423) (1,942)
Net loss from continuing operations (969) (3,148)
Net (loss) income per share from continuing operations
Basic (0.02) (0.08)
Diluted (0.02) (0.08)
—————————————————————————-

/T/

Amounts in table represents continuing operations, which are comprised of the
Energy Services segment and Corporate

/T/

( 1) Adjusted for severances and business acquisition costs
( 2) See Financial Measures Reconciliations below

/T/

SELECT FINANCIAL RESULTS

/T/

— Revenues for the quarter ended March 31, 2017 increased by $1.1 million

or 34% from $3.3 million to $4.4 million compared to the same quarter in
2016. Commodity prices have improved slightly in the first quarter of
2017 compared to the same quarter 2016, resulting in a marginal increase
in demand and improved day rates. The quarter end March 31, 2017 also
represents a full three months of revenue earned from the Zedcor
Oilfield Rental Ltd. share purchase on February 2, 2016 and the Summit
Star Energy Services Inc. asset purchase on May 6, 2016.

— Net loss for the quarter ended March 31, 2017 was $1.0 million, an

improvement of $2.1 million or 69% from a loss of $3.1 million for the
quarter end March 31, 2016. Operating margin increased by $0.9 million
due to the increase in revenue, and depreciation decreased by $0.5
million as a result of divesting under-utilized assets in 2016. General
and administrative expenses were $0.2 million higher due to severance
payments and additional organizational costs attributed to the Zedcor
Oilfield Rental Ltd. acquisition. Higher interest rates and forbearance
fees relating to long-term debt and the note payable contributed to $0.5
million higher finance costs compared to prior year’s quarter ended
March 31, 2016. These are offset by an income tax recovery of $0.6
million in the current period.

— Adjusted EBITDA for the quarter ended March 31, 2017 was $1.1 million

similar to the quarter end March 31, 2016. The adjusted EBITDA for the
quarter ended March 31, 2017 did not increase relative to revenue for
the same quarter largely due to increased costs related to securing
alternative financing and incremental rent expense for additional
premises acquired with the Zedcor Oilfield Rentals Ltd. acquisition.

— On January 31, 2017, the Company announced that it had entered into an

asset purchase agreement with Cooper Rentals Canada Inc. to sell all the
assets of 4-Way Equipment Rentals. The transaction closed on February 9,
2017. Net proceeds were used to pay down senior debt.

— The General Rentals segment is classified as discontinued operations as

at March 31, 2017. As a result, its financial results are reported
separately from continuing operations on the statement of comprehensive
income. The comparative statements of comprehensive income are re-
presented as if the operation had been discontinued from the start of
the comparative year.

— The Waste Management segment was classified as discontinued operations

for the comparative period as the segment was sold on December 1, 2016.

— For the quarter ended March 31, 2017, the Company was in breach of its

financial leverage and interest coverage covenants as defined in the
April 28, 2016 Third Amending Credit Agreement, which resulted in a
default of the senior credit covenants. See further details in the
Liquidity and Capital Resources section.

/T/

SELECT OPERATING RESULTS

Energy Services Division

/T/

— The Energy Services segment includes the operations of Zedcor Energy

Services Corp. and represents 100% of the Company’s continuing
operations.

— The first quarter of 2017 saw a slight improvement to commodity prices

and drilling activity in the oil and gas sector in Western Canada
compared to the first quarter of 2016. As a result the Energy Services
segment saw an increase in utilization and a marginal increase in rental
rates. Despite the improvement to commodity prices, there is still high
competition from other service providers with idle assets which leads to
aggressive pricing measures.

— For the quarter ended March 31, 2017, Energy Services revenue of $4.4

million increased by $1.1 million compared to the similar period in
2016. Gross margin of $1.2 million increased $1.0 million compared to
the three months ended March 31, 2016. Depreciation expense decreased
$0.5 million compared to the same period in the prior year due to the
disposition of under-utilized assets in 2016.

/T/

General Rentals Division (Discontinued)

/T/

— For the quarters ended March 31, 2017 and 2016, the General Rentals

segment has been classified as a discontinued operation in the statement
of comprehensive income.

— On January 31, 2017, the Company announced that it had entered into an

asset purchase agreement with Cooper Rentals Canada Inc. to sell all the
assets of 4-Way Equipment Rentals. The transaction closed on February 9,
2017. Net proceeds were used to pay down senior debt.

/T/

Waste Management Division (Discontinued)

/T/

— For the quarter ended March 31, 2016, the Waste Management segment has

been classified as a discontinued operation in the statement of
comprehensive income.

— On November 17, 2016, the Company announced its intention to sell its

Waste Management operating segment and wholly owned subsidiary, MCL
Waste Systems & Environmental Inc., to a private Canadian waste
management and recycling services company. The transaction closed
December 1, 2016.

/T/

SELECTED QUARTERLY FINANCIAL INFORMATION

/T/

—————————————————————————-
—————————————————————————-

Mar Dec Sept June
31 31 30 30
(Unaudited – in $000s) 2017 2016 2016 2016
—————————————————————————-
Revenue 4,442 3,444 2,374 1,469
Net income (loss) from continuing operations (969) (3,106) (8,680) (4,683)
Net income (loss) from discontinued
operation (427) (3,062) (904) (92)
Adjusted EBITDA(1) 1,128 505 461 294
Adjusted EBITDA per share
– basic(1) 0.03 0.01 0.01 0.01
Net income (loss) per share from continuing
operations
Basic (0.02) (0.08) (0.21) (0.12)
Diluted (0.02) (0.08) (0.21) (0.12)
Net income (loss) per share from
discontinued operation
Basic (0.01) (0.07) (0.02) 0.00
Diluted (0.01) (0.07) (0.02) 0.00
Adjusted free cash flow(1) (488) 386 (1,807) 1,011

—————————————————————————-
—————————————————————————-

—————————————————————————-
—————————————————————————-

Mar Dec Sept June
31 31 30 30
(Unaudited – in $000s) 2016 2015 2015 2015
—————————————————————————-
Revenue 3,311 2,426 2,954 2,384
Net income (loss) from continuing operations (3,148)(16,032)(12,893) (1,387)
Net income (loss) from discontinued
operation (954) (659) 254 (579)
Adjusted EBITDA(1) 1,131 959 3,012 1,274
Adjusted EBITDA per share
– basic(1) 0.03 0.03 0.08 0.03
Net income (loss) per share from continuing
operations
Basic (0.08) (0.44) (0.35) (0.04)
Diluted (0.08) (0.44) (0.35) (0.04)
Net income (loss) per share from
discontinued operation
Basic (0.03) (0.02) 0.01 (0.02)
Diluted (0.03) (0.02) 0.01 (0.02)
Adjusted free cash flow(1) 1,450 (6) (690) 2,675

—————————————————————————-
—————————————————————————-

/T/

(1) See Financial Measures Reconciliations below

LIQUIDITY AND CAPITAL RESOURCES

On April 28, 2016, the Company’s Syndicated Bank Credit Facility was amended
under the Third Amending Agreement to amend the Debt to EBITDA and Interest
Coverage ratios as follows.

/T/

Mar 31 June 30 Sept 30 Dec 31 Mar 31
Third Amending Agreement 2016 2016 2016 2016 2017 Thereafter
—————————————————————————-
Debt/EBITDA 5.75:1 5.50:1 5.50:1 4.00:1 3.50:1 3.00:1
Interest Coverage 3.25:1 3.25:1 2.50:1 2.75:1 3.25:1 3.50:1

/T/

For the quarter ended September 30, 2016, the Company was in breach of its
financial leverage and interest coverage covenants included in the April 28,
2016 Third Amending Credit Agreement.

On November 24, 2016, the Company signed a Fourth Amending Agreement in which
the lenders agreed to forbear from demanding repayment or enforcing its
security under the Agreement. Under the terms of the amending agreement the
authorized amount of the revolving facility was reduced to $46.1 million, while
the authorized amount of the revolving capex facility remained $6.5 million.

On December 15, 2016 the Company’s Syndicated Bank Credit Facility was amended
under the Fifth Amending agreement. The fifth amending agreement included a
reduction in the revolving facility amount from $46 million to $32.5 million
and cancellation of the term facility commitment and operating facility.

Interest payable on all loans drawn under the credit facilities will range from
bank prime rate plus 300 bps to bank prime rate plus 600 bps depending on the
Company’s Debt to EBITDA ratio. Under the terms of the Sixth Amending Credit
Agreement, the Company was not in compliance of its financial leverage and
interest coverage covenants as at March 31, 2017 and thus all debt held with
the creditors is classified as current.

On February 16, 2017, the Company’s Syndicated Credit Facility was amended
under the Sixth Amending Agreement in which the lenders agree to forbear from
demanding repayment or enforcing its security under the agreement until April
28, 2017.

On April 21, 2017, the Company entered into a Loan and Security Agreement with
a new lender. The Loan and Security Agreement in the amount of $20.4 million
was used to repay the existing Syndicated Credit Facility, bears interest at a
rate of 12.75% and has a term of 12 months with an option to extend for an
additional 12 months at the satisfaction of the lender. The Loan and Security
Agreement is serviced by six months of interest only payments, followed by six
months of blended principal and interest payments. The Loan and Security
Agreement does not require quantitative financial covenants, but imposes
restrictions on the Loan’s collateral, being the property and equipment of the
Company. The Company issued the lender share purchase warrants entitling the
lender to acquire common shares in the Company representing approximately 6.5%
of the fully diluted equity at the time of exercise, at an exercise price of
$0.25 per warrant. The warrants will expire 90 days after the term of the loan.

On May 10, 2017, the Company signed a $1 million operating loan facility
bearing interest at a rate of prime plus 3.3% and secured by the Company’s
accounts receivables and restricted cash. The operating loan facility requires
that the Company’s current ratio does not fall below 1.50:1.00 and effective
September 30, 2017, the debt service coverage ratio not be less than 1.50:1.00.

OUTLOOK

2016 was a pivotal year for Canadian Equipment Rentals Corp. The acquisition of
Zedcor Oilfield Rentals Ltd. (“Zedcor”) and the subsequent divestitures of MCL
Waste Systems & Environmental Inc. and 4-Way Equipment Rentals Corp.,
repositioned the Company as a significant oilfield surface equipment rental
company in the Western Canadian Sedimentary Basin.

As previously announced, the Company signed and closed a new Loan and Security
Agreement, the proceeds of which were used to repay the previous lenders. In
conjunction with this refinancing, the Company has retired $2.5 million of the
Vendor Take Back Note in exchange for 10 million common shares. With this
transaction and the refinancing, the directors of the Company appointed two new
directors to the Company.

Through the restructuring efforts over the past ten months, including
significant reductions in headcount at the executive level and reductions in
associated discretionary spending, the Company now has a lean operating
structure that can also support the full utilization of the existing rental
asset base. This structure, coupled with superior operational performance,
service quality and a best-in-class equipment rental fleet are instrumental to
maintaining and growing market share.

The stronger than expected drilling activity experienced through the first
quarter of 2017 is seen continuing into the second quarter of 2017 which in
turn is driving improved year over year equipment utilization. While drilling
activity during the first two months of Q1 2017 was reported to be 46% improved
over the same prior year period, weather related delays and other factors may
prevent Q2 2017 from experiencing this same year over year growth.

The Company continues to expand its market reach and customer base from beyond
its traditional upstream energy services customers to new industry segments
including industrial facilities and pipeline construction. This should lead to
more diversity in its revenue streams and increase the utilization of existing
rental equipment by penetrating new market segments that are less affected by
seasonal fluctuations.

NON-IFRS MEASURES RECONCILIATION

The Company uses certain measures in this press release which do not have any
standardized meaning as prescribed by International Financial Reporting
Standards (“IFRS”). These measures which are derived from information reported
in the consolidated statements of operations and comprehensive income may not
be comparable to similar measures presented by other reporting issuers. These
measures have been described and presented in this press release in order to
provide shareholders and potential investors with additional information
regarding the Company.

Investors are cautioned that EBITDA, adjusted EBITDA and adjusted EBITDA per
share, adjusted free cash flow and payout ratio are not acceptable alternatives
to net income or net income per share, a measurement of liquidity, or
comparable measures as determined in accordance with IFRS.

EBITDA and Adjusted EBITDA

EBITDA refers to net income before finance costs, income taxes, depreciation,
amortization, and gains or losses on disposal of property and equipment.
Adjusted EBITDA is calculated as EBITDA before costs associated with business
acquisition costs and share based compensation. These measures do not have a
standardized definition prescribed by IFRS and therefore may not be comparable
to similar captioned terms presented by other issuers.

Management believes that EBITDA and Adjusted EBITDA are useful measures of
performance as they eliminate non-recurring items and the impact of finance and
tax structure variables that exist between entities. “Adjusted EBITDA per share
– basic” refers to Adjusted EBITDA divided by the weighted average basic number
of shares outstanding during the relevant periods.

A reconciliation of net income to Adjusted EBITDA is provided below:

/T/

—————————————————————————-
—————————————————————————-

Three months
ended March 31
(in $000s) 2017 2016
—————————————————————————-
Net loss from continuing operations (969) (3,148)
Add:
Finance costs 714 194
Depreciation 1,559 2,025
Amortization of intangibles 165 165
Impairment of property and equipment – 5,152
Purchase gain – (2,108)
Income taxes (recovery) (615) (2,021)
Discontinued operation (109) 292
—————————————————————————-
EBITDA 745 551
—————————————————————————-
Add:
Stock based compensation (1) (6)
Severance costs 384 243
Business acquisition costs – 343
—————————————————————————-
Adjusted EBITDA 1,128 1,131
—————————————————————————-
—————————————————————————-

/T/

Adjusted EBIT

Adjusted EBIT refers to earnings before interest and finance charges, taxes,
amortization, impairment of intangibles, purchase gain, other gain, severance
costs and business acquisition costs.

A reconciliation of net income to Adjusted EBIT is provided below:

/T/

—————————————————————————-
—————————————————————————-

Three months
ended March 31
(in $000s) 2017 2016
—————————————————————————-
Net loss from continuing operations (969) (3,148)
Add:
Finance costs 714 194
Amortization of intangibles 165 165
Impairment of property and equipment – 5,125
Purchase gain – (2,108)
Income taxes (recovery) (615) (2,021)
Severance costs 95 201
Business acquisition costs – 343
Discontinued operation 187 (693)
—————————————————————————-
Adjusted EBIT (423) (1,942)
—————————————————————————-
—————————————————————————-

/T/

No Conference Call

No conference call will be held in conjunction with this release. Full details
of the Company’s financial results, in the form of the condensed consolidated
interim financial statements and notes for the three months ended March 31,
2017 and Management’s Discussion and Analysis of the results are available on
SEDAR at www.sedar.com and on the Company’s website at www.cercorp.ca.

About Canadian Equipment Rentals Corp.

Canadian Equipment Rentals Corp. is a Canadian public corporation and parent
company to Zedcor Energy Services Corp. (“Zedcor”). Zedcor is engaged in the
rental of surface equipment and accommodations to the Western Canadian Oil and
Gas Industry. The Company trades on the TSX Venture Exchange under the symbol
“CFL”.

FORWARD-LOOKING STATEMENTS

Certain statements included or incorporated by reference in this press release
constitute forward-looking statements or forward-looking information, including
management’s belief that improvement in demand should begin to drive
improvements in equipment rental rates and that the expanded market reach and
customer base will lead to more diversity in the Company’s revenue stream and
increase utilization. Forward-looking statements or information may contain
statements with the words “anticipate”, “believe”, “expect”, “plan”, “intend”,
“estimate”, “propose”, “budget”, “should”, “project”, “would have realized’,
“may have been” or similar words suggesting future outcomes or expectations.
Although the Company believes that the expectations implied in such
forward-looking statements or information are reasonable, undue reliance should
not be placed on these forward-looking statements because the Company can give
no assurance that such statements will prove to be correct. Forward-looking
statements or information are based on current expectations, estimates and
projections that involve a number of assumptions about the future and
uncertainties. These assumptions include that the Company’s cost cutting
measures that have been implemented will protect future margins and that the
Company’s lean operations will protect against profound down swings in the
economic environment. Although management believes these assumptions are
reasonable, there can be no assurance that they will be proved to be correct,
and actual results will differ materially from those anticipated. For this
purpose, any statements herein that are not statements of historical fact may
be deemed to be forward-looking statements. The forward-looking statements or
information contained in this press release are made as of the date hereof and
the Company assumes no obligation to update publicly or revise any
forward-looking statements or information, whether as a result of new contrary
information, future events or any other reason, unless it is required by any
applicable securities laws. The forward-looking statements or information
contained in this press release are expressly qualified by this cautionary
statement.

Neither TSX Venture Exchange nor its Regulation Services Provider (as that term
is defined in the policies of the TSX Venture Exchange) accepts responsibility
for the adequacy or accuracy of this release.

– END RELEASE – 16/05/2017

For further information:
Ken Olson
Chief Financial Officer
(403) 930-5434
[email protected]

COMPANY:
FOR: CANADIAN EQUIPMENT RENTALS CORP.
TSX VENTURE SYMBOL: CFL

INDUSTRY: Energy and Utilities – Equipment, Energy and Utilities –
Oil and Gas
RELEASE ID: 20170516CC0107

Press Release from Marketwired 1-866-736-3779

All press releases are written by the client and have NO affiliation with the news copy written by The Canadian Press. Any questions that arise due to the content or information provided in the press release should be directed to the company/organization
issuing the release, not to The Canadian Press.

GET ENERGYNOW’S DAILY EMAIL FOR FREE


Alberta Premier says moving National Energy Board to Ottawa would be “dumb”

EDMONTON — Alberta Premier Rachel Notley says a proposal to move part of the National Energy Board’s operations to Ottawa is “dumb” and she’s opposed to the idea.

A federal panel on the modernization of the NEB made the proposal to move to Ottawa the board of directors, a new energy statistical agency, the government co-ordination office, and to shift electricity transmission staff to Ottawa.

The panel, however, said that moving all of the NEB, which is focused on pipeline regulations, would prove too disruptive, and that other proposals in the report better address concerns around bias stemming from the office being based along with the oil and gas industry in Calgary.

Notley says she’s seen no evidence that the NEB is biased as some commenters told the panel, and certainly not on the basis of the regulator’s geography.

She says it makes sense for the regulator to be in Calgary for a full understanding of the industry they are regulating and that a move of the office makes as much sense as moving the Atlantic Opportunities Marketing Agency to Winnipeg.

The report Monday proposed splitting the NEB into a regulatory body and an energy information agency, as well as extending the review time for projects and increasing engagement and consultations with First Nations and others.


The Canadian Press

GET ENERGYNOW’S DAILY EMAIL FOR FREE


Pengrowth Receives Continued Listing Standard Notification from the New York Stock Exchange

FOR: PENGROWTH ENERGY CORPORATIONTSX SYMBOL: PGFNYSE SYMBOL: PGHDate issue: May 16, 2017Time in: 6:21 PM eAttention:
CALGARY, ALBERTA–(Marketwired – May 16, 2017) – Pengrowth Energy Corporation
(TSX:PGF) (NYSE:PGH) today announced that it received no…

GET ENERGYNOW’S DAILY EMAIL FOR FREE


Cub Energy Announces Results From the Annual General Meeting of Shareholders

FOR: CUB ENERGY INC.
TSX VENTURE SYMBOL: KUB

Date issue: May 16, 2017
Time in: 6:21 PM e

Attention:

HOUSTON, TEXAS–(Marketwired – May 16, 2017) – Cub Energy Inc. (“Cub” or the
“Company”) (TSX VENTURE:KUB) announces the following results from the Annual
General Meeting of Shareholders (“AGM”) held at Cub’s Houston, Texas office on
May 16, 2017:

/T/

– Davidson & Company LLP — was appointed as the Company’s auditors for
2017
– Election of Cub’s Board of Directors as follows:

Mikhail Afendikov, also appointed Chairman of the Board
Frank Mermoud
Tim Marchant
John Booth

/T/

At the AGM, shareholders also passed two proposed resolutions, approving a
possible share consolidation and renewal of the Company’s Stock Option Plan.
There were 193,538,111 shares represented at the meeting, representing 62
percent of Cub’s issued and outstanding shares. Including proxy voting,
shareholders voted in favor of the election of directors and all other matters
by more than 92 percent.

About Cub Energy Inc.

Cub Energy Inc. (TSX VENTURE:KUB) is an upstream oil and gas company, with a
proven track record of exploration and production cost efficiency in Ukraine.
The Company’s strategy is to implement western technology and capital, combined
with local expertise and ownership, to increase value in its undeveloped land
base, creating and further building a portfolio of producing oil and gas assets
within a high pricing environment.

For further information please contact us or visit our website:
www.cubenergyinc.com.

Reader Advisory

With the current cash resources, suspension of the RK field, uncertainty
surrounding the successful installation of the NRU, dividend restrictions,
currency fluctuations, reliance on a limited number of customers, and impact on
carrying values, the Company may not have sufficient cash to continue the
exploration and development activities. These matters raise significant doubt
about the ability of the Company to continue as a going concern and meet its
obligations as they become due.

Except for statements of historical fact, this news release contains certain
“forward-looking information” within the meaning of applicable securities law.
Forward-looking information is frequently characterized by words such as
“plan”, “expect”, “project”, “intend”, “believe”, “anticipate”, “estimate” and
other similar words, or statements that certain events or conditions “may” or
“will” occur. Cub believes that the expectations reflected in the
forward-looking information are reasonable; however there can be no assurance
those expectations will prove to be correct. We cannot guarantee future
results, performance or achievements. Consequently, there is no representation
that the actual results achieved will be the same, in whole or in part, as
those set out in the forward-looking information.

Forward-looking information is based on the opinions and estimates of
management at the date the statements are made, and are subject to a variety of
risks and uncertainties and other factors that could cause actual events or
results to differ materially from those anticipated in the forward-looking
information. Some of the risks and other factors that could cause the results
to differ materially from those expressed in the forward-looking information
include, but are not limited to: general economic conditions in Ukraine, the
Black Sea Region and globally; political unrest and security concerns in
Ukraine; industry conditions, including fluctuations in the prices of natural
gas and foreign currency; governmental regulation of the natural gas industry,
including environmental regulation; unanticipated operating events or
performance which can reduce production or cause production to be shut in or
delayed; failure to obtain industry partner and other fourth party consents and
approvals, if and when required; competition for and/or inability to retain
drilling rigs and other services; the availability of capital on acceptable
terms; the need to obtain required approvals from regulatory authorities; stock
market volatility; volatility in market prices for natural gas; liabilities
inherent in natural gas operations; competition for, among other things,
capital, acquisitions of reserves, undeveloped lands, skilled personnel and
supplies; incorrect assessments of the value of acquisitions; geological,
technical, drilling, processing and transportation problems; changes in tax
laws and incentive programs relating to the natural gas industry; failure to
realize the anticipated benefits of acquisitions and dispositions; and the
other factors. Readers are cautioned that this list of risk factors should not
be construed as exhaustive.

This cautionary statement expressly qualifies the forward-looking information
contained in this news release. We undertake no duty to update any of the
forward-looking information to conform such information to actual results or to
changes in our expectations except as otherwise required by applicable
securities legislation. Readers are cautioned not to place undue reliance on
forward-looking information.

Neither the TSX Venture Exchange nor its Regulation Services Provider (as that
term is defined in the policies of the TSX Venture Exchange) accepts
responsibility for the adequacy or accuracy of this release.

– END RELEASE – 16/05/2017

For further information:
Cub Energy Inc.
Mikhail Afendikov
Chairman and Chief Executive Officer
(713) 677-0439
[email protected]
OR
Cub Energy Inc.
Patrick McGrath
Chief Financial Officer
(713) 577-1948
[email protected]
www.cubenergyinc.com

COMPANY:
FOR: CUB ENERGY INC.
TSX VENTURE SYMBOL: KUB

INDUSTRY: Energy and Utilities – Oil and Gas
RELEASE ID: 20170516CC0100

Press Release from Marketwired 1-866-736-3779

All press releases are written by the client and have NO affiliation with the news copy written by The Canadian Press. Any questions that arise due to the content or information provided in the press release should be directed to the company/organization
issuing the release, not to The Canadian Press.

GET ENERGYNOW’S DAILY EMAIL FOR FREE


Tribes in U.S. and Canada unite against Keystone XL oil pipeline

BISMARCK, N.D. — Tribes representing tens of thousands of indigenous people in the U.S. and Canada will be signing a declaration against the planned Keystone XL oil pipeline.

Leaders of the Blackfoot Confederacy in Canada and the Great Sioux Nation and Ponca tribe in the U.S. plan to sign their declaration at a ceremony Wednesday at the Glenbow Museum in Calgary, the city where pipeline developer TransCanada Corp. (TSX:TRP) is based.

“There is a historic union between first Americans in Canada and Native Americans in the United States,” said Casey Camp-Horinek, a councilwoman with the Ponca tribe in Oklahoma. “Long before a border ever existed on a map, a fictitious line on a map, we were a united peoples in our approach to care of Mother Earth.”

The 16-page declaration highlights the tribes’ treaty rights and their opposition to the proposed US$8-billion pipeline, which would move Canadian crude south to Nebraska, where the pipeline would connect with an existing Keystone pipeline network that would take the oil to Texas Gulf Coast refineries.

“Greed knows no limits, and those in the way are simply collateral damage to corporate profits,” said Brandon Sazue, chairman of the Crow Creek Sioux in South Dakota and one of the leaders of the event.

TransCanada, which has both a Native American Relations Policy and an Aboriginal Relations Policy, maintains the pipeline will be environmentally safe and will create jobs and boost the economy.

“We understand and respect that there are some who might have different views about this project,” spokeswoman Jacquelynn Benson said. “TransCanada is always interested in the views of our stakeholders along the right of way.”

President Barack Obama rejected the project in 2015, but the Trump administration overturned that decision this year.

The project still faces hurdles. A coalition of environmental groups has challenged the federal permit in court, saying more environmental study is needed. Nebraska regulators also haven’t decided whether to approve the proposed route through that state.

Tribes plan to use Wednesday’s document to draw attention to their cause — possibly sending it to the United Nations — while they also consider other opposition, including protest camps along the pipeline route, Camp-Horinek said.

Months of demonstrations against the recently completed Dakota Access oil pipeline drew hundreds and sometimes thousands of protesters to a North Dakota camp.

“There will be that kind of resistance” to Keystone XL, Camp-Horinek said. “Those thoughts are in place, where those camps will be best suited.”

___

Follow Blake Nicholson on Twitter at: https://twitter.com/NicholsonBlake

Blake Nicholson, The Associated Press

GET ENERGYNOW’S DAILY EMAIL FOR FREE


Aveda Transportation and Energy Services Reports Record First Quarter Revenue in 2017

FOR: AVEDA TRANSPORTATION AND ENERGY SERVICES
TSX VENTURE Symbol: AVE

Date issue: May 16, 2017
Time in: 4:15 PM e

Attention:

CALGARY, AB –(Marketwired – May 16, 2017) – Aveda Transportation and Energy
Services Inc. (“Aveda” or the “Company”) (TSX VENTURE: AVE), a leading
provider of oilfield hauling services and equipment rentals to the energy
industry, is pleased to announce its results for the three months ended March
31, 2017.

2017 First Quarter Business Highlights

/T/

— Revenue for the three months ended March 31, 2017 increased by $29.0

million or 241% to $41.0 million, compared with revenue of $12.0 million
for the same period in 2016. Compared to the fourth quarter of 2016,
revenue increased by $9.6 million from $31.4 million to $41.0 million
due to improved rig counts, increased activity, and strong customer
relationships developed by the management team put in place mid 2016;
— Gross profit excluding depreciation and amortization(1) in the first
quarter of 2017 increased by $7.0 million to $6.8 million compared to a
loss of $0.1 million in 2016. Comparing to the fourth quarter of 2016,
gross profit excluding depreciation and amortization(1) increased by 45%
from $4.7 million to $6.8 million;
— Adjusted EBITDA(1) in the first quarter of 2017 increased by $6.4
million to $2.6 million compared to a loss of $3.9 million in the first
quarter of 2016;
— Net loss for the three months ended March 31, 2017 decreased by almost
$7.0 million to $3.4 million, compared to a net loss of $10.3 million
for the same period in 2016. Loss per share was $0.10 compared to $0.54
in the comparative period;
— Aveda expanded its operational footprint by opening a new terminal in
Casper, WY;
— Aveda ended the quarter with a net asset value per share(6) of $0.70,
$10.4 million in working capital with a working capital ratio of
1.45:1(2), and undrawn cash availability of $34.0 million on its senior
debt facility;
— Aveda restructured its debt in the first quarter of 2017 as further
outlined in the Company’s news release dated January 13, 2017 and MD&A;
— The Company also raised gross proceeds of $22.8 million through an
equity offering as outlined in the news released dated, February 22,
2017; and
— As a result of both successfully restructuring its debt and raising the
equity outlined above, the Company now has a significantly stronger
balance sheet.

/T/

“The efforts of our team have resulted in Aveda posting record revenue of $41
million in the first quarter of 2017,” said Ronnie Witherspoon, President and
Chief Executive Officer of Aveda. “I am extremely excited by our results to
date and look forward to continued success throughout 2017.”

The Company’s consolidated financial statements and Management’s Discussion
and Analysis are available on the Company’s website at www.avedaenergy.com and
the SEDAR website at www.sedar.com.

Investor Relations Update

The Company has posted an updated corporate presentation to its website. The
updated corporate presentation can be found at
http://www.avedaenergy.com/investor-hub/presentations/default.aspx.

Aveda’s CEO and CFO also expect to be making presentations to retail and
institutional investors in May and June 2017.

Conference Call

The Company will host its first quarter fiscal 2017 results conference call on
Wednesday, May 17, 2017 at 10:30 a.m. Eastern Time (ET). President and CEO
Ronnie Witherspoon and Vice-President, Finance and CFO Bharat Mahajan will
discuss Aveda’s financial results for the quarter and then take questions from
securities analysts.

To access the conference call by telephone, dial (416) 915-3239 or (403)
351-0324. A live audio webcast of the conference call will be available at:
http://services.choruscall.ca/links/aveda20170517.html.

The conference call webcast will be archived and available until June 30, 2017
at:

http://www.avedaenergy.com/investor-hub/conference-calls/default.aspx.

Financial Overview

/T/

(in thousands, except per share and
ratio amounts)
—————————————-

Three Three
Months Months
Ended Ended % Change
March 31, March 31, 2016 –
2017 2016 2017
———- ———- ———-
Revenue 40,962 12,011 241.0%
Gross profit (loss)(1) 2,932 (4,787) 161.2%
Gross margin(4) 7.2% -39.9% N/A
Gross profit (loss)(1) excluding
depreciation and amortization 6,798 (132) 5250.0%
Gross margin excluding depreciation and
amortization(5) 16.6% -1.1% N/A
Adjusted EBITDA (loss)(1) 2,559 (3,865) 166.2%
Adjusted EBITDA(1) as a percentage of
revenue 6.2% -32.2% N/A
Net income (loss) (3,412) (10,293) 66.9%
Net loss as a percentage of revenue -8.3% -85.7% N/A
Adjusted EBITDA (loss)(1) per share 0.07 (0.20) -135.0%
Earnings per share – basic and diluted (0.10) (0.54) -81.5%
Current ratio(2) 1.5 1.7 -12.7%
Debt to equity ratio(3) 1.7 1.7 0.0%

/T/

Outlook

Aveda earns revenue primarily by providing specialized transportation services
to companies engaged in the exploration, development and production of
petroleum resources. As a result, demand for Aveda’s transportation services
is generally linked to the economic conditions of the energy industry and the
level of drilling activity in the US and the WCSB.

2016 was a challenging year, yet the Company steadily improved its performance
in the last two quarters of 2016 and the trend continues into 2017 with the
Company generating positive Adjusted EBITDA in the third and fourth quarters
of 2016 and the first quarter of 2017. Relative to the first half of 2016,
both oil and natural gas prices have rebounded and rig counts in both Canada
and the United States have substantially risen in the first quarter of 2017.
Activity levels, particularly in the United States are continuing to increase.

In the third quarter of 2016, the Company opened a second location in the
Permian Basin in Pecos, TX. In the fourth quarter of 2016, the Company
recommenced operations in the Marcellus Shale in Williamsport, PA. In the
first quarter of 2017, the Company expanded its operations by opening a
satellite facility in Casper, WY to service the Uinta, Wamsutter, Pinedale and
DJ Basins. In the second quarter of 2017, the Company has expanded its
operations by opening a new satellite yard in Midland, TX in the Permian
Basin. The Company also expects to expand its operations in the second quarter
of 2017 by relocating its existing operations in Marshall, TX to a larger
facility and expanding its operations at that location. The Company is also
evaluating opening a second location in the Northeastern United States.

The Company restructured its senior leadership team in the first half of 2016
with individuals that have extensive relationships in the oil and gas sector.
Through these relationships, the Company is being invited to participate in an
increased amount of bid activity. The Company’s revenue results since the new
management team took over are as follows:

http://www.marketwire.com/library/MwGo/2017/5/16/11G139041/Images/image-29f99
2f1922286d291fa5a93fe4c8e56.jpg

Based on the information above, Aveda expects to see continued improvements in
Adjusted EBITDA and net income results in 2017.

About Aveda Transportation and Energy Services

Aveda provides specialized transportation services and equipment required for
the exploration, development and production of petroleum resources in the
Western Canadian Sedimentary Basin and in the United States of America
principally in and around the states of Texas, Oklahoma and North Dakota.
Transportation services include both the equipment necessary to move the load
as well as a trained, professional driver capable of securing, moving and
manipulating the load at its origin and destination. Aveda’s rental operations
include the rental of well-sites, tanks, mats, pickers, light towers and other
equipment necessary for oilfield operations.

Aveda was incorporated in 1994 as a private company to serve the oil and gas
industry. In the spring of 2006 the Company went public on the TSX Venture
Exchange. Aveda has major operations in Calgary, AB, Leduc, AB, Edson, AB,
Pleasanton, TX, Midland, TX, Pecos, TX, Marshall, TX, Williston, ND, Casper,
WY, Williamsport, PA and Oklahoma City, OK. Aveda is publicly traded on the
TSX Venture Exchange under the symbol AVE. For more information on Aveda
please visit www.avedaenergy.com.

This News Release contains certain forward-looking statements and
forward-looking information (collectively referred to herein as
“forward-looking statements”) within the meaning of applicable Canadian
securities laws. All statements other than statements of present or historical
fact are forward-looking statements. Forward-looking statements are often, but
not always, identified by the use of words such as “anticipate”, “achieve”,
“could”, “believe”, “plan”, “intend”, “objective”, “continuous”, “ongoing”,
“estimate”, “outlook”, “expect”, “may”, “will”, “project”, “should” or similar
words, including negatives thereof, suggesting future outcomes. In particular,
this News Release contains forward-looking statements relating to: demand for
the Company’s services and general industry activity level; the Company’s
growth opportunities; and expectations regarding the Company’s revenue,
EBITDA, Adjusted EBITDA and equipment utilization. Aveda believes the
expectations reflected in such forward-looking statements are reasonable as of
the date hereof but no assurance can be given that these expectations will
prove to be correct and such forward-looking statements should not be unduly
relied upon.

Various material factors and assumptions are typically applied in drawing
conclusions or making the forecasts or projections set out in forward-looking
statements. Those material factors and assumptions are based on information
currently available to Aveda, including information obtained from third party
industry analysts and other third party sources. In some instances, material
assumptions and material factors are presented elsewhere in this News Release
in connection with the forward-looking statements. Readers are cautioned that
the following list of material factors and assumptions is not exhaustive.
Specific material factors and assumptions include, but are not limited to:

/T/

— the performance of Aveda’s businesses, including current business and

economic trends;
— oil and natural gas commodity prices and production levels;
— the effect of the rebranding on Aveda’s businesses;
— capital expenditure programs and other expenditures by Aveda and its
customers:
— the ability of Aveda to retain and hire qualified personnel;
— the ability of Aveda to obtain parts, consumables, equipment,
technology, and supplies in a timely manner to carry out its activities;
— the ability of Aveda to maintain good working relationships with key
suppliers;
— the ability of Aveda to market its services successfully to existing and
new customers;
— the ability of Aveda to obtain timely financing on acceptable terms;
— currency exchange and interest rates;
— risks associated with foreign operations;
— changes under governmental regulatory regimes and tax, environmental and
other laws in Canada and the United States; and
— a stable competitive environment.

/T/

The forward-looking statements regarding Aveda’s potential revenue, EBITDA and
Adjusted EBITDA are included herein to provide readers with an understanding
of Aveda’s anticipated cash flow and Aveda’s ability to fund its expenditures
based on the assumptions described herein. Readers are cautioned that this
information may not be appropriate for other purposes.

Forward-looking statements are not a guarantee of future performance and
involve a number of risks and uncertainties, some of which are described
herein. Such forward-looking statements necessarily involve known and unknown
risks and uncertainties, which may cause Aveda’s actual performance and
financial results in future periods to differ materially from any projections
of future performance or results expressed or implied by such forward-looking
statements. These risks and uncertainties include, but are not limited to, the
risks identified in Aveda’s annual information form and management discussion
and analysis for the year ended December 31, 2016 (the “MD&A”), which are
available for viewing on SEDAR at www.sedar.com. Any forward-looking
statements are made as of the date hereof and, except as required by law,
Aveda assumes no obligation to publicly update or revise such statements to
reflect new information, subsequent or otherwise.

This News Release contains the terms “EBITDA”, “Adjusted EBITDA”, “gross
profit” “gross profit margin”, “gross profit excluding depreciation and
amortization” and “gross margin excluding depreciation and amortization” which
are defined in the MD&A. The above terms as presented do not have any
standardized meanings prescribed by international financial reporting
standards (“IFRS”) and therefore may not be comparable with the calculation of
similar measures for other entities. Management uses EBITDA, Adjusted EBITDA,
gross profit, gross profit margin, gross profit excluding depreciation and
amortization, and gross margin excluding depreciation and amortization to
analyze the operating performance of the business. These non-IFRS measures
presented are not intended to represent cash provided by operating activities,
net earnings or other measures of financial performance calculated in
accordance with IFRS.

This News Release contains the terms “cash flow”, “working capital” and
“working capital ratio”, which do not have any standardized meanings
prescribed by IFRS and therefore may not be comparable with the calculation of
similar measures for other entities. As an indicator of the Company’s
performance, cash flow should not be considered as an alternative to, or more
meaningful than, net cash from operating activities as determined in
accordance with IFRS. The Company considers cash flow to be a key measure as
it demonstrates the Company’s underlying ability to generate the cash
necessary to fund operations and support activities related to its major
assets. Cash flow is determined by adding back changes in non-cash operating
working capital to cash from operating activities. Management calculates
working capital as current assets less current liabilities and uses this
measure to analyze operating performance and leverage.

Notes:

/T/

1. See March 31, 2017 MD&A Section 6.
2. Current ratio calculated as current assets divided by current

liabilities.
3. Debt includes loans and borrowings and note payable as per their
carrying amounts on the balance sheet.
4. Gross margin is calculated as gross profit divided by revenue.
5. Gross margin excluding depreciation and amortization is calculated by
dividing gross profit excluding depreciation and amortization by
revenue.
6. Net asset value per share calculated by dividing total equity ($40.2
million) by common shares outstanding (57.2 million).

/T/

Neither TSX Venture Exchange nor its Regulation Services Provider (as that
term is defined in the policies of the TSX Venture Exchange) accepts
responsibility for the adequacy or accuracy of this release.

Image Available: http://www.marketwire.com/library/MwGo/2017/5/16/11G139041/Images/image-29f992f1922286d291fa5a93fe4c8e56.jpg

– END RELEASE – 16/05/2017

For further information:

For more information, please contact:
Bharat Mahajan, CA
Vice President, Finance and Chief Financial Officer
(403) 264-5769
[email protected]

COMPANY:
FOR: AVEDA TRANSPORTATION AND ENERGY SERVICES
TSX VENTURE Symbol: AVE

INDUSTRY: Transportation and Logistics – Trucking, Energy and Utilities – Oil
and Gas

RELEASE ID: 20170516CC017

Press Release from Marketwired 1-866-736-3779

All press releases are written by the client and have NO affiliation with the news copy written by The Canadian Press. Any questions that arise due to the content or information provided in the press release should be directed to the company/organization
issuing the release, not to The Canadian Press.

GET ENERGYNOW’S DAILY EMAIL FOR FREE


XEU1 Explosion-Proof Heaters – New Models & Options – Hazloc Heaters – Details HERE

Hazloc HeatersTM, a leading manufacturer of industrial unit heaters for hazardous and severe-duty locations, is pleased to announce the introduction of a 3kW heater model, LED pilot light and continuous fan option on the XEU1 series of Electric Forced-Air Explosion-Proof Heaters. The XEU1 series of unit heaters are designed for rugged industrial applications to provide … Read more

GET ENERGYNOW’S DAILY EMAIL FOR FREE


National gas station count growing again thanks to stronger profit margins

CALGARY — The number of gasoline stations in Canada grew for the second consecutive year in 2016 after a 10-year decline that resulted in the loss of one in five outlets.

The Kent Group’s annual census showed a net increase of 15 outlets in 2016, taking the total to almost 12,000 or about three stations for every 10,000 people. Just over 100 stations were added in 2015.

The survey by the retail fuel industry consulting firm comes as large refining companies sell their retailing divisions to buyers who continue to use the same brands.

Imperial Oil sold its last 500 Esso-branded retail gas stations to five fuel distributors for $2.8 billion last year. Chevron Canada recently agreed to sell 129 Vancouver-area stations and its B.C. refinery for $1.5 billion to Alberta’s Parkland Fuel.

Although 39 per cent of the stations in Canada sell fuel with brands associated with the three major refining companies — Suncor (Petro-Canada), Imperial (Esso) or Shell — only 11 per cent were owned or managed by them in 2016, the survey says.

Jason Parent, vice-president of consulting for Kent, says the average margin on gasoline has risen to eight or nine cents per litre in the past two years from the 20-year norm of four to six cents, leaving more profits at the pump for the owners.

He says fewer locations are closing these days because higher margins are supporting marginal or low-volume performers.

Parent also said there were fewer gasoline stations opened at big box stores like Costco or Walmart last year.

“The growth in the number of sites has slowed significantly for big box,” he said.

“That said, big box sites are very unique in that they do a ton of volume and they have a big impact on the market even if there are only a couple of them.”

Dan Healing, The Canadian Press

GET ENERGYNOW’S DAILY EMAIL FOR FREE


Federal Carbon Tax Plans Temper Oil-patch Optimism – MNP LLP

​The federal government is expected to release an outline of its proposed carbon tax plan this week, borrowing heavily from the Alberta model which already has oilfield services anticipating rising costs. Uncertainty around how Ottawa will impose a price on carbon has dogged the oilpatch for years, with Saskatchewan and Manitoba vehemently opposing a levy … Read more

GET ENERGYNOW’S DAILY EMAIL FOR FREE


Quantum Downhole Systems, Leading the Way for Innovation – NextShale 2017

By Garrett Luebke “Canada is one of the best places in the world where great technology is developed,” says Steven Winkler, President and Director of Quantum Downhole Systems (‘Quantum’). The Shale Fracturing revolution was developed in Canada and has opened an entire sub-industry proven to expose reservoirs previously not economically feasible around the world. Quantum … Read more

GET ENERGYNOW’S DAILY EMAIL FOR FREE


COURSE: May 23-24 Calgary Leadership Skills Course with Paul Endress (20% Discount)- PEICE

  PEICE will be hosting the very popular 2 day  “Leadership Skills for Supervisors” on May 23-24th, in Calgary. Not just for supervisors or managers, this two-day course presents practical principles for everyone in their efforts to motivate and mobilize team members toward the fulfillment of team and corporate objectives, with a strong focus on … Read more

GET ENERGYNOW’S DAILY EMAIL FOR FREE


Midwest Energy Emissions Corp. Reports Record First Quarter 2017 Financial Results

FOR: MIDWEST ENERGY EMISSIONS CORP.
OTCQB Symbol: MEEC

Date issue: May 16, 2017
Time in: 8:30 AM e

Attention:

Q1 2017 Revenues Increase 59% to $5.4 Million

LEWIS CENTER, OH –(Marketwired – May 16, 2017) – Midwest Energy Emissions
Corp. (OTCQB: MEEC) (“ME2C” or the “Company”), a leader in mercury emissions
control in North America, has provided its financial results for the first
quarter ended March 31, 2017.

/T/

——————————————————————–
First Quarter 2017 Results
——————————————————————–

Q1 2017 Q1 2016 CHANGE (%)
————————— ————– ————– ———-
Revenues $5.4 million $3.4 million 59%
————————— ————– ————– ———-
Operating Income (Loss) ($1.1) million ($0.3) million N/A%
————————— ————– ————– ———-
GAAP Net Income (Loss) ($1.4) million $0.9 million N/A%
————————— ————– ————– ———-
Adjusted EBITDA (non-GAAP)1 $0.1 million $0.0 million 806%
————————— ————– ————– ———-
Shares Outstanding (F/D) 74.2 million 47.4 million 57%
————————— ————– ————– ———-

/T/

1. We define Adjusted EBITDA (a non-GAAP financial measure) as net income
adjusted for interest and financing fees, income taxes, depreciation,
amortization, stock based compensation and other non-cash income and expenses.
Please see “Use of Non-GAAP Financial Measures” below.

Management Commentary

“We continued our steadfast progress in the first quarter of 2017, which is
evidenced by our revenue growth of 59% to $5.4 million,” said Richard
MacPherson, President and CEO of ME2C. “In addition to our first quarter
typically being the low watermark of the year due to many southwestern
utilities decreasing electricity generation during the colder months, we have
also experienced a slower than expected closing rate of new, long term
contracts.

“While this may be due to several factors, many of our competitors have
reduced their overall cost of product in response to our growing presence in
the marketplace, which has created a more competitive landscape and
hesitations in disrupting long term legacy contracts already in place.”

MacPherson continued, “That being said, we’ve maintained a robust sales
pipeline in excess of 20 EGUs across the U.S. and Canada, which we continue to
expand upon with new opportunities added regularly, while also pursuing
opportunities abroad. For the remainder of 2017, we are squarely focused on
leveraging our IP portfolio and converting opportunities into long-term,
recurring revenue contracts, while reducing unnecessary costs and maintaining
a high margin, profitable business. In addition, we look forward to the
positive effects on our sales from the acquisition of our patents in April
2017 from the Energy & Environmental Research Center Foundation. These patents
cover our proprietary two part process for mercury control, and should provide
new opportunities for meaningful licensing revenues throughout North America.
Despite the lowered guidance for the year, our pipeline of opportunities
remains intact, which ultimately should drive shareholder value over the long
term as we execute upon our strategic initiatives.”

Recent Corporate Highlights

In January 2017, the Company announced that it added a new product to its
proven, cost-effective mercury capture program that will reduce mercury
emissions by preventing scrubber reemission events. The product is
specifically designed for coal-fired power utilities with wet scrubbers to
help remove mercury, as well as other metals, from the scrubber. This new
product has been successfully demonstrated at several large coal-burning power
facilities and has consistently proven to reduce mercury reemission from wet
flue gas desulfurization systems, achieving greater than 95% mercury control,
resulting in stack mercury emissions well below MATS compliance limits. The
Company is moving forward aggressively with this product, as there are over
150 opportunities across the nation being targeted.

In March 2017, ME2C secured an order in excess of $1,000,000 for a new
injection system for a large fleet owner of electric generating units (EGUs)
which uses ME2C’s proprietary Sorbent Enhancement Additive (SEA⃤ó) Technology.
It is expected that this order will lead to several other opportunities
throughout this customer’s fleet.

In April 2017, ME2C secured a contract renewal valued at over $5.0 million in
the aggregate over the next two years from a current utility customer in the
Midwest region of the United States. The customer has been utilizing ME2C’s
proprietary Sorbent Enhancement Additive (SEA⃤ó) Technology since 2015 to
achieve and remain in full compliance with Mercury and Air Toxic Standards
(MATS).

In April 2017, the Company acquired in entirety all of the patents related to
mercury control from the Energy & Environmental Research Center Foundation
(EERCF), located in Grand Forks, North Dakota for $2.5 million and 925,000
shares of common stock. The technology was originally developed at the
University of North Dakota Energy & Environmental Research Center.

ME2C currently has over 20 potential customer EGU’s under consideration in
varying stages of testing, demonstration and contract negotiation.

First Quarter 2017 Financial Results

Total revenues in the first quarter of 2017 increased 59% to $5.4 million,
compared to $3.4 million in the first quarter of 2016. This growth is
primarily due to higher product sales over the prior year as a result of many
of the Company’s contracted EGUs in the first quarter of 2016 not beginning
MATS compliance activities until April 2016.

Operating loss in the first quarter of 2017 was $1.1 million, compared to an
operating loss of $0.3 million in the first quarter of 2016.

Net loss in the first quarter of 2017 was $1.4 million, or ($0.02) per diluted
share, compared to net income of $0.9 million, or $0.02 per diluted share, in
the first quarter of 2016. The net loss for the first quarter of 2017 was
primarily due to a smaller increase in the change in fair value of warrant
liability as recognized in the first quarter of 2016, as well as higher
selling, general and administrative expenses.

Adjusted EBITDA in the first quarter of 2017 was $145,000, compared to $16,000
in the same year-ago quarter. These improvements were primarily due to our
customers MATS compliance activities versus the previous year when MATS
compliance was not yet required at many of the Company’s customer sites.

On March 31, 2017, the Company had cash and cash equivalents of $4.4 million,
compared to $7.8 million on December 31, 2016.

Full Year 2017 Revenue Guidance

For the full year ending December 31, 2017, the Company has adjusted guidance
and now expects revenues of between $40 million to $45 million, an increase of
between 23% to 39%, when compared to revenue of $32.3 million for the full
year ended December 31, 2016. This guidance is based on current power demand
forecasts, plant projections and additional EGU’s expected to be secured.

Conference Call and Webcast

Management will host a conference call today, May 16, 2017 at 11:30 a.m.
Eastern time to discuss ME2C’s first quarter 2017 results, provide a corporate
update, and conclude with a Q&A from participants. To participate, please use
the following information:

Date: Tuesday, May 16, 2017
Time: 11:30 a.m. Eastern time
U.S. Dial-in: 1-888-430-8691
International Dial-in: 1-719-325-2177
Conference ID: 9190392
Webcast: http://public.viavid.com/index.php?id=124007

Please dial in at least 10 minutes before the start of the call to ensure
timely participation.

A playback of the call will be available through July 16, 2017. To listen,
call 1-844-512-2921 within the United States or 1-412-317-6671 when calling
internationally. Please use the replay pin number 9190392.

About Midwest Energy Emissions Corp. (ME2C)

Midwest Energy Emissions Corp. (OTCQB: MEEC) delivers patented and proprietary
solutions to the global coal-power industry to remove mercury from power plant
emissions, providing performance guarantees, and leading-edge emissions
services. The U.S. Environmental Protection Agency (EPA) MATS rule requires
that all coal- and oil-fired power plants in the U.S., larger than 25
mega-watts remove roughly 90% of mercury from their emissions starting April
15, 2015. ME2C has developed patented technology and proprietary products that
have been shown to achieve mercury removal levels compliant with MATS at a
significantly lower cost and with less operational impact than currently used
methods, while preserving the marketability of fly-ash for beneficial use. For
more information, please visit www.midwestemissions.com.

Use of Non-GAAP Financial Measures

To provide investors with additional information regarding our financial
results, this press release includes references to Adjusted EBITDA, a Non-GAAP
financial measure. We view Adjusted EBITDA as an operating performance measure
and, as such, we believe that the GAAP financial measure most directly
comparable to it is net income (loss). We define Adjusted EBITDA as net income
adjusted for interest and financing fees, income taxes, depreciation,
amortization, stock based compensation, and other non-cash income and
expenses. We believe that Adjusted EBITDA provides us an important measure of
operating performance. Our use of Adjusted EBITDA has limitations as an
analytical tool, and this measure should not be considered in isolation or as
a substitute for an analysis of our results as reported under GAAP, as the
excluded items may have significant effects on our operating results and
financial condition. Additionally, our measure of Adjusted EBITDA may differ
from other companies’ measure of Adjusted EBITDA. When evaluating our
performance, Adjusted EBITDA should be considered with other financial
performance measures, including various cash flow metrics, net income and
other GAAP results. In the future, we may disclose different non-GAAP
financial measures in order to help our investors and others more meaningfully
evaluate and compare our future results of operations to our previously
reported results of operations.

Safe Harbor Statement

With the exception of historical information contained in this press release,
content herein may contain “forward-looking statements” that are made pursuant
to the Safe Harbor Provisions of the Private Securities Litigation Reform Act
of 1995. Forward-looking statements are generally identified by using words
such as “anticipate,” “believe,” “plan,” “expect,” “intend,” “will,” and
similar expressions, but these words are not the exclusive means of
identifying forward-looking statements. These statements are based on
management’s current expectations and are subject to uncertainty and changes
in circumstances. Investors are cautioned that forward-looking statements
involve risks and uncertainties that could cause actual results to differ
materially from the statements made. Matters that may cause actual results to
differ materially from those in the forward-looking statements include, among
other factors, the gain or loss of a major customer, change in environmental
regulations, disruption in supply of materials, capacity factor fluctuations
of power plant operations and power demands, a significant change in general
economic conditions in any of the regions where our customer utilities might
experience significant changes in electric demand, a significant disruption in
the supply of coal to our customer units, the loss of key management
personnel, availability of capital and any major litigation regarding the
Company. In addition, this release contains time-sensitive information that
reflects management’s best analysis only as of the date of this release. The
Company does not undertake any obligation to publicly update or revise any
forward-looking statements to reflect future events, information or
circumstances that arise after the date of this release. Further information
concerning issues that could materially affect financial performance related
to forward-looking statements contained in this release can be found in the
Company’s periodic filings with the Securities and Exchange Commission.

We prepare and publicly release yearly audited financial statements prepared
in accordance with GAAP. The following table shows our reconciliation of Net
Income to Adjusted EBITDA for the quarter ended March 31, 2017 and 2016,
respectively:

/T/

Quarter Ended March 31,
—————————-
2017 2016
————- ————-
(In thousands)

Net (loss) income $ (1,445) $ 908

Non-GAAP adjustments:

Depreciation and amortization 302 164
Interest 540 2,073
Taxes 10 1
Stock based compensation 946 179
Change in warrant liability (208) (3,309)
————– ————-

Adjusted EBITDA $ 145 $ 16

/T/

We are including below our unaudited reconciliation of Net Income to Adjusted
EBITDA on a quarterly basis for the quarters ended June 30, 2016, September
30, 2016, December 31, 2016 and March 31, 2017:

/T/

Quarter Ended (Unaudited)
——————————————-
3/31/2017 12/31/2016 9/30/2016 6/30/2016
——— ———- ——— ———
(In thousands)

Net (loss) income $ (1,445) $ (246) $ (9,302) $ (8,243)

Non-GAAP adjustments:
Depreciation and amortization 302 271 249 229
Interest 540 1,060 973 1,033
Taxes 10 (497) 20 3
Stock based compensation 946 191 385 404
Change in warrant liability (208) 439 9,985 7,566
Gain on restructuring – (407) – –
——————————————-

Adjusted EBITDA $ 145 $ 811 $ 2,310 $ 992
——————————————-

/T/

/T/

MIDWEST ENERGY EMISSIONS CORP AND SUBSIDIARIES
CONDENSED CONSOLIDATED BALANCE SHEETS
MARCH 31, 2017 AND DECEMBER 31, 2016
(UNAUDITED)

March 31, 2017 December 31,
(Unaudited) 2016
————– ————-
ASSETS
Current assets
Cash and cash equivalents $ 4,378,550 $ 7,751,557
Accounts receivable 2,205,739 3,553,096
Inventory 1,240,893 609,072
Prepaid expenses and other assets 201,905 199,495
————– ————-
Total current assets 8,027,087 12,113,220

Property and equipment, net 2,938,955 2,569,354
Deferred Tax Asset 500,000 500,000
License, net 51,475 52,945
Customer acquisition costs, net 521,359 642,203
————– ————-
Total assets $ 12,038,876 $ 15,877,722
————– ————-

LIABILITIES AND STOCKHOLDERS’ DEFICIT

Current liabilities

Accounts payable and accrued expenses $ 950,948 $ 4,363,553
Current portion of notes payable 2,125,000 1,500,000
Current portion of equipment notes payable 58,446 39,499
Customer credits 590,206 590,206
————– ————-
Total current liabilities 3,724,600 6,493,258

Notes payable, net of discount and issuance
costs 11,208,465 11,678,669
Convertible notes payable, net of discount
and issuance costs 1,185,041 1,142,154
Warrant liability 991,000 1,313,000
Accrued interest 38,750 78,750
Equipment notes payable 213,310 143,135
————– ————-
Total liabilities 17,361,166 20,848,966

Stockholders’ deficit

Preferred stock, $.001 par value: 2,000,000
shares authorized – –
Common stock; $.001 par value; 150,000,000
shares authorized;
73,707,128 shares issued and outstanding
as of March 31, 2017
73,509,663 shares issued and outstanding
as of December 31, 2016 73,707 73,510
Additional paid-in capital 50,932,511 49,838,469
Accumulated deficit (56,328,508) (54,883,223)
————– ————-

Total stockholders’ deficit (5,322,290) (4,971,244)
————– ————-

Total liabilities and stockholders’ deficit $ 12,038,876 $ 15,877,722

————– ————-

The accompanying notes are an integral part of these condensed consolidated

financial statements.

/T/

/T/

MIDWEST ENERGY EMISSIONS CORP AND SUBSIDIARIES
CONDENSED CONSOLIDATED STATEMENTS OF OPERATIONS
FOR THE THREE MONTHS ENDED MARCH 31, 2017 AND 2016
(UNAUDITED)

For the Three For the Three
Months Ended Months Ended
March 31, March 31,
2017 2016
————- ————-

Revenues
Product sales $ 5,284,234 $ 2,837,628
Equipment sales 7,160 164,400
Demonstrations and consulting services 136,000 371,283
————- ————-

Total revenues: 5,427,394 3,373,311

Costs and expenses:
Cost of sales 3,785,922 2,617,188
Selling, general and administrative expenses 2,694,282 1,040,590
————- ————-

Total costs and expenses 6,480,204 3,657,778
————- ————-

Operating loss (1,052,810) (284,467)

Other (expense) income
Interest expense (540,475) (2,073,144)
Letter of credit fees (60,000) (42,667)
Change in value of warrant liability 208,000 3,309,400
————- ————-

Total other (expense) income (392,475) 1,193,589
————- ————-

Net (loss) income before taxes (1,445,285) 909,122
————- ————-

Income tax expense – (828)
————- ————-

Net (loss) income $ (1,445,285) $ 908,294
————- ————-

Net (loss) income per common share – basic and
diluted: $ (0.02) $ 0.02
============= =============

Weighted average common shares outstanding 73,585,727 47,358,618
============= =============

The accompanying notes are an integral part of these condensed consolidated

financial statements.

/T/

– END RELEASE – 16/05/2017

For further information:

Company Contact:
Richard MacPherson
Chief Executive Officer
Midwest Energy Emissions Corp.
Main: 614-505-6115
[email protected]

Investor Relations Contact:
Greg Falesnik
Managing Director
MZ Group – MZ North America
Main: 949-385-6449
[email protected]
www.mzgroup.us

COMPANY:
FOR: MIDWEST ENERGY EMISSIONS CORP.
OTCQB Symbol: MEEC

INDUSTRY: Energy and Utilities – Coal, Energy and Utilities – Utilities,
Environment – Air Pollution Control, Environment – Regulations and Law

RELEASE ID: 20170516CC006

Press Release from Marketwired 1-866-736-3779

All press releases are written by the client and have NO affiliation with the news copy written by The Canadian Press. Any questions that arise due to the content or information provided in the press release should be directed to the company/organization
issuing the release, not to The Canadian Press.

GET ENERGYNOW’S DAILY EMAIL FOR FREE


Genoil Hydroconversion Unit Economics Show Fast ROI for Existing Bunker Port Installations

FOR: GENOIL INC.
OTCQB SYMBOL: GNOLF

Date issue: May 16, 2017
Time in: 8:00 AM e

Attention:

GHU Receiving Significant Interest from the Shipping Industry as a Viable and
Cost Effective Solution to Meet 2020 0.5% Global Sulphur Cap With ROI in Three
Months

CALGARY, ALBERTA–(Marketwired – May 16, 2017) – Genoil Inc., (OTCQB:GNOLF),
the publicly traded clean technology engineering company for the petroleum
industries, today announced compelling economics for the Genoil Hydroconversion
Upgrader (GHU),for installations where there is existing infrastructure. As
well as being more affordable for the shipping industry, the unit, which can
produce one million tonnes per year of 2020 compliant low sulphur fuel oil, can
also provide a return-on-investment in as little as three months with current
market spreads.

The GHU can be built alongside existing refinery infrastructure in major
bunkering hubs rather than incurring the costs to develop and build all new
infrastructure. The GHU unit costs between $30 million and $80 million to
install per one million tons per year of capacity. Based on Genoil’s predicted
crude prices, which have been reviewed by independent bodies, an initial
investment of $30 million could achieve payback in less than three months.
Indeed at current levels, based on a spread between HFO and distillates of
$179.78, and inclusive of Genoil’s process fee, margins per metric tonne (MT)
would be $123.78, equating to monthly profits of $11,701,789 based on a
production capability of 94,537 MT per month. The shipping industry currently
consumes over 320 million tonnes of bunker fuel per annum.

The GHU would also take up significantly less space than full refinery unit,
measuring as little as 50m x 80m. The low cost and small footprint mean the GHU
can easily be installed wherever adequate existing infrastructure exists, such
as in major bunkering hubs worldwide.

Genoil’s GHU is the most conservative compliance solution, because it uses a
considerably improved patented fixed bed reactor technology. Critically, the
GHU removes sulphur from Heavy Fuel Oil (HFO) at an extremely low cost, without
altering the fuel quality, to produce low sulphur fuel oil, compliant with new
MARPOL Annex VI regulations, which mandates the use of fuel with a sulphur
content of less than 0.5% globally from 2020. The Genoil GHU unit can be placed
in many different locations including receiving terminals, pipelines and ports.

“The GHU is the low cost breakthrough that the industry needs today. Shipping
continues to face significant financial and liquidity challenges, which is why
Genoil is offering its low cost GHU solution for the industry, one that
provides almost immediate payback,” said Bruce Abbott, President & COO, Genoil
Inc. “We have received a high level of interest throughout the industry from
many large players who realise that the 2020 deadline is looming, and that they
need to develop a cost effective strategy. The GHU is not only the lowest cost
solution available, but is also a proven process that provides compliant bunker
fuel without having to alter or retrofit existing vessels, and provides a
faster payback.”

Through its partner, Beijing Petrochemical Engineering Company (BPEC), Genoil
has access to the finance and engineering capabilities necessary to fund and
build the GHU.

About Genoil Inc.:

Genoil is a publicly traded Canadian clean technology engineering company for
the petroleum industries. Genoil is headquartered in Edmonton Alberta, with
offices in Calgary, Sherwood Park, New York City, Constanta Romania, and Dubai
& Abu Dhabi. Genoil has developed its proprietary technology, the
Hydroconversion Upgrader (GHU), which converts heavy crude oils and refinery
bottoms into clean burning fuels for transportation industries including
shipping. The GHU can be placed in remote locations, including receiving
terminals, pipelines and ports. The company operates one of the largest and
most advanced pilot & design test facilities in the world, from its 147-acre
site in Alberta, Canada.

– END RELEASE – 16/05/2017

For further information:
Georgey Routen
BLUE
01865 514214
[email protected]

COMPANY:
FOR: GENOIL INC.
OTCQB SYMBOL: GNOLF

INDUSTRY: Energy and Utilities – Oil and Gas
RELEASE ID: 20170516CC0034

Press Release from Marketwired 1-866-736-3779

All press releases are written by the client and have NO affiliation with the news copy written by The Canadian Press. Any questions that arise due to the content or information provided in the press release should be directed to the company/organization
issuing the release, not to The Canadian Press.

GET ENERGYNOW’S DAILY EMAIL FOR FREE


Sunshine Oilsands Ltd. : Proposed Changes to the Composition of the Board of Directors

FOR: SUNSHINE OILSANDS LTD.HKSE SYMBOL: 2012Date issue: May 16, 2017Time in: 6:34 AM eAttention:
HONG KONG, CHINA and CALGARY, ALBERTA–(Marketwired – May 16, 2017) – Sunshine
Oilsands Ltd. (the “Corporation” or “Sunshine”) (HKSE:2012) hereby announce…

GET ENERGYNOW’S DAILY EMAIL FOR FREE


Strategic Oil & Gas Ltd. Tests Five New Muskeg Wells and Announces First Quarter 2017 Financial and Operating Results

FOR: STRATEGIC OIL & GAS LTD
TSX VENTURE SYMBOL: SOG

Date issue: May 16, 2017
Time in: 6:30 AM e

Attention:

CALGARY, ALBERTA–(Marketwired – May 16, 2017) – Strategic Oil & Gas Ltd.
(“Strategic” or the “Company”) (TSX VENTURE:SOG) announces results from its
first quarter drilling program and reports financial and operating results for
the three months ended March 31, 2017. Detailed results are presented in
Strategic’s interim unaudited consolidated financial statements and related
Management’s Discussion and Analysis (“MD&A”) which will be available through
the Company’s website at www.sogoil.com and on SEDAR at www.sedar.com.

Highlights for the first quarter include:

/T/

— Strategic tested five new Muskeg horizontal wells which are still

cleaning up and have recovered approximately 50% of the completion
fluids.
— Test rates from the newly drilled wells over a 48 hour period ranged
from 300 boe/d to 800 boe/d (80% oil). Once tied-in, production from the
new wells will be limited by pipeline pressure to approximately 1,500
boe/d.
— Funds from operations increased 44% to $2.4 million from $1.7 million
for the fourth quarter of 2016;
— Closed a private placement of 2.4 million common shares for net proceeds
of $5.3 million, further improving the Company’s cash position;
— Working capital at March 31, 2017 was $38.6 million.

/T/

FINANCIAL AND OPERATIONAL SUMMARY

/T/

Three months ended March 31
—————————————————————————-
Financial ($thousands, except per share
amounts) 2017 2016 % change
—————————————————————————-
Oil and natural gas sales 8,888 4,705 89
Funds from (used in) operations (1) 2,383 (2,180) –
Per share basic (1) 0.05 (0.08) –
Cash provided by (used in) operating
activities 50 (1,474) –
Per share basic 0.00 (0.05) –
Net loss (2) (4,440) (3,483) 27
Per share basic & diluted (0.10) (0.13) (23)
Capital expenditures 18,067 8,296 118
Working capital (comparative figure is as of
December 31, 2016) 38,637 47,323 (18)
Net debt (comparative figure is as of December
31, 2016) (1) 49,989 37,166 35
—————————————————————————-
Operating
—————————————————————————-
Average daily production
Crude oil (bbl per day) 1,628 1,546 5
Natural gas (mcf per day) 3,872 2,534 53
Barrels of oil equivalent (boe per day) 2,273 1,968 15
Average prices
Oil & NGL ($ per bbl) 53.86 30.22 78
Natural gas ($ per mcf) 2.86 1.96 46
Operating netback ($ per boe) (1)
Oil and natural gas sales 43.44 26.26 65
Royalties (5.53) (3.42) 62
Operating expenses (18.57) (22.44) (17)
Transportation expenses (1.43) (0.72) 99
—————————————————————————-
Operating Netback (1) 17.91 (0.32) (5,697)
—————————————————————————-
Common Shares (3) (thousands)
—————————————————————————-
Common shares outstanding, end of period 46,374 27,116 71
Weighted average common shares (basic &
diluted) 45,549 27,116 68
(1) Funds from operations, net debt and operating netback are Non-GAAP
measures; see “Non-GAAP measures” in this MD&A.
(2) The comparative condensed statement of loss has been adjusted to reflect
a $3.8 million adjustment to deferred tax recovery related to the
issuance of convertible debentures.
(3) Adjusted for the previously-announced share consolidation on a 20:1
basis.

/T/

QUARTERLY SUMMARY

/T/

— Capital expenditures of $18.1 million were incurred in the quarter,

primarily on drilling five horizontal Muskeg wells and pipeline
construction at west Marlowe.
— Average daily production increased 15% from the first quarter of 2016,
and 22% from the fourth quarter of 2016 to 2,273 for the three months
ended March 31, 2017, primarily due to the Company’s four well Muskeg
drilling program in the second half of 2016 and the 14-35 Muskeg well
coming on production.
— Funds from operations increased significantly to $2.4 million for the
three months ended March 31, 2017 from funds used in operations of $2.2
million for the first quarter of 2016, as higher commodity prices and
production led to a $4.2 million increase in revenues.
— Strategic continued to implement operational efficiencies and reduce
costs in the first quarter of 2017. Operating costs dropped $0.2 million
and general and administrative (“G&A”) costs for the current period were
reduced by $0.1 million compared to the first quarter of 2016. These
reductions were partially offset by higher transportation costs due to
increased natural gas production and oil trucking charges caused by a
temporary shutdown of the Rainbow pipeline.
— The Company issued $3.7 million of additional convertible debentures as
payment in kind of interest payable on February 28, 2017 to preserve
cash while pursuing its capital program. At March 31, 2017, the Company
had $42.4 million in cash and $38.6 million in working capital.
— Operating netbacks increased to $17.91/boe for the three months ended
March 31, 2017 compared to ($0.32)/boe for the first quarter of 2016
primarily due to higher commodity prices and production levels, combined
with lower operating expenses. As new oil volumes come on line from the
five-well drilling program, fixed costs will be spread over a larger
production base and Strategic anticipates that netbacks will continue to
increase.

/T/

PERFORMANCE OVERVIEW, STRATEGY AND OUTLOOK

During the first quarter Strategic focused on the execution of its $30 million
capital spending plan for the first half of 2017, which included drilling five
horizontal Muskeg wells and the construction of a four kilometre pipeline to
tie-in the 14-35 Muskeg well drilled in the first quarter of 2016. The pipeline
project was completed in early February 2017.

The 2017 Muskeg wells were drilled with 1,900 metre lateral lengths and 20
stage completions, similar to the wells drilled in the second half of 2016. To
date all five wells drilled in the first quarter have been completed and are
being tied-in. Test rates from the newly drilled wells over a 48 hour period
ranged from 300 boe/d to 800 boe/d (80% oil). Once tied-in, production from the
new wells will be limited by pipeline pressure to approximately 1,500 boe/d.

The Company continued its cost reduction efforts in the current quarter,
reducing operating costs and general and administrative (“G&A”) expenses by
$0.2 million and $0.1 million, respectively from the first quarter of 2016.
Strategic expects costs operating and G&A expenses to continue to drop on a per
boe basis as production levels rise, increasing the Company’s netbacks.

Strategic raised $5.3 million through a private placement in January 2017 and
had $38.6 million in working capital as of March 31, 2017. The Company intends
to commence a $24 million third quarter capital program which includes drilling
up to five additional horizontal wells. The Company has cash resources to
continue to drill along its high-impact Muskeg development corridor at West
Marlowe as part of the execution of its growth strategy in the second half of
2017.

About Strategic

Strategic is a junior oil and gas company committed to becoming a premier
northern oil and gas operator by exploiting its light oil assets primarily in
northern Alberta. The Company relies on its extensive subsurface and reservoir
experience to develop its asset base and grow production and cash flows while
managing risk. The Company maintains control over its resource base through
high working interest ownership in wells, construction and operation of its own
processing facilities and a significant undeveloped land and opportunity base.
Strategic’s primary operating area is at Marlowe, Alberta. Strategic’s common
shares trade on the TSX Venture Exchange under the symbol SOG.

ADDITIONAL INFORMATION

Additional information is also available at www.sogoil.com and at www.sedar.com.

Forward-Looking Statements

This news release includes certain information, with management’s assessment of
Strategic’s future plans and operations, and contains forward-looking
statements which may include some or all of the following: (i) anticipated
production rates; (ii) expected operating and service costs and the impact of
capital projects on operating costs; (iii) expected capital spending and wells
to be drilled; (iv) the Company’s financial strength and capitalization; (v)
estimates of production; (vi) potential profitability of its assets; (vii)
potential funding alternatives; which are provided to allow investors to better
understand the Company’s business. By their nature, forward-looking statements
are subject to numerous risks and uncertainties; some of which are beyond
Strategic’s control, including the impact of general economic conditions,
industry conditions, volatility of commodity prices, currency fluctuations,
imprecision of reserve estimates, environmental risks, changes in environmental
tax and royalty legislation, competition from other industry participants, the
lack of availability of qualified personnel or management, stock market
volatility and ability to access sufficient capital from internal and external
sources, and other risks and uncertainties described under the heading ‘Risk
Factors’ and elsewhere in the Company’s Annual Information Form for the year
ended December 31, 2016 and other documents filed with Canadian provincial
securities authorities, available to the public at www.sedar.com. Readers are
cautioned that the assumptions used in the preparation of such information,
although considered reasonable at the time of preparation, may prove to be
imprecise and, as such, undue reliance should not be placed on forward-looking
statements. The principal assumptions Strategic has made includes security of
land interests; drilling cost stability; royalty rate stability; oil and gas
prices to remain in their current range; finance and debt markets continuing to
be receptive to financing the Company and industry standard rates of geologic
and operational success. Actual results could differ materially from those
expressed in, or implied by, these forward-looking statements. Strategic
disclaims any intention or obligation to update or revise any forward-looking
statements, whether as a result of new information, future events or otherwise,
except as required by law.

Basis of Presentation

This discussion and analysis of Strategic’s oil and natural gas production and
related performance measures is presented on a working-interest, before
royalties basis. For the purpose of calculating unit information, the Company’s
production and reserves are reported in barrels of oil equivalent (boe) and boe
per day (boed). Boe may be misleading, particularly if used in isolation. A boe
conversion ratio for natural gas of 6 Mcf: 1 boe has been used, which is based
on an energy equivalency conversion method primarily applicable at the burner
tip and does not necessarily represent a value equivalency at the wellhead. As
the value ratio between natural gas and crude oil based on the current prices
of natural gas and crude oil is significantly different from the energy
equivalency of 6:1, utilizing a conversion on a 6:1 basis may be misleading as
an indication of value.

Non-GAAP Measurements

The Company utilizes certain measurements that do not have a standardized
meaning or definition as prescribed by IFRS and therefore may not be comparable
with the calculation of similar measures by other entities, including net debt,
operating netback and funds from operations. Readers are referred to advisories
and further discussion on non-GAAP measurements contained in the Company’s MD&A.

Neither the TSX Venture Exchange nor its Regulation Services Provider (as that
term is defined in the policies of the TSX Venture Exchange) accepts
responsibility for the adequacy or accuracy of this release.

– END RELEASE – 16/05/2017

For further information:
Strategic Oil & Gas Ltd.
Gurpreet Sawhney, P. Eng
President and CEO
403.767.2949
403.767.9122 (FAX)
OR
Strategic Oil & Gas Ltd.
Aaron Thompson, CPA, CA
CFO
403.767.2952
403.767.9122 (FAX)
www.sogoil.com

COMPANY:
FOR: STRATEGIC OIL & GAS LTD
TSX VENTURE SYMBOL: SOG

INDUSTRY: Energy and Utilities – Oil and Gas
RELEASE ID: 20170516CC0012

Press Release from Marketwired 1-866-736-3779

All press releases are written by the client and have NO affiliation with the news copy written by The Canadian Press. Any questions that arise due to the content or information provided in the press release should be directed to the company/organization
issuing the release, not to The Canadian Press.

GET ENERGYNOW’S DAILY EMAIL FOR FREE


East Coast LNG proponent teams up with Quebec explorer to tap public markets

CALGARY — The developer behind the Goldboro liquefied natural gas project on the East Coast is planning a reverse takeover of a Quebec oil and gas exploration firm to expand financing options ahead of a development deadline.

Calgary-based Pieridae Energy Ltd. said Monday it’s combining with Petrolia Inc. (TSX-V:PEA) to have both a more integrated supply of natural gas, and to allow it to tap into both private and public sources of financing, as it looks to make a final investment decision on the multibillion-dollar Goldboro project by the end of the year.

Under the terms of the deal, Pieridae has committed to raise $50 million through subscription receipts before the deal closes, with Petrolia expected to end up with 14.75 per cent of the combined company.

Pieridae CEO Alfred Sorensen said the deal will help it raise money in a challenging environment as it looks to secure the $5.5 billion needed for one export unit and $7.5 billion for two at the LNG project in Goldboro, Nova Scotia.

The company already has an offtake agreement with Germany-based energy company Uniper, formerly part of E.ON, for half of the up to 10 million tonnes year of LNG exports, and continues to look at partners for the second half.

Sorensen said the agreement with the German utility allows it to borrow debt at a much lower rate. However, they need to start construction by the end of the year or early next year to have enough time to finish and to start supplying the utility by the end of 2021 as part of the offtake deal.

“It all very much revolves around the German offtake and loan guarantee, which kind of makes us more credible when it comes to getting to the finish line,” said Sorensen. 

“There’s no doubt that Pieridae is punching way above its weight class.”

He said the company plans to rely on debt for about 75 per cent of the project and equity for the rest, with the debt portion expected to take about six to eight months to put in place.

The Canadian Press

GET ENERGYNOW’S DAILY EMAIL FOR FREE


Dismantle National Energy Board, create bodies for regulation, growth: panel

OTTAWA — A panel advising the government on how to overhaul the National Energy Board says Canada’s current system for reviewing and regulating energy projects is broken and facing a crisis of confidence in the eyes of the public.

The five-member panel, appointed by Natural Resources Minister Jim Carr, delivered a 100-page report Monday that calls for a full-blown rethink of how the system works, including the dismantling of the National Energy Board into two separate agencies, along with a comprehensive and coherent national energy policy to guide them.

“Today the regulatory function is making de facto policy through its decisions,” says the report, which followed several months of public hearings and meetings with stakeholders.

Without a functioning national energy policy, the panel concluded, the board has an impossible task: regulating the growth of the industry while marrying that growth with the government’s economic and climate-change goals.

Instead, it says Ottawa should take the time to develop its policy incorporating its vision on energy, the environment and the economy, the report says. That way, when an energy project of major national significance is proposed, it would go to cabinet first to determine if it aligns with that vision, including significant and meaningful consultation with indigenous communities.

A reconstituted National Energy Board, renamed the Canadian Energy Transmission Commission, would then partner with the Canadian Environmental Assessment Agency to spend up to two years assessing the technical and environmental components of the proposal. Together they would have full authority to grant licences to projects, without going back to cabinet for final approval.

The entire process should take up to three years, up from the current 18 months. The current timeline, put in place in 2012 by the former government, is unrealistic and leads to rushed decisions and limits on public engagement, the panel found.

The report recommends that smaller-scale projects not considered to be of national significance be allowed to bypass the cabinet review and go straight to the joint technical and environmental assessment.

The Canadian Energy Transmission Commission would replace the National Energy Board, but without the function to produce and analyze energy industry data. That role would go to a new Canadian Energy Information Agency, to ensure the production and analysis of information is completely separate from the use of that information to assess project proposals.

The panel suggests their vision for the new national regulator needs to be taken in its entirety or it won’t work. Carr said he is thankful for the panel’s work, but refused to commit to anything in the report.

“In another life, when I wrote reports to government, I was always very hopeful that each and every one of my recommendations would be accepted,” he said.

“If we accepted each and every one of the recommendations of the various pieces of advice we’re getting, that means that we wouldn’t have any tough decisions to make. And I can tell you, we will have tough decisions to make.”

Carr has posted the report online for public comment until June 14. He said the government will meet in the fall to determine the reforms to be made to both the NEB and the Canadian Environmental Assessment Agency. A separate expert panel reviewed the latter and reported back earlier this year.

Trevor McLeod, director at the Natural Resources Centre at the Canada West Foundation, said reconciling the two panel reports will be one of the government’s biggest challenges.

“The federal government’s going to have a very difficult task of figuring out which structure they rely on, and how they put these two things together,” McLeod said.

Mark Pinney, manager of markets and transportation at the Canadian Association of Petroleum Producers, expressed concern about the competitive impacts of the longer review timeline.

“A three-year process is a potential area of concern, because we’re trying to compete in an increasingly competitive global marketplace,” he said.

“You want to make sure you don’t get left behind or miss windows of market opportunity because the regulatory process is too protracted.”

In a written statement, the group Environmental Defence praised some of the report’s recommendations, but expressed trepidation about allowing cabinet to assess the national-interest value of a project before a comprehensive environmental review.

Environmental Defence also wants the review of the proposed Energy East pipeline put on hold until the NEB overhaul is done, something Carr isn’t entertaining. He already pledged existing proposals would be reviewed with the current system with additional requirements for environmental review and indigenous consultation.

— with files from Ian Bickis in Calgary; follow @mrabson on Twitter

Mia Rabson, The Canadian Press

GET ENERGYNOW’S DAILY EMAIL FOR FREE


Keystone XL operator reassessing interest of US producers

BISMARCK, N.D. — TransCanada Corp. is reassessing whether oil producers in North Dakota and Montana are still interested in shipping crude through its long-delayed Keystone XL pipeline now that they have other new options to ship their product, including the Dakota Access pipeline.

The Calgary-based company’s announcement this month comes with the Keystone XL still needing approval of its proposed route through Nebraska and with the Dakota Access, which was designed to transport about half of North Dakota’s oil production, expected to be fully operational by June.

TransCanada announced in 2011 that it had secured five-year contracts to move crude from the oilfields of North Dakota and Montana via a proposed five-mile-long access pipeline. The $140 million project, designed to carry 100,000 barrels of crude daily from the rich Bakken and Three Forks formations, would meet with the Keystone XL in Baker, Montana.

Work on that access line was never started, and TransCanada spokesman Matthew John said the company plans to re-engage with prospective shippers “because of a lot of changes in the oil market.”

John said the company also would be surveying Canadian shippers to firm up support for the entire Keystone XL.

“We are confident the project still has a need, absolutely,” he said.

TransCanada first submitted its $8 billion Keystone XL project for review in late 2008. The company initially balked at allowing U.S. crude on the pipeline that’s designed mainly to carry Canadian oil south but also passes through rich oil fields along the Montana-North Dakota border.

The company reversed its stance in 2010 under political pressure from officials in the two states. Montana’s then-Gov. Brian Schweitzer had threatened to hold up Keystone XL’s 280-mile route through his state if it did not agree to an “onramp.” North Dakota’s congressional delegation also pushed for access to the pipeline.

Ron Ness, president of the North Dakota Petroleum Council, said the state’s oil producers likely still want the option of utilizing the Keystone XL.

“I don’t think it’s as critical as it once was,” said Ness, whose group whose group represents several hundred companies working in North Dakota’s oil patch. “But I’m never going to say we don’t want every option available.”

When TransCanada first sought shipping commitments for the pipeline spur in 2010, North Dakota was producing about 342,000 barrels of oil daily. The state now puts more than 1 million barrels daily and is the No.2 oil producer behind Texas.

The Keystone XL pipeline gained federal approval in March when President Donald Trump overturned former President Barack Obama’s rejection of the project in 2015. It already had been approved by most of the states along the route.

But the project still lacks approval of a route through Nebraska. State regulators have begun reviewing TransCanada’s proposed route.

Nebraska regulators plan to hold hearings on the proposed route in August and they likely will issue their decision sometime in the fall.

The company said it hopes to start a two-year construction phase of the pipeline in 2018.

Justin Kringstad, director of the North Dakota Pipeline Authority, said getting U.S. oil producers to re-commit to shipping on the Keystone XL “depends on the timing of the project.”

“It’s a completely different environment than what we had five years ago,” he said. “It’s really going to be up to market to decide the need.”

Wyoming-based True Cos. had built a terminal to store oil the Keystone XL link in southern Montana several years ago though it’s no longer being used for its original purpose.

“We repurposed it because it took such a long time,” spokeswoman Wendy Owen said. “We’ll take a look at it if it comes up again.”

___

Associated Press writer Josh Funk contributed to this report from Omaha, Nebraska.

James MacPherson, The Associated Press

GET ENERGYNOW’S DAILY EMAIL FOR FREE


Weekly Canadian Oil & Gas Industry Highlights – May 15, 2017

May 15, 2017 Presented by POIM Consulting Group Major /Interesting Projects Raging River $10 million of incremental capital to fund water handling facilities in our Gleneath    and Eureka areas. Trilogy also intends to allocate capital to a water disposal project, an enhanced recovery gas reinjection pilot project MEG anticipates that the company’s next project, known … Read more

GET ENERGYNOW’S DAILY EMAIL FOR FREE


Tamarack Valley Energy Ltd. Announces 2017 First Quarter Results

FOR: TAMARACK VALLEY ENERGY LTD.
TSX SYMBOL: TVE

Date issue: May 15, 2017
Time in: 7:10 PM e

Attention:

CALGARY, ALBERTA–(Marketwired – May 15, 2017) – Tamarack Valley Energy Ltd.
(TSX:TVE) (“Tamarack” or the “Company”) is pleased to announce its financial
and operating results for the three months ended March 31, 2017. Selected
financial and operational information is set out below and should be read in
conjunction with Tamarack’s unaudited condensed consolidated interim financial
statements for the three months ended March 31, 2017 and related management’s
discussion and analysis (“MD&A”), which are available for review on SEDAR at
www.sedar.com or on Tamarack’s website at www.tamarackvalley.ca.

Q1 2017 Financial and Operating Highlights

/T/

— Closed the transformational business combination with Spur Resources

Ltd. (the “Viking Acquisition”) on January 11, 2017, positioning
Tamarack as a Cardium and Viking-focused growth entity with control of
key infrastructure across its core areas. Concurrent with closing, the
borrowing base on the Company’s credit facilities was increased by over
80% to $220 million from $120 million, providing greater liquidity for
ongoing development of Tamarack’s high-netback, light oil-weighted asset
base.
— Achieved Q1/17 average production of 17,796 boe/d, up 55% over Q4/16 and
up 86% from Q1/16 and in April 2017, production averaged over 20,000
boe/d (58% liquids), due to the success of the Company’s Cardium and
Viking drilling programs.
— Total funds from operations increased 141% to $32.4 million in Q1/17
($0.15/share basic and diluted), excluding transaction costs, from $11.1
million in Q1/16 ($0.11/share basic and diluted), and increased 58%
compared to Q4/16.
— Continued to achieve reductions in production expenses with per boe
costs declining 6% quarter-over-quarter to $11.42/boe in Q1/17 and 2%
lower than $11.65/boe in Q1/16.
— General and administrative costs per boe decreased by 3% quarter-over-
quarter to $1.83/boe in Q1/17 and declined 10% year-over-year from
$2.03/boe, despite higher activity levels, higher production levels and
the integration of the Viking Acquisition assets.
— Invested $63.7 million in capital expenditures in the quarter drilling a
record 46 (42.4 net) wells.
— Oil weighting increased by 2% to 47% in Q1/17 from 45% in Q4/16, causing
funds flow netback per boe to increase by 5% in Q1/17 compared to Q4/16.
— Tamarack recorded earnings of $2.3 million in Q1/17 compared to a $5.8
million loss in Q1/16.
— Subsequent to the end of the quarter on May 12, 2017, the Company’s
credit facilities were further increased to $265 million from $220
million during the annual banking review, supported by the value created
in its core Cardium and Viking areas since the last mid-year review
completed in November, 2016.

/T/

Financial & Operating Results

/T/

—————————————————————————-
—————————————————————————-

Three months ended March
(Cdn$ thousands, except per boe) 31,
—————————————————————————-
2017 2016 % change
—————————————————————————-
($, except per share)
Total Revenue 62,870 19,618 220
Funds from operations (1) 32,356 11,078 190
Per share – basic (1) $ 0.15 $ 0.11 36
Per share – diluted (1) $ 0.15 $ 0.11 36
Net income (loss) 2,290 (5,835) 139
Per share – basic $ 0.01 $ (0.06) 117
Per share – diluted $ 0.01 $ (0.06) 117
Net debt (2) (165,561) (62,696) 164
Capital Expenditures (3) 64,492 17,150 276
—————————————————————————-
Weighted average shares
outstanding(thousands)
Basic 217,655 102,274 113
Diluted 219,679 102,274 115
—————————————————————————-
Share Trading (thousands, except share
price)
High $ 3.59 $ 3.97 (10)
Low $ 2.60 $ 2.16 20
Trading volume 80,868 28,809 181
—————————————————————————-
Average daily production
Light oil (bbls/d) 7,891 3,801 108
Heavy oil (bbls/d) 484 410 18
NGLs (bbls/d) 1,779 1,067 67
Natural gas (mcf/d) 45,852 25,818 78
Total (boe/d) 17,796 9,581 86
—————————————————————————-
Average sale prices
Light oil ($/bbl) 63.02 36.82 71
Heavy oil ($/bbl) 44.64 23.32 91
NGLs ($/bbl) 26.46 12.71 108
Natural gas ($/mcf) 2.89 2.03 42
Total ($/boe) 39.25 22.50 74
—————————————————————————-
Operating netback ($/Boe) (2)
Average realized sales 39.25 22.50 74
Royalty expenses (4.15) (2.04) 103
Production expenses (11.42) (11.65) (2)
—————————————————————————-
Operating field netback ($/Boe)(2) 23.68 8.81 169
Realized commodity hedging gain (loss) (0.77) 7.23 (111)
—————————————————————————-
Operating netback 22.91 16.04 43
—————————————————————————-
Funds flow from operations netback ($/Boe)
(2) 20.19 12.71 59
—————————————————————————-
—————————————————————————-
Notes:
(1) Funds from operations is calculated as cash flow from operating
activities before the change in non-cash working capital and abandonment.
(2) Net debt, operating netback, operating field netback and funds flow from
operations netback do not have any standardized meaning prescribed by
International Financial Reporting Standards (“IFRS”) and therefore may not
be comparable with the calculation of similar measures for other entities.
See “Non-IFRS Measures”.
(3) Capital expenditures include exploration and development expenditures,
but exclude corporate acquisitions.

/T/

Operations review

Early in the first quarter of 2017, the Company closed the Viking Acquisition
and commenced the integration of assets, personnel and processes. The Viking
Acquisition offers significant near and longer term growth for Tamarack, and
provided support for an 80% increase in the borrowing base on the Company’s
credit facilities to $220 million. While new challenges emerged in commodity
markets later in the first quarter, Tamarack’s operational execution from both
a timing and cost perspective remained on track. Production volumes for the
quarter were in-line with guidance as the Company’s Cardium and Viking drilling
results continue to meet expectations, despite minor operational delays due to
challenges in accessing pressure pumping services. For the month of April 2017,
production volumes averaged over 20,000 boe/d (58% liquids) based on field
estimates.

Production of 17,796 boe/d (57% liquids) increased 55% quarter-over-quarter and
86% year-over-year as a direct result of higher production volumes from the
successful Q1/17 drilling program, capital efficiencies that continue to meet
expectations, and the impact of the strategic Viking Acquisition that closed in
January. Base production from the Viking Acquisition averaged 6,102 boe/d (57%
liquids) from the closing date to the end of the first quarter, while
Tamarack’s Viking drilling program added 376 boe/d (68% liquids) of average
production over the same period.

Tamarack’s record level of investment in the first quarter of 2017 included $48
million directed to drilling and completions activities, primarily focused on
Cardium and Viking programs. In Alberta, the Company drilled 17 (16.53 net)
Viking oil wells in Veteran, 7 (6.26 net) Cardium oil wells and one (1.0 net)
Notikewin liquids-rich gas well. In addition, three minor tuck-in acquisitions
at Tamarack’s Penny area were completed during the quarter for $0.8 million,
which included production of approximately 35 bbls/d of oil and 60,954 (33,853
net) acres of land. In early May, the Company closed a $2.1 million
acquisition, which included 14,080 (12,800 net) acres of land west of Wilson
Creek along with 62 square miles of seismic. In Saskatchewan, the Company
drilled 14 (11.6 net) Viking oil wells in Milton, 4 (4.0 net) Viking oil wells
in Hoosier and 3 (3.0 net) Hatton heavy oil wells. While the pressure pumping
suppliers are the busiest the industry has seen since 2014, the Company’s
reservoir stimulation delays in the first quarter were relatively minor and
Tamarack does not anticipate operational inefficiencies or material cost
escalation in the near-term.

The Company also invested $6.1 million in Q1/17 on facilities and
infrastructure, and completed various key enhancement projects related to the
Viking Acquisition assets that are expected to reduce operating costs in the
second half of 2017 while also increasing productive capacity. A new 8 MMcf/d
compressor station and multi-well oil battery was completed at Milton, which
will reduce third party gas handling charges as well as operating costs. At
Veteran, where current oil production is approximately 1,250 bbls/d, the
Company added over 20 km of a mainline oil gathering pipeline system which will
allow Tamarack to utilize a Company-owned oil battery for emulsion gathering
and eliminate third-party trucking and water disposal costs. Given higher than
expected total production fluid volumes from Veteran wells, the Company intends
to increase the pump size for Veteran wells going forward to eliminate current
rate restrictions caused by pump capacity limitations. After the end of the
quarter, a water disposal well was drilled at Veteran that is expected to
generate a four-fold increase in the oil battery’s capacity to over 10,000
bbls/d of fluid handling by the end of June, 2017.

Also during the quarter, the Company constructed a multi-well heavy oil battery
at Hatton to handle the incremental production volumes stemming from Tamarack’s
successful first quarter drilling program and ongoing area development. All of
these infrastructure initiatives support Tamarack’s long-term flexibility and
contribute to the Company’s continued cost reduction efforts and field
efficiency enhancements.

On April 28, 2017, the TransGas Coleville Gas Plant was shut-in, affecting the
Company’s production from the Coleville Gas Unit, Hoosier Gas Unit, Hoosier and
Milton Viking oil wells. Tamarack had nearly 5,000 boe/d (47% oil and NGLs)
connected to the facility which was affected at the time of the plant shut
down. The Tamarack was able to redirect volumes and bring most of the affected
production back on-stream. Currently, the Company has approximately 850 boe/d
(3.0 MMcf/d,25 bbls/d oil and 325 bbls/d of associated natural gas liquids)
that continue to be shut-in. Preliminary information from TransGas indicates
that the plant could be affected for six to eight weeks. Tamarack personnel are
working with TransGas on potential solutions to enable “partial operations” by
the end of June, 2017. The Company estimates that second quarter production
will be lower by approximately 900 boe/d due to the plant shut down.

A key component of the Company’s strategy is to prudently manage its assets and
balance sheet through any cycle, and as needed, adjust capital within the
context of the commodity price environment. Tamarack will continue to focus on
drilling wells that target a capital cost payout of 1.5 years or less, while
striving to optimize capital efficiencies by further reducing capital and
operating costs. Due to the recent decline in crude oil prices, Tamarack has
begun to adjust capital spending to the bottom end of its 2017 guidance range
of $165 to $175 million and will adjust further if oil prices fall below
US$45/bbl WTI. As a result of the third party plant shut down at Coleville, the
Company expects second quarter production to average between 18,000 and 18,500
boe/d, thereby reducing the first half production guidance range to 18,000 to
18,500 boe/d from 18,500 to 19,000 boe/d. Even with the planned lower capital
spending coupled with the expected production impacts through the second
quarter, Tamarack’s 2017 annual average production guidance remains unchanged
at 19,000 to 20,000 boe/d, with a forecast exit production rate of 21,000
boe/d. Through the second half of 2017, the Company plans to drill and complete
eight Cardium wells and three Mannville wells at Wilson Creek, and 44 extended
reach horizontal wells at Veteran and Milton. Tamarack continues to be on
target to achieve 7% – 9% production per share growth (Q4/17 over Q4/16), while
keeping debt to Q4/17 annualized funds flow from operations at 1.0 times.
Tamarack’s priority is to maintain a strong and flexible balance sheet that
enables the Company to capitalize on opportunities to add high-quality drilling
inventory or pursue consolidation acquisitions in core areas which may arise in
a lower commodity price environment.

Despite recent commodity price volatility, the Company remains optimistic about
the long-term growth potential of its oil-weighted, high netback and
high-return asset base. The Viking Acquisition provides the Company with a
strong and robust drilling inventory to fuel organic growth and underpin cash
flow and production per share growth for many years. Tamarack also remains well
hedged through 2017 and continues to layer on risk management contracts into
2018 to protect downside risk, which will underpin funds from operations and
help the Company maintain its strong balance sheet and production base.

Tamarack invites all shareholders and other stakeholders to attend the
Company’s Annual Meeting of Shareholders to be held on June 22, 2017 at 9:00
a.m. at The Bow Valley Club located at 370, 250 – 6th Avenue SW, Calgary,
Alberta.

Bank Line Renewal

Tamarack’s credit facilities were increased to $265 million from $220 million
on May 12, 2017 as a result of its annual review. The $265 million facility is
made up of a revolving credit facility in the amount of $245 million and a $20
million operating facility with a syndicate of lenders.

About Tamarack Valley Energy Ltd.

Tamarack is an oil and gas exploration and production company committed to
long-term growth and the identification, evaluation and operation of resource
plays in the Western Canadian Sedimentary Basin. Tamarack’s strategic direction
is focused on two key principles – targeting repeatable and relatively
predictable plays that provide long-life reserves, and using a rigorous, proven
modeling process to carefully manage risk and identify opportunities. The
Company has an extensive inventory of low-risk, oil development drilling
locations focused primarily in the Cardium and Viking fairways in Alberta that
are economic over a range of oil and natural gas prices. With this type of
portfolio and an experienced and committed management team, Tamarack intends to
continue delivering on its strategy to maximize shareholder returns while
managing its balance sheet.

Abbreviations

/T/

bbls barrels
bbls/d barrels per day
boe barrels of oil equivalent
boe/d barrels of oil equivalent per day
mcf thousand cubic feet
MMcf million cubic feet
mcf/d thousand cubic feet per day
MMcf/d million cubic feet per day
NGLs natural gas liquids
WTI West Texas Intermediate, the reference price paid in U.S. dollars
at Cushing, Oklahoma for crude oil of standard grade

/T/

Unit Cost Calculation

For the purpose of calculating unit costs, natural gas volumes have been
converted to a boe using six thousand cubic feet equal to one barrel unless
otherwise stated. A boe conversion ratio of 6:1 is based upon an energy
equivalency conversion method primarily applicable at the burner tip and does
not represent a value equivalency at the wellhead. This conversion conforms
with National Instrument 51-101 – Standards of Disclosure for Oil and Gas
Activities. Boe may be misleading, particularly if used in isolation.

Forward Looking Information

This press release contains certain forward-looking information (collectively
referred to herein as “forward-looking statements”) within the meaning of
applicable Canadian securities laws. Forward-looking statements are often, but
not always, identified by the use of words such as “target”, “plan”,
“continue”, “intend”, “ongoing”, “estimate”, “expect”, “may”, “should”, or
similar words suggesting future outcomes. More particularly, this press release
contains statements concerning: Tamarack’s business strategy, objectives,
strength and focus; the impact of the Viking Acquisition on the Company’s
operations, infrastructure, inventory and opportunities, financial condition,
access to capital and overall strategy; an increase in capital efficiencies and
netbacks; the ability of the Company to achieve drilling success consistent
with management’s expectations; drilling plans and timing of drilling; expected
levels of operating costs, general and administrative costs, costs of services
and other costs and expenses; cost cutting initiatives; oil and natural gas
production levels; and adjustments to the 2017 capital expenditure program and
expected production in the first half of 2017.

The forward-looking statements contained in this document are based on certain
key expectations and assumptions made by Tamarack, including relating to:
prevailing commodity prices; the availability and performance of drilling rigs,
facilities, pipelines and other oilfield services; the timing of past
operations and activities in the planned areas of focus; the drilling,
completion and tie-in of wells being completed as planned; the performance of
new and existing wells; the application of existing drilling and fracturing
techniques; prevailing weather and break-up conditions; royalty regimes and
exchange rates; the application of regulatory and licensing requirements; the
continued availability of capital and skilled personnel; the ability to
maintain or grow the banking facilities; and the accuracy of Tamarack’s
geological interpretation of its drilling and land opportunities.

Although management considers these assumptions to be reasonable based on
information currently available, undue reliance should not be placed on the
forward-looking statements because Tamarack can give no assurances that they
may prove to be correct. By their very nature, forward-looking statements are
subject to certain risks and uncertainties (both general and specific) that
could cause actual events or outcomes to differ materially from those
anticipated or implied by such forward-looking statements. These risks and
uncertainties include, but are not limited to: risks associated with the oil
and gas industry in general (e.g. operational risks in development, exploration
and production; and delays or changes in plans with respect to exploration or
development projects or capital expenditures); commodity prices; the
uncertainty of estimates and projections relating to production, cash
generation, costs and expenses; health, safety, litigation and environmental
risks; and access to capital. Due to the nature of the oil and natural gas
industry, drilling plans and operational activities may be delayed or modified
to react to market conditions, results of past operations, regulatory approvals
or availability of services causing results to be delayed. Please refer to
Tamarack’s Annual Information Form (the “AIF”) for additional risk factors
relating to Tamarack. The AIF can be accessed either on Tamarack’s website at
www.tamarackvalley.ca or under the Company’s profile on www.sedar.com.

The forward-looking statements contained in this press release are made as of
the date hereof and the Company does not undertake any obligation to update
publicly or to revise any of the included forward-looking statements, except as
required by applicable law. The forward-looking statements contained herein are
expressly qualified by this cautionary statement.

Non-IFRS Measures

Certain financial measures referred to in this press release, such as net debt,
operating netback, operating field netback and funds flow from operations
netback are not prescribed by IFRS. The Company uses these measures to help
evaluate its performance. These non-IFRS financial measures do not have any
standardized meaning prescribed by IFRS and therefore may not be comparable to
similar measures presented by other issuers. The Company uses net debt as an
alternative measure of outstanding debt. Net debt includes accounts receivable,
prepaid expenses and deposits, bank debt and accounts payable and accrued
liabilities, but excludes the fair value of financial instruments. Operating
field netback equals total petroleum and natural gas sales less royalties and
operating costs calculated on a boe basis. Operating netback is the operating
field netback with realized gains and losses on commodity derivative contracts.
Funds flow from operations netback equals funds flow from operations divided by
the total sales volume and reported on a per boe basis. Tamarack considers
operating netback and funds flow from operations netback as important measures
to evaluate its operational performance as they demonstrate the Company’s field
level profitability relative to current commodity prices. Please refer to the
MD&A for additional information relating to non-IFRS measures. The MD&A can be
accessed either on Tamarack’s website at www.tamarackvalley.ca or under the
Company’s profile on www.sedar.com.

– END RELEASE – 15/05/2017

For further information:
Brian Schmidt
President & CEO
Tamarack Valley Energy Ltd.
403.263.4440
OR
Ron Hozjan
VP Finance & CFO
Tamarack Valley Energy Ltd.
403.263.4440
www.tamarackvalley.ca

COMPANY:
FOR: TAMARACK VALLEY ENERGY LTD.
TSX SYMBOL: TVE

INDUSTRY: Energy and Utilities – Oil and Gas
RELEASE ID: 20170515CC0117

Press Release from Marketwired 1-866-736-3779

All press releases are written by the client and have NO affiliation with the news copy written by The Canadian Press. Any questions that arise due to the content or information provided in the press release should be directed to the company/organization
issuing the release, not to The Canadian Press.

GET ENERGYNOW’S DAILY EMAIL FOR FREE


Touchstone Exploration Inc. Announces First Quarter 2017 Results and Commencement of Drilling Program

FOR: TOUCHSTONE EXPLORATION INC.TSX SYMBOL: TXPDate issue: May 15, 2017Time in: 6:25 PM eAttention:
CALGARY, ALBERTA–(Marketwired – May 15, 2017) – Touchstone Exploration Inc.
(“Touchstone” or the “Company”) (TSX:TXP) announces its financial and oper…

GET ENERGYNOW’S DAILY EMAIL FOR FREE


Condor Announces 2017 First Quarter Results

FOR: CONDOR PETROLEUM INC.TSX Symbol: CPIDate issue: May 15, 2017Time in: 6:15 PM eAttention:
CALGARY, AB –(Marketwired – May 15, 2017) – Condor Petroleum Inc. (“Condor”
or the “Company”) (TSX: CPI), a Canadian based oil and gas company focused on
e…

GET ENERGYNOW’S DAILY EMAIL FOR FREE


Storm Resources Ltd. ("Storm" or the "Company") is Pleased to Announce Its Financial and Operating Results for the Three Months Ended March 31, 2017

FOR: STORM RESOURCES LTD.
TSX VENTURE SYMBOL: SRX

Date issue: May 15, 2017
Time in: 5:57 PM e

Attention:

CALGARY, ALBERTA–(Marketwired – May 15, 2017) – Storm Resources Ltd. (TSX
VENTURE:SRX) –

Storm has also filed its unaudited condensed interim consolidated financial
statements as at March 31, 2017 and for the three months then ended along with
Management’s Discussion and Analysis (“MD&A”) for the same period. This
information appears on SEDAR at www.sedar.com and on Storm’s website at
www.stormresourcesltd.com.

Selected financial and operating information for the three months ended March
31, 2017 appears below and should be read in conjunction with the related
financial statements and MD&A.

Highlights

/T/

Three Months Three Months
Thousands of Cdn$, except volumetric and Ended Ended
per-share amounts March 31, 2017 March 31, 2016
—————————————————————————-

FINANCIAL

Revenue from product sales(1) 37,045 16,121
—————————————————————————-
Funds flow 17,958 7,855
Per share – basic and diluted ($) 0.15 0.07
—————————————————————————-
Net income (loss) 20,631 (4,984)
Per share – basic and diluted ($) 0.17 (0.04)
—————————————————————————-
Operations capital expenditures(2) 27,357 23,946
—————————————————————————-
Debt including working capital
deficiency(2)(3) 97,864 77,162
—————————————————————————-
Common shares (000s)
Weighted average – basic 121,442 119,591
Weighted average – diluted 121,720 119,591
Outstanding end of period – basic 121,557 119,742
—————————————————————————-
—————————————————————————-

OPERATIONS
(Cdn$ per Boe)
Revenue from product sales 24.29 13.20
Royalties (1.88) (0.76)
Production (5.84) (6.71)
Transportation (0.69) (0.53)
—————————————————————————-
Field operating netback(2) 15.88 5.20
Realized (losses) gains on hedging (2.31) 3.03
General and administrative (1.10) (1.25)
Interest and finance costs (0.71) (0.56)
—————————————————————————-
Funds flow per Boe 11.76 6.42
—————————————————————————-
—————————————————————————-

Barrels of oil equivalent per day (6:1) 16,947 13,418
—————————————————————————-
Gas production
Thousand cubic feet per day 84,093 66,012
Price (Cdn$ per Mcf) 3.23 1.62
—————————————————————————-
Condensate production
Barrels per day 1,758 1,452
Price (Cdn$ per barrel) 64.40 41.54
—————————————————————————-
NGL production
Barrels per day 1,174 964
Price (Cdn$ per barrel) 23.09 10.44
—————————————————————————-
Wells drilled (100% working interest) 6.0 7.0
Wells completed (100% working interest) 4.0 2.0
—————————————————————————-
—————————————————————————-
(1) Excludes gains and losses on commodity price contracts.
(2) Certain financial amounts shown above are non-GAAP measurements,
including field operating netback, operations capital expenditures,
debt including working capital deficiency and all measurements per Boe.
See discussion of Non-GAAP Measurements on page 25 of the MD&A.
(3) Excludes the fair value of commodity price contracts.

/T/

PRESIDENT’S MESSAGE

2017 FIRST QUARTER HIGHLIGHTS

/T/

— Production was a record 16,947 Boe per day (17% condensate and NGL), a

per-share increase of 24% from the first quarter of last year and a per-
share increase of 27% from the previous quarter. The increase was the
result of the start-up of a third field compression facility at Umbach
on January 12, 2017 plus five new horizontal wells (5.0 net) were turned
on during the quarter.

— Condensate and NGL production increased 21% from the first quarter of

last year to average 2,932 barrels per day. Revenue from liquids was 34%
of total revenue.

— Montney horizontal well performance at Umbach continues to improve as

length and the number of fracs are increased. The five wells completed
in 2016 with enough production history averaged 4.8 Mmcf per day gross
raw gas over the first 180 calendar days, a 14% improvement from the
average 2015 wells. The four wells completed to date in 2017 are
approximately 25% longer and three of them have been producing for 30 to
60 days with encouraging early data.

— Controllable cash costs (production, general and administrative,

interest and finance) were $7.65 per Boe, a decrease of 10% year over
year. Production costs declined by 13% from the same period in 2016 and
16% from the fourth quarter of 2016 as a result of the new processing
arrangement at Umbach which started on January 1, 2017.

— Funds flow was $18.0 million ($11.76 per Boe), an increase of 129% from

a year ago. The increase was driven by an 84% increase in revenue per
Boe and a 26% increase in production volumes which was partially offset
by a realized hedging loss of $3.5 million or $2.31 per Boe.

— Net income was $20.6 million or $0.17 per share which includes an

unrealized mark to market hedging gain of $16.1 million. Notably,
excluding the effect of the unrealized hedging gain, net income was $4.5
million, or $0.04 per share.

— Capital investment was $27.4 million including $19.0 million to drill

six horizontal wells (6.0 net) and complete four horizontal wells (4.0
net) plus $1.5 million to complete the third field compression facility
at Umbach.

— At the end of the quarter, there was an inventory of ten horizontal

wells (10.0 net) that had not started producing (includes two completed
wells).

— Debt including working capital deficiency was $97.9 million which is 1.4

times annualized first quarter funds flow. Subsequent to quarter end,
the bank credit facility was increased to $165.0 million from $130.0
million.

— Commodity price hedges continue to be layered in with approximately 43%

of forecast 2017 production currently hedged.

/T/

OPERATIONS REVIEW

Umbach, Northeast British Columbia

Storm’s land position at Umbach is prospective for liquids-rich natural gas
from the Montney formation and currently totals 109,000 net acres (155 net
sections). To date, Storm has drilled 59 horizontal wells (55.4 net).

Production in the first quarter of 2017 was 16,582 Boe per day and liquids
recovery was 36 barrels per Mmcf sales with 60% being higher priced field
condensate plus pentanes recovered at the gas plant. Compared to the previous
quarter, production increased by 28% while liquids recovery was the same.

During the first quarter, six horizontal wells (6.0 net) were drilled, four
horizontal wells (4.0 net) were completed and five horizontal wells (5.0 net)
started production. At the end of the quarter, there was an inventory of ten
horizontal wells (10.0 net) that had not started producing which included two
completed wells.

Activity in the second quarter of 2017 will include completing four to six
horizontal wells (4.0 to 6.0 net).

Field compression totals 115 Mmcf per day raw gas after start-up of a third
facility on January 12, 2017. Throughput in the first quarter averaged 88 Mmcf
per day raw gas. The third facility had a final cost of $24.6 million for
initial capacity of 35 Mmcf per day and will be expanded to 70 Mmcf per day by
adding a second compressor for an additional $7.0 million. Preliminary timing
for the expansion is the first half of 2018 and, once completed, total capacity
will be 150 Mmcf per day which supports growth in corporate production to
approximately 27,000 Boe per day.

Raw gas from Storm’s field compression facilities is sent to the McMahon and
Stoddart Gas Plants where firm processing commitments average 75 Mmcf per day
raw gas in 2017. On January 1, 2017, a new processing arrangement started at
the McMahon Gas Plant which has a total commitment of 65 Mmcf per day of raw
gas for 5 to 15 years and has reduced corporate production costs in the first
quarter by 16% from the fourth quarter of 2016. The arrangement supports future
growth with an option to increase contracted capacity and allows continued
diversification of natural gas sales with access to three sales pipelines
(Alliance Pipeline to Chicago, TCPL system to AECO, T-north to BC Station 2).

A summary of horizontal well performance and costs is provided below. Three of
the wells completed in 2017 have started producing and have 30 to 60 days of
history. The majority of wells are rate restricted when coming on production to
control fluid rates and adding frac stages has increased ‘flush’ production,
therefore, additional production data is required to get an indication as to
longer term performance. Future horizontal wells are expected to have completed
lengths of 1,700 to 2,100 metres with the newest ball drop completion systems
allowing for up to 44 fracs within 4.5 inch casing.

/T/

IP90 IP180 IP365
Year of Frac Completed Actual Drill & Cal Day Cal Day Cal Day
Completion Stages Length Complete Cost Mmcf/d Raw Mmcf/d Raw Mmcf/d Raw
—————————————————————————-
2013 $4.6 million 3.5 Mmcf/d 2.9 Mmcf/d 2.2 Mmcf/d
6 hz’s 17 1,190 m $270 K/stage 6 hz’s 6 hz’s 6 hz’s
—————————————————————————-
2014 $4.6 million 4.9 Mmcf/d 4.4 Mmcf/d 3.5 Mmcf/d
12 hz’s(i) 19 1,170 m $240 K/stage 12 hz’s 12 hz’s 12 hz’s
—————————————————————————-
2015 $4.4 million 4.7 Mmcf/d 4.2 Mmcf/d 3.3 Mmcf/d
11 hz’s 22 1,360 m $200 K/stage 11 hz’s 11 hz’s 10 hz’s
—————————————————————————-
2016 $3.8 million 5.1 Mmcf/d 4.8 Mmcf/d
10 hz’s 25 1,300 m $152 K/stage 10 hz’s 5 hz’s
—————————————————————————-
2017 $4.3 million
4 hz’s 35 1,670 m $123 K/stage
—————————————————————————-
—————————————————————————-

/T/

(i) 2014 wells exclude a middle Montney well (this table provides analysis of
upper Montney wells only).

Horn River Basin, Northeast British Columbia

Storm has a 100% working interest in 119 sections in the Horn River Basin
(78,000 net acres) which are prospective for natural gas from the Muskwa, Otter
Park and Evie/Klua shales. Storm’s one horizontal well averaged 302 Boe per day
in the first quarter (previous quarter averaged 310 Boe per day). Cumulative
production to date from this well is 5.5 Bcf raw.

HEDGING AND TRANSPORTATION

Commodity price hedges are used to support longer term growth by providing some
certainty regarding future revenue and funds flow. The objective is to hedge
50% of most recent quarterly or monthly production for the next 12 months and
25% for 13 to 24 months forward. Anticipated production growth is not hedged.
The WTI price is also hedged given that approximately 80% of Storm’s liquids
production is priced in reference to WTI (condensate, plant pentane and
butane). The hedge position is updated periodically in the presentation posted
on Storm’s website. Approximately 43% of forecast 2017 production is currently
hedged.

/T/

—————————————————————————-
Q2 – Q4 2017 Hedges
—————————————————————————-
Crude Oil 1,050 Bopd WTI Cdn$64.75/Bbl floor, Cdn$69.60/Bbl
ceiling
—————————————————————————-
Natural Gas 36,400 GJ/d (29,200 AECO Cdn$2.68/GJ ($3.34/Mcf)
Mcf/d)
—————————————————————————-
11,500 Mmbtu/d (9,700 Chicago Cdn$4.17/Mmbtu ($4.94/Mcf)(1)
Mcf/d)
—————————————————————————-
2018 Hedges
—————————————————————————-
Crude Oil 410 Bopd WTI Cdn$65.99/Bbl floor, Cdn$70.54/Bbl
ceiling
—————————————————————————-
Natural Gas 750 GJ/d (600 Mcf/d) AECO Cdn$2.80/GJ ($3.50/Mcf)
—————————————————————-
18,400 Mmbtu/d (15,500 Chicago Cdn$4.00/Mmbtu ($4.75/Mcf)(1)
Mcf/d)
—————————————————————————-
(1) Hedge price in Chicago doesn’t include the Alliance Pipeline tariff to
Chicago which was Cdn$1.66 per Mcf in the first quarter including the
cost of fuel.

/T/

The Company also has natural gas price differential hedges in place (Chicago –
AECO and AECO – BC Station 2) with details provided in the notes to the interim
consolidated financial statements.

The strategy with respect to natural gas transportation commitments is to
mitigate risk by diversifying sales and selling at multiple points. In the
first quarter of 2017, 62% of natural gas sales were at Chicago, 32% at BC
Station 2 and 6% at Alliance Transfer Point (“ATP”). Approximately 82% of
forecast natural gas production in 2017 is covered by firm transportation
commitments with the remainder directed to Chicago and/or BC Station 2 using
interruptible pipeline capacity (sales point depends on price). Note that the
cost of transportation to Chicago and ATP on the Alliance Pipeline is presented
as a deduction from revenue with $7.3 million deducted from revenue in the
first quarter of 2017. Further information on pipeline tariffs and price
deductions is provided in the presentation on Storm’s website.

/T/

—————————————————————————-
2017 Firm Transportation 2018 Firm Transportation
—————————————————————————-
Alliance Pipeline(1) Alliance Pipeline(1)
51 Mmcf/d Chicago price 55 Mmcf/d Chicago price
5 Mmcf/d ATP price 5 Mmcf/d ATP price
—————————————————————————-
T-north T-north
16 Mmcf/d BC Station 2 price 29 Mmcf/d BC Station 2 price
—————————————————————————-
T-north & TCPL
13 Mmcf/d AECO price
—————————————————————————-
2017 Total 72 Mmcf per day 2018 Total 102 Mmcf per day
—————————————————————————-
(1) Interruptible capacity on the Alliance Pipeline adds up to 25% of
contracted capacity.

/T/

ORGANIZATIONAL UPDATE

On May 16, 2017, Mr. Michael Hearn will assume the role of Chief Financial
Officer and will replace Mr. Donald McLean who has been associated with Storm
and its predecessor companies for 17 years. Mr. Hearn is a Chartered Accountant
with 14 years of experience and joined Storm on November 1, 2016 after six
years with an independent energy investment bank with his last position being
equity research analyst. Prior to that, Mr. Hearn was employed at a junior
international producer and also spent six years at a multi-national accounting
firm.

On May 16, 2017, Ms. Emily Wignes will assume the role of Vice President,
Finance and will replace Mr. John Devlin who has been associated with Storm and
its predecessor companies for 13 years. Ms. Wignes is a Chartered Accountant
with 15 years of experience and joined Storm on December 1, 2016 after two
years at an intermediate producer where her most recent position was Manager,
Financial Reporting. Prior to that, Ms. Wignes was employed at other
intermediate and large producers and prior thereto at a multi-national
accounting firm.

Both Mr. Donald McLean and Mr. John Devlin will continue to provide advisory
services on an as needed basis in the near term. Their contributions to Storm
and its predecessor companies have been significant and much appreciated.

OUTLOOK

For the second quarter of 2017, production is anticipated to be 14,000 to
15,000 Boe per day which includes the effect of a maintenance turnaround at the
McMahon Gas Plant which will result in approximately 75% of Storm’s production
being shut in for 21 days. Note that production in April averaged approximately
18,400 Boe per day based on field estimates. Capital investment in the second
quarter is expected to be approximately $13 to $18 million which includes
completing four to six horizontal wells at Umbach.

Guidance for 2017 includes an increase to forecast production as a result of
well performance exceeding expectations and a reduction to forecast royalty
rates. As well, forecast commodity prices are updated to reflect actual first
quarter pricing.

/T/

2017 Guidance Updated Updated Updated
November 15, 2016 March 2, 2017 May 15, 2017
—————————————————————————-
$Cdn/$US exchange rate 0.77 0.77 0.75
—————————————————————————-
Chicago spot natural
gas (US$/Mmbtu) $3.00 $3.00 $3.00
—————————————————————————-
AECO spot natural gas
(Cdn$/GJ) $2.65 $2.50 $2.50
—————————————————————————-
BC Stn 2 spot natural
gas (Cdn$/GJ) $2.20 $2.00 $2.10
—————————————————————————-
Edmonton light oil
(Cdn$/bbl) $55.00 $59.00 $62.00
—————————————————————————-
Estimated average
operating costs
($/Boe) $5.50 – $5.75 $5.50 – $6.00 $5.50 – $6.00
—————————————————————————-
Estimated average
royalty rate (%
production revenue
before hedging) 9% – 11% 9% – 11% 7% – 10%
—————————————————————————-
Estimated operations
capital ($ million)
(excluding
acquisitions &
dispositions) $75.0 – $80.0 $75.0 – $80.0 $75.0 – $80.0
—————————————————————————-
Estimated cash G&A
– $ million $5.3 $5.3 $5.3
– $/Boe $0.85 $0.85 $0.85
—————————————————————————-
Forecast fourth
quarter production
(Boe/d) 18,000 – 20,000 18,000 – 20,000 19,000 – 21,000
% condensate and NGL 17% 17% 17%
—————————————————————————-
Forecast annual
production (Boe/d) 16,500 – 18,000 16,500 – 18,000 17,000 – 18,000
% condensate and NGL 17% 17% 17%
—————————————————————————-
Umbach horizontal 12 gross (12.0 12 gross (12.0 12 gross (12.0
wells drilled net) net) net)
Umbach horizontal 14 gross (14.0 14 gross (14.0 14 gross (14.0
wells completed net) net) net)
Umbach horizontal 15 gross (15.0 15 gross (15.0 15 gross (15.0
wells connected net) net) net)
—————————————————————————-
—————————————————————————-

/T/

2017 Guidance History

/T/

Chicago BC Station 2 AECO
(US$/mmbtu) (Cdn$/GJ) (Cdn$/GJ)
—————————————————————————-
September 7, 2016 $3.00 $2.25 $2.65
—————————————————————————-
November 15, 2016 $3.00 $2.20 $2.65
—————————————————————————-
March 2, 2017 $3.00 $2.00 $2.50
—————————————————————————-
May 15, 2017 $3.00 $2.10 $2.50
—————————————————————————-
—————————————————————————-

Estimated Forecast
Operations Fourth Quarter Forecast Annual
Capital Production Production
($ million) (Boe/d) (Boe/d)
—————————————————————————
September 7, 2016 $75.0 – $80.0 18,000 – 20,000 16,500 – 18,000
—————————————————————————
November 15, 2016 $75.0 – $80.0 18,000 – 20,000 16,500 – 18,000
—————————————————————————
March 2, 2017 $75.0 – $80.0 18,000 – 20,000 16,500 – 18,000
—————————————————————————
May 15, 2017 $75.0 – $80.0 19,000 – 21,000 17,000 – 18,000
—————————————————————————
—————————————————————————

/T/

There is flexibility to adjust 2017 capital investment depending on commodity
prices and funds flow which may affect forecast production. The current hedge
position will provide some cushion in the event of a material decline in
commodity prices. Note that some cost inflation is expected based on 2017 first
quarter results and capital investment assumes the cost to drill and complete a
horizontal well at Umbach is $4.3 million, an increase of 13% from the 2016
actual cost.

The outlook for natural gas prices remains positive as a result of a growing
supply/demand deficit in the United States. Data from the Energy Information
Administration (“EIA”) shows 2016 demand (consumption) exceeded supply (dry gas
production plus net imports) by 0.9 Bcf per day. So far in 2017, January and
February supply is 1.1 Bcf per day lower than the 2016 average which further
widens the deficit. Longer term, demand continues to increase as a result of
five LNG export facilities currently operating or under construction on the US
Gulf Coast. In addition, US pipeline capacity to Mexico is expected to increase
by more than 6 Bcf per day by the end of 2018 from six new pipelines.

Most of Storm’s firm transportation commitments have been added over the last
two years with the intent of reducing risk by diversifying natural gas sales
(not betting for or against pricing in any single market). A good example
supporting the diversification of sales is the continued narrowing of the AECO
– BC Station 2 price differential which is contrary to the consensus view that
the differential would widen with continued production growth from northeast
British Columbia (“NE BC”). Since late 2015, the differential has narrowed to
average -$0.19 per GJ in the first quarter of 2017 versus -$0.41 per GJ in 2016
and -$0.85 per GJ in 2015. Although production growth has continued, the
differential has not been impacted as most of the growth has been directed onto
the TCPL system to AECO (the differential can be temporarily affected by
outages and/or constraints on the TCPL system or Alliance Pipeline where more
natural gas is redirected to BC Station 2). Also helping was the Alliance
Pipeline re-contracting in late 2015 where most of the capacity was taken up by
producers instead of marketers. TCPL is planning to further increase capacity
out of NE BC with the North Montney extension which adds 1.5 Bcf per day of
takeaway in early 2019 if a variance application is approved by the National
Energy Board (“NEB”). It is unlikely that production can grow this much over
the next two years, so some of the incremental volume for this expansion is
likely to be sourced from natural gas redirected away from BC Station 2 which
further supports a narrower differential. In the first quarter of 2017,
approximately 32% of Storm’s natural gas sales benefitted from the narrowing
differential.

There continues to be an effort directed toward reducing Storm’s cost structure
to improve competitiveness in the continuing lower price environment.
Production costs per Boe have decreased by 16% from the fourth quarter of 2016
with the new processing arrangement at Umbach. Further reductions in per-Boe
costs are expected with continued production growth at Umbach. Reserve addition
costs are being reduced with longer horizontal wells that access more gas in
place plus adding fracs on tighter spacing is increasing recovery. Recent
results from longer 2017 wells are encouraging and further improvement is
expected as longer wells are drilled and brought on production.

Current commodity prices are supportive of the near-term plan to grow average
2017 production by more than 30% from 2016 levels by investing $75 to $80
million which will result in year-end net debt of approximately $95 to $100
million, a year-over-year increase of 5% to 10%. The preliminary plan for 2018
is for a further 25% to 35% increase in production volumes. Growth in 2017 and
2018 is further supported by firm transportation commitments, hedging and the
infrastructure at Umbach which supports growth to 27,000 Boe per day (after
adding a second compressor at the third field compression facility).

With a large resource in the Montney at Umbach offering multiple years of
drilling inventory, the objective remains to grow net asset value for
shareholders by converting the resource into production and funds flow growth
on a per-share basis.

Respectfully,

Brian Lavergne, President and Chief Executive Officer

May 15, 2017

Boe Presentation – For the purpose of calculating unit revenues and costs,
natural gas is converted to a barrel of oil equivalent (“Boe”) using six
thousand cubic feet (“Mcf”) of natural gas equal to one barrel of oil unless
otherwise stated. Boe may be misleading, particularly if used in isolation. A
Boe conversion ratio of six Mcf to one barrel (“Bbl”) is based on an energy
equivalency conversion method primarily applicable at the burner tip and does
not represent a value equivalency at the wellhead. All Boe measurements and
conversions in this report are derived by converting natural gas to oil in the
ratio of six thousand cubic feet of gas to one barrel of oil. Mboe means 1,000
Boe.

Non-GAAP Measures – This document contains the terms “debt including working
capital deficiency”, “field operating netbacks”, “field operating netbacks
including hedging”, the terms “cash” and “non-cash”, “cash costs”, and
measurements “per commodity unit” and “per Boe” which are not recognized under
Generally Accepted Accounting Principles (“GAAP”) and are regarded as non-GAAP
measures. These non-GAAP measures may not be comparable to the calculation of
similar amounts for other entities and readers are cautioned that use of such
measures to compare enterprises may not be valid. Non-GAAP terms are used to
benchmark operations against prior periods and peer group companies and are
widely used by investors, analysts and other parties. These measurements are
also used by lenders to measure compliance with debt covenants and thus set
interest costs. Additional information relating to certain of these non-GAAP
measures can be found in Storm’s MD&A for the three months ended March 31,
2017, which is available on Storm’s SEDAR profile at www.sedar.com and on
Storm’s website at www.stormresourcesltd.com.

Oil and Gas Metrics – This press release may contain a number of oil and gas
metrics, including FD&A, recycle ratio, FDC, and reserves life index or RLI,
which do not have standardized meanings or standard methods of calculation and
therefore such measures may not be comparable to similar measures used by other
companies. Such metrics have been included herein to provide readers with
additional measures to evaluate the Company’s performance; however, such
measures are not reliable indicators of the future performance of the Company
and future performance may not compare to the performance in previous periods.

Initial Production Rates – References in this press release to initial
production rates, and other short-term production rates are useful in
confirming the presence of hydrocarbons, however such rates are not
determinative of the rates at which such wells will commence production and
decline thereafter and are not indicative of long term performance or of
ultimate recovery. Additionally, such rates may also include recovered “load
oil” fluids used in well completion stimulation. Readers are cautioned not to
place reliance on such rates in calculating the aggregate production for the
Company. A pressure transient analysis or well-test interpretation has not been
carried out in respect of all wells. Accordingly, the Company cautions that the
test results should be considered to be preliminary.

DPIIP – Original Oil in Place (OOIP) is the equivalent to Discovered Petroleum
Initially In Place (DPIIP) for the purposes of this press release. DPIIP is
defined as quantity of hydrocarbons that are estimated to be in place within a
known accumulation. There is no certainty that it will be commercially viable
to produce any portion of the resources. A recovery project cannot be defined
for this volume of DPIIP at this time, and as such it cannot be further
sub-categorized.

Forward-Looking Information – This press release contains forward-looking
statements and forward-looking information within the meaning of applicable
securities laws. The use of any of the words “will”, “would”, “expect”,
“anticipate”, “intend”, “believe”, “plan”, “potential”, “outlook”, “forecast”,
“estimate”, “budget” and similar expressions are intended to identify
forward-looking statements or information. More particularly, and without
limitation, this press release contains forward-looking statements and
information concerning: production; drilling and completion plans; the third
field compression facility and expansion plans in connection therewith; the
January 2017 transportation arrangement; hedging; transportation;
organizational and personnel changes; 2017 and 2018 guidance in respect of
certain operational and financial metrics, including, but not limited to,
commodity pricing, estimated average operating costs, estimated average royalty
rate, estimated operations capital, estimated general and administrative costs,
estimated quarterly and annual production and estimated number of Umbach
horizontal wells drilled, completed and connected, capital investment plans,
infrastructure plans, anticipated United States exports, pipeline capacity,
price volatility mitigation strategy and cost reductions. Statements of
“reserves” are also deemed to be forward-looking statements, as they involve
the implied assessment, based on certain estimates and assumptions, that the
reserves described exist in the quantities predicted or estimated and that the
reserves can be profitably produced in the future.

The forward-looking statements and information in this press release are based
on certain key expectations and assumptions made by Storm, including:
prevailing commodity prices and exchange rates; applicable royalty rates and
tax laws; future well production rates; reserve and resource volumes; the
performance of existing wells; success to be expected in drilling new wells;
the adequacy of budgeted capital expenditures to carrying out planned
activities; the availability and cost of services; and the receipt, in a timely
manner, of regulatory and other required approvals. Although the Company
believes that the expectations and assumptions on which such forward-looking
statements and information are based are reasonable, undue reliance should not
be placed on these forward-looking statements and information because of their
inherent uncertainty. In particular, there is no assurance that exploitation of
the Company’s undeveloped lands and prospects will result in the emergence of
profitable operations.

Since forward-looking statements and information address future events and
conditions, by their very nature they involve inherent risks and uncertainties.
Actual results could differ materially from those currently anticipated due to
a number of factors and risks. These include, but are not limited to the risks
associated with the oil and gas industry in general such as: general economic
conditions in Canada, the United States and internationally; operational risks
in development, exploration and production; delays or changes in plans with
respect to exploration or development projects or capital expenditures; the
uncertainty of reserve estimates; the uncertainty of estimates and projections
relating to reserves, production, costs and expenses; health, safety and
environmental risks; commodity price and exchange rate fluctuations; marketing
and transportation of petroleum and natural gas and loss of markets;
competition; ability to access sufficient capital from internal and external
sources; geopolitical risk; stock market volatility; and changes in
legislation, including but not limited to tax laws, royalty rates and
environmental regulations.

Readers are cautioned that the foregoing list of factors is not exhaustive.
Additional information on these and other factors that could affect the
operations or financial results of the Company are included or are incorporated
by reference in the Company’s Annual Information Form and the MD&A.

The forward-looking statements and information contained in this press release
are made as of the date hereof and the Company undertakes no obligation to
update publicly or revise any forward-looking statements or information,
whether as a result of new information, future events or otherwise, unless so
required by applicable securities laws.

NEITHER THE TSX VENTURE EXCHANGE NOR ITS REGULATION SERVICES PROVIDER (AS THAT
TERM IS DEFINED IN THE POLICIES OF THE TSX VENTURE EXCHANGE) ACCEPTS
RESPONSIBILITY FOR THE ADEQUACY OR ACCURACY OF THIS PRESS RELEASE.

– END RELEASE – 15/05/2017

For further information:
Storm Resources Ltd.
Brian Lavergne
President & Chief Executive Officer
(403) 817-6145
OR
Storm Resources Ltd.
Carol Knudsen
Manager, Corporate Affairs
(403) 817-6145
www.stormresourcesltd.com

COMPANY:
FOR: STORM RESOURCES LTD.
TSX VENTURE SYMBOL: SRX

INDUSTRY: Energy and Utilities – Oil and Gas
RELEASE ID: 20170515CC0108

Press Release from Marketwired 1-866-736-3779

All press releases are written by the client and have NO affiliation with the news copy written by The Canadian Press. Any questions that arise due to the content or information provided in the press release should be directed to the company/organization
issuing the release, not to The Canadian Press.

GET ENERGYNOW’S DAILY EMAIL FOR FREE


Peyto Exploration & Development Corp. Confirms Dividends for June 15, 2017

FOR: PEYTO EXPLORATION & DEVELOPMENT CORP.
TSX SYMBOL: PEY

Date issue: May 15, 2017
Time in: 4:30 PM e

Attention:

CALGARY, ALBERTA–(Marketwired – May 15, 2017) – Peyto Exploration &
Development Corp. (TSX:PEY) (“Peyto”) confirms that the monthly dividend with
respect to May 2017 of $0.11 per common share is to be paid on June 15, 2017,
for shareholders of record on May 31, 2017. The ex-dividend date is May 29,
2017.

Dividends paid by Peyto to Canadian residents are eligible dividends for
Canadian income tax purposes.

Shareholders and interested investors are encouraged to visit the Peyto website
at www.peyto.com to learn more about what makes Peyto one of North America’s
most exciting energy companies. The website also includes the President’s
monthly report, which discusses various topics chosen by the President and
includes estimates of monthly capital expenditures and production. For further
information please contact the person listed below.

Certain information set forth in this document, including management’s
assessment of Peyto’s future plans and operations, contains forward-looking
statements. By their nature, forward-looking statements are subject to numerous
risks and uncertainties, some of which are beyond these parties’ control,
including the impact of general economic conditions, industry conditions,
volatility of commodity prices, currency fluctuations, imprecision of reserve
estimates, environmental risks, competition from other industry participants,
the lack of availability of qualified personnel or management, stock market
volatility and ability to access sufficient capital from internal and external
sources. Readers are cautioned that the assumptions used in the preparation of
such information, although considered reasonable at the time of preparation,
may prove to be imprecise and, as such, undue reliance should not be placed on
forward-looking statements. Peyto’s actual results, performance or achievement
could differ materially from those expressed in, or implied by, these
forward-looking statements and, accordingly, no assurance can be given that any
of the events anticipated by the forward-looking statements will transpire or
occur, or if any of them do so, what benefits that Peyto will derive therefrom.
The Toronto Stock Exchange has neither approved nor disapproved the information
contained herein.

– END RELEASE – 15/05/2017

For further information:
Darren Gee
President and Chief Executive Officer
(403) 237-8911
(403) 451-4100 (FAX)
www.peyto.com

COMPANY:
FOR: PEYTO EXPLORATION & DEVELOPMENT CORP.
TSX SYMBOL: PEY

INDUSTRY: Energy and Utilities – Oil and Gas
RELEASE ID: 20170515CC0086

Press Release from Marketwired 1-866-736-3779

All press releases are written by the client and have NO affiliation with the news copy written by The Canadian Press. Any questions that arise due to the content or information provided in the press release should be directed to the company/organization
issuing the release, not to The Canadian Press.

GET ENERGYNOW’S DAILY EMAIL FOR FREE


PrairieSky Royalty Declares May Dividend

FOR: PRAIRIESKY ROYALTY LTD.TSX SYMBOL: PSKDate issue: May 15, 2017Time in: 4:01 PM eAttention:
CALGARY, ALBERTA–(Marketwired – May 15, 2017) – PrairieSky Royalty Ltd.
(“PrairieSky”) (TSX:PSK) announced today that its Board of Directors has
declared …

GET ENERGYNOW’S DAILY EMAIL FOR FREE


Russia, Saudi Arabia back extension of oil output cuts

MOSCOW — Russia and Saudi Arabia said Monday they want to extend oil production cuts through the first quarter of 2018, in a move the two major producers say would support the market price.

Oil prices rose on the announcement that the countries want to extend the deal, which encompasses both nations in the Organization of the Petroleum Exporting Countries and some non-OPEC countries like Russia.

The Russian Energy Ministry says extending the cuts through March 31, 2018, would show “producers’ determination to ensure stability, predictability and incremental development of the market.”

Russia and Saudi Arabia will now hold consultations with other producers “with the aim of achieving complete consensus” on the extended production cuts before the scheduled OPEC meeting May 25 in Vienna.

“I met the managers of all the main oil and gas companies in the country, and the minister of energy, behind closed doors and we discussed this issue,” Russian President Vladimir Putin said in comments reported by Russian news agencies. “We support this proposal.”

The international benchmark for crude oil was up $1.35, of 2.7 per cent on the day, at $52.19 a barrel on the news.

In late November, OPEC agreed to cut production by 1.2 million barrels a day, the first such reduction agreement since 2008. The following month, 11 non-OPEC oil-producing countries pledged to cut another 558,000 barrels a day, bringing the overall reduction to 1.8 million barrels a day.

Oil producers have been trying to boost prices, as crude futures trade around $50 a barrel, less than half their level from early 2014, though above the low of below $30 in early 2015.

The joint announcement by Russia and Saudi Arabia chimes with a statement Friday by major producers Iraq and Algeria, which argued for extending the cuts through the end of the year.

Following the Russia-Saudi statement, Kazakh Energy Minister Kanat Bozumbayev said “Kazakhstan should follow the trend,” in comments reported by Russia’s RIA Novosti agency. However, Bozumbayev said Kazakhstan would find it technically difficult to keep output down because it started bringing a large new field online last year.

Azerbaijan said it would support a continuation of the cuts, in comments by Energy Ministry spokeswoman Zamira Aliyeva to the Interfax-Azerbaijan agency. There was no comment on Russia and Saudi Arabia’s March 31 date.

The Associated Press

GET ENERGYNOW’S DAILY EMAIL FOR FREE


Esrey Executes Definitive Agreement

FOR: ESREY ENERGY LTD.
TSX VENTURE SYMBOL: EEL

Date issue: May 15, 2017
Time in: 2:01 PM e

Attention:

VANCOUVER, BRITISH COLUMBIA–(Marketwired – May 15, 2017) – Further to its news
release of May 1, 2017 (the “May 1 Release”), Esrey Energy Ltd. (“Esrey” or the
“Company”) (TSX VENTURE:EEL) is pleased to announce that both Esrey and PRG Plc
(“PRG”) have completed a satisfactory due diligence review of the other and
have entered into a definitive agreement providing for the acquisition by Esrey
of the shares of Power Zinc Limited from PRG (the “Acquisition”), on
substantially the terms of the LOI as detailed in the May 1 Release.

In connection with the Acquisition, the Company has agreed to grant 4,183,000
options to designates of PRG and Company participants on closing of the
Acquisition, to be priced in accordance with the policies of the TSX Venture
Exchange.

Closing of the Acquisition remains subject to the acceptance of the TSX Venture
Exchange and trading in the shares of the Company will remain halted pending
satisfaction of the requirements of section 5.6(d) of the TSX Venture Exchange
Policy 5.3.

On behalf of the Board of Directors

David Nelson, President & CEO

Neither TSX Venture Exchange nor its Regulation Services Provider (as that term
is defined in the policies of the TSX Venture Exchange) accepts responsibility
for the adequacy or accuracy of this release.

– END RELEASE – 15/05/2017

For further information:
Investor Relations
1-778-373-0103
[email protected]

COMPANY:
FOR: ESREY ENERGY LTD.
TSX VENTURE SYMBOL: EEL

INDUSTRY: Energy and Utilities – Oil and Gas
RELEASE ID: 20170515CC0074

Press Release from Marketwired 1-866-736-3779

All press releases are written by the client and have NO affiliation with the news copy written by The Canadian Press. Any questions that arise due to the content or information provided in the press release should be directed to the company/organization
issuing the release, not to The Canadian Press.

GET ENERGYNOW’S DAILY EMAIL FOR FREE


Eagle Energy Inc.’s Corporate Presentation is Available on its Website

FOR: EAGLE ENERGY INC.TSX SYMBOL: EGLDate issue: May 15, 2017Time in: 1:34 PM eAttention:
CALGARY, ALBERTA–(Marketwired – May 15, 2017) – Eagle Energy Inc. (“Eagle”)
(TSX:EGL) announced that its corporate presentation is now available at
www.EagleEne…

GET ENERGYNOW’S DAILY EMAIL FOR FREE


DIVERGENT Energy Services Announces Update on the Linear Pump

FOR: DIVERGENT ENERGY SERVICES CORP.TSX VENTURE SYMBOL: DVGDate issue: May 15, 2017Time in: 12:00 PM eAttention:
CALGARY, ALBERTA–(Marketwired – May 15, 2017) –
NOT FOR DISSEMINATION IN THE UNITED STATES OF AMERICA
DIVERGENT Energy Services Corp. (TS…

GET ENERGYNOW’S DAILY EMAIL FOR FREE


Tanker moratorium off B.C. North Coast not needed: CAPP

FOR: CANADIAN ASSOCIATION OF PETROLEUM PRODUCERS (CAPP)
Date issue: May 15, 2017Time in: 11:45 AM eAttention:
CALGARY, ALBERTA–(Marketwired – May 15, 2017) – The Canadian Association of
Petroleum Producers (CAPP) is disappointed with the Government o…

GET ENERGYNOW’S DAILY EMAIL FOR FREE


Crescent Point Energy Confirms May 2017 Dividend

FOR: CRESCENT POINT ENERGY CORP.
TSX SYMBOL: CPG
NYSE SYMBOL: CPG

Date issue: May 15, 2017
Time in: 11:41 AM e

Attention:

CALGARY, ALBERTA–(Marketwired – May 15, 2017) – Crescent Point Energy Corp.
(“Crescent Point” or the “Company”) (TSX:CPG)(NYSE:CPG) confirms that the
dividend to be paid on June 15, 2017, in respect of May 2017 production, for
shareholders of record on May 31, 2017, will be CDN$0.03 per share.

These dividends are designated as “eligible dividends” for Canadian income tax
purposes. For U.S. income tax purposes, Crescent Point’s dividends are
considered “qualified dividends.”

Crescent Point is a leading North American light and medium oil producer that
seeks to maximize shareholder return through its total return strategy of
long-term growth plus dividend income.

CRESCENT POINT ENERGY CORP.

Scott Saxberg, President and Chief Executive Officer

Crescent Point shares are traded on the Toronto Stock Exchange and New York
Stock Exchange, both under the symbol CPG.

– END RELEASE – 15/05/2017

For further information:
Crescent Point Energy Corp.
Ken Lamont
Chief Financial Officer
(403) 693-0020 or Toll free (U.S. & Canada): 888-693-0020
OR
Crescent Point Energy Corp.
Brad Borggard
Vice President, Corporate Planning and Investor Relations
(403) 693-0020 or Toll free (U.S. & Canada): 888-693-0020
(403) 693-0070 (FAX)
www.crescentpointenergy.com

COMPANY:
FOR: CRESCENT POINT ENERGY CORP.
TSX SYMBOL: CPG
NYSE SYMBOL: CPG

INDUSTRY: Energy and Utilities – Oil and Gas
RELEASE ID: 20170515CC0058

Press Release from Marketwired 1-866-736-3779

All press releases are written by the client and have NO affiliation with the news copy written by The Canadian Press. Any questions that arise due to the content or information provided in the press release should be directed to the company/organization
issuing the release, not to The Canadian Press.

GET ENERGYNOW’S DAILY EMAIL FOR FREE


PNG Gold Corporation Announces Name Change to Gen III Oil Corporation

FOR: PNG GOLD CORPORATIONTSX VENTURE SYMBOL: PGKDate issue: May 15, 2017Time in: 11:28 AM eAttention:
VANCOUVER, BRITISH COLUMBIA–(Marketwired – May 15, 2017) – PNG Gold
Corporation (the “Company”) (TSX VENTURE:PGK) is pleased to announce that it
has…

GET ENERGYNOW’S DAILY EMAIL FOR FREE


Razor Energy Corp. Announces Closing of $17.25 Million Equity Financing

FOR: RAZOR ENERGY CORP.
TSX VENTURE SYMBOL: RZE

Date issue: May 15, 2017
Time in: 9:11 AM e

Attention:

CALGARY, ALBERTA–(Marketwired – May 15, 2017) –

NOT FOR DISTRIBUTION IN THE UNITED STATES. ANY FAILURE TO COMPLY WITH THIS
RESTRICTION MAY CONSTITUTE A VIOLATION OF U.S. SECURITIES LAW.

Razor Energy Corp. (“Razor” or the “Company”) (TSX VENTURE:RZE)
(www.razor-energy.com) is pleased to announce that it has closed its previously
announced short form prospectus offering of subscription receipts of Razor
(“Subscription Receipts”) conducted on a reasonable efforts agency basis (the
“Subscription Receipt Offering”). The Company issued 5,750,000 Subscription
Receipts, including 750,000 Subscription Receipts issued on full exercise of
the over-allotment option, at a price of $3.00 per Subscription Receipt for
gross proceeds of $17.25 million. The Subscription Receipt Offering was co-led
by Haywood Securities Inc. and Jett Capital Advisors, LLC, together with
Canaccord Genuity Corp., Eight Capital, National Bank Financial Inc., Acumen
Capital Finance Partners Limited and Macquarie Capital Markets Canada Ltd.

Each Subscription Receipt entitles the holder thereof, without payment of any
additional consideration and without further action on the part of the holder,
to receive one common share of the Company (a “Common Share”) and one-half of
one Common Share purchase warrant of the Company (a “Warrant”) upon closing of
the previously announced acquisition by the Company of strategic assets in west
central Alberta for cash consideration of $9.6 million, subject to customary
adjustments (the “Acquisition”). Each whole Warrant will be exercisable into
one Common Share at an exercise price of $3.50 per Common Share for a period of
12 months following the closing of the Acquisition.

The gross proceeds from the Subscription Receipt Offering will be placed in
escrow (the “Escrowed Proceeds”) and released to Razor (together with any
interest earned thereon) upon Haywood Securities Inc., on behalf of the Agents,
being satisfied and receiving a certificate from the Company to the effect
that: (i) there is no impediment to completion of the Acquisition, other than
the payment of the purchase price, in all material respects in accordance with
the terms of the acquisition agreement in respect of the Acquisition, without
material amendment or waiver adverse to Razor; and (ii) receipt by the Company
of all necessary regulatory and other approvals regarding the Acquisition
(together, the “Escrow Release Conditions”).

If: (i) the Escrow Release Conditions are not satisfied at or before 5:00 p.m.
(Calgary time) on June 30, 2017 (the “Escrow Release Deadline”); (ii) the
Company, prior to the Escrow Release Deadline, has provided notice to Haywood
Securities Inc. or announced to the public, that it does not intend to proceed
with the Acquisition; or (iii) the acquisition agreement in respect of the
Acquisition is terminated, then the Escrowed Proceeds will be reimbursed pro
rata to each holder of the Subscription Receipts at the original subscription
price, plus such holder’s pro rata portion of the interest earned thereon, if
any (payable out of the Escrowed Proceeds).

The net proceeds of the Subscription Receipt Offering will be used to fund the
purchase price in respect of the Acquisition and to fund the Company’s capital
expenditure program.

This press release is not an offer of the securities for sale in the United
States. The securities have not been registered under the U.S. Securities Act
of 1933, as amended, and may not be offered or sold in the United States absent
registration or an exemption from registration. This press release shall not
constitute an offer to sell or the solicitation of an offer to buy nor shall
there be any sale of the securities in any state in which such offer,
solicitation or sale would be unlawful.

ABOUT RAZOR

Razor Energy Corp. is a light oil focused company operating predominantly in
Alberta. Razor’s full-cycle business plan provides an opportunity to reposition
the Company as a disciplined and high-growth junior E&P company. With an
experienced management team and a strong, committed Board, growth is
anticipated to occur through timely strategic acquisitions and operations.
Razor currently trades on TSX Venture Exchange under the ticker “RZE”.

READER ADVISORIES

FORWARD-LOOKING STATEMENTS: This press release contains forward-looking
statements. More particularly, this press release contains statements
concerning, but not limited to: the timing of the Acquisition, payment of the
purchase price in respect of the Acquisition, the use of proceeds from the
Subscription Receipt Offering and the issuance of the Common Shares and
Warrants underlying the Subscription Receipts. In addition, the use of any of
the words “anticipate”, “believe”, “expect”, “plan”, “intend”, “estimate”,
“propose”, “project”, “can”, “will”, “should”, “continue”, “may”, and similar
expressions are intended to identify forward-looking statements.

The forward-looking statements contained herein are based on certain key
expectations and assumptions made by the Company, including but not limited to
receipt of required regulatory approvals. Although the Company believes that
the expectations and assumptions on which the forward-looking statements are
based are reasonable, undue reliance should not be placed on the
forward-looking statements because the Company can give no assurance that they
will prove to be correct. Since forward-looking statements address future
events and conditions, by their very nature they involve inherent risks and
uncertainties including, without limitation. Actual results could differ
materially from those currently anticipated due to a number of factors and
risks. These include, but are not limited to, risk that all necessary approvals
for the closing of the Acquisition are not received, other conditions to the
closing of the Acquisition are not satisfied or any other events occur that
delay or prevent the closing of the Acquisition. Please refer to additional
risk factors relating to Razor’s operations and financial results identified in
the annual information form and management discussion and analysis of the
Company for the period ended December 31, 2016, each of which are available on
SEDAR at www.sedar.com.

The forward-looking statements contained in this press release are made as of
the date hereof and the Company undertakes no obligation to update publicly or
revise any forward-looking statements or information, whether as a result of
new information, future events or otherwise, unless so required by applicable
securities laws.

Neither the TSX Venture Exchange nor its Regulation Services Provider (as that
term is defined in the policies of the TSX Venture Exchange) accepts
responsibility for the adequacy or accuracy of this news release.

– END RELEASE – 15/05/2017

For further information:
Doug Bailey
President and Chief Executive Officer
OR
Kevin Braun
Chief Financial Officer
OR
Razor Energy Corp.
1250, 645 7th Avenue S.W.
Calgary, Alberta T2P 4G8
(403) 262-0242
www.razor-energy.com

COMPANY:
FOR: RAZOR ENERGY CORP.
TSX VENTURE SYMBOL: RZE

INDUSTRY: Energy and Utilities – Oil and Gas
RELEASE ID: 20170515CC0043

Press Release from Marketwired 1-866-736-3779

All press releases are written by the client and have NO affiliation with the news copy written by The Canadian Press. Any questions that arise due to the content or information provided in the press release should be directed to the company/organization
issuing the release, not to The Canadian Press.

GET ENERGYNOW’S DAILY EMAIL FOR FREE


Precision Drilling Announces 2017 Analyst and Investor Day Highlights and Activity Update

FOR: PRECISION DRILLING CORPORATION
TSX SYMBOL: PD
NYSE SYMBOL: PDS

Date issue: May 15, 2017
Time in: 8:30 AM e

Attention:

CALGARY, ALBERTA–(Marketwired – May 15, 2017) – Precision Drilling Corporation
(“Precision”) (TSX:PD)(NYSE:PDS) is hosting its Analyst and Investor Day today
at its Technical Services Center in Houston. Key items that will be discussed
at the event are highlighted below and a full presentation of the event can be
found on Precision’s website.

This news release contains “forward-looking information and statements” within
the meaning of applicable securities laws. For a full disclosure of the
forward-looking information and statements and the risks to which they are
subject, see the “Cautionary Statement Regarding Forward-Looking Information
and Statements” later in this news release.

Technology Update

Today’s technology discussion is focused on several field-ready technology
building blocks: Drilling Equipment Control System, Process Automation Control,
Directional Guidance System, High Speed Downhole Data, Optimization and Apps.
Beta-style field trials of these technologies are ongoing and Precision is
pleased with its progress to date including:

/T/

— Drilling Equipment Control System: largest installed fleet of AMPHION

control systems
— Process Automation Control: 15 rigs installed with NOVOS
— Directional Guidance System: 121 wells and 1.5 million feet drilled
— High Speed Downhole Data Communication (wired drill pipe): 384 thousand
feet drilled representing more than 96% of the total footage drilled on
land to date utilizing wired drill pipe

/T/

Precision is at the forefront of automation and is uniquely positioned with its
existing Super Series drilling rig fleet to achieve scalability and cost
efficient execution of these technologies. Management expects to commercialize
these automation features in 2017.

Precision’s 2017 Strategic Priorities

At the beginning of the year, Precision published three strategic priorities
for 2017:

/T/

— Deliver High Performance, High Value service offerings in an improving

demand environment while demonstrating fixed cost leverage.
— Commercialize rig automation and efficiency-driven technologies across
our Super Series fleet.
— Maintain strict financial discipline in pursuing growth opportunities
with a focus on free cash flow and debt reduction.

/T/

Activity Update

In Canada, Precision has averaged 30 active rigs quarter-to-date with 21 rigs
currently active with six additional rigs temporarily waiting on location for
better weather before moving to the next pad. Precision expects current
Canadian activity to be at trough levels for the year due to the Canadian
market’s annual spring break up. In the U.S., Precision currently has 55 active
rigs and quarter-to-date average active rig count in the U.S. is 58 rigs.
Precision expects to have five additional rigs contracted and activated over
the next three weeks. Internationally, activity continues to progress as
expected with eight rigs active in the quarter.

CAUTIONARY STATEMENT REGARDING FORWARD-LOOKING INFORMATION AND STATEMENTS

Certain statements contained in this release, including statements that contain
words such as “achieve”, “expect” and similar expressions and statements
relating to matters that are not historical facts constitute “forward-looking
information” within the meaning of applicable Canadian securities legislation
and “forward-looking statements” within the meaning of the “safe harbor”
provisions of the United States Private Securities Litigation Reform Act of
1995 (collectively, “forward-looking information and statements”).

In particular, forward looking information and statements include, but are not
limited to, the following:

/T/

— our anticipated commercialization of certain automation features in

2017;
— rigs temporarily waiting on location for better weather before moving to
the next pad; and
— our expectation of five additional rigs contracted and activated over
the next three weeks.

/T/

These forward-looking information and statements are based on certain
assumptions and analysis made by Precision in light of our experience and our
perception of historical trends, current conditions, expected future
developments and other factors we believe are appropriate under the
circumstances. These include, among other things:

/T/

— the status of current negotiations with our customers;
— existing term contracts are neither renewed nor terminated prematurely;
— our ability to deliver rigs to customers on a timely basis; and
— the general stability of the economic and political environments in the

jurisdictions where we operate.

/T/

Undue reliance should not be placed on forward-looking information and
statements. Whether actual results, performance or achievements will conform to
our expectations and predictions is subject to a number of known and unknown
risks and uncertainties which could cause actual results to differ materially
from our expectations. Such risks and uncertainties include, but are not
limited to:

/T/

— volatility in the price and demand for oil and natural gas;
— fluctuations in the demand for contract drilling, well servicing and

ancillary oilfield services;
— Our customers’ inability to obtain adequate credit or financing to
support their drilling and production activity;
— changes in drilling and well servicing technology which could reduce
demand for certain rigs or put us at a competitive disadvantage;
— shortages, delays and interruptions in the delivery of equipment
supplies and other key inputs;
— the effects of seasonal and weather conditions on operations and
facilities;
— the availability of qualified personnel and management;
— a decline in our safety performance which could result in lower demand
for our services;
— changes in environmental laws and regulations such as increased
regulation of hydraulic fracturing or restrictions on the burning of
fossil fuels and greenhouse gas emissions, which could have an adverse
impact on the demand for oil and gas;
— terrorism, social, civil and political unrest in the foreign
jurisdictions where we operate;
— fluctuations in foreign exchange, interest rates and tax rates; and
— other unforeseen conditions which could impact the use of services
supplied by Precision and Precision’s ability to respond to such
conditions.

/T/

Readers are cautioned that the forgoing list of risk factors is not exhaustive.
Additional information on these and other factors that could affect our
business, operations or financial results are included in reports on file with
applicable securities regulatory authorities, including but not limited to
Precision’s Annual Information Form for the year ended December 31, 2016, which
may be accessed on Precision’s SEDAR profile at www.sedar.com or under
Precision’s EDGAR profile at www.sec.gov. The forward-looking information and
statements contained in this news release are made as of the date hereof and
Precision undertakes no obligation to update publicly or revise any
forward-looking statements or information, whether as a results of new
information, future events or otherwise, except as required by law.

About Precision

Precision is a leading provider of safe and High Performance, High Value
services to the oil and gas industry. Precision provides customers with access
to an extensive fleet of contract drilling rigs, directional drilling services,
well service and snubbing rigs, camps, rental equipment, and wastewater
treatment units backed by a comprehensive mix of technical support services and
skilled, experienced personnel.

Precision is headquartered in Calgary, Alberta, Canada. Precision is listed on
the Toronto Stock Exchange under the trading symbol “PD” and on the New York
Stock Exchange under the trading symbol “PDS”.

– END RELEASE – 15/05/2017

For further information:
Carey Ford
Senior Vice President & Chief Financial Officer
403.716.4566
403.716.4755 (FAX)
www.precisiondrilling.com

COMPANY:
FOR: PRECISION DRILLING CORPORATION
TSX SYMBOL: PD
NYSE SYMBOL: PDS

INDUSTRY: Energy and Utilities – Equipment, Energy and Utilities –
Oil and Gas
RELEASE ID: 20170515CC0031

Press Release from Marketwired 1-866-736-3779

All press releases are written by the client and have NO affiliation with the news copy written by The Canadian Press. Any questions that arise due to the content or information provided in the press release should be directed to the company/organization
issuing the release, not to The Canadian Press.

GET ENERGYNOW’S DAILY EMAIL FOR FREE


H2O Innovation reports fiscal year 2017 third quarter results: Continues to build growth

FOR: H2O INNOVATION INC.
TSX VENTURE SYMBOL: HEO
EURONEXT PARIS SYMBOL: ALHEO
OTCQX SYMBOL: HEOFF

Date issue: May 15, 2017
Time in: 8:00 AM e

Attention:

QUEBEC CITY, QUEBEC–(Marketwired – May 15, 2017) – H2O Innovation Inc. (TSX
VENTURE:HEO)(ALTERNEXT:MNEMO:ALHEO)(OTCQX:HEOFF)

Key highlights

/T/

— Continuous revenue growth of 49.9% to reach $21.3 M, compared to $14.2 M

for the same period of the previous fiscal year;
— 81.4% of the revenues recorded in this third quarter are coming from O&M
and SP&S activities, which are recurring in nature;
— Consolidated backlog reached new high of $117.1 M as at March 31, 2017,
boosted by new projects bookings and renewal of O&M contract;
— Adjusted EBITDA(1) stood at $411,737, compared to $1,245,324 for the
same quarter last year, impacted by lower revenues coming from Projects,
and investment in selling expenses and product development;
— Net (loss) earnings amounted to ($1,345,695), compared to $646,422 for
the same period of the previous fiscal year, impacted by acquisition-
related costs and integration costs of Utility Partners;
— Operating activities used ($1,135,127) in cash, compared with ($318,078)
of cash used during the same quarter of the previous fiscal year.

/T/

All amounts in Canadian dollars unless otherwise stated.

/T/

(1)The definition of adjusted earnings before interest, tax depreciation

and amortization (adjusted EBITDA) does not take into account the
Corporation’s finance costs – net, stock-based compensation costs, gain
on purchase price adjustment, unrealized exchange (gains) / losses and
acquisition and integration costs. See reconciliation of this non-IFRS
measure below. The definition of adjusted EBITDA used by the Corporation
may differ from those used by other companies.

/T/

H2O Innovation Inc. (“H2O Innovation” or the “Corporation”) (TSX
VENTURE:HEO)(ALTERNEXT:MNEMO:ALHEO)(OTCQX:HEOFF) announces its results for the
third quarter of fiscal year 2017 ended March 31, 2017. During this quarter,
the Corporation’s revenues increased by 49.9% to $21.3 M, up from $14.2 M for
the same quarter of fiscal year 2016. This increase is largely attributable to
the acquisition of Utility Partners, effective July 1, 2016, which added
significant revenues coming from Operation & Maintenance (“O&M”) activities.

“On this third quarter, the integration of Utility Partners reached a new
level. We can now consider this entity fully merged into H2O Innovation. We
recently captured our first bookings from cross selling generated by Utility
Partners. The Corporation, through Utility Partners, has been able to renew or
extend all of its O&M contracts coming up for renewal and has secured a new
one, using the support of the Projects and SP&S resources. The strategy to grow
O&M and SP&S business pillars is proven to be efficient since it minimizes the
impact of revenue volatility associated with water treatment projects and thus
increase predictability in our business model. With three strong business
pillars, the Corporation is very well balanced and not dependent on a single
source of revenues”, stated Frederic Dugre, President and Chief Executive
Officer of H2O Innovation.

For this third quarter, 40.9% of the revenues came from O&M activities, 40.5%
of the revenues came from the SP&S and 18.6% came from water treatment
projects. “As our project backlog enters into manufacturing phase, we expect to
see our revenues coming from this pillar in the neighborhood to 25% to 30%”,
added Mr. Dugre. The consolidated backlog as of March 31, 2017 stood at $117.1
M, with $56.7 M coming from our projects business pillar and $60.4 M from the
O&M activities.

Revenues from water treatment projects have declined momentarily to $4.0 M
compared to $4.8 M in the corresponding period of the previous fiscal year,
representing a 17.0% decrease. This is not unusual since revenues from water
treatment projects vary from quarter to quarter and depends on the different
milestones reached for revenue recognition. Over the last twelve months,
revenues for projects reached $17.9 M, which represent a decrease of 27.8%
decrease compared to the previous twelve months, where revenues were at $24.8
M. This decrease is explained by the fact that the nature of projects has
changed. The actual water treatment projects backlog consists of municipal
projects that have a more extensive engineering phase, which phase generates
less revenue under the revenue recognition accounting method and this phase
tends to spread out over longer periods than what we were used to with our past
projects. Once projects are entering into the manufacturing phase, it allows
recognition of significantly more revenues as fabrication and assembly moves
forward. Also, project execution is sometimes postponed due to situations
outside of the control of the Corporation, and therefore impacts revenue
recognition.

Even though revenues are slower and lumpy, the water treatment projects are
still a growth vehicle of the Corporation. The water treatment projects order
backlog stood at $56.7 M as at March 31, 2017, compared to $42.1 M a year ago,
representing a 34.7% increase over the last twelve months. The increase of
bookings is not converting into revenue growth at the same pace, due to the
longer period of execution per contract. “Since July 1st 2016, we secured $20.9
M in bookings, with a current pipeline of water treatment projects rich in
opportunities, which should allow the Corporation to continue to increase its
project order backlog and support its revenue growth. We maintain strong
bidding activities and business development mainly in Canada and in United
States”, added Mr. Dugre.

Revenues from SP&S reached $8.6 M compared to $9.4 M in the comparable quarter
of the previous fiscal year. Even though it is a decrease of 8.5% compared to
the same quarter last year, it is the second best quarterly result of the
Corporation’s history for the SP&S pillar. Over the last twelve months,
revenues reached $28.1 M, which represents an increase of 6.3% compared to the
previous twelve months where revenues were at $26.6 M. This increase in SP&S
revenues is the direct result of investments made during the last few years in
our operating and selling functions to support the growth of this business line.

Revenues coming from O&M amounted to $8.7 M. These revenues are recurring sales
and came mainly from the recently acquired Utility Partners. The backlog
related to these O&M contracts stood at $60.4 M as at March 31, 2017 and
consists of long-term contracts, mainly with municipalities, which contain
multi-year renewal options. The backlog increased by $5.5 M in this quarter,
from $54.9 M as at December 31, 2016 to $60.4 M as at March 31, 2017.

In this third quarter of fiscal year 2017, the Corporation generated a 23.8%
gross profit before depreciation and amortization, a lower level than the 31.8%
gross profit before depreciation and amortization generated in the third
quarter of fiscal year 2016. The revenue mix has been modified with the
acquisition of Utility Partners which operates in a different model than our
previous core activities. Indeed, O&M activities generally generates lower
gross margin. Therefore, the integration of Utility Partners into H2O
Innovation, which in this quarter represents 40.9% of the total revenues, puts
pressure on the overall gross margin of the Corporation, although increasing
the predictability and stability of the financial results, and ultimately
profitability.

/T/

Three-month periods Nine-month periods
CONSOLIDATED RESULTS ended on March 31, ended on March 31,
Selected financial data (Unaudited) (Unaudited)
2017 2016 2017 2016
$ $ $ $
————————————————
Revenues 21,284,643 14,199,860 61,111,336 39,624,778
Gross profit before
depreciation and
amortization 5,060,641 4,522,640 14,358,617 11,853,728
Gross profit before
depreciation and
amortization 23.8% 31.8% 23.5% 29.9%
Operating expenses 523,721 356,160 1,448,128 1,009,026
Selling expenses 1,975,348 1,679,681 5,186,872 4,648,798
Administrative expenses 2,307,189 1,289,659 6,300,002 3,521,379
Research and development
expenses – net 16,075 24,126 131,319 144,300
Net (loss) earnings (1,345,695) 646,422 (3,521,051) 872,972
Basic and diluted (loss) (0.034) 0.031 (0.104) 0.042
earnings per share 411,737 1,245,324 1,850,377 2,717,600
Adjusted EBITDA
Adjusted EBITDA over
revenues (%) 1.9% 8.8% 3.0% 6.9%

/T/

The Corporation’s ratio of selling, operating and administrative expenses
(“SG&A”) as a whole over revenues amounted to 22.6% for this quarter, down from
23.4% for the corresponding quarter of the previous fiscal year. This decrease
is mostly attributable to the acquisition of Utility Partners in July 2016
which increased the overall revenues without impacting proportionally the
selling and operating expenses.

Adjusted EBITDA for the quarter was recorded at $411,737, compared with
$1,245,324 for the same period ended March 31, 2016. The adjusted EBITDA over
revenues represents 1.9%, compared to 8.8% for the same quarter in fiscal year
2016. The decrease in the adjusted EBITDA over revenues ratio is essentially
due to the lower volume coming from revenues of water treatment projects.
Moreover, the shift in product mix and the addition of Utility Partners results
impacted negatively the overall gross margin, decreasing the adjusted EBITDA.
Once the volume of revenues will increase, the Corporation expects this
percentage to increase accordingly since all the fixed charges are already
covered.

The net loss amounted to ($1,345,695) or ($0.034) per share for the third
quarter of fiscal year 2017 compared with net earnings of $646,422 or $0.031
per share for the third quarter of fiscal year 2016. The net loss is largely
due to the acquisition of Utility Partners and the related acquisition and
integration costs and to a higher level of SG&A expenses, aimed to support the
constant growth of the Corporation.

Operating activities used ($1,135,127) in cash for the three-month period ended
March 31, 2017, compared with ($318,078) of cash used during the corresponding
period ended March 31, 2016. The increase is mostly due to the net loss before
income taxes generated during this quarter, to the addition of Utility
Partners, and the increase in non-cash items.

Reconciliation of adjusted EBITDA to net (loss) earnings

Even though adjusted EBITDA is a non-IFRS measure, it is used by management to
make operational and strategic decisions. Providing this information to the
stakeholders, in addition to the GAAP measures, allows them to see the
Corporation’s results through the eyes of management, and to better understand
the financial performance, notwithstanding the impact of GAAP measures.

/T/

Three-month periods Nine-month periods
ended March 31, ended March 31,
2017 2016 2017 2016
————————————————
$ $ $ $
Net (loss) earnings for the
period (1,345,695) 646,422 (3,521,051) 872,972
Finance costs – net 328,485 233,260 984,780 597,514
Income taxes (189,262) 205,077 (580,855) 417,930
Depreciation of property,
plant and equipment 191,850 175,192 548,314 447,178
Amortization of intangible
assets 1,272,620 276,852 2,774,142 744,957
Gain on purchase price
adjustment – – – (375,977)
Unrealized exchange loss (59,586) (292,260) 118,282 (35,173)
Acquisition and integration
costs 45,867 781 1,066,696 48,199
Stock-based compensation
costs 167,458 – 460,069 –
————————————————
Adjusted EBITDA 411,737 1,245,324 1,850,377 2,717,600
————————————————
————————————————

/T/

H2O Innovation Conference Call

Frederic Dugre, President and Chief Executive Officer and Marc Blanchet, Chief
Financial Officer, will hold an investor conference call to discuss the
financial results for 2017 third quarter in further details at 10:00 a.m. (EDT)
on Monday, May 15, 2017.

To access the call, please call (877) 223-4471 or (647) 788-4922, five to ten
minutes prior to the start time. Presentation slides for the conference call
will be made available on the Corporate Presentations page of the Investors
section of the Corporation’s website.

The third quarter financial report is available on www.h2oinnovation.com and on
SEDAR (www.sedar.com).

Prospective disclosures

Certain statements set forth in this press release regarding the operations and
the activities of H2O Innovation as well as other communications by the
Corporation to the public that describe more generally management objectives,
projections, estimates, expectations or forecasts may constitute
forward-looking statements within the meaning of securities legislation.
Forward-looking statements concern analysis and other information based on
forecast future results, performance and achievements and the estimate of
amounts that cannot yet be determined. Forward-looking statements include the
use of words such as “anticipate”, “if”, “believe”, “continue”, “could”,
“estimate”, “expect”, “intend”, “may”, “plan”, “potential”, “predict”,
“project”, “should” or “will”, and other similar expressions, as well as those
usually used in the future and the conditional, notably regarding certain
assumptions as to the success of a venture. Those forward-looking statements,
based on the current expectations of management, involve a number of risks and
uncertainties, known and unknown, which may result in actual and future
results, performance and achievements of the Corporation to be materially
different than those indicated. Information about the risk factors to which the
Corporation is exposed is provided in the Annual Information Form dated
September 26, 2016 available on SEDAR (www.sedar.com). Unless required to do so
pursuant to applicable securities legislation, H2O Innovation assumes no
obligation to update or revise forward-looking statements contained in this
press release or in other communications as a result of new information, future
events and other changes.

About H2O Innovation

H2O Innovation designs and provides state-of-the-art, custom-built and
integrated water treatment solutions based on membrane filtration technology
for municipal, industrial, energy and natural resources end-users. The
Corporation’s activities rely on three pillars which are i) water and
wastewater projects; ii) specialty products and services, including a complete
line of specialty chemicals, consumables, specialized products for the water
treatment industry as well as control and monitoring systems; and iii)
operation and maintenance services for water and wastewater treatment systems
For more information, visit www.h2oinnovation.com.

Neither TSX Venture Exchange nor its Regulation Services Provider (as that term
is defined in the policies of the TSX Venture Exchange) nor the Alternext
Exchange accepts responsibility for the adequacy or accuracy of this release.

– END RELEASE – 15/05/2017

For further information:
Source:
H2O Innovation Inc.
www.h2oinnovation.com
OR
Contact:
Marc Blanchet
+1 418-688-0170
[email protected]

COMPANY:
FOR: H2O INNOVATION INC.
TSX VENTURE SYMBOL: HEO
EURONEXT PARIS SYMBOL: ALHEO
OTCQX SYMBOL: HEOFF

INDUSTRY: Environment – Air Pollution Control
RELEASE ID: 20170515CC0014

Press Release from Marketwired 1-866-736-3779

All press releases are written by the client and have NO affiliation with the news copy written by The Canadian Press. Any questions that arise due to the content or information provided in the press release should be directed to the company/organization
issuing the release, not to The Canadian Press.

GET ENERGYNOW’S DAILY EMAIL FOR FREE


SECURE Energy Services Inc. Enters Into Agreement to Acquire Ceiba Energy Services Inc.

FOR: CEIBA ENERGY SERVICES INC.
TSX VENTURE SYMBOL: CEB

AND SECURE ENERGY SERVICES INC.
TSX SYMBOL: SES

Date issue: May 15, 2017
Time in: 8:00 AM e

Attention:

CALGARY, ALBERTA–(Marketwired – May 15, 2017) – SECURE Energy Services Inc.
(“SECURE”) (TSX:SES) and Ceiba Energy Services Inc. (“Ceiba”) (TSX VENTURE:CEB)
are pleased to announce that they have entered into an arrangement agreement
dated May 14, 2017 (the “Arrangement Agreement”) pursuant to which SECURE has
agreed to acquire all of the issued and outstanding common shares of Ceiba (the
“Ceiba Shares”), a service provider of stand-alone water disposal and oil
treating facilities in the Canadian energy sector (the “Transaction”).

Under the terms of the Arrangement Agreement, SECURE will pay approximately $26
million for all of the issued and outstanding Ceiba Shares. Ceiba shareholders
will receive $0.205 for each share, to be paid in cash or by the issuance of
0.02115 of a SECURE common share, at their election, provided that a maximum of
approximately 1.3 million SECURE common shares will be issued (representing
approximately 50% of the consideration to be paid to Ceiba shareholders). The
exchange ratio reflects a SECURE share price of $9.6912, being SECURE’s
trailing 3-trading day volume weighted average trading price on the Toronto
Stock Exchange. The $0.205 per share consideration represents a 64% premium
over the closing price of Ceiba Shares on the TSX Venture Exchange on May 12,
2017. The aggregate Transaction value is approximately $37 million, which
includes the assumption of approximately $11 million in Ceiba debt.

As part of the Transaction, SECURE will acquire approximately $1 million of net
working capital excluding debt and approximately $30 million of fixed assets
consisting of tanks, pumps, pipelines, treaters, disposal wells and various
other equipment.

“Adding Ceiba’s stand-alone water disposal and oil treating facilities to
SECURE’s expansive network of facilities provides our customers with more
options for their water, waste and oil handling needs,” said Rene Amirault,
SECURE’s Chairman and Chief Executive Officer. “This Transaction will add 10
new locations to our existing footprint of 39 facilities in the Western
Canadian Sedimentary Basin. There are numerous opportunities at the Ceiba
facilities to optimize and expand existing services and throughput, thereby
enhancing customer value.”

Ronald Sifton, Interim CEO of Ceiba, stated, “We are very pleased with this
outcome of our strategic process review. The Transaction provides our
shareholders the opportunity to participate in the future potential of a well
capitalized leading North American energy services company which has a track
record of successful project execution and corporate growth. The combined
entity is much better positioned to deploy capital and realize significant
operating synergies to maximize the value of Ceiba’s operating assets.”

TRANSACTION RATIONALE

/T/

— Expands SECURE’s PRD network: The Transaction adds 10 facilities that

fit within, and add capacity to, SECURE’s PRD network which provides
multiple services for processing, recovery, treatment, and disposal of
oil and gas by-products. The additional facilities will provide
customers with more options to reduce their overall transportation for
custom treating of crude oil, crude oil marketing, produced and waste
water disposal and oilfield waste processing;

— Accelerates growth and expansion opportunities: SECURE obtains immediate

access to areas of interest, including the opportunity to add
incremental capital to enhance throughput and service capabilities;

— Significant operational and administration synergies: SECURE will absorb

and optimize the Ceiba facilities into its existing PRD network, sharing
resources related to senior management, sales and general and
administration;

— Utilization of Non-Capital Losses: SECURE anticipates being able to

utilize Ceiba’s existing non-capital loss tax pools in existing PRD
operations. Ceiba has approximately $49 million in total tax pools
including approximately $27 million in non-capital losses; and

— After the consideration of operational and administrative synergies, and

including an initial capital injection of $5.0 to $6.0 million, SECURE
expects the contribution to consolidated adjusted EBITDA from the Ceiba
acquisition to be approximately $7.0 to $8.0 million on an annualized
basis.

/T/

DETAILS OF THE TRANSACTION

The SECURE Board has unanimously approved the Transaction. The board of
directors of Ceiba (the “Ceiba Board”) has unanimously approved the Transaction
and recommends that holders of Ceiba Shares vote in favour of the special
resolution approving the Transaction. Peters & Co. Limited is acting as
financial advisor to Ceiba in respect of the Transaction and has provided the
Ceiba Board with its verbal opinion that, subject to the assumptions,
qualifications and limitations contained therein, the consideration to be
received by holders of Ceiba Shares pursuant to the terms of the Arrangement
Agreement is fair, from a financial point of view, to the holders of Ceiba
Shares.

Securityholders holding approximately 40% of the combined outstanding shares
and warrants of Ceiba have signed lock up agreements in support of the
Arrangement.

Under the terms of the Arrangement Agreement, the Transaction will be effected
by way of a plan of arrangement of Ceiba under the Business Corporations Act
(Alberta). The SECURE shares to be issued on the exchange of Ceiba Shares
pursuant to the Arrangement Agreement will be available to Ceiba shareholders
on a tax deferred basis for Canadian tax purposes. The Transaction will require
approval by at least 66 2/3 percent of holders of the Ceiba Shares and Ceiba
warrants, voting together as a single class, at a special meeting to be called
to consider the Transaction. The Transaction is expected to be completed in the
third quarter of 2017 and is subject to TSX, TSX Venture Exchange and Alberta
Court of Queen’s Bench approval, regulatory approvals and the satisfaction of
other customary closing conditions. The Transaction is an arm’s length
transaction for the purposes of the policies of the TSX Venture Exchange.

The Arrangement Agreement contains customary terms and conditions for a
transaction of this nature, including a prohibition upon Ceiba from soliciting
or initiating any discussion concerning any other business combination or
similar transaction, subject to compliance with fiduciary duties, the right of
SECURE to match any unsolicited superior proposal received by Ceiba, and a
termination fee of $1.0 million payable to SECURE in certain circumstances.

ABOUT SECURE ENERGY SERVICES INC.

SECURE is a TSX publicly traded energy services company that provides safe,
innovative, efficient and environmentally responsible fluids and solids
solutions to the oil and gas industry. The Corporation owns and operates
midstream infrastructure and provides environmental services and innovative
products to upstream oil and natural gas companies operating in western Canada
and certain regions in the United States (“U.S.”).

The Corporation operates three divisions:

Processing, Recovery and Disposal Division (“PRD”): The PRD division owns and
operates midstream infrastructure that provides processing, storing, shipping
and marketing of crude oil, oilfield waste disposal and recycling. More
specifically these services are clean oil terminalling and rail transloading,
custom treating of crude oil, crude oil marketing, produced and waste water
disposal, oilfield waste processing, landfill disposal, and oil purchase/resale
service. SECURE currently operates a network of facilities throughout Western
Canada and in North Dakota, providing these services at its full service
terminals (“FST”), landfills, stand-alone water disposal facilities (“SWD”) and
full service rail facilities (“FSR”).

Drilling and Production Services Division (“DPS”): The DPS division provides
equipment and product solutions for drilling, completion and production
operations for oil and gas producers in Western Canada. The drilling service
line comprises the majority of the revenue for the division which includes the
design and implementation of drilling fluid systems for producers drilling for
oil, bitumen and natural gas. The drilling service line focuses on providing
products and systems that are designed for more complex wells, such as medium
to deep wells, horizontal wells and horizontal wells drilled into the oil
sands. The production services line focuses on providing equipment and chemical
solutions that optimize production, provide flow assurance and maintain the
integrity of production assets.

Onsite Services Division (“OS”): The operations of the OS division include
Projects which include pipeline integrity (inspection, excavation, repair,
replacement and rehabilitation), demolition and decommissioning, and
reclamation and remediation of former wellsites, facilities, commercial and
industrial properties, and environmental construction projects (landfills,
containment ponds, subsurface containment walls, etc.); Environmental services
which provide pre-drilling assessment planning, drilling waste management,
remediation and reclamation assessment services, Naturally Occurring
Radioactive Material (“NORM”) management, waste container services, and
emergency response services; and Integrated Fluid Solutions (“IFS”) which
include water management, recycling, pumping and storage solutions.

ABOUT CEIBA ENERGY SERVICES INC.

Ceiba provides specialized services to the energy sector, specifically to
companies involved in the exploration, extraction and production of oil and
natural gas in Western Canada. Ceiba develops and constructs facilities in
proximity to its customers to provide treatment of crude oil emulsion,
terminalling, storage and marketing of oil and disposal of production water.

FORWARD-LOOKING STATEMENTS

Certain statements contained in this new release constitute “forward-looking
statements” and/or “forward-looking information” within the meaning of
applicable securities laws (collectively referred to as forward-looking
statements). When used in this document, the words “may”, “would”, “could”,
“will”, “intend”, “plan”, “anticipate”, “believe”, “estimate”, “expect”, and
similar expressions, as they relate to SECURE, or its management, are intended
to identify forward-looking statements. Such statements reflect the current
views of SECURE with respect to future events and operating performance and
speak only as of the date of this document. In particular, this document
contains or implies forward-looking statements pertaining to: anticipated
benefits of the Transaction, expected synergies with SECURE’s business,
services expansion and optimization, EBITDA contribution from the Transaction
and anticipated Transaction timing.

Forward-looking statements concerning expected operating and economic
conditions are based upon prior year results as well as the assumption that
levels of market activity and growth will be consistent with industry activity
in Canada and the U.S. and similar phases of previous economic cycles.
Forward-looking statements concerning the relative future competitive position
of the Corporation are based upon the assumption that economic and operating
conditions, including commodity prices, crude oil and natural gas storage
levels, interest and foreign exchange rates, the regulatory framework regarding
oil and natural gas royalties, environmental regulatory matters, the ability of
the Corporation and its subsidiaries to successfully market their services and
drilling and production activity in North America will lead to sufficient
demand for the Corporation’s services and its subsidiaries’ services including
demand for oilfield services for drilling and completion of oil and natural gas
wells, that the current business environment will remain substantially
unchanged, and that present and anticipated programs and expansion plans of
other organizations operating in the energy industry may change the demand for
the Corporation’s services and its subsidiaries’ services. Forward-looking
statements concerning the nature and timing of growth are based on past factors
affecting the growth of the Corporation, past sources of growth and
expectations relating to future economic and operating conditions.

Forward-looking statements involve significant risks and uncertainties, should
not be read as guarantees of future performance or results, and will not
necessarily be accurate indications of whether such results will be achieved.
Readers are cautioned not to place undue reliance on these statements as a
number of factors could cause actual results to differ materially from the
results discussed in these forward-looking statements, including but not
limited to those factors referred to and under the heading “Business Risks” in
SECURE’s latest Management’s Discussion and Analysis and under the heading
“Risk Factors” in the Corporation’s Annual Information Form (for the year ended
December 31, 2016 and also includes the risks associated with the possible
failure to realize the anticipated synergies in integrating the assets acquired
in the Acquisition with the operations of SECURE. Although forward-looking
statements contained in this document are based upon what the Corporation
believes are reasonable assumptions, the Corporation cannot assure investors
that actual results will be consistent with these forward-looking statements.
The forward-looking statements in this document are expressly qualified by this
cautionary statement. Unless otherwise required by law, SECURE does not intend,
or assume any obligation, to update these forward-looking statements.

NON-GAAP MEASURES, OPERATIONAL DEFINITIONS AND ADDITIONAL SUBTOTALS

The Corporation uses accounting principles that are generally accepted in
Canada (the issuer’s “GAAP”), which includes International Financial Reporting
Standards (“IFRS”). Certain supplementary measures in this document do not have
any standardized meaning as prescribed by IFRS, including the non-GAAP measure
adjusted EBITDA. These non-GAAP measures, operational definitions and
additional subtotals used by the Corporation may not be comparable to similar
measures presented by other reporting issuers. These non-GAAP financial
measures, operational definitions and additional subtotals are included because
management uses the information to analyze operating performance, leverage and
liquidity. Therefore, these non-GAAP financial measures, operational
definitions and additional subtotals should not be considered in isolation or
as a substitute for measures of performance prepared in accordance with GAAP.
See the management’s discussion and analysis available at www.sedar.com for a
reconciliation of the Non-GAAP financial measures, operational definitions and
additional subtotals.

– END RELEASE – 15/05/2017

For further information:
SECURE Energy Services Inc.
Rene Amirault
Chairman, President and Chief Executive Officer
(403) 984-6100
(403) 984-6101 (FAX)
OR
SECURE Energy Services Inc.
Allen Gransch
Executive Vice President and Chief Financial Officer
(403) 984-6100
(403) 984-6101 (FAX)
www.secure-energy.com
OR
Ceiba Energy Services Inc.
Ronald Sifton
Interim Chief Executive Officer
403-850-9080
www.ceibaenergy.com

COMPANY:
FOR: CEIBA ENERGY SERVICES INC.
TSX VENTURE SYMBOL: CEB

AND SECURE ENERGY SERVICES INC.
TSX SYMBOL: SES

INDUSTRY: Energy and Utilities – Oil and Gas
RELEASE ID: 20170515CC0018

Press Release from Marketwired 1-866-736-3779

All press releases are written by the client and have NO affiliation with the news copy written by The Canadian Press. Any questions that arise due to the content or information provided in the press release should be directed to the company/organization
issuing the release, not to The Canadian Press.

GET ENERGYNOW’S DAILY EMAIL FOR FREE


San Angelo Oil Limited Announces C$6 Million Subscription Receipt Offering to be completed by Cabral Gold Ltd.

FOR: SAN ANGELO OIL LIMITEDNEX BOARD SYMBOL: SAO.HTSX VENTURE SYMBOL: SAO.HDate issue: May 15, 2017Time in: 7:30 AM eAttention:
VANCOUVER, BRITISH COLUMBIA–(Marketwired – May 15, 2017) –
NOT FOR DISTRIBUTION TO U.S. NEWSWIRE SERVICES OR FOR DISSEMINA…

GET ENERGYNOW’S DAILY EMAIL FOR FREE


AssetWorks ELD’s Make-It-or-Break-It Moment—Literally!

AssetWorks Field Service Solutions Account Executive, Josh Beaver, recently attended the 2017 New Mexican Trucking Association Annual Convention. With the Electronic Logging Device (ELD) Mandate deadline fast approaching, of course, ELDs were a hot topic at the convention. The leaders of the New Mexico Highway Patrol were giving a presentation to all attendees on the … Read more

GET ENERGYNOW’S DAILY EMAIL FOR FREE


Liberal bill will bar oil tanker traffic from northern B.C. coast

OTTAWA — New legislation introduced by the federal government will bar most oil tankers from operating along the coast of northern British Columbia.

It will ban tankers carrying crude oil and so-called persistent oils from stopping, loading or unloading at any ports or marine installations from the northern tip of Vancouver Island all the way to the B.C.-Alaska border, including Haida Gwaii.

The legislation fulfills an election pledge made by Prime Minister Justin Trudeau and included in Transport Minister Marc Garneau’s mandate letter in November 2015.

Some groups, weary of waiting for Trudeau to make good on his promise, became concerned when the ban wasn’t originally included in the $1.5-billion Oceans Protection Plan unveiled in early November 2016.

A few weeks later, however, he reiterated the promise at the same time as he announced the Liberal government was rejecting an application for the Northern Gateway pipeline in B.C., saying the legislation would be introduced in the spring.

Garneau had the Oil Tanker Moratorium Act tabled Friday in the House of Commons.

Tankers carrying less than 12,500 metric tonnes of oil are exempt from the proposed law, to ensure northern communities can continue to receive shipments of necessary fuels. Maximum penalties for defying the ban are as high as $5 million.

The legislation will allow for amendments to exempt or add additional products based on science and environmental safety.

Persistent oils are defined as those that are heavier and dissipate slowly if they spill, such as synthetic crude, partially upgraded bitumen and Bunker C fuel oil.

Gavin Smith, lawyer for the West Coast Environmental Law Association, said it’s great the government is making good on its promise.

“It’s consistent with what the federal government signalled it was going to do,” Smith said.

There is a voluntary ban already that keeps most big tankers out of the area, and the legislation will formalize that process, once passed, he said. However, there is a dearth of information about what kind of traffic does go through the region, something Smith said he’d like to see Transport Canada make public.

Smith also said at first glance, the legislation appears strong enough to prevent the approval of any future major projects, such as the Northern Gateway pipeline.

One provision in particular is of special concern, he said: it gives the minister the authority to grant exemptions to vessels if their passage is deemed to be in the public interest or of help to local communities.

Not everyone supports the idea of a law, however.

One indigenous resource development group behind an energy corridor proposal in B.C. and Alberta accused the government of imposing a blanket ban against the wishes and interests of First Nations.

Eagle Spirit Energy group says the government has no business telling it what it can do in its territories and that the decision to enact legislation will harm indigenous economic development.

— Follow @mrabson on Twitter

Mia Rabson, The Canadian Press

Note to readers: This is a corrected story. An earlier version referred to Trans Mountain pipeline instead of Northern Gateway.

GET ENERGYNOW’S DAILY EMAIL FOR FREE


Notley’s outlook for Kinder Morgan pipeline unswayed by uncertain B.C. vote

CALGARY — Alberta Premier Rachel Notley says the uncertain outcome of the British Columbia election should not change the fate of the Trans Mountain pipeline expansion.

Notley supports the $7.4-billion project proposed by Texas-based Kinder Morgan to triple the amount of crude that flows from the Edmonton area to the B.C. Lower Mainland.  

The federal government approved the project late last year, so Notley doesn’t believe a political shift in Alberta’s western neighbour is much of a factor.

“Our view is that the federal government is the government that has the decision-making authority and we look forward to supporting their work going forward,” she said Friday in Calgary, where she was announcing provincial funding to upgrade the bobsled, luge and skeleton track at Canada Olympic Park.

The B.C. election earlier this week left Christy Clark’s Liberals just shy of a majority with 43 seats, but recounts and absentee ballots could change the final tally.

The NDP won 41 seats and the Green Party holds the balance of power with three seats.

The B.C. NDP’s campaign platform promised to use “every tool in the toolbox” to stop the Trans Mountain project from going ahead, but did not outline how.

In announcing his blessing for the Trans Mountain expansion, Prime Minister Justin Trudeau praised the Notley government’s efforts to combat climate change through a carbon tax and other measures.

Notley said she does not see Trans Mountain suffering the same fate as the defunct Northern Gateway project, which was granted federal approval in mid-2014.

A court reversed that approval of the Enbridge-led project on the grounds Ottawa failed to adequately consult indigenous communities. Trudeau killed it for good on the same day he announced Trans Mountain’s approval. He also gave the green light to another proposed pipeline project to the U.S. Midwest.

“Obviously the courts are going to do what they’re going to do, and that’s their job,” Notley said.

“But I feel pretty confident that the process behind Kinder Morgan was pretty solid. And of course the case for the economic value of Kinder Morgan not only to Albertans, but also to British Columbians and ultimately to all Canadians, it is exceptionally strong.”

The Alberta and B.C. New Democrats are at odds when it comes to Trans Mountain.

Notley declined to endorse B.C. NDP Leader John Horgan and warned her staff not to campaign for him because of his stance on the pipeline, seen as key to the long-term health of the oilsands industry and to Notley’s political prospects.

Horgan downplayed the rift on the campaign trail by saying the two politicians agreed to disagree.


Lauren Krugel, The Canadian Press

GET ENERGYNOW’S DAILY EMAIL FOR FREE


Savanna Energy Services Corp. Announces First Quarter 2017 Results and Temporary Waiver Amendment and Extension from Syndicated Credit Facility Lenders

FOR: SAVANNA ENERGY SERVICES CORP.TSX SYMBOL: SVYDate issue: May 12, 2017Time in: 7:03 PM eAttention:
CALGARY, ALBERTA–(Marketwired – May 12, 2017) –
First Quarter Results
Savanna (TSX:SVY) generated revenue of $117.3 million, EBITDAS of $10.8 millio…

GET ENERGYNOW’S DAILY EMAIL FOR FREE


US rig count rises 8 this week to 885; Texas up 8

HOUSTON — The number of rigs exploring for oil and natural gas in the U.S. rose by eight this week to 885.

A year ago, only 406 rigs were active amid a slump in energy prices.

Houston oilfield services company Baker Hughes Inc. said Friday that 712 rigs sought oil and 172 explored for natural gas this week. One was listed as miscellaneous.

Texas added eight rigs while Colorado, North Dakota, Ohio and Wyoming each added one.

Oklahoma declined by two rigs while Alaska and New Mexico each lost one.

Arkansas, California, Kansas, Louisiana, Pennsylvania, Utah and West Virginia were unchanged.

The U.S. rig count peaked at 4,530 in 1981. It bottomed out last May at 404.

The Associated Press

GET ENERGYNOW’S DAILY EMAIL FOR FREE


Greenfields Petroleum Corporation Completes Non-Brokered Private Placement

FOR: GREENFIELDS PETROLEUM CORPORATIONTSX VENTURE SYMBOL: GNFDate issue: May 12, 2017Time in: 5:48 PM eAttention:
HOUSTON, TEXAS–(Marketwired – May 12, 2017) –
NOT FOR DISTRIBUTION TO U.S. NEWSWIRE SERVICES OR FOR DISSEMINATION IN THE
UNITED STATES. …

GET ENERGYNOW’S DAILY EMAIL FOR FREE


Galileo Exploration Ltd. Announces Resignation of a Director

FOR: GALILEO EXPLORATION LTD.
TSX VENTURE SYMBOL: GXL

Date issue: May 12, 2017
Time in: 5:30 PM e

Attention:

VANCOUVER, BRITISH COLUMBIA–(Marketwired – May 12, 2017) – Galileo Exploration
Ltd. (TSX VENTURE:GXL) (the “Company”) announces that Mr. David N. Hottman has
resigned as Chairman and Director of the Company as of May 11, 2017.

Ronald A. Rieder, President & CEO commented that “David was one of the original
founders of the Company and has been guiding the company for many years and the
Board would like to thank him for his years of service to Galileo and its
predecessor companies. His support, guidance and leadership have been an asset
to Galileo and we wish him the best of luck in his new ventures.”

Galileo Exploration Ltd. is working to add shareholder value by acquiring and
advancing resource projects of merit in North America.

ON BEHALF OF GALILEO EXPLORATION LTD.

Mark T. Brown, CFO & Director

Neither the TSX Venture Exchange nor its Regulation Services Provider (as that
term is defined in the policies of the TSX Venture Exchange) accepts
responsibility for the adequacy or accuracy of this News Release. This news
release has been prepared by management and no regulatory authority has
approved or disapproved the information contained herein.

– END RELEASE – 12/05/2017

For further information:
Ronald Rieder
President and CEO
604-727-4653
E-mail: [email protected]

COMPANY:
FOR: GALILEO EXPLORATION LTD.
TSX VENTURE SYMBOL: GXL

INDUSTRY: Energy and Utilities – Oil and Gas
RELEASE ID: 20170512CC0090

Press Release from Marketwired 1-866-736-3779

All press releases are written by the client and have NO affiliation with the news copy written by The Canadian Press. Any questions that arise due to the content or information provided in the press release should be directed to the company/organization
issuing the release, not to The Canadian Press.

GET ENERGYNOW’S DAILY EMAIL FOR FREE


Birchcliff Energy Ltd. Announces Director Election Results from 2017 Annual and Special Meeting of Shareholders and Board Changes

FOR: BIRCHCLIFF ENERGY LTD.TSX SYMBOL: BIRDate issue: May 12, 2017Time in: 5:16 PM eAttention:
CALGARY, ALBERTA–(Marketwired – May 12, 2017) – Birchcliff Energy Ltd.
(“Birchcliff”) (TSX:BIR) is pleased to announce the director election results
from i…

GET ENERGYNOW’S DAILY EMAIL FOR FREE


Serinus Announces Receipt of EBRD Waiver

FOR: SERINUS ENERGY INC.
TSX SYMBOL: SEN
WARSAW SYMBOL: SEN

Date issue: May 12, 2017
Time in: 5:00 PM e

Attention:

CALGARY, ALBERTA–(Marketwired – May 12, 2017) – Serinus Energy Inc. (the
“Company”) (TSX:SEN)(WARSAW:SEN) is pleased to report that the European Bank of
Reconstruction and Development (“EBRD”) has formally waived compliance with the
financial debt to EBITDA ratio and the debt service coverage ratio on the
Company’s debt at the consolidated level for the three-month period ended March
31, 2017.

About Serinus

Serinus is an international upstream oil and gas exploration and production
company that owns and operates projects in Tunisia and Romania.

For further information, please refer to the Serinus website
(www.serinusenergy.com).

Translation: This news release has been translated into Polish from the English
original.

Forward-looking Statements This release may contain forward-looking statements
made as of the date of this announcement with respect to future activities that
either are not or may not be historical facts. Although the Company believes
that its expectations reflected in the forward-looking statements are
reasonable as of the date hereof, any potential results suggested by such
statements involve risk and uncertainties and no assurance can be given that
actual results will be consistent with these forward-looking statements.
Various factors that could impair or prevent the Company from completing the
expected activities on its projects include that the Company’s projects
experience technical and mechanical problems, there are changes in product
prices, failure to obtain regulatory approvals, the state of the national or
international monetary, oil and gas, financial, political and economic markets
in the jurisdictions where the Company operates and other risks not anticipated
by the Company or disclosed in the Company’s published material. Since
forward-looking statements address future events and conditions, by their very
nature, they involve inherent risks and uncertainties and actual results may
vary materially from those expressed in the forward-looking statement. The
Company undertakes no obligation to revise or update any forward-looking
statements in this announcement to reflect events or circumstances after the
date of this announcement, unless required by law.

– END RELEASE – 12/05/2017

For further information:
Serinus Energy Inc.
Calvin Brackman
Vice President, External Relations & Strategy
+1-403-264-8877
[email protected]
OR
Serinus Energy Inc.
Jeffrey Auld
Chief Executive Officer
+1-403-264-8877
[email protected]

COMPANY:
FOR: SERINUS ENERGY INC.
TSX SYMBOL: SEN
WARSAW SYMBOL: SEN

INDUSTRY: Energy and Utilities – Oil and Gas
RELEASE ID: 20170512CC0084

Press Release from Marketwired 1-866-736-3779

All press releases are written by the client and have NO affiliation with the news copy written by The Canadian Press. Any questions that arise due to the content or information provided in the press release should be directed to the company/organization
issuing the release, not to The Canadian Press.

GET ENERGYNOW’S DAILY EMAIL FOR FREE


Epsilon Reports First Quarter 2017 Results

FOR: EPSILON ENERGY LTD.
TSX SYMBOL: EPS

Date issue: May 12, 2017
Time in: 4:58 PM e

Attention:

HOUSTON, TEXAS–(Marketwired – May 12, 2017) – Epsilon Energy Ltd. (“Epsilon”
or the “Company”) (TSX:EPS) today reported first quarter 2017 financial and
operating results.

Mr. Michael Raleigh, Chief Executive Officer, commented, “Marcellus gas prices
continued to strengthen during the first quarter despite a relatively mild
winter season further demonstrating sustained underlying demand, local
interstate pipeline capacity growth, and limited gas supply growth. During the
first quarter, Epsilon’s upstream gas revenues were $5.9 million, an 85%
increase from the first quarter of 2016. Both increasing gas price and a
shrinking basis differential contributed to the revenue increase. Epsilon’s
effective basis differential on realized natural gas prices decreased by 38% in
the first quarter as compared to the first quarter of 2016. This means that
even if the gas price remains flat we would experience an improving net
realized gas price. We expect this trend to continue. The ongoing development
of major transportation additions and expansion in the Northeast will continue
to drive this constructive pricing trend.

Epsilon recently announced the successful closing of our over-subscribed Rights
Offering. The proceeds from the Rights Offering will enable us to continue
building our land position in the Anadarko Basin. We look forward to providing
more information on the acquisitions in the near future.”

Highlights for the first quarter and material subsequent events following the
end of the quarter through the date of this release include:

/T/

— Upstream EBITDA of $2.7 million and Midstream EBITDA of $2.6 million for

the quarter.

— Marcellus working interest (WI) gas production averaged 31 MMcf/d for

the first quarter of 2017. Working interest gas production as of this
release is approximately 30 MMcf/d.

— Gathered and delivered 25.8 Bcfe gross (9.0 Bcfe net to Epsilon’s

interest) during the quarter, or 287 MMcfe/d through the Auburn System
which represents approximately 80% of design throughput. Current system
throughput is averaging 220 MMcfe/d.

— Auburn Gas gathering and compression services included third party gas

of 1.3 Bcfe during the quarter or approximately 14 MMcf/d.

/T/

Financial and Operating Results

/T/

Three months ended
March 31,
2017 2016
———————-
———————-
Revenue By Product – Total Period ($000)

Nat’l gas revenue ($000) $ 5,892 $ 3,189
Volume (MMcfe) 2,410 2,762
Avg. Price ($/Mcfe) $ 2.44 $ 1.15
Exit Rate (MMcfepd) 30.0 38.1

Oil revenue ($000) $ – $ –
Volume (MBO) – –
Avg. Price ($/Bbl) $ – $ –

Midstream gathering system revenue ($000) $ 2,175 $ 2,427
———————-
Total $ 8,067 $ 5,616
———————-
———————-

/T/

Capital Expenditures

Epsilon’s total capital expenditures were $0.1 million for the three months
ended March 31, 2017. The majority of the capital was allocated to the ongoing
build-out and maintenance of the Auburn Gas Gathering system.

Epsilon’s 2017 capital forecast for the Marcellus remains unchanged at $1
million for 2017. In regards to Epsilon’s strategic entry into the Anadarko
Basin, the due diligence process for the first acquisition is ongoing and the
transaction is still anticipated to close in the second quarter. Additional
announcements, including an updated capital budget, will be provided following
the completion of the transaction.

Marcellus Operational Guidance

The Operator did not drill or propose any new wells during the quarter. The
table below details Epsilon’s Marcellus well development status at March 31,
2017:

/T/

—————————————————————————-

Dec. 31, 2016 March 31, 2017
Gross Net Gross Net

Producing 91 24.09 86 22.57
Shut-in – – 5 1.52
Waiting on pipeline – – – –
Waiting on completion 9 0.14 9 0.14
Drilling – –
—————————————————————————-

/T/

Four wells were shut-in at quarter end due to ongoing maintenance operations,
and one well was shut-in due to preparation for an adjacent completion
operation.

Epsilon has not received any well proposals from the Operator subsequent to
quarter end.

First Quarter Results

Epsilon generated revenues of $8.1 million for the three months ended March 31,
2017 compared to $5.6 million for the three months ended March 31, 2016. The
Company’s Upstream Marcellus net revenue interest production was 2.4 Bcfe in
the first quarter.

Realized natural gas prices averaged $2.44 per Mcf in the first quarter of
2017. Realized natural gas prices in Northeast Pennsylvania are rising in
response to decelerating production growth coupled with increasing
transportation capacity. Operating expenses for Marcellus Upstream operations
in the first quarter were $1.4 million.

The Auburn Gas Gathering system delivered 25.8 Bcfe of natural gas during the
quarter as compared to 22.7 Bcfe during the fourth quarter of 2016. Primary
gathering volumes decreased 11.1% quarter over quarter to 12.0 Bcfe primarily
as a result of rotating well shut-ins for maintenance operations inside the
Auburn system boundary. Imported cross-flow volumes increased 59.0% to 13.9
Bcfe.

Epsilon reported net after tax income of $0.3 million attributable to common
shareholders or $0.01 per basic and diluted common share outstanding for the
three months ended March 31, 2017, compared to a net loss of $1.3 million, and
($0.03) per basic and diluted common share outstanding for the three months
ended March 31, 2016.

For the three months ended March 31, 2017, Epsilon’s Adjusted Earnings Before
Interest, Income Taxes, Depreciation, Amortization (“Adjusted EBITDA”) was $5.3
million as compared to $2.8 million for the three months ended March 31, 2016.
The increase in Adjusted EBITDA was primarily due to higher natural gas prices.

Adjusted EBITDA

Epsilon defines Adjusted EBITDA as earnings before (1) net interest expense,
(2) depreciation, depletion and amortization expense, (3) recovery of prior
impairments of oil and gas properties, (4) non-cash stock compensation expense,
(5) unrealized gain on derivatives and (6) other income. Adjusted EBITDA is not
a measure of net income or cash flows as determined by IFRS.

Management believes these non-IFRS financial measures facilitate evaluation of
the Company’s business on a “normalized” or recurring basis and without giving
effect to certain non-cash expenses and other items, thereby providing
management, investors and analysts with comparative information for evaluating
the Company in relation to other oil and gas companies providing corresponding
non-IFRS financial measures. These non-IFRS financial measures should be
considered in addition to, but not as a substitute for, measures for financial
performance prepared in accordance with IFRS, and that the reconciliations to
the closest corresponding IFRS measure should be reviewed carefully.

About Epsilon

Epsilon Energy Ltd. is a North American onshore natural gas production and
midstream company with a current focus on the Marcellus Shale of Pennsylvania.

Forward-Looking Statements

Certain statements contained in this news release constitute forward looking
statements. The use of any of the words “anticipate”, “continue”, “estimate”,
“expect”, ‘may”, “will”, “project”, “should”, ‘believe”, and similar
expressions are intended to identify forward-looking statements. These
statements involve known and unknown risks, uncertainties and other factors
that may cause actual results or events to differ materially from those
anticipated. Forward-looking statements are based on reasonable assumptions,
but no assurance can be given that these expectations will prove to be correct
and the forward-looking statements included in this news release should not be
unduly relied upon.

The reserves and associated future net revenue information set forth in this
news release are estimates only. In general, estimates of oil and natural gas
reserves and the future net revenue therefrom are based upon a number of
variable factors and assumptions, such as production rates, ultimate reserves
recovery, timing and amount of capital expenditures, ability to transport
production, marketability of oil and natural gas, royalty rates, the assumed
effects of regulation by governmental agencies and future operating costs, all
of which may vary materially from actual results. For those reasons, estimates
of the oil and natural gas reserves attributable to any particular group of
properties, as well as the classification of such reserves and estimates of
future net revenues associated with such reserves prepared by different
engineers (or by the same engineers at different times) may vary. The actual
reserves of the Company may be greater or less than those calculated. In
addition, the Company’s actual production, revenues, development and operating
expenditures will vary from estimates thereof and such variations could be
material.

Statements relating to “reserves” are deemed to be forward-looking statements
as they involve the implied assessment, based on certain estimates and
assumptions, that the reserves described exist in the quantities predicted or
estimated and can be profitably produced in the future. There is no assurance
that forecast price and cost assumptions will be attained and variances could
be material.

Proved reserves are those reserves which are most certain to be recovered.
There is at least a 90% probability that the quantities actually recovered will
equal or exceed the estimated proved reserves. Undeveloped reserves are those
reserves expected to be recovered from known accumulations where a significant
expenditure (for example, when compared to the cost of drilling a well) is
required to render them capable of production. They must fully meet the
requirements of the reserves classification (proved, probable) to which they
are assigned. Proved undeveloped reserves are those reserves that can be
estimated with a high degree of certainty and are expected to be recovered from
known accumulations where a significant expenditure is required to render them
capable of production.

The estimates of reserves and future net revenue for individual properties may
not reflect the same confidence level as estimates of reserves and future net
revenue for all properties due to the effects of aggregation. The estimated
future net revenues contained in this news release do not necessarily represent
the fair market value of the Company’s reserves.

Special note for news distribution in the United States

The securities described in the news release have not been registered under the
United Stated Securities Act of 1933, as amended, (the “1933 Act”) or state
securities laws. Any holder of these securities, by purchasing such securities,
agrees for the benefit of Epsilon Energy Ltd. (the “Corporation”) that such
securities may not be offered, sold, or otherwise transferred only (A) to the
Corporation or its affiliates; (B) outside the United States in accordance with
applicable state laws and either (1) Rule 144(as) under the 1933 Act or (2)
Rule 144 under the 1933 Act, if applicable.

/T/

EPSILON ENERGY LTD.
Interim Unaudited Condensed Consolidated Statements of Operations
(All amounts stated in US$)

Three months ended March 31,
2017 2016
—————————–
—————————–

Revenues:

Oil and gas revenue $ 5,892,398 $ 3,188,779
Gas gathering and compression revenue 2,174,902 2,427,153
—————————–
Total revenue 8,067,300 5,615,932
—————————–

Operating costs and expenses:

Project operating costs 2,063,410 2,297,876
Depletion, depreciation, amortization and
decommissioning accretion 2,403,467 3,058,139
Stock based compensation expense 53,281 72,973
General and administrative 925,808 473,334
—————————–
Total operating costs and expenses 5,445,966 5,902,322
—————————–
Operating income (loss) 2,621,334 (286,390)
—————————–

Other income and (expense):

Interest income 25,423 1
Finance expense (994,707) (950,716)
Realized loss on commodity contracts 247,160 –
Net change in unrealized loss on commodity
contracts (757,510) –
Other expense (44) (96,879)
—————————–
Net other expense (1,479,678) (1,047,594)
—————————–

Income tax expense – current – 23,800
Income tax expense (recovery) – deferred 865,509 (72,400)
—————————–
NET INCOME (LOSS) $ 276,147 $ (1,285,384)
—————————–
—————————–

Net income (loss) per share, basic $ 0.01 $ (0.03)
Net income (loss) per share, diluted $ 0.01 $ (0.03)
Weighted average number of shares outstanding,
basic 45,837,974 46,015,497
Weighted average number of shares outstanding,
diluted 45,885,542 46,015,497

EPSILON ENERGY LTD.
Interim Unaudited Condensed Consolidated Statements of Financial Position
(All amounts stated in US$)

March 31, December 31,
2017 2016
—————————–
—————————–
ASSETS
Current assets
Cash and cash equivalents $ 3,090,618 $ 31,486,593
Accounts receivable 3,176,471 4,387,487
Deposits on Acquisition 400,000 –
Restricted cash 530,871 530,538
Other current assets 92,170 139,991
—————————–
Total current assets 7,290,130 36,544,609
—————————–
Non-current assets
Oil and gas interests:
Property and equipment (net) 88,388,752 90,716,131
—————————–
Total non-current assets 88,388,752 90,716,131
—————————–
Total assets $ 95,678,882 $ 127,260,740
—————————–
—————————–

EQUITY AND LIABILITIES
Current liabilities

Accounts payable and accrued liabilities $ 4,477,374 $ 5,003,737
Commodity contracts-asset 1,093,862 336,352
Revolving line of credit 7,800,000 12,460,000
Convertible debentures – 28,388,210
—————————–
Total current liabilities 13,371,236 46,188,299
—————————–
Non-current liabilities
Decommissioning liabilities 2,455,683 2,442,935
Deferred tax liability 15,942,574 15,077,065
—————————–
Total non-current liabilities 18,398,257 17,520,000
—————————–
Total liabilities 31,769,493 63,708,299
—————————–
—————————–
Equity
Share capital 126,316,217 126,315,325
Equity component of convertible debentures – 5,033,884
Contributed surplus 11,105,006 6,017,972
Deficit (82,279,916) (82,556,063)
Accumulated other comprehensive income 8,768,082 8,741,323
—————————–
Total equity 63,909,389 63,552,441
—————————–
Total liabilities and shareholders’ equity $ 95,678,882 $ 127,260,740
—————————–
—————————–

EPSILON ENERGY LTD.
Interim Unaudited Condensed Consolidated Statements of Cash Flows
(All amounts stated in US$)

Three months ended March
31,
Notes 2017 2016
—————————-

Cash flows from operating activities:
Net income (loss) $ 276,147 $ (1,285,384)
Adjustments for:
Depletion, depreciation, amortization
and decommissioning accretion 4 2,403,467 3,058,139
Debenture accretion and fee
amortization 3 267,773 278,895
Net change in unrealized loss on
commodity contracts 9 757,510 –
Stock-based compensation expense 53,281 72,973
Income tax expense (recovery) 865,509 (72,400)
Income taxes paid – –
Changes in non-cash balances related to
operations 11 728,006 18,390
—————————-
Net cash provided by operating activities 5,351,693 2,070,613
—————————-
—————————-
Cash flows from investing activities:
Additions to oil and natural gas
properties – PP&E 4 (63,340) (274,947)
Change in working capital related to
capital asset additions 11 4,468 17,242
Change in investment – (11,314,286)
Deposits on acquisitions (400,000)
Changes in restricted cash (333) –
—————————-
Net cash used in investing activities (459,205) (11,571,991)
—————————-
Cash flows from financing activities:
Buyback of common shares – (780,340)
Purchase of convertible debenture – (357,842)
Redemption of convertible debentures (29,520,436) –
Proceeds from (payoff of) draw on
revolving line of credit 5 (4,660,000) 10,460,000
—————————-
Net cash used in financing activities (34,180,436) 9,321,818
—————————-
Effect of currency rates on cash and cash
equivalents 891,973 1,020,513
—————————-
Increase (decrease) in cash and cash
equivalents (28,395,975) 840,953
Cash and cash equivalents, beginning of
period 31,486,593 16,954,664
—————————-
Cash and cash equivalents, end of period $ 3,090,618 $ 17,795,617
—————————-
—————————-

Cash and cash equivalents consist of:
Cash $ 3,090,618 $ 17,795,617
—————————-
Cash and cash equivalents $ 3,090,618 $ 17,795,617
—————————-
—————————-

EPSILON ENERGY LTD.
Adjusted EBITDA Reconciliation
(All amounts stated in US $000)

Three months ended
March 31,
(in thousands of dollars) 2017 2016
——————–
——————–

Net loss $ 276 $ (1,285)
Add Back:
Net interest expense 969 951
Deferred income tax provision 866 (49)
Depreciation, depletion, amortization, and accretion 2,404 3,058
Stock based compensation expense 53 73
Net change in unrealized (gain) loss on commodity
contracts 757 –
Other income – 92
——————–
Adjusted EBITDA $ 5,325 $ 2,840
——————–
——————–

/T/

– END RELEASE – 12/05/2017

For further information:
Epsilon Energy Ltd.
Michael Raleigh
Chief Executive Officer
281-670-0002
[email protected]

COMPANY:
FOR: EPSILON ENERGY LTD.
TSX SYMBOL: EPS

INDUSTRY: Energy and Utilities – Oil and Gas
RELEASE ID: 20170512CC0082

Press Release from Marketwired 1-866-736-3779

All press releases are written by the client and have NO affiliation with the news copy written by The Canadian Press. Any questions that arise due to the content or information provided in the press release should be directed to the company/organization
issuing the release, not to The Canadian Press.

GET ENERGYNOW’S DAILY EMAIL FOR FREE


LOGiQ Asset Management Ltd.: Fund Name Changes for Aston Hill Mutual Funds, Aston Hill Closed-End Funds and Aston Hill Investment Trusts

FOR: LOGIQ ASSET MANAGEMENT LTD.

Date issue: May 12, 2017
Time in: 4:06 PM e

Attention:

TORONTO, ONTARIO–(Marketwired – May 12, 2017) –

THIS PRESS RELEASE IS NOT FOR DISTRIBUTION IN THE UNITED STATES OR OVER U.S.
WIRE SERVICES

LOGiQ Asset Management Ltd. (the “Manager”) announces name changes for each of
the following mutual funds, closed-end funds and investment trusts (the
“Funds”) as set out below:

/T/

—————————————————————————-
ASTON HILL MUTUAL FUNDS
—————————————————————————-
Previous Name of Fund New Name of Fund
—————————————————————————-
Aston Hill U.S. Conservative Growth Fund LOGiQ U.S. Conservative Growth
Fund
—————————————————————————-
Aston Hill Total Return Fund LOGiQ Total Return Fund
—————————————————————————-
Aston Hill Global Resource Fund LOGiQ Global Resource Fund
—————————————————————————-
Aston Hill Strategic Yield Fund LOGiQ Strategic Yield Fund
—————————————————————————-
Aston Hill Millennium Fund LOGiQ Millennium Fund
—————————————————————————-
Aston Hill High Income Fund LOGiQ High Income Fund
—————————————————————————-
Aston Hill High Income Class LOGiQ High Income Class
—————————————————————————-
Aston Hill Strategic Yield Class LOGiQ Strategic Yield Class
—————————————————————————-
Aston Hill Total Return Class LOGiQ Total Return Class
—————————————————————————-

—————————————————————————-
ASTON HILL CLOSED-END FUNDS
—————————————————————————-
Previous Name of Fund New Name of Fund
—————————————————————————-
Aston Hill Advantage Bond Fund LOGiQ Advantage Bond Fund
—————————————————————————-
Aston Hill Advantage Oil & Gas Income LOGiQ Advantage Oil & Gas Income
Fund Fund
—————————————————————————-
Aston Hill VIP Income Fund LOGiQ VIP Income Fund
—————————————————————————-
Aston Hill Advantage VIP Income Fund LOGiQ Advantage VIP Income Fund
—————————————————————————-

—————————————————————————-
ASTON HILL INVESTMENT TRUSTS
—————————————————————————-
Previous Name of Fund New Name of Fund
—————————————————————————-
Aston Hill AVIP Trust LOGiQ AVIP Trust
—————————————————————————-
Aston Hill MBB Trust LOGiQ MBB Trust
—————————————————————————-
Aston Hill O&G Trust LOGiQ O&G Trust
—————————————————————————-

/T/

The names of the Funds were changed to better reflect the “LOGiQ” brand. There
will be no changes to the investment objectives, investment strategies or
manager of the Funds in connection with the name changes.

– END RELEASE – 12/05/2017

For further information:
LOGiQ Asset Management Ltd.
Client Services
1-844-416-1093
www.logiqasset.com

COMPANY:
FOR: LOGIQ ASSET MANAGEMENT LTD.

INDUSTRY: Financial Services – Investment Opinion, Financial
Services – Investment Services and Trading, Financial Services –
Personal Finance
RELEASE ID: 20170512CC0074

Press Release from Marketwired 1-866-736-3779

All press releases are written by the client and have NO affiliation with the news copy written by The Canadian Press. Any questions that arise due to the content or information provided in the press release should be directed to the company/organization
issuing the release, not to The Canadian Press.

GET ENERGYNOW’S DAILY EMAIL FOR FREE


ShaMaran Q1 2017 Financial and Operating Results

FOR: SHAMARAN PETROLEUM CORP.
TSX VENTURE SYMBOL: SNM
OMX SYMBOL: SNM

Date issue: May 12, 2017
Time in: 4:00 PM e

Attention:

VANCOUVER, BRITISH COLUMBIA–(Marketwired – May 12, 2017) – ShaMaran Petroleum
Corp. (“ShaMaran” or the “Company”) (TSX VENTURE:SNM)(OMX:SNM) is pleased to
announce its financial and operating results for three months ended March 31,
2017. Unless otherwise stated all currency amounts indicated as “$” in this
news release are expressed in thousands of United States dollars.

Chris Bruijnzeels, President and CEO of ShaMaran, commented, “I am extremely
pleased that we expect to be producing before the end of June 2017. The Atrush
field holds significant resources and the onset of production will allow us to
move forward to realise full value from this asset.”

HIGHLIGHTS AND DEVELOPMENTS

Operations

/T/

— The 30,000 bopd Atrush Phase 1 Production Facility (“Production

Facility”), the pipeline between the Production Facility and the block
boundary (the “Spur Pipeline”), the pump station, the intermediate
pigging and pressure reduction station (“IPPR”) and four production
wells are all ready for first oil.
— The final 35km section of pipeline which will run from the Atrush Block
boundary to the tie-in point on the main export pipeline (the “Feeder
Pipeline”) is nearing completion. It is expected that the Feeder
Pipeline will completed and first oil exports will commence by the end
of June 2017.

/T/

Corporate

/T/

— In January 2017 the Company completed the issue of 360 million common

shares of ShaMaran on a private placement basis at a price per share of
CAD 0.10 (equal to SEK 0.67) which resulted in gross proceeds to the
Company of $27.3 million ($26.4 million net of transaction related
costs).
— In February 2017 the Company reported on a property gross basis
estimates as at December 31, 2016 of 85.1 MMbbl of Total Field Proven
plus Probable (“2P”) Reserves and 389 MMboe Total Field Unrisked Best
Estimate Discovered Recoverable Resources (“2P + 2C”) (1) (2). Reserves
and resources are unchanged from the 2015 year end estimates.

/T/

OUTLOOK

Operations

/T/

— First oil is expected by the end of June 2017.
— 2017 plans include conducting extended testing of the CK-6 well which is

located on the eastern side of the Atrush Block and which is not one of
the four initial production wells. This would involve the installation
of temporary production facilities near the Chamanke-C well pad and the
delivery by truck of oil to the main Phase I Production Facilities.
— Work on the final pipeline facilities, to allow for other future users,
will continue after first oil.
— It is planned in 2017 to drill and test CK-7, an appraisal and
development well located in the central area of the Atrush Block, and to
commence drilling CK-9, a dedicated water disposal well.

/T/

Corporate

/T/

— Semi-annual coupon interest on the Senior Bonds and Super Senior Bonds

issued by General Exploration Partners Inc., a wholly owned subsidiary
of the Company, which amounts to $9.6 million in total and is due on May
13, 2017, will be paid in kind in accordance with the terms of the bond
agreements by issuing new bonds (“PIK Bonds”).

/T/

(1) “MMbbl” means million barrels and “MMboe” means million barrels of oil
equivalents. Boe may be misleading, particularly if used in isolation. A boe
conversion ratio of 6 million cubic feet (“Mcf”) per one barrel is based on an
energy equivalency conversion method primarily applicable at the burner tip and
does not represent a value equivalency at the wellhead.

(2) This estimate of remaining recoverable resources (unrisked) includes
contingent resources that have not been adjusted for risk based on the chance
of development. It is not an estimate of volumes that may be recovered.

FINANCIAL AND OPERATING RESULTS FOR THE THREE MONTHS ENDED MARCH 31, 2017

During the reporting period the Company continued with the first phase of the
development program in respect of the Atrush petroleum property located in the
Kurdistan Region of Iraq. Atrush currently generates no revenues.

Financial Results

The Company reports a net loss of $2.3 million for the three months ended March
31, 2017 which was primarily driven by routine general and administrative
expenses and finance cost, the substantial portion of which was expensed
borrowing costs on the Company’s bonds. These charges have been offset by
interest income on Atrush cost loans and interest on cash held in short term
deposits.

Condensed Interim Statement of Comprehensive Income
(Unaudited, expressed in thousands of United States Dollars)

/T/

For the three months ended
March 31,
2017 2016
—————————————————————————-
Expenses
Depreciation and amortisation expense (10) (11)
Share based payments expense (11) (76)
General and administrative expense (1,090) (1,302)
—————————————————————————-
Loss before finance items and income tax
expense (1,111) (1,389)
—————————————————————————-

Finance income 352 21
Finance cost (1,503) (1,402)
—————————————————————————-
Net finance cost (1,151) (1,381)
—————————————————————————-
Loss before income tax expense (2,262) (2,770)
Income tax expense (21) (26)
—————————————————————————-
Loss for the period (2,283) (2,796)
—————————————————————————-
—————————————————————————-

Other comprehensive income
Items that may be reclassified to profit or
loss:Currency translation differences 16 32
—————————————————————————-
Total other comprehensive income 16 32
—————————————————————————-

Total comprehensive loss for the period (2,267) (2,764)
—————————————————————————-
—————————————————————————-

/T/

Condensed Interim Consolidated Balance Sheet
(Unaudited, expressed in thousands of United States Dollars)

/T/

At March 31, At December 31,
2017 2016
—————————————————————————-
Assets
Non-current assets
Property, plant and equipment 182,504 174,658
Intangible assets 89,202 89,007
Loans and receivables 47,614 46,114
—————————————————————————-
319,320 309,779
—————————————————————————-
Current assets
Cash and cash equivalents 22,006 4,416
Loans and receivables 10,405 7,252
Other current assets 268 224
—————————————————————————-
32,679 11,892
—————————————————————————-
Total assets 351,999 321,671
—————————————————————————-
—————————————————————————-

Liabilities and equity
Current liabilities
Accrued interest expense on bonds 7,349 2,503
Accounts payable and accrued
expenses 6,547 6,434
—————————————————————————-
13,896 8,937
—————————————————————————-
Non-current liabilities
Borrowings 165,339 165,129
Provisions 9,898 8,869
Pension liability 1,697 1,670
—————————————————————————-
176,934 175,668
—————————————————————————-
Total liabilities 190,830 184,605
—————————————————————————-
Equity
Share capital 637,538 611,179
Share based payments reserve 6,495 6,484
Cumulative translation adjustment (45) (61)
Accumulated deficit (482,819) (480,536)
—————————————————————————-
Total equity 161,169 137,066
—————————————————————————-
Total liabilities and equity 351,999 321,671
—————————————————————————-
—————————————————————————-

/T/

Total assets increased during the first quarter of 2017 by $30.3 million as a
result of increases in share capital and equity reserves by $26.4 million,
accrued bond interest by $4.9 million and other non-current liabilities by $1.3
million which were offset by an increase in the accumulated deficit by $2.3
million, principally due to the net loss recorded in the period.

Property, plant & equipment assets increased during the first three months of
2017 by $7.8 million which was due to addition of $4.3 million in Atrush
development costs and $3.5 million in capitalised borrowing. The increase in
intangible assets by $0.2 million during 2016 resulted principally from
capitalised borrowing costs. Loans and receivables increased by $4.7 million
from funding $3.2 million of Feeder Pipeline costs, from funding $1.2 million
of the KRG’s share of development costs and from accruing $0.3 million in
interest on the outstanding loan balances.

Condensed Interim Consolidated Cash Flow Statement
(Unaudited, expressed in thousands of United States Dollars)

/T/

For the three months ended
March 31,
2017 2016
—————————————————————————-
Operating activities
Loss for the period (2,283) (2,796)
Adjustments for:
Interest expense on borrowings – net 1,466 1,335
Foreign exchange loss 47 41
Share based payments expense 11 76
Depreciation and amortisation expense 10 11
Unwinding discount on decommissioning
provision (10) 26
Interest income (352) (21)
Changes in accounts payable and accrued
expenses 113 2,396
Changes in current tax liabilities – (15)
Changes in other current assets (44) (22)
—————————————————————————-
Net cash (outflows to) / inflows from
operating activities (1,042) 1,031
—————————————————————————-

Investing activities
Interest received on cash deposits 26 21
Purchases of intangible assets (30) (361)
Purchase of property, plant and equipment (3,391) (8,365)
Loans and receivables – advances to joint
venture partner (4,327) –
—————————————————————————-
Net cash outflows to investing activities (7,722) (8,705)
—————————————————————————-

Financing activities
Shares issued on private placement 27,281 –
Transaction costs on private placement (922) –
—————————————————————————-
Net cash inflows from financing activities 26,359 –
—————————————————————————-

Effect of exchange rate changes on cash and
cash equivalents (5) (11)
—————————————————————————-

Change in cash and cash equivalents 17,590 (7,685)
Cash and cash equivalents, beginning of the
period 4,416 31,921
—————————————————————————-
Cash and cash equivalents, end of the period 22,006 24,236
—————————————————————————-
—————————————————————————-

/T/

The increase by $17.6 million in the cash position of the Company during the
first quarter of 2017 was due to cash inflows of $26.4 million in net proceeds
from the sale of the Company’s shares in a private placement completed in
January 2017 which were offset by spending of $3.4 million on Atrush
development activities, $4.3 million of financing provided to a joint venture
partner and $1.1 million of cash out on G&A and other cash expenses.

ANNUAL GENERAL MEETING

The Company also announces that the Annual General Meeting of Shareholders will
be held on Wednesday, June 15, 2017, at 8:00 a.m. (Vancouver time) at Suite
2000, 885 West Georgia Street, Vancouver, British Columbia, V6C 3E8.

OTHER

This information in this release is subject to the disclosure requirements of
ShaMaran Petroleum Corp. under the EU Market Abuse Regulation and the Swedish
Securities Market Act. This information was publicly communicated on May 12,
2017 at 4:00 p.m. Toronto Time.

ABOUT SHAMARAN

ShaMaran Petroleum Corp. is a Kurdistan focused oil development and exploration
company with a 20.1% direct interest in the Atrush oil discovery. The Atrush
Block is currently undergoing an appraisal and development campaign.

ShaMaran is a Canadian oil and gas company listed on the TSX Venture Exchange
and the NASDAQ First North Exchange (Stockholm) under the symbol “SNM”. Neither
the TSX Venture Exchange nor its Regulation Services Provider (as that term is
defined in the policies of the TSX Venture Exchange) accepts responsibility for
the adequacy or accuracy of this release. Pareto Securities AB is the Company’s
Certified Advisor on NASDAQ First North.

The Company’s condensed interim consolidated financial statements, notes to the
financial statements and management’s discussion and analysis have been filed
on SEDAR (www.sedar.com) and are also available on the Company’s website
(www.shamaranpetroleum.com).

FORWARD-LOOKING STATEMENTS

This news release contains statements and information about expected or
anticipated future events and financial results that are forward-looking in
nature and, as a result, are subject to certain risks and uncertainties, such
as legal and political risk, civil unrest, general economic, market and
business conditions, the regulatory process and actions, technical issues, new
legislation, competitive and general economic factors and conditions, the
uncertainties resulting from potential delays or changes in plans, the
occurrence of unexpected events and management’s capacity to execute and
implement its future plans. Any statements that are contained in this news
release that are not statements of historical fact may be deemed to be
forward-looking information. Forward-looking information typically contains
statements with words such as “may”, “will”, “should”, “expect”, “intend”,
“plan”, “anticipate”, “believe”, “estimate”, “projects”, “potential”,
“scheduled”, “forecast”, “outlook”, “budget” or the negative of those terms or
similar words suggesting future outcomes. The Company cautions readers
regarding the reliance placed by them on forward-looking information as by its
nature, it is based on current expectations regarding future events that
involve a number of assumptions, inherent risks and uncertainties, which could
cause actual results to differ materially from those anticipated by the
Company.

Actual results may differ materially from those projected by management.
Further, any forward-looking information is made only as of a certain date and
the Company undertakes no obligation to update any forward-looking information
or statements to reflect events or circumstances after the date on which such
statement is made or reflect the occurrence of unanticipated events, except as
may be required by applicable securities laws. New factors emerge from time to
time, and it is not possible for management of the Company to predict all of
these factors and to assess in advance the impact of each such factor on the
Company’s business or the extent to which any factor, or combination of
factors, may cause actual results to differ materially from those contained in
any forward-looking information.

Reserves and resources: ShaMaran Petroleum Corp.’s reserve and contingent
resource estimates are as at December 31, 2016, and have been prepared and
audited in accordance with National Instrument 51-101 Standards of Disclosure
for Oil and Gas Activities (“NI 51-101”) and the Canadian Oil and Gas
Evaluation Handbook (“COGE Handbook”). Unless otherwise stated, all reserves
estimates contained herein are the aggregate of “proved reserves” and “probable
reserves”, together also known as “2P reserves”. Possible reserves are those
additional reserves that are less certain to be recovered than probable
reserves. There is a 10% probability that the quantities actually recovered
will equal or exceed the sum of proved plus probable plus possible reserves.

Contingent resources: Contingent resources are those quantities of petroleum
estimated, as of a given date, to be potentially recoverable from known
accumulations using established technology or technology under development, but
are not currently considered to be commercially recoverable due to one or more
contingencies. Contingencies may include factors such as economic, legal,
environmental, political and regulatory matters or a lack of markets. There is
no certainty that it will be commercially viable for the Company to produce any
portion of the contingent resources.

BOEs: BOEs may be misleading, particularly if used in isolation. A BOE
conversion ratio of 6 Mcf per 1 Bbl is based on an energy equivalency
conversion method primarily applicable at the burner tip and does not represent
a value equivalency at the wellhead.

– END RELEASE – 12/05/2017

For further information:
Chris Bruijnzeels
President and CEO
ShaMaran Petroleum Corp.
+41 22 560 8605
[email protected]
OR
Sophia Shane
Corporate Development
ShaMaran Petroleum Corp.
+1 604 689 7842
[email protected]
www.shamaranpetroleum.com
OR
Robert Eriksson
Investor Relations, Sweden
ShaMaran Petroleum Corp.
+46 701 112615
[email protected]

COMPANY:
FOR: SHAMARAN PETROLEUM CORP.
TSX VENTURE SYMBOL: SNM
OMX SYMBOL: SNM

INDUSTRY: Energy and Utilities – Oil and Gas
RELEASE ID: 20170512CC0070

Press Release from Marketwired 1-866-736-3779

All press releases are written by the client and have NO affiliation with the news copy written by The Canadian Press. Any questions that arise due to the content or information provided in the press release should be directed to the company/organization
issuing the release, not to The Canadian Press.

GET ENERGYNOW’S DAILY EMAIL FOR FREE


Repsol Oil & Gas Canada Inc. Files Financial Statements

FOR: REPSOL OIL & GAS CANADA INC.

Date issue: May 12, 2017
Time in: 3:05 PM e

Attention:

CALGARY, ALBERTA–(Marketwired – May 12, 2017) – Repsol Oil & Gas Canada Inc.
(the “Company”) has filed its interim financial statements and related
management’s discussion and analysis for the first quarter of 2017.

The Company has also filed restated financial statements and related
management’s discussion and analysis for the year ended December 31, 2016 to
adjust the accounting for a transaction with an affiliate in the Repsol Group.
This transaction involved the sale by one of the Company’s subsidiaries of a
non-controlling interest in another subsidiary to an affiliate of the Company
which occurred in late 2016. The accounting adjustments resulted in a reduction
in the Company’s net loss for the year ended December 31, 2016 by $228 million.
The adjustments do not impact the Company’s reported cash flows. The
restatement is solely as a result of a review of the particular transaction and
the changes needed to properly account for it.

The Company’s above-mentioned restatement does not have any impact on the
consolidated financial disclosures of Repsol, S.A.

About Repsol Oil & Gas Canada Inc.

Repsol Oil & Gas Canada Inc. is an upstream oil and gas company incorporated in
Canada and is a wholly-owned subsidiary of the Spanish integrated energy
company Repsol, S.A.

– END RELEASE – 12/05/2017

For further information:
Mila Vior
External Affairs and Communications, North America
Phone: 403-922-0679
Email: [email protected]

COMPANY:
FOR: REPSOL OIL & GAS CANADA INC.

INDUSTRY: Energy and Utilities – Oil and Gas
RELEASE ID: 20170512CC0062

Press Release from Marketwired 1-866-736-3779

All press releases are written by the client and have NO affiliation with the news copy written by The Canadian Press. Any questions that arise due to the content or information provided in the press release should be directed to the company/organization
issuing the release, not to The Canadian Press.

GET ENERGYNOW’S DAILY EMAIL FOR FREE


Eagle Energy Inc. Provides Update to Shareholders on Growth Strategy and Announces First Quarter 2017 Results

FOR: EAGLE ENERGY INC.TSX SYMBOL: EGLDate issue: May 12, 2017Time in: 12:07 PM eAttention:
CALGARY, ALBERTA–(Marketwired – May 12, 2017) – Eagle Energy Inc. (“Eagle”)
(TSX:EGL) is pleased to update shareholders and report its results for the
first qu…

GET ENERGYNOW’S DAILY EMAIL FOR FREE


Cardinal Energy Ltd. Report on Voting From the 2017 Shareholders Meeting

FOR: CARDINAL ENERGY LTD.TSX SYMBOL: CJDate issue: May 12, 2017Time in: 10:16 AM eAttention:
CALGARY, ALBERTA–(Marketwired – May 12, 2017) – Cardinal Energy Ltd.
(“Cardinal” or the “Company”) (TSX:CJ) announces that all matters presented for
approval…

GET ENERGYNOW’S DAILY EMAIL FOR FREE


Enterprise Group Announces Results for the First Quarter of 2017

FOR: ENTERPRISE GROUP, INC.
TSX SYMBOL: E

Date issue: May 12, 2017
Time in: 9:00 AM e

Attention:

ST. ALBERT, ALBERTA–(Marketwired – May 12, 2017) – Enterprise Group, Inc.
(“Enterprise,” or “the Company”) (TSX:E), a consolidator of services to the
energy sector, focused primarily on construction services and specialized
equipment rental, today released its Q1 2017 results.

/T/

—————————————————————————-

Three months ended
Three months ended March 31, 2016
Consolidated: March 31, 2017 restated(2)(3) Change
—————————————————————————-
Revenue $8,878,049 $8,852,177 $25,872
Gross margin $2,722,318 $2,900,611 ($178,293)
Gross margin % 31% 33% (2%)
EBITDA(1) $1,765,100 $2,021,285 ($256,185)
Loss before tax ($66,628) ($1,529,425) $1,462,797
Net (loss) income ($50,627) ($1,426,622) $1,375,995
EPS $0.00 ($0.03) $0.03
—————————————————————————-
(1) Identified and defined under “Non-IFRS Measures”.
(2) In July 2016, the Company closed a transaction to divest substantially
all the assets of TCB. The net operations of TCB, including the prior
period, are presented as a single amount in the consolidated statements of
loss and comprehensive loss.
(3) In December 2016, the Company decided to cease all operations relating
to single pass tunneling. The net operations of this line of business,
including the prior period, are presented as a single amount in the
consolidated statements of loss and comprehensive loss.

/T/

Revenue for the three months ended March 31, 2017 of $8,878,049 is relatively
consistent with the prior period. Gross margin for the three months ended March
31, 2017 remained relatively consistent at 31% and EBITDA for the same period
decreased by $256,185 to $1,765,100. Enterprise continues to take numerous
measures to reduce the Company’s cost structure. In fact, the Company has been
able to maintain relatively stable gross margin percentage through cost
reductions, while maintaining service levels and retaining customers.

Over the last 15 months, the Company has made significant improvements to its
statement of financial position and has reduced overall total debt. At March
31, 2017, after adjusting for goodwill and deferred taxes, the Company’s net
asset value is approximately $51,000,000. Enterprise will continue to look for
opportunities to improve its financial position and opportunities that will
allow the Company to diversify, expand and increase shareholder value.

“Enterprise’s management is extremely encouraged by our latest results.
Improved customer sentiment during the first quarter of 2017 as well as
effective cost management, will ensure the efficiencies gained over the last 2
years are maintained and will allow our Company to continue to grow as the
industry recovers,” stated Leonard D. Jaroszuk, CEO, President and Chairman.

While it has been an extremely challenging period for resource companies in
Western Canada, Enterprise has demonstrated its confidence and ability to
analogously ‘weather the storm’ strongly while many competitors and clients are
either financially impaired or gone altogether.

Enterprise has turned in significant gross margin and EBITDA improvements
evidenced in the fourth quarter of 2016 and the first quarter of 2017, which is
the result of determined leadership. Management’s continued efforts to
streamline and maximize efficiencies are now firmly in place and delivering
meaningful margin ratios while still navigating a challenging landscape.

The improvements to profits and the rapid return to significant cashflow should
give investors’ and shareholders confidence for the future. Certainly, all is
still challenging in Western Canada, but today’s results show a significant
improvement in both business and the overall environment.

Enterprises’ clients include some of Canada’s largest energy producers, utility
service providers and the federal and provincial governments of Canada. The
Company employs management highly experienced in large infrastructure projects.

Given the noted limited visibility for 2017 activity and pricing levels,
Enterprise will maintain a conservative approach towards Capital Spending while
looking at fleet management and opportunistic asset dispositions. This approach
will allow management to both maintain critical financial flexibility, allow
for strategic, accretive acquisitions and continue to build compelling
shareholder value.

About Enterprise Group, Inc.

Enterprise Group, Inc. is a consolidator of construction services companies
operating in the energy, utility and transportation infrastructure industries.
The Company’s focus is primarily construction services and specialized
equipment rental. The Company’s strategy is to acquire complementary service
companies in Western Canada, consolidating capital, management, and human
resources to support continued growth. More information is available at the
Company’s website www.enterprisegrp.ca. Corporate filings can be found on
www.sedar.com.

Forward-Looking Information
Certain statements contained in this news release constitute forward-looking
information. These statements relate to future events or the Company’s future
performance. The use of any of the words “could”, “expect”, “believe”, “will”,
“projected”, “estimated” and similar expressions and statements relating to
matters that are not historical facts are intended to identify forward-looking
information and are based on the Company’s current belief or assumptions as to
the outcome and timing of such future events. Actual future results may differ
materially. The Company’s Annual Information Form and other documents filed
with securities regulatory authorities (accessible through the SEDAR website
www.sedar.com) describe the risks, material assumptions and other factors that
could influence actual results and which are incorporated herein by reference.
The Company disclaims any intention or obligation to publicly update or revise
any forward-looking information, whether as a result of new information, future
events or otherwise, except as may be expressly required by applicable
securities laws.

Non-IFRS Measures
The Company uses International Financial Reporting Standards (“IFRS”). EBITDAS
is not a measure that has any standardized meaning prescribed by IFRS and is
therefore referred to as a non-IFRS measure. This news release contains
references to EBITDAS. This non-IFRS measure used by the Company may not be
comparable to a similar measure used by other companies. Management believes
that in addition to net income, EBITDAS is a useful supplemental measure as it
provides an indication of the results generated by the Company’s principal
business activities prior to consideration of how those activities are financed
or how the results are taxed. EBITDAS is calculated as net income excluding
depreciation, amortization, interest, taxes and stock based compensation.

– END RELEASE – 12/05/2017

For further information:
Leonard Jaroszuk
President & CEO
780-418-4400
OR
Desmond O’Kell
Senior Vice-President
780-418-4400
[email protected]

COMPANY:
FOR: ENTERPRISE GROUP, INC.
TSX SYMBOL: E

INDUSTRY: Energy and Utilities – Oil and Gas
RELEASE ID: 20170512CC0034

Press Release from Marketwired 1-866-736-3779

All press releases are written by the client and have NO affiliation with the news copy written by The Canadian Press. Any questions that arise due to the content or information provided in the press release should be directed to the company/organization
issuing the release, not to The Canadian Press.

GET ENERGYNOW’S DAILY EMAIL FOR FREE


CORRECTION/Valener Declares Quarterly Dividends and Extends 4% Annual Common Dividend Growth Target Through 2022

FOR: VALENER INC.TSX SYMBOL: VNRTSX SYMBOL: VNR.PR.ADate issue: May 12, 2017Time in: 8:37 AM eAttention:
A dividend payment will be made in the amount of $0.271875 per Series A
preferred share on July 17, 2017, instead of July 10, 2017, as previously

GET ENERGYNOW’S DAILY EMAIL FOR FREE


Transeastern Power Trust Provides Operational Update on Renewable Energy Portfolio

FOR: TRANSEASTERN POWER TRUST
TSX VENTURE SYMBOL: TEP.UN
TSX VENTURE SYMBOL: TEP.DB

Date issue: May 12, 2017
Time in: 8:33 AM e

Attention:

TORONTO, ONTARIO–(Marketwired – May 12, 2017) – Transeastern Power Trust
(“Transeastern” or the “Trust”) (TSX VENTURE:TEP.UN)(TSX VENTURE:TEP.DB) is
pleased to report that production of its renewable energy projects for the
first quarter of 2017 was 19,570 MWh compared to 5,187 MWh in the first quarter
of 2016, an increase of 277%. The increase is the result of 13,229 MWh of
production from the Baia Wind project which was acquired by the Trust in the
third quarter of 2016, as well as operational improvements implemented at the
Trust’s hydro projects. First quarter production for 2017 was up 14% on a
like-for-like basis, compared to production of 17,132 MWh for the first quarter
of 2016, showing a material improvement in the performance of the Trust’s
renewable energy portfolio.

During the first quarter of 2017, the Trust signed third party offtake
contracts with the Romanian market leader in electric power distribution and
supply, which holds 40% of the market share for electricity distribution to end
users in Romania. The offtake contracts cover forecasted hydroelectric
production and all related tradeable green certificates earned by the Trust
until February 28, 2018.

In addition, the Trust has completed a cost rationalization exercise across its
Romanian operations that management believes will result in a reduction of
annual costs of approximately CAD$0.3 million and improved operating
performance of the Trust’s hydro projects.

J. Colter Eadie, Chief Executive Officer of Transeastern commented “The
production results from the first quarter of 2017 are in line with our
expectations for our portfolio. The addition of the Baia Wind project has acted
as a hedge against the expected first quarter seasonal lows in production by
the solar and hydro projects. Securing the offtake contracts with a European
utility for the hydroelectric generation is a huge success for the Trust. We
anticipate that the offtake contracts combined with the cost cutting measures
will have a positive impact on the cash flows generated from our hydro projects
over the remainder of the year.”

About Transeastern

The Trust, through its direct and indirect subsidiaries in Canada, the
Netherlands and Romania, has been formed to acquire interests in renewable
energy assets in Romania, other countries in Europe and abroad that can provide
stable cash flow to the Trust and a suitable risk-adjusted return on
investment. The Trust seeks to provide investors with long-term, stable
distributions, while preserving the capital value of its investment portfolio
through investment, principally in a range of operational assets, which
generate electricity from renewable energy sources, with a particular focus on
solar and hydro power. The Trust intends to qualify as a “mutual fund trust”
under the Income Tax Act (Canada) (the “Tax Act”). The Trust will not be a
“SIFT trust” (as defined in the Tax Act), provided that the Trust complies at
all times with its investment restriction which precludes the Trust from
holding any “non-portfolio property” (as defined in the Tax Act). All material
information about the Trust may be found under Transeastern’s issuer profile at
www.sedar.com.

Forward-Looking Statements Except for statements of historical fact contained
herein, the information in this press release constitutes “forward-looking
information” within the meaning of Canadian securities law. Such
forward-looking information may be identified by words such as “anticipates”,
“plans”, “proposes”, “estimates”, “intends”, “expects”, “believes”, “may” and
“will”. There can be no assurance that such statements will prove to be
accurate; actual results and future events could differ materially from such
statements. Factors that could cause actual results to differ materially
include, among others: risks related to foreign operations (including various
political, economic and other risks and uncertainties), the interpretation and
implementation of the energy law, expropriation of property rights, political
instability and bureaucracy, limited operating history, lack of profitability,
high inflation rates, failure to obtain bank financing, fluctuations in
currency exchange rates, competition from other businesses, reliance on various
factors (including local labour, importation of machinery and other key items
and business relationships), risks related to seasonality (including adverse
weather conditions, shifting weather patterns, and global warming), a shift in
energy trends and demands, a shift in energy generation in the European Union,
vulnerability to fluctuations in the world market, the lack of availability of
qualified management personnel and stock market volatility. Details of the risk
factors relating to Transeastern and its business are discussed under the
heading “Risks and Uncertainties” in Transeastern’s annual management’s
discussion & analysis dated May 3, 2017, a copy of which is available on
Transeastern’s SEDAR profile at www.sedar.com. Most of these factors are
outside the control of the Trust. Investors are cautioned not to put undue
reliance on forward-looking information. These statements speak only as of the
date of this press release. Except as otherwise required by applicable
securities statutes or regulation, Transeastern expressly disclaims any intent
or obligation to update publicly forward-looking information, whether as a
result of new information, future events or otherwise. Neither the TSX Venture
Exchange nor its regulation services provider (as that term is defined in the
policies of the TSX Venture Exchange) accepts responsibility for the adequacy
or accuracy of this release.

– END RELEASE – 12/05/2017

For further information:
Transeastern Power Trust
Ravi Sood
Chairman
+1 (647) 987-7663
[email protected]
OR
Transeastern Power Trust
J. Colter Eadie
Chief Executive Officer
+40 736 372 724
[email protected]
OR
Transeastern Power Trust
Mike Murphy
Chief Financial Officer
+1 (416) 625-5064
[email protected]

COMPANY:
FOR: TRANSEASTERN POWER TRUST
TSX VENTURE SYMBOL: TEP.UN
TSX VENTURE SYMBOL: TEP.DB

INDUSTRY: Energy and Utilities – Alternative Energy, Energy and
Utilities – Utilities, Energy and Utilities – Clean Technology
RELEASE ID: 20170512CC0025

Press Release from Marketwired 1-866-736-3779

All press releases are written by the client and have NO affiliation with the news copy written by The Canadian Press. Any questions that arise due to the content or information provided in the press release should be directed to the company/organization
issuing the release, not to The Canadian Press.

GET ENERGYNOW’S DAILY EMAIL FOR FREE


Corporate Presentation Available on Corridor Website and Shareholders Approve Resolutions at Annual Meeting

FOR: CORRIDOR RESOURCES INC.TSX SYMBOL: CDHDate issue: May 12, 2017Time in: 8:00 AM eAttention:
HALIFAX, NOVA SCOTIA–(Marketwired – May 11, 2017) – Corridor Resources Inc.
(TSX:CDH) (“Corridor”) announces that a new management presentation was made b…

GET ENERGYNOW’S DAILY EMAIL FOR FREE


Petrus Resources Announces First Quarter 2017 Financial and Operating Results

FOR: PETRUS RESOURCES LTD.
TSX SYMBOL: PRQ

Date issue: May 12, 2017
Time in: 7:34 AM e

Attention:

CALGARY, ALBERTA–(Marketwired – May 12, 2017) – Petrus Resources Ltd.
(“Petrus” or the “Company”) (TSX:PRQ) is pleased to report financial and
operating results for the first quarter of 2017. Petrus is focused on organic
growth and infrastructure control in its core area, Ferrier, Alberta. The
Company is targeting liquids rich natural gas in the Cardium formation as well
as investing in infrastructure in Ferrier to control operations and maximize
the Company’s return on investment. The Company’s Management’s Discussion and
Analysis (“MD&A”) and interim consolidated financial statements dated as at and
for the period ended March 31, 2017 are available on SEDAR (the System for
Electronic Document Analysis and Retrieval) at www.sedar.com.

HIGHLIGHTS

/T/

— Petrus generated funds flow of $11.7 million in the first quarter of

2017, a 166% increase relative to $4.4 million generated in the first
quarter of 2016. The increase is due to 6% higher production, 47% lower
operating expenses, and improved commodity prices (60% increase in AECO
and 57% increase in WTI from the first quarter of 2016). This production
growth and lower cost structure is the result of the Company’s strategic
shift to divest non-core assets in order to increase the focus on
organic development, including facility ownership and control in the
Ferrier area.

— Petrus’ first quarter funds flow of $11.7 million is 20% higher than the

$9.8 million generated in the fourth quarter of 2016. The increase is
due to 9% higher production and significantly lower interest and G&A
costs. Petrus’ interest expense has decreased due to a 61% reduction of
the Company’s second lien term loan, from $90 million at March 31, 2016
to $35 million at March 31, 2017.

— Petrus reduced its net debt 17% from the first quarter of 2016 to the

first quarter of 2017. Net debt to funds flow(2)was 2.8 times for the
first quarter of 2017 and has decreased 69% since the first quarter of
2016. The Company continues to focus on decreasing its leverage, and is
targeting debt to funds flow(2)of less than 2.3 times by the end of
2017.

— First quarter production was 9,331 boe/d in 2017 compared to 8,821 boe/d

in the first quarter of 2016. The 6% increase is attributable to the
organic drilling program at Ferrier which was funded by funds flow. The
Company has generated average quarterly production growth of 31% since
the divestiture of its Peace River area assets on July 8, 2016. The
proceeds of the Peace River asset disposition were used to reduce debt.

— In the first quarter of 2017, 8 gross (6.0 net) wells were drilled in

the Ferrier area. Of those wells, 1 gross (0.4 net) well came on
production during the first quarter. The remaining drilled but
uncompleted “DUC” wells were scheduled to be fracture stimulated and
completed subsequent to the end of the first quarter. The DUC wells are
expected to be brought on production in the second quarter, after which
time the Company’s productive capability is estimated to be greater than
11,000 boe/d.(1)

— In 2016, Petrus transformed its operating cost structure through the

divestiture of higher cost assets and the construction of a natural gas
processing plant in Ferrier. As a result, total operating expenses have
decreased 47% from $8.52 per boe in the first quarter of 2016 to $4.50
per boe in the first quarter of 2017. During the first quarter of 2017
Petrus incurred $0.79 per boe of non-routine workover expenses in its
Foothills operating area.

— In Ferrier, operating expenses per boe decreased approximately 77% in

the first quarter of 2017 compared to the same period in the prior year.
The decrease is a result of the impact of the low cost structure of the
Petrus owned and operated Ferrier gas plant, expiration of a third party
processing commitment and higher production volume from developmental
drilling.

— Petrus’ Board of Directors approved a $50 to $60 million capital budget

for 2017 (excluding acquisitions and dispositions) which provides for
the drilling of 16 gross (11.7 net) Cardium wells in the Ferrier area.
The Company’s 2017 capital program also provides for investment in
facilities. Petrus expects the processing and compression capability of
the Ferrier gas plant to double, reaching a capacity of approximately 60
mmcf/d by the fourth quarter of 2017.(1)

— During the first quarter of 2017, Petrus closed an acquisition of oil

and natural gas interests in the Ferrier area for total consideration of
$8.8 million after post-closing adjustments. Petrus acquired
approximately 40 boe/d of production as well as a 100% working interest
in a drilled and completed Cardium horizontal well which is expected to
be tied in later in 2017. In addition, Petrus acquired a 100% working
interest in approximately 3,360 net acres (5.25 net sections) of
undeveloped Cardium land in its Ferrier core area.

— Petrus utilizes financial derivative contracts to mitigate commodity

price risk. The Company’s realized gain on financial derivatives in the
first quarter of 2017 increased the Company’s corporate netback(2)by
$0.57 per boe compared to $7.84 per boe realized in the first quarter of
2016.

— On May 9, 2017 Petrus was successfully listed on the OTCQX under the

symbol “PTRUF.” The listing is expected to assist with trading of
Petrus’ shares by foreign investors.

/T/

(1) Refer to “Advisories – Forward Looking Statements” in the Management’s
Discussion & Analysis.

(2) Refer to “Non-GAAP Financial Measures” in the Management’s Discussion &
Analysis.

/T/

SELECTED FINANCIAL INFORMATION
—————————————————————————-
—————————————————————————-
OPERATIONS Three Three Three Three Three
months months months months months
ended ended ended ended ended
Mar. 31, Mar. 31, Dec. 31, Sept. 30, Jun. 30,
2017 2016 2016 2016 2016
—————————————————————————-
Average
Production
Natural gas
(mcf/d) 40,332 35,456 37,327 30,009 33,071
Oil (bbl/d) 1,542 2,218 1,452 1,419 2,200
NGLs (bbl/d) 1,067 694 922 680 723
—————————————————————————-
Total (boe/d) 9,331 8,821 8,595 7,100 8,435
Total (boe) 839,746 802,744 790,806 653,215 767,585
—————————————————————————-
Natural gas
sales
weighting 72% 67% 72% 70% 65%
—————————————————————————-
Realized Prices
Natural gas
($/mcf) 2.85 2.01 3.29 2.53 1.64
Oil ($/bbl) 62.62 34.52 59.42 44.50 46.68
NGLs ($/bbl) 33.18 18.18 24.56 15.56 8.47
—————————————————————————-
Total realized
price ($/boe) 26.48 18.18 26.97 21.06 19.32
—————————————————————————-
Royalty income 0.05 0.13 0.10 0.07 0.12
Royalty
expense (3.94) (3.08) (3.52) (2.99) (2.26)
—————————————————————————-
Net oil and
natural gas
revenue ($/boe) 22.59 15.23 23.55 18.14 17.18
—————————————————————————-
Operating
expense (4.50) (8.52) (3.63) (6.04) (7.65)
Transportation
expense (1.38) (1.62) (1.50) (1.49) (1.30)
—————————————————————————-
Operating
netback (1)(2)
($/boe) 16.71 5.09 18.42 10.61 8.23
—————————————————————————-
Realized gain
on
derivatives
($/boe) 0.57 7.84 0.99 4.06 6.87
General &
administrativ
e expense (1.05) (2.72) (3.78) (1.69) (1.86)
Cash finance
expense (2.07) (4.53) (2.58) (3.85) (3.18)
Decommissionin
g
expenditures
(3) (0.19) (0.18) (0.64) (0.04) (0.10)
—————————————————————————-
Corporate
netback (1)
($/boe) 13.97 5.50 12.41 9.09 9.96
—————————————————————————-

—————————————————————————-
FINANCIAL (000s Three Three Three Three Three
except per months months months months months
share) ended ended ended ended ended
Mar. 31, Mar. 31, Dec. 31, Sept. 30, Jun. 30,
2017 2016 2016 2016 2016
—————————————————————————-
Oil and
natural gas
revenue 22,274 14,698 21,409 13,805 14,926
Net income
(loss) 7,311 (4,110) (11,842) (4,702) (46,334)
Net income
(loss) per
share
Basic 0.16 (0.10) (0.26) (0.10) (1.02)
Fully
diluted 0.16 (0.10) (0.26) (0.10) (1.02)
Funds flow (3) 11,732 4,412 9,809 5,938 7,652
Funds flow per
share (3)
Basic 0.25 0.11 0.22 0.13 0.17
Fully
diluted 0.25 0.11 0.22 0.13 0.17
Capital
expenditures 18,907 9,277 10,026 7,231 2,712
Net
acquisitions
(dispositions
) 8,818 – – (29,718) –
Weighted
average
shares
outstanding
Basic 46,754 41,762 45,349 45,349 45,349
Fully
diluted 46,989 41,762 45,349 45,349 45,349
As at period end
Common shares
outstanding
Basic 49,428 45,349 45,349 45,349,192 45,349,192
Fully
diluted 52,664 45,349 45,349 45,349,192 45,349,192
Total assets 460,095 544,548 439,967 448,404 493,535
Non-current
liabilities 165,104 214,776 118,934 169,714 174,790
Net debt (1) 130,624 157,675 124,915 124,310 152,935
—————————————————————————-
—————————————————————————-
(1)Refer to “Non-GAAP Financial Measures” in the Management’s Discussion &
Analysis.
(2)In prior periods Petrus included realized gain on derivatives (hedging
gain (loss)) in the calculation of operating netback. The amount is
included in the calculation of corporate netback. The comparative
information has been re-classified to conform to current presentation.
(3)In prior periods Petrus excluded decommissioning expenditures from the
calculation of funds flow. The comparative information has been re-
classified to conform to current presentation.

/T/

OPERATIONS UPDATE

/T/

Production
Average first quarter production on an area level was as follows:

—————————————————————————-
—————————————————————————-
Average production for the three
months ended Central
March 31, 2017 Ferrier Foothills Alberta Total
—————————————————————————-
Natural gas (mcf/d) 23,652 8,857 7,823 40,332
Oil (bbl/d) 732 295 515 1,542
NGLs (bbl/d) 848 36 183 1,067
—————————————————————————-
Total (boe/d) 5,522 1,807 2,002 9,331
—————————————————————————-
Natural gas sales weighting 71% 82% 65% 72%
—————————————————————————-
—————————————————————————-

/T/

Average production was 9,331 boe/d (72% natural gas) in the first quarter of
2017 compared to 8,821 boe/d (67% natural gas) in the first quarter of 2016.
The 6% production increase is attributable to the organic drilling program at
Ferrier. Sales volume exceeded expected field estimates in December and the
first quarter, therefore the impact of the higher production was recognized
during the first quarter.

The Company’s natural gas sales weighting was higher in the first quarter of
2017 relative to the first quarter of 2016 due to the divestiture of the Peace
River assets in 2016, in addition to the timing of the Ferrier development.
Liquids rich natural gas production attributed to the wells drilled in the
first quarter is expected to increase the Company’s liquids weighting in the
second quarter. The Company has generated average quarterly production growth
of 31% since the divestiture of its Peace River area assets. The proceeds of
the Peace River asset disposition were used to reduce debt and the capital
investments in the Ferrier area were funded by funds flow.

In the first quarter of 2017, 8 gross (6.0 net) wells were drilled in the
Ferrier area. Of those wells, one gross (0.4 net) well came on production
during the first quarter. The remaining drilled but uncompleted “DUC” wells
were scheduled to be fracture stimulated and completed subsequent to the end of
the first quarter. The DUC wells are expected to be brought on production in
the second quarter, after which time the Company’s productive capability is
estimated to be greater than 11,000 boe/d.(1)

Capital Development

Petrus’ Board of Directors approved a $50 to $60 million capital budget for
2017 (excluding acquisitions and dispositions) which provides for the drilling
of 16 gross (11.7 net) Cardium wells in the Ferrier area. The Company’s 2017
capital program also provides for investment in facilities. The processing and
compression capability of the Ferrier gas plant is expected to be doubled to
reach a capacity of approximately 60 mmcf/d by the fourth quarter of 2017.(1)

Term Loan Extension

On January 24, 2017, Petrus entered into an agreement with Macquarie Bank
Limited to extend the Company’s $42 million second lien term loan by two years;
now due October 2019. Concurrent with the extension, the Company reduced the
amount outstanding by $7 million through working capital and available credit
facilities. The interest rate on the remaining $35 million balance remains
unchanged at a per annum rate of the (three-month) Canadian Dealer offered Rate
(CDOR) plus 700 basis points.

Acquisition and Private Placement

On February 28, 2017, the Company closed an acquisition of certain oil and
natural gas interests in the Ferrier area (the “Acquisition”) for total
consideration of $8.8 million after post-closing adjustments. Petrus acquired a
minor amount of production as well as a 100% working interest in a drilled and
completed Cardium horizontal well which is expected to be tied in later in
2017. In addition, Petrus acquired a 100% working interest in approximately
3,360 net acres (5.25 net sections) of undeveloped Cardium land in its Ferrier
core area.

On February 28, 2017, the Company also closed a non-brokered private placement
of 4,078,708 common shares of the Company (“Common Shares”) at a purchase price
of $2.53 per Common Share, for aggregate gross proceeds of $10.3 million (the
“Private Placement”). A portion of the net proceeds of the Private Placement
were used to fund the Acquisition and Petrus expects the remainder will be used
to fund the Company’s 2017 capital program.

ANNUAL MEETING

The Company’s Annual Meeting will be held at the Jamieson Place Conference
Centre (3rd floor) 308, 4th Ave SW Calgary, Alberta, on Thursday May 18, 2017
at 9:00 a.m. (Calgary time). The Information Circular, Annual Information Form,
2016 Annual Report and the First Quarter 2017 Report are available on the SEDAR
filing system (www.sedar.com) as well as on the Company’s website
(www.petrusresources.com).

An updated corporate presentation can be found on the Company’s website at
www.petrusresources.com.

ADVISORIES

Basis of Presentation

Financial data presented above has largely been derived from the Company’s
financial statements, prepared in accordance with GAAP which require publicly
accountable enterprises to prepare their financial statements using IFRS.
Accounting policies adopted by the Company are set out in the notes to the
audited financial statements as at and for the twelve months ended December 31,
2016. The reporting and the measurement currency is the Canadian dollar. All
financial information is expressed in Canadian dollars, unless otherwise stated.

Forward Looking Statements

Certain information regarding Petrus set forth in this press release contains
forward-looking statements within the meaning of applicable securities law,
that involve substantial known and unknown risks and uncertainties. The use of
any of the words “anticipate”, “continue”, “estimate”, “expect”, “may”, “will”,
“project”, “should”, “believe” and similar expressions are intended to identify
forward-looking statements. Such statements represent Petrus’ internal
projections, estimates or beliefs concerning, among other things, an outlook on
the estimated amounts and timing of capital investment, anticipated future
debt, production, revenues or other expectations, beliefs, plans, objectives,
assumptions, intentions or statements about future events or performance,
including targets for debt to funds flow. These statements are only predictions
and actual events or results may differ materially. Although Petrus believes
that the expectations reflected in the forward-looking statements are
reasonable, it cannot guarantee future results, levels of activity, performance
or achievement since such expectations are inherently subject to significant
business, economic, competitive, political and social uncertainties and
contingencies. Many factors could cause Petrus’ actual results to differ
materially from those expressed or implied in any forward-looking statements
made by, or on behalf of, Petrus.

In particular, forward-looking statements included in this press release
include, but are not limited to, statements with respect to: the availability
of cash flows from operating activities; expected processing and compression
capacity at the Ferrier gas plant; sources of financing and the requirement
therefor; the growth of Petrus; the treatment of the revolving facility
following the end of the revolving period; Petrus’ ability to fund its
financial liabilities; the size of, and future net revenues from, crude oil,
NGL (natural gas liquids) and natural gas reserves; future prospects; the focus
of and timing of capital expenditures; expectations regarding the timing for
bringing new wells on production; expectations regarding the ability to raise
capital and to continually add to reserves through acquisitions and
development; access to debt and equity markets; projections of market prices
and costs; the performance characteristics of the Company’s crude oil, NGL and
natural gas properties including estimated production; crude oil, NGL and
natural gas production levels and product mix; Petrus’ future operating and
financial results; capital investment programs; supply and demand for crude
oil, NGL and natural gas; future royalty rates; drilling, development and
completion plans and the results therefrom; and treatment under governmental
regulatory regimes and tax laws. In addition, statements relating to “reserves”
are deemed to be forward-looking statements, as they involve the implied
assessment, based on certain estimates and assumptions, that the reserves
described can be profitably produced in the future.

These forward-looking statements are subject to numerous risks and
uncertainties, most of which are beyond the Company’s control, including the
impact of general economic conditions; volatility in market prices for crude
oil, NGL and natural gas; industry conditions; currency fluctuation;
imprecision of reserve estimates; liabilities inherent in crude oil and natural
gas operations; environmental risks; incorrect assessments of the value of
acquisitions and exploration and development programs; competition; the lack of
availability of qualified personnel or management; changes in income tax laws
or changes in tax laws and incentive programs relating to the oil and gas
industry; hazards such as fire, explosion, blowouts, cratering, and spills,
each of which could result in substantial damage to wells, production
facilities, other property and the environment or in personal injury; stock
market volatility; ability to access sufficient capital from internal and
external sources; completion of the financing on the timing planned and the
receipt of applicable approvals; and the other risks. With respect to
forward-looking statements contained in this press release, Petrus has made
assumptions regarding: future commodity prices and royalty regimes;
availability of skilled labour; timing and amount of capital expenditures;
future exchange rates; the impact of increasing competition; conditions in
general economic and financial markets; availability of drilling and related
equipment and services; effects of regulation by governmental agencies; and
future operating costs. Management has included the above summary of
assumptions and risks related to forward- looking information provided in this
press release in order to provide shareholders with a more complete perspective
on Petrus’ future operations and such information may not be appropriate for
other purposes. Petrus’ actual results, performance or achievement could differ
materially from those expressed in, or implied by, these forward-looking
statements and, accordingly, no assurance can be given that any of the events
anticipated by the forward-looking statements will transpire or occur, or if
any of them do so, what benefits that the Company will derive therefrom.
Readers are cautioned that the foregoing lists of factors are not exhaustive.
These forward- looking statements are made as of the date of this press release
and the Company disclaims any intent or obligation to update any
forward-looking statements, whether as a result of new information, future
events or results or otherwise, other than as required by applicable securities
laws.

BOE Presentation

The oil and natural gas industry commonly expresses production volumes and
reserves on a barrel of oil equivalent (“boe”) basis whereby natural gas
volumes are converted at the ratio of nine thousand cubic feet to one barrel of
oil. The intention is to sum oil and natural gas measurement units into one
basis for improved measurement of results and comparisons with other industry
participants. Petrus uses the 6:1 boe measure which is the approximate energy
equivalency of the two commodities at the burner tip. Boe’s do not represent an
economic value equivalency at the wellhead and therefore may be a misleading
measure if used in isolation.

/T/

Abbreviations
000’s thousand dollars
$/bbl dollars per barrel
$/boe dollars per barrel of oil equivalent
$/GJ dollars per gigajoule
$/mcf dollars per thousand cubic feet
bbl barrel
bbl/d barrels per day
boe barrel of oil equivalent
boe/d barrel of oil equivalent per day
GJ gigajoule
GJ/d gigajoules per day
mcf thousand cubic feet
mcf/d thousand cubic feet per day
mmcf/d million cubic feet per day
NGLs natural gas liquids
WTI West Texas Intermediate

/T/

– END RELEASE – 12/05/2017

For further information:
Petrus Resources Ltd.
Neil Korchinski, P.Eng.
President and Chief Executive Officer
403-930-0889
[email protected]
www.petrusresources.com

COMPANY:
FOR: PETRUS RESOURCES LTD.
TSX SYMBOL: PRQ

INDUSTRY: Energy and Utilities – Oil and Gas
RELEASE ID: 20170512CC0014

Press Release from Marketwired 1-866-736-3779

All press releases are written by the client and have NO affiliation with the news copy written by The Canadian Press. Any questions that arise due to the content or information provided in the press release should be directed to the company/organization
issuing the release, not to The Canadian Press.

GET ENERGYNOW’S DAILY EMAIL FOR FREE


Canada Energy Partners Announces Appeal Timeline for Its Water Disposal Well

FOR: CANADA ENERGY PARTNERS INC.
TSX VENTURE SYMBOL: CE

Date issue: May 12, 2017
Time in: 7:30 AM e

Attention:

VANCOUVER, BRITISH COLUMBIA–(Marketwired – May 12, 2017) – The Oil & Gas
Appeal Tribunal of British Columbia (the “Tribunal”) has established the
timeline for Canada Energy Partners Inc.’s (TSX VENTURE:CE) (the “Company”)
appeal of the order issued by the British Columbia Oil & Gas Commission (“OGC”)
on March 16th suspending all disposal activities at the Company’s water
disposal well in northeast British Columbia. All submissions related to the
appeal must be delivered by June 19th, after which the Tribunal will deliberate
and render a decision.

The Company received an order from the OGC (the “Order”) suspending its water
disposal permit on March 16, 2017. The Order “shall remain in effect until
amended or terminated in whole or in part by the Commission.” The Company
immediately ceased disposing and has secured the well. The reasons given by the
OGC were concerns over enhanced seismicity alleged to be related to water
disposal. The OGC gave no evidence of increased seismicity related to the
Company’s disposal well but referenced increased seismicity in other areas of
British Columbia. The General Order states that the Company “has met the
conditions” stipulated in its disposal permit.

The OGC’s General Order and the Company’s Notice of Appeal can be viewed on the
Company’s website: www.canadaenergypartners.com.

On behalf of the Board of Directors of Canada Energy Partners Inc.

Benjamin Jones, President & CEO

Neither the TSX Venture Exchange nor its Regulation Services Provider (as such
term is defined in the policies of the TSX Venture Exchange) accepts
responsibility for the adequacy or accuracy of this release.

This press release contains forward-looking statements within the meaning of
applicable securities laws. Forward-looking statements are frequently
characterized by words such as “plan”, “expect”, “project”, “intend”,
“believe”, “anticipate”, “estimate” and other similar words or statements that
certain events or conditions “may” or “will” occur, including, without
limitation, estimated revenues.

Forward-looking statements are subject to a variety of risks and uncertainties
and other factors that could cause actual events or results to differ
materially from those projected in the forward-looking statements. These
factors include, without limitation, regulatory approvals, mechanical integrity
of the water disposal well, receptivity of the disposal zone, variability of
operating costs, risks associated with oil and gas production and exploration,
retention of and ability to attract company personnel, volatility of commodity
prices, currency and interest rate fluctuations, environmental risk, inability
to access sufficient capital from internal and external sources and changes in
legislation, including income tax, environmental and regulatory matters.

This press release, in particular the information in respect of estimated
revenues, may contain future-oriented financial information or financial
outlook within the meaning of applicable securities laws. Such future-oriented
financial information or financial outlook has been prepared for the purpose of
providing information about management’s reasonable expectations as to the
anticipated results of its proposed business activities. Readers are cautioned
that reliance on such information may not be appropriate for other purposes.

The forward-looking statements contained in this press release are made as of
the date hereof, and the Company undertakes no obligation to update publicly or
revise any forward-looking statements, whether as a result of new information,
future events or otherwise, unless so required by law.

– END RELEASE – 12/05/2017

For further information:
Canada Energy Partners Inc.
650-669 Howe Street
Vancouver, BC V6C 0B4
Main Phone: (778) 725-1489
Facsimile: (604) 428-1124
Email: [email protected]
OR
Ben Jones
President and CEO
Direct Phone: +1 225.388.9900 ext 101
www.canadaenergypartners.com

COMPANY:
FOR: CANADA ENERGY PARTNERS INC.
TSX VENTURE SYMBOL: CE

INDUSTRY: Energy and Utilities – Oil and Gas
RELEASE ID: 20170512CC0013

Press Release from Marketwired 1-866-736-3779

All press releases are written by the client and have NO affiliation with the news copy written by The Canadian Press. Any questions that arise due to the content or information provided in the press release should be directed to the company/organization
issuing the release, not to The Canadian Press.

GET ENERGYNOW’S DAILY EMAIL FOR FREE


Enercare Reports Record First Quarter Revenue of $278 Million

FOR: ENERCARE INC.
TSX Symbol: ECI

Date issue: May 12, 2017
Time in: 7:00 AM e

Attention:

Highest Ever Organic Contract Growth(1)

TORONTO, ON –(Marketwired – May 12, 2017) –

(All amounts are in Canadian dollars unless otherwise stated)

Enercare Inc. (“Enercare”) (TSX: ECI), one of North America’s leading
providers of essential home and commercial services and energy solutions,
reported its financial results for the first quarter ended March 31, 2017.

First Quarter 2017 Highlights

/T/

— First quarter revenue of $278 million, an increase of 95% compared to

the same period in 2016
— EBITDA of $50 million, down $1.4 million or 3%, mainly as a result of
the seasonality associated with Service Experts, not present in the
first quarter of 2016. In addition, EBITDA was further impacted by the
following one-time expenses:
— stock based compensation of $2 million as a result of an approximate
$2 share price appreciation,
— purchase price accounting for the Service Experts transaction for
$0.7 million, and
— a write-off of $0.8 million associated with stranded technology.
— Had these one-time expenses not been incurred, EBITDA would have
increased by 4%
— Home Services reported seventh consecutive quarter of net growth in
rental units
— Sub-metering contract additions grew by 25%
— Service Experts csompletes rental roll-out in three provinces and four
states

/T/

Financial Highlights
(in millions of Canadian dollars except per unit amounts)(2)

/T/

—————————————————————————-

Three months ended March 31,
2017 2016 B/(W)
—————————————————————————-
Total revenue $277.8 $142.6 95%
EBITDA $50.5 $51.9 (3%)
Acquisition Adjusted EBITDA(3) $52.5 $58.1 (10%)
Net earnings $(3.0) $8.2 (136%)
Basic earnings per share $(0.03) $0.09 (133%)
Payout ratio – maintenance(3) 96% 61% (35)*
Payout ratio(3) 380% 129% (251)*
Rental attrition (units) 7,700 7,500 (3%)
Rental additions net of attrition 1,000 1,000 – %
Sub-metering contracted units 10,000 8,000 25%
—————————————————————————-

/T/

*percentage points

(1) Includes net rental units, net protection plans and net sub-metering
contracts, excluding acquisitions.
(2) Unless otherwise noted, amounts are reported in thousands, except
customers, units, shares and per share amounts and percentages. Dollar amounts
are expressed in Canadian currency except as otherwise noted.
(3) Adjusted EBITDA, Acquisition Adjusted EBITDA, Payout Ratio and Payout
Ratio – Maintenance are non-IFRS financial measures. Refer to the Non-IFRS
Financial and Performance Measures section in the MD&A.

John Macdonald, President and CEO, said:

“The launch of the rental program in Service Experts, both in Canada and the
US, represents another opportunity for us to grow our customer relationships.
This unit growth, in combination with our strong sales in sub-metering and our
solid rental growth in Home Services, builds on our long-term recurring
revenue model.”

Results of Operations

Earnings Statement

/T/

—————————————————————————-
Three months ended
March 31, 2017 Enercare Home Service Sub-
(000’s) Services Experts metering Corporate Total
—————————————————————————-
Revenues:
Contracted revenue $ 104,402 $ 11,377 $ 37,146 $ – $152,925
Sales and other
services 6,546 116,377 1,704 – 124,627
Investment income 249 10 2 – 261
—————————————————————————-
Total revenue $ 111,197 $127,764 $ 38,852 $ – $277,813
—————————————————————————-
Expenses:
Cost of goods sold:
Commodity – – 29,495 – 29,495
Maintenance &
servicing costs 16,264 9,089 – – 25,353
Sales and other
services 5,551 75,377 1,153 – 82,081
—————————————————————————-
Total cost of goods
sold 21,815 84,466 30,648 – 136,929
SG&A expenses 27,699 46,873 5,674 8,224 88,470
Foreign exchange 78 (3) (39) – 36
Amortization expense 30,880 5,150 1,770 599 38,399
Net loss/(gain) on
disposal 1,863 (16) 10 – 1,857
Interest expense:
Interest expense
payable in cash 9,640
Make-whole charge on
early redemption of 5,049
debt
Non-cash interest
expense 1,155
—————————————————————————-
Total interest
expense 15,844
—————————————————————————-
Total expenses 281,535
—————————————————————————-
Earnings/(loss)
before income taxes (3,722)
—————————————————————————-
Current tax (expense) (5,415)
Deferred tax recovery 6,105
—————————————————————————-
Net earnings/(loss) $ (3,032)
—————————————————————————-
EBITDA $ 59,742 $ (3,556) $ 2,559 $ (8,224) $ 50,521
—————————————————————————-
Adjusted EBITDA $ 61,605 $ (3,572) $ 2,569 $ (8,224) $ 52,378
—————————————————————————-
Acquisition Adjusted
EBITDA $ 61,605 $ (3,468) $ 2,569 $ (8,224) $ 52,482
—————————————————————————-

/T/

/T/

—————————————————————————-
Three months ended March Enercare Home Service Sub-
31, 2016 (000’s) Services Experts metering Corporate Total
—————————————————————————-
Revenues:
Contracted revenue $ 100,331 $ – $ 35,217 $ – $135,548
Sales and other
services 6,098 – 903 – 7,001
Investment income 78 – 22 – 100
—————————————————————————-
Total revenue $ 106,507 $ – $ 36,142 $ – $142,649
—————————————————————————-
Expenses:
Cost of goods sold:
Commodity – – 27,747 – 27,747
Maintenance & servicing
costs 16,268 – – – 16,268
Sales and other
services 5,281 – 364 – 5,645
—————————————————————————-
Total cost of goods sold 21,549 – 28,111 – 49,660
SG&A expenses 25,892 – 4,690 8,556 39,138
Foreign exchange 20 – 15 (12) 23
Amortization expense 30,036 – 1,622 649 32,307
Net loss on disposal 1,925 – 6 – 1,931
Interest expense:
Interest expense
payable in cash 7,926
Non-cash interest
expense 427
—————————————————————————-
Total interest expense 8,353
—————————————————————————-
Total expenses 131,412
—————————————————————————-
Earnings before income
taxes 11,237
—————————————————————————-
Current tax (expense) (12,256)
Deferred tax recovery 9,214
—————————————————————————-
Net earnings $ 8,195
—————————————————————————-
EBITDA $ 57,121 $ – $ 3,320 $ (8,544) $ 51,897
—————————————————————————-
Adjusted EBITDA $ 59,046 $ – $ 3,326 $ (8,544) $ 53,828
—————————————————————————-
Acquisition Adjusted
EBITDA $ 63,339 $ – $ 3,326 $ (8,544) $ 58,121
—————————————————————————-

/T/

Revenues

Total revenues of $277,813 for the first quarter of 2017 increased by $135,164
or 95% compared to the same period in 2016, primarily as a result of the
acquisition of Service Experts by Enercare, through an indirect wholly-owned
subsidiary of Enercare Solutions Inc. (“Enercare Solutions”), on May 11, 2016
(the “SE Transaction”).

Enercare Home Services revenues, excluding investment income, of $110,948 for
the first quarter of 2017 increased by $4,519 or 4%, compared to the same
period in 2016, primarily as a result of a rental rate increase implemented in
January 2017, changes in asset mix and growth in heating, ventilation and air
conditioning (“HVAC”) rental units. Contracted revenue in Enercare Home
Services represents revenue generated by the Rentals portfolio and protection
plan contracts, while sales and other services revenue mainly pertains to
one-time sales and installations of residential furnaces, boilers and air
conditioners, as well as plumbing, duct cleaning and other services.

Enercare’s strategy to emphasize HVAC rentals over outright sales resulted in
significant increases in recurring revenue at the expense of sales and other
services revenue.

Service Experts revenues, excluding investment income, were $127,754 during
the first quarter of 2017. Service Experts revenues were lowered by $3,386 as
a result of purchase accounting adjustments of deferred revenue associated
with the SE Transaction.

Sub-metering revenues, excluding investment income, were $38,850 in the first
quarter of 2017, an increase of $2,730 or 8% over the same period in 2016,
primarily as a result of higher billable units. Sub-metering revenue includes
total flow through commodity charges of $29,495 in the quarter, increases of
$1,748 or 6% compared to the first quarter of 2016.

In the second half of 2016, Sub-metering negotiated renewals with four large
property management companies representing approximately 21,000 metering
units. These properties were either at or near the end of their original
contracts and the renewals were completed at lower net revenue per meter point
due to competitive pressures. This resulted in a reduction in revenue of
approximately $450 in the quarter. The typical term for these renewals is
between 10 to 15 years.

Investment income was $261 in the first quarter of 2017, an increase of $161,
when compared to the same period in 2016. The change in investment income was
primarily attributable to the investment of the proceeds from the $275,000 of
3.38% Series 2017-1 Senior Unsecured Notes of Enercare Solutions, due February
21, 2022 (the “2017-1 Notes”) and the $225,000 of 3.99% Series 2017-2 Senior
Unsecured Notes of Enercare Solutions, due February 21, 2024 (the “2017-2
Notes”) (collectively the “2017 Notes”), for approximately 30 days prior to
the redemption of the $210,000 4 year variable rate, non-revolving term loan
facility of Enercare Solutions (the “2014 Term Loan”) and the repayment of the
$250,000 of 4.30% Series 2012-1 Senior Unsecured Notes of Enercare Solutions
(the “2012 Notes”).

Cost of Goods Sold

Total cost of goods sold for the first quarter of 2017 was $136,929, an
increase of $87,269 or 176%, compared to the same period in 2016, primarily as
a result of the SE Transaction.

Enercare Home Services cost of goods sold in the first quarter of 2017 was
consistent with that of the same period in 2016, increasing by $266 or 1% as a
result of an increased emphasis on managing costs. Maintenance and servicing
costs in Enercare Home Services primarily consist of protection plan expenses
and servicing costs related to the Rentals portfolio, while sales and other
services expenses mainly pertain to one-time sales and installations of
residential furnaces, boilers, air conditioners and small commercial products
as well as plumbing, duct cleaning and other chargeable services.

Service Experts cost of goods sold amounted to $84,466 in the first quarter of
2017. Service Experts cost of goods sold was lowered by $2,683 as a result of
purchase accounting adjustments for the service obligation associated with the
SE Transaction.

Sub-metering cost of goods sold was $30,648 in the first quarter of 2017,
increasing by $2,537 or 9%, primarily due to an increase in flow through
commodity charges over the same period in 2016. Sales and other services
expenses for Sub-metering relate to Triacta Power Technologies Inc.
(“Triacta”) meter sales and the sale and installation of water conservation
products in apartments and condominiums.

Selling, General & Administrative Expenses

Total selling, general and administrative expenses (“SG&A”) were $88,470 in
the first quarter of 2017, an increase of $49,332 compared to the same period
in 2016, primarily as a result of the SE Transaction.

Enercare Home Services SG&A expenses of $27,699 in the first quarter increased
by $1,807 compared to the same period in 2016. The $1,807 increase was
primarily as a result of increases of approximately $3,000 in higher wages and
benefits, driven partly by higher stock-based compensation costs resulting
from an increase in the price of the common shares of Enercare (“Share”),
$1,400 in support costs, $700 in sales and marketing expenses, $415 in claims
expense and $260 in bad debt expense, partly offset by lower office expense of
$1,150 and professional fees of $2,900.

Enercare Home Services SG&A expenses in the first quarter of 2016 included
$2,834 of acquisition related expenditures associated with the SE Transaction,
primarily consisting of professional fees. SG&A expenses also included $1,459
of integration and business transformation costs related to the acquisition of
the Ontario home and small commercial services business of Direct Energy
Marketing Limited by Enercare on October 20, 2014 (the “DE Acquisition”),
primarily from information technology integration activities to optimize the
information technology platforms and marketing spend related to continued
rebranding.

Service Experts SG&A expenses in the first quarter of 2017 amounted to
$46,873, primarily comprised of approximately $28,500 of wages and benefits,
$11,200 of sales and marketing related costs and $5,200 of office related
expenses. Service Experts SG&A expenses in the first quarter of 2017 included
integration related expenditures of $104, primarily consisting of professional
fees associated with the integration of the SE Transaction.

Sub-metering SG&A expenses in the first quarter of 2017 were $5,674, an
increase of $984 over the same period in 2016, primarily as a result of $640
of higher wages, driven partly by higher stock-based compensation costs
resulting from an increase in Share price, $150 of higher office expenses and
$140 of higher billing and servicing costs.

Corporate expenses of $8,224 in the first quarter of 2017 decreased by $332 or
4%, compared to the same period in 2016. The $332 decrease was primarily as a
result of approximately $200 in higher wages and benefits, driven by higher
stock-based compensation costs resulting from an increase in Share price, $215
of higher office expenses, resulting from an increase in information
technology costs, and $280 in higher sales and marketing expenses, partly
offset by a decrease in professional fees of $1,025.

Corporate SG&A expenses in the first quarter of 2016 included $657 of
integration and business transformation costs related to the DE Acquisition,
primarily from information technology integration activities to optimize the
information technology platforms.

Amortization Expense

Amortization expense increased by $6,092 or 19% in the first quarter of 2017
compared to the same period in 2016, primarily due to the SE Transaction, an
increasing capital asset base from asset mix changes in the Rentals portfolio
and increased Sub-metering capital investments, which are amortized over a
shorter life than those of the Enercare Home Services business.

Net Loss on Disposal of Equipment

Enercare reported a net loss on disposal of equipment of $1,857 in the first
quarter of 2017, a decrease of $74 or 4% over the same period in 2016. The net
loss on disposal amount is influenced by the number of assets retired,
proceeds on disposal of equipment, changes in the retirement asset mix and the
age of the assets retired. During the first quarter of 2017, net loss on
disposal included a non-recurring write down of $845 relating to stranded
technology investments resulting from going concern issues with a supplier
that was developing software solutions for the Enercare Home Services
business.

Interest Expense

/T/

—————————————————————————-

Three months ended March 31,
(000’s) 2017 2016
—————————————————————————-
Interest expense payable in cash $ 9,640 $6,629
Interest payable on subscription receipts – 1,108
Equity bridge financing fees – 189
Make-whole payment on early redemption of
senior debt 5,049 –
Non-cash items:
Notional interest on employee benefit plans 210 210
Amortization of financing costs 945 217
—————————————————————————-
Interest expense $15,844 $8,353
—————————————————————————-

/T/

Interest expense payable in cash increased by $3,011 to $9,640 in the first
quarter of 2017, compared to the same period in 2016. This increase was
primarily related to the addition of the USD $200,000 from the two 4-year
non-revolving, non-amortizing variable rate term credit facilities (the “2016
Term Loan”), maturing on May 11, 2020, related to the financing of the SE
Transaction and the issuance of 2017 Notes during the first quarter of 2017,
partially offset by the conversion of the 6.25% convertible unsecured
subordinated debentures of Enercare (“Convertible Debentures”) to Shares. A
make-whole payment for the early redemption of the 2012 Notes during the first
quarter of 2017 resulted in a one-time interest expense of $5,049.

Notional interest of $210 in the first quarter of 2017 relates to the defined
benefit employee benefits plans. Amortization of financing costs includes the
previously unamortized costs associated with the 2012 Notes, which were
redeemed on March 23, 2017, the $225,000 of 4.60% Series 2013-1 Senior
Unsecured Notes of Enercare Solutions, which mature on February 3, 2020, the
Convertible Debentures, the 2014 Term Loan, which was repaid on February 23,
2017, the 2016 Term Loan and the 2017 Notes. The 2017-1 Notes were sold at a
price of 99.982% of the principal amount, with an effective yield of 3.384%
per annum if held to maturity and the 2017-2 Notes were sold at 99.982% of the
principal amount, with an effective yield of 3.993% per annum if held to
maturity.

As part of the SE Transaction, Enercare issued subscription receipts (the “SE
Subscription Receipts”) during the first quarter of 2016 and subsequently
exchanged them for Shares upon the closing of the SE Transaction on May 11,
2016. While the SE Subscription Receipts remained outstanding, they were
classified as debt, resulting in interest expense of $1,108, which was the
equivalent to the dividend payments on such SE Subscription Receipts if they
had been Shares. Equity bridge financing fees of $189 in the first quarter of
2016 were also incurred as part of the SE Transaction.

Income Taxes

Enercare reported current tax expense of $5,415 in the first quarter of 2017,
a decrease of $6,841 over the same period in 2016, primarily due to higher
taxes paid in the first quarter of 2016 as a result of a one year tax deferral
originated in 2015 and additional interest expense incurred in the first
quarter of 2017. The deferred income tax recovery of $6,105 decreased by
$3,109 over the same period in 2016, primarily as a result of temporary
difference reversals in the Enercare Home Services, Service Experts and
Sub-metering businesses.

Net Earnings

The net loss of $3,032 in the first quarter of 2017 was lower than the net
earnings of $8,195 in the first quarter of 2016, as previously described.

EBITDA, Adjusted EBITDA and Acquisition Adjusted EBITDA

The following table summarizes comparative quarterly results for the last
eight quarters, and reconciles net earnings, an IFRS measure, to EBITDA,
Adjusted EBITDA and Acquisition Adjusted EBITDA.

/T/

—————————————————————————
(000’s) Q1/17 Q4/16 Q3/16 Q2/16
—————————————————————————
Net (loss)/earnings $ (3,032)$ 17,552 $ 19,332 $ 16,051
Deferred tax (recovery)/expense (6,105) (5,275) (7,522) (7,633)
Current tax expense 5,415 11,534 15,332 15,259
Amortization expense 38,399 38,892 38,329 35,796
Interest expense 15,844 8,554 8,507 9,187
—————————————————————————
EBITDA(a) 50,521 71,257 73,978 68,660
Add: Net loss/(gain) on disposal 1,857 850 734 891
—————————————————————————
Adjusted EBITDA(b) 52,378 72,107 74,712 69,551
Add: Acquisition SG&A 104 603 4,854 5,128
—————————————————————————
Acquisition Adjusted EBITDA $ 52,482 $ 72,710 $ 79,566 $ 74,679
—————————————————————————

—————————————————————————-
(000’s) Q1/16 Q4/15 Q3/15 Q2/15
—————————————————————————-
Net (loss)/earnings $ 8,195 $ 13,725 $ 13,124 $ 16,204
Deferred tax (recovery)/expense (9,214) 1,069 2,376 1,323
Current tax expense 12,256 2,784 2,169 2,290
Amortization expense 32,307 31,917 31,606 31,044
Interest expense 8,353 6,988 6,955 7,021
—————————————————————————-
EBITDA(a) 51,897 56,483 56,230 57,882
Add: Net loss/(gain) on disposal 1,931 (1,455) 1,001 1,572
—————————————————————————-
Adjusted EBITDA(b) 53,828 55,028 57,231 59,454
Add: Acquisition SG&A 4,293 3,028 3,946 1,961
—————————————————————————-
Acquisition Adjusted EBITDA $ 58,121 $ 58,056 $ 61,177 $ 61,415
—————————————————————————-

/T/

/T/

a. Historical EBITDA has been conformed to the current presentation which

includes investment income and other income.
b. Historical Adjusted EBITDA has been conformed to the current
presentation which includes investment income and other income and
excludes net loss on disposal.

/T/

Outlook

The forward-looking statements contained in this section are not historical
facts but, rather, reflect Enercare’s current expectations regarding future
results or events and are based on information currently available to
management (see “Cautionary Note Regarding Forward-looking Statements” in this
news release).

Enercare Home Services Segment

/T/

— Our main priority for the business in 2017 is to grow EBITDA. In order

to grow EBITDA in the Enercare Home Services business, our key priority
is to continue to grow the number of rental contracts. We believe that
we have the opportunity to continue to grow the number of contract
additions in excess of Attrition throughout 2017. Other key priorities
for the Enercare Home Services business include growing the protection
plan portfolio, enabled by the full launch of the electrical protection
plans, investing in the replacement of key infrastructure and IT systems
that support our vision for sustainable growth and further enhancing our
customer satisfaction levels. We will also continue to build on the
innovation of our mobile app with further enhancements to the customer
experience throughout the year.
— Our strategy to emphasize HVAC rentals over outright sales in order to
create a long-term customer revenue stream and provide valuable cross-
selling opportunities continues to be successful. While this strategy
has resulted in a significant increase in recurring HVAC rental
revenues, we anticipate the negative short-term impact on non-recurring
sales and other services revenue to continue throughout 2017.
— In late December 2016, Enercare implemented an electrical protection
plan pilot program available to customers in Ontario. The electrical
protection plan provides customers coverage for specified residential
home electrical components, including diagnosis, repair, replacement and
adjustment. The pilot program was rolled out in early 2017 and the full
launch occurred in March.
— Our collective bargaining agreement in respect of Enercare Home Services
with UNIFOR Local 975 expired on March 31, 2017. Enercare and the union
began renegotiations in March and anticipate their continuing until at
least the end of May.

/T/

Service Experts Segment

/T/

— Consistent with previous guidance, cost synergies relating to the SE

Transaction are estimated to be in the range of $0.05 to $0.08 per Share
on an annualized basis by the end of 2017, primarily as a result of a
reduction in sourcing costs.
— Our key priority for the Service Experts business in 2017 is to grow
revenues and EBITDA while continuing to expand the rental programs for
HVAC and water heater products in both Canada and the U.S. Service
Experts will also continue to explore strategic acquisition
opportunities.
— In October 2016, Service Experts introduced a rental program for HVAC
products and water heaters in several centers within Canada. This
rollout was completed at all 15 locations in Canada in February 2017,
and while the program is still in the very early stages, Enercare is
encouraged by the initial results which show an initial rental mix of
approximately 15% to 20% in Ontario and 7% to 10% in Western Canada
where the rental model is a new concept. The successful introduction of
our recurring revenue rental model in Canada is part of our plan to
integrate rentals throughout Service Experts residential heating and
cooling operations over the next two years to create recurring revenue.
During the first quarter of 2017, Service Experts extended the rental
HVAC offerings through a pilot in two U.S. states and subsequently
rolled out to two additional states in late March and one in early May.
The U.S. rental program is similar to Enercare’s existing Canadian
rental program, except that due to U.S. regulations, the rental
contracts in the United States will be for a definitive term, which in
the piloted states is 10 years. Enercare anticipates that the form of
the contract, as driven by the U.S. regulatory environment, will result
in a slower adoption of the rental program in the U.S. The preliminary
rental mix of total HVAC origination in the United States was in the 3%
to 5% range after our soft launch.
— The business of Service Experts is subject to greater seasonality than
Enercare Home Services as a result of it having fewer recurring revenue
sources. Revenue and EBITDA tend to be seasonally highest in the second
quarter of the year, followed by the third quarter, and substantially
less in the fourth and first quarters, due primarily to the geography
where Service Experts operates and weather patterns. The heating season
(roughly November through February) and cooling season (roughly May
through August) are periods when consumers transition their buying
patterns from one season to the next. In most of the states that
Services Experts operates, cooling equipment as opposed to heating
equipment represents a substantial portion of its annual HVAC sales and
service revenue. Conversely, in the three provinces that Service Experts
operates, heating equipment represents a large portion of its Canadian
sales and service revenue. The sales are also impacted by seasonal
weather patterns; in periods of extreme heat and cold, installation and
demand service revenue tend to increase. This results in higher sales in
the second and third quarters due to the higher volume in the cooling
season relative to the heating season and the lowest revenue and
substantially reduced EBITDA, relative to other quarters, in the first
quarter. Service Experts normally generates a neutral level of
profitability in the first quarter of the year and as a result the
working capital needs are generally greater in the first quarter,
followed by higher operating cash inflows in the second and third
quarters.

/T/

Sub-metering Segment

/T/

— In respect of Sub-metering, our priorities for 2017 will be to continue

to grow EBITDA by increasing contract sales. Other key priorities
include reducing the capital spend per unit for new installations and
introducing new products and services.
— During the first quarter of 2017, we continued to experience the trend
that almost one-half of our contracted units were for thermal, gas or
water sub-metering. The majority of all new construction contracts are
for both electricity and water sub-metering services, which contributes
to lower billing costs over time as multiple products will be invoiced
on a single bill.
— Sub-metering sales opportunities continue to be strong and skewed
towards multi-commodity products within the new construction and
condominium segments. During the first quarter of 2017, over three-
quarters of the newly contracted services have come from new
construction condominiums and rental properties. Although the buildings
related to these contracts have yet to be constructed and as a result
the bulk of the capital and all of the related revenues will occur in 24
to 36 months, once constructed, all units within these buildings will
start billing on initial move-in. This is in contrast to retrofit
apartment contracts for which installation starts sooner, but billing
lags as it is reliant on tenant turnover.
— Sub-metering plans to continue to negotiate new contracts with existing
clients as they approach the end of their original contracts. Each of
these negotiations are unique and competitive pressure will likely
result in re-negotiated fees being below those of the original
contracts.
— During the first quarter, sub-metering introduced a new commercial
service offering through a controlled launch process. This offering
compliments our recently launched commercial consolidation billing
solution and brings additional features, such as tenant level
consumption reporting and client options to purchase the meters. This
new offering will be installed in approximately 20 buildings over the
remainder of 2017 and will be promoted to general availability in the
third quarter of 2017.

/T/

Corporate

/T/

— Consistent with previous guidance, Enercare estimates that it will

recognize approximately $23 million to $29 million in current income tax
expense for the fiscal year ending December 31, 2017. This estimate
assumes corporate tax rates of approximately 26.5% in Canada and 39% in
the US. Taxable income is principally impacted by changes in revenue,
operating expenses, potential acquisitions or divestitures, appropriate
tax planning and capital expenditures through the capital cost allowance
deduction.
— Consistent with previous guidance, Enercare is targeting a range of
between $167 million and $192 million in capital investments in 2017,
primarily reflecting higher unit costs due to higher end product
originations, higher sales volumes and higher corporate spending on
platforms for innovation and growth to enable future product offerings,
including smart home products for a connected home.

/T/

/T/

—————————————————————————-
Capital Expenditure(1) Target Range for 2017
—————————————————————————-
HVAC rentals $46M – $52M
—————————————————————————-
Water heater additions $35M – $39M
—————————————————————————-
Water heater exchanges $32M – $36M
—————————————————————————-
Sub-metering growth $17M – $21M
—————————————————————————-
In-house financing(2) $5M – $ 8M
—————————————————————————-
Corporate and building(3) $32M – $36M
—————————————————————————-
Total range $167M – $192M(4)
—————————————————————————-

/T/

(1) Excludes acquisitions.
(2) In-house financing represents the increase in financing receivables
related to the program.
(3) Corporate capital includes IT software and hardware, furniture and
fixtures and other capital projects. The building relates to a new head office
purchased in Q2 of 2016 including renovations continuing into the early part
of 2017.
(4) The target range of capital spend for the Enercare Home Service and
Service Experts businesses are largely based on the number and type of
equipment originated (assumed to be approximately 26,000 water heater and
water treatment rental additions, 42,000 water heater exchanges and 14,500
HVAC rental additions) and the mix between rental, sales and financing
arrangements similar to actual results experienced in the last 12 months of
operations. The target range for capital spend in the Sub-metering business is
based on the number and type of metering equipment installed during the year
assumed to be approximately 18,000 units.

Financial Statements and Management’s Discussion and Analysis

Enercare’s financial statements and management’s discussion and analysis for
the period ended March 31, 2017 are available on SEDAR at www.sedar.com or on
Enercare’s investor relations website at www.enercareinc.com.

Conference Call and Webcast

Management will host a conference call and live audio webcast to discuss
Enercare’s financial results for the first quarter ended March 31, 2017 this
morning at 10:00 a.m. ET. John Macdonald, President and CEO, and Evelyn
Sutherland, CFO, will review Enercare’s results and discuss the quarter’s
operating highlights.

Those wishing to listen to the teleconference may access the live webcast as
follows:

/T/

Date: Friday, May 12, 2017
Time: 10:00 a.m. – 11:00 a.m. (ET)
By telephone: 647.427.2311 or 1.866.521.4909
Please allow 10 minutes to be connected to the conference
call.
Webcast: http://event.on24.com/wcc/r/1380375-
1/47B8CB873B0C813B6A83B38216BAEC94
Note: this is a listen-only audio webcast. Media Player or
Real Player is required to listen to the broadcast.
Replay: An archived audio webcast will be available at
www.enercareinc.com for one year following the original
broadcast.
Note: A slide presentation intended for simultaneous viewing with
the conference call will be available the morning of Friday,
May 12, 2017 at www.enercareinc.com.

/T/

Cautionary Note Regarding Forward-looking Statements

This news release contains certain forward-looking statements within the
meaning of applicable Canadian securities laws (“forward-looking statements”
or “forward-looking information”) that involve various risks and uncertainties
and should be read in conjunction with Enercare’s 2016 audited consolidated
financial statements. Additional information in respect of Enercare, including
the Annual Information Form of Enercare dated March 31, 2017 (“AIF”), can be
found on SEDAR at www.sedar.com.

Statements other than statements of historical fact contained in this news
release may be forward-looking statements, including, without limitation,
management’s expectations, intentions and beliefs concerning anticipated
future events, results, circumstances, economic performance or expectations
with respect to Enercare, including Enercare’s business operations, business
strategy and financial condition. When used herein, the words “anticipates”,
“believes”, “budgets”, “could”, “estimates”, “expects”, “forecasts”, “goal”,
“intends”, “may”, “might”, “outlook”, “plans”, “projects”, “schedule”,
“should”, “strive”, “target”, “will”, “would” and similar expressions are
often intended to identify forward-looking information, although not all
forward-looking information contains these identifying words. These
forward-looking statements may reflect the internal projections, expectations,
future growth, results of operations, performance, business prospects and
opportunities of Enercare and are based on information currently available to
Enercare and/or assumptions that Enercare believes are reasonable. Many
factors could cause actual results to differ materially from the results and
developments discussed in the forward-looking information.

In developing these forward-looking statements, certain material assumptions
were made. These forward-looking statements are also subject to certain risks.
These factors include, but are not limited to:

/T/

— actual future market conditions being different than anticipated by

management;
— the failure to realize the anticipated benefits of the SE Transaction,
strategic initiatives and tax efficiencies;
— the risk that the pilot and subsequent roll out of rental HVAC offerings
in 5 states in the United States does not realize anticipated results as
the rental model is a new concept in this industry in the United States;
and
— the risks and uncertainties described under “Risk Factors” in the AIF.

/T/

Material factors or assumptions that were applied to drawing a conclusion or
making an estimate set out in forward-looking statements include:

/T/

— the view of management regarding current and anticipated market

conditions;
— industry trends remaining unchanged;
— the financial and operating attributes of Enercare and Service Experts
as at the date hereof and the anticipated future performance of Enercare
and Service Experts;
— assumptions regarding the volume and mix of business activities
remaining consistent with current trends;
— assumptions regarding the interest rate of the 2016 Term Loan, foreign
exchange rates and commodity prices; and
— the number of Shares outstanding remaining constant.

/T/

There can be no assurance that the anticipated strategic benefits and
operational, competitive and cost synergies from the SE Transaction will be
realized. There can be no assurance that recent results from the introduction
of the rental model to Service Experts in Canada and the United States are
indicative of future results.

Readers are cautioned that the preceding list of material factors or
assumptions is not exhaustive. Although forward-looking statements contained
in this news release are based upon what management believes are reasonable
assumptions, there can be no assurance that actual results will be consistent
with these forward-looking statements. Accordingly, readers should not place
undue reliance on such forward-looking statements and assumptions as
management cannot provide assurance that actual results or developments will
be realized or, even if substantially realized, that they will have the
expected consequences to, or effects on, Enercare. All forward-looking
information in this news release is made as of the date of this news release.
These forward-looking statements are subject to change as a result of new
information, future events or other circumstances, in which case they will
only be updated by Enercare where required by law.

About Enercare

Enercare is headquartered in Toronto, Ontario, Canada and is publicly traded
on the Toronto Stock Exchange (TSX: ECI). As one of North America’s largest
home and commercial services and energy solutions companies with approximately
4,500 employees under its Enercare and Service Experts brands, Enercare is a
leading provider of water heaters, water treatment, furnaces, air conditioners
and other HVAC rental products, plumbing services, protection plans and
related services. With operations in Canada and the United States, Enercare
serves approximately 1.6 million customers annually. Enercare is also the
largest non-utility sub-meter provider, with electricity, water, thermal and
gas metering contracts for condominium and apartment suites in Canada and
through its Triacta brand, a premier designer and manufacturer of advanced
sub-meters and sub-metering solutions.

For more information on Enercare visit www.enercare.ca. Additional information
regarding Enercare is available on SEDAR at www.sedar.com.

Source: Enercare Inc.

– END RELEASE – 12/05/2017

For further information:

For further information, please contact:

Evelyn Sutherland
CFO
1.416.649.1860
[email protected]

COMPANY:
FOR: ENERCARE INC.
TSX Symbol: ECI

INDUSTRY: Energy and Utilities – Alternative Energy, Energy and Utilities –
Coal, Energy and Utilities – Equipment, Energy and Utilities –
Nuclear, Energy and Utilities – Oil and Gas, Energy and Utilities –
Pipelines, Energy and Utilities – Utilities, Energy and Utilities –
Clean Technology

RELEASE ID: 20170512CC001

Press Release from Marketwired 1-866-736-3779

All press releases are written by the client and have NO affiliation with the news copy written by The Canadian Press. Any questions that arise due to the content or information provided in the press release should be directed to the company/organization
issuing the release, not to The Canadian Press.

GET ENERGYNOW’S DAILY EMAIL FOR FREE


Sunshine Oilsands Ltd.: Announcement of Results for the First Quarter Ended March 31, 2017 and an Update on West Ells Progress

FOR: SUNSHINE OILSANDS LTD.
HKSE SYMBOL: 2012

Date issue: May 12, 2017
Time in: 5:23 AM e

Attention:

HONG KONG, CHINA and CALGARY, ALBERTA–(Marketwired – May 12, 2017) – Sunshine
Oilsands Ltd. (the “Corporation” or “Sunshine”) (HKSE:2012) today announced its
financial results for the first quarter ended March 31, 2017. The Corporation’s
condensed consolidated interim financial statements, notes to the condensed
consolidated interim financial statements and management’s discussion and
analysis have been filed on SEDAR (www.sedar.com) and with The Stock Exchange
of Hong Kong Limited (the “Hong Kong Stock Exchange”) (www.hkexnews.hk) and are
available on the Corporation’s website (www.sunshineoilsands.com). All figures
used in this release are in Canadian dollars unless otherwise stated.

MESSAGE TO SHAREHOLDERS

On March 1, 2017, the Corporation achieved a key milestone. The Project
commenced commercial production. Hence, effective March 1, 2017, the
Corporation started recording revenue, expenses and depletion of the West Ells
Project in the Statement of Operations and Comprehensive Loss. For one month
ended March 31, 2017, the average bitumen production was 1,796 barrels per day
(“bbls/day”), steam to oil ratio (“SOR”) was 4.8 at this early stage of
steam-assisted gravity drainage (“SAGD”) production. Diluent is blended at a
21% volumetric rate with the bitumen as part of the production process to
create the marketable “Dilbit” blend product, and the average dilbit sales
volume was 2,272 bbls/day.

Sunshine’s Capital Raising Activities

On January 17, 2017 the Corporation entered into a subscription agreement for a
total of 60,000,000 class “A” common shares at a price of HKD $0.262 per share
(approximately CAD $0.045 per common share), for gross proceeds of HKD $15.7
million (approximately CAD $2.7 million). On January 24, 2017 the Corporation
completed the closing of this subscription agreement. In addition, a placing
commission of HKD $117,900 (approximately CAD $0.02 million), was incurred in
relation to the Closing.

On March 16, 2017 the Corporation entered into a subscription agreement for a
total of 247,350,000 class “A” common shares at a price of HKD $0.283 per share
(approximately CAD $0.050 per common share), for gross proceeds of HKD $70
million (approximately CAD $12.1 million). On March 24, 2017 the Corporation
completed the closing of this subscription agreement. In addition, a placing
commission of HKD $525,000 (approximately CAD $0.09 million), was incurred in
relation to the Closing.

On December 28, 2016, the Corporation entered into a subscription agreement
with Zhengwei International Investment and Management Co., Limited (“Zhengwei”)
under which Zhengwei agreed to subscribe for a total of up to 150,000,000 Class
“A” Common Voting Shares of the Corporation (“Common Shares”) at a price of HKD
$0.29 per Common Share or approximately CAD $0.048 per Common Share, which in
the aggregate amounts to gross proceeds of HKD $43.5 million (approximately CAD
$7.6 million). On March 28, 2017, the Corporation completed the closing of
40,000,000 Common Shares HKD $0.29 (approximately CAD $0.050 per Common Share).
The Corporation received total gross proceeds of HKD $11.6 million
(approximately CAD $2.0 million). The subscription agreement expired on the
March 28, 2017 and hence the time for the completion of the remaining
110,000,000 Common Shares has lapsed.

Subsequent to March 31, 2017, on April 5, 2017, the Corporation entered into a
Debt Settlement Agreement with a creditor for CDN $5.9 million. On April 13,
2017 the Corporation completed the closing a total of 147,874,000 shares to the
Creditor at an issue price of HKD $0.241 per Common Shares (approximately CAD
$0.041 per Common Share) pursuant to the terms and conditions of the Debt
Settlement Agreement. The issued Common Shares in this transaction are subject
to a four months holding period.

Summary of Financial Figures

The Corporation’s external auditor has not performed a review of the condensed
consolidated interim financial statements for the three months ended March 31,
2017. As at March 31, 2017 and December 31, 2016, the Corporation notes the
following selected balance sheet figures.

/T/

—————————————————————————-
(Canadian $000s) March 31, December 31,
2017 2016
—————————————————————————-
Cash $ 12,876 $ 13,635
Prepaid expense and deposits 2,259 5,054
Exploration and evaluation assets 292,237 291,716
Property, plant and equipment 688,488 684,531
Total liabilities 396,904 390,135
Shareholders’ equity 603,580 607,455
—————————————————————————-

/T/

For the first quarter of 2017, the Corporation had a net loss of $21.2 million
compared to $2.8 million for the same period in 2016, representing a net loss
per share of $0.004 for the 2017 period and $0.001 for the 2016 period.

2017 Outlook

Due to the extensive damage associated with the disastrous wild fire in Fort
McMurray in May 2016, start up at West Ells was interrupted and delayed.
Significant progress has been achieved since then. On March 1, 2017, the West
Ells Phase I project commenced commercial production. The West Ells Phase I
project is expected to ramp up to its Phase I design capacity of 5,000
bbls/day. The Corporation continues to focus on carefully improving production
performance and developing SAGD chambers, which will increase production at
West Ells.

Hong Luo
Chief Executive Officer

Qiping Men
President & Chief Operating Officer

ABOUT SUNSHINE OILSANDS LTD.

The Corporation is a Calgary based public corporation, listed on the Hong Kong
Stock Exchange since March 1, 2012. The Corporation was also listed on the
Toronto Stock Exchange from November 16, 2012 to September 30, 2015, when it
chose to voluntarily delist. The Corporation is focused on the development of
its significant holdings of oil sands and heavy oil leases in the Athabasca oil
sands region. The Corporation owns interests in oil sands and petroleum and
natural gas leases in the Athabasca region of Alberta. The Corporation is
currently focused on executing milestone undertakings in the West Ells project
area. West Ells Phase 1 is operational and has an initial production target
rate of 5,000 barrels per day.

FORWARD-LOOKING INFORMATION

This announcement contains forward-looking information relating to, among other
things, (a) the future financial performance and objectives of Sunshine; (b)
the plans and expectations of the Corporation; and (c) the anticipated closings
of the current private placements and the timing thereof. Such forward-looking
information is subject to various risks, uncertainties and other factors. All
statements other than statements and information of historical fact are
forward-looking statements. The use of words such as “estimate”, “forecast”,
“expect”, “project”, “plan”, “target”, “vision”, “goal”, “outlook”, “may”,
“will”, “should”, “believe”, “intend”, “anticipate”, “potential”, and similar
expressions are intended to identify forward-looking statements.
Forward-looking statements are based on Sunshine’s experience, current beliefs,
assumptions, information and perception of historical trends available to
Sunshine, and are subject to a variety of risks and uncertainties including,
but not limited to, those associated with resource definition and expected
reserves and contingent and prospective resources estimates, unanticipated
costs and expenses, regulatory approval, fluctuating oil and gas prices,
expected future production, the ability to access sufficient capital to finance
future development and credit risks, changes in Alberta’s regulatory framework,
including changes to regulatory approval process and land-use designations,
royalty, tax, environmental, greenhouse gas, carbon and other laws or
regulations and the impact thereof and the costs associated with compliance.
Although Sunshine believes that the expectations represented by such
forward-looking statements are reasonable, there can be no assurance that such
expectations will prove to be correct. Readers are cautioned that the
assumptions and factors discussed in this announcement are not exhaustive and
readers are not to place undue reliance on forward-looking statements as the
Corporation’s actual results may differ materially from those expressed or
implied. Sunshine disclaims any intention or obligation to update or revise any
forward-looking statements as a result of new information, future events or
otherwise, subsequent to the date of this announcement, except as required
under applicable securities legislation. The forward-looking statements speak
only as at the date of this announcement and are expressly qualified by these
cautionary statements. Readers are cautioned that the foregoing lists are not
exhaustive and are made as at the date hereof. For a full discussion of the
Corporation’s material risk factors, see the Corporation’s annual information
form for the year ended December 31, 2016 and risk factors described in other
documents we file from time to time with securities regulatory authorities, all
of which are available on the Hong Kong Stock Exchange at www.hkexnews.hk, on
the SEDAR website at www.sedar.com or the Corporation’s website at
www.sunshineoilsands.com.

By Order of the Board of Sunshine Oilsands Ltd.

Sun Kwok Ping, Executive Chairman

Hong Kong, May 12, 2017

Calgary, May 11, 2017

As at the date of this announcement, the Board consists of Mr. Kwok Ping Sun,
Mr. Hong Luo, Dr. Qi Jiang and Mr. Qiping Men as executive directors; Mr.
Michael John Hibberd, Mr. Linna Liu and Ms. Xijuan Jiang as non- executive
directors; and Mr. Raymond Shengti Fong, Mr. Gerald Franklin Stevenson, Ms.
Joanne Yan and Mr. Yi He as independent non-executive directors.

Hong Kong Exchanges and Clearing Limited and The Stock Exchange of Hong Kong
Limited take no responsibility for the contents of this announcement, make no
representation as to its accuracy or completeness and expressly disclaim any
liability whatsoever for any loss howsoever arising from or in reliance upon
the whole or any part of the contents of this announcement.

This announcement appears for information purpose only and does not constitute
an invitation or offer to acquire, purchase or subscribe for securities of
Sunshine Oilsands Ltd.

(i) For identification purposes only

(a corporation incorporated under the Business Corporations Act of the Province
of Alberta, Canada with limited liability)

– END RELEASE – 12/05/2017

For further information:
Sunshine Oilsands Ltd.
Mr. Hong Luo
Chief Executive Officer
(1) (403) 930-5677
OR
Sunshine Oilsands Ltd.
Qiping Men
President & Chief Operating Officer
(1) (403) 984-5142
[email protected]
www.sunshineoilsands.com

COMPANY:
FOR: SUNSHINE OILSANDS LTD.
HKSE SYMBOL: 2012

INDUSTRY: Energy and Utilities – Oil and Gas
RELEASE ID: 20170512CC0003

Press Release from Marketwired 1-866-736-3779

All press releases are written by the client and have NO affiliation with the news copy written by The Canadian Press. Any questions that arise due to the content or information provided in the press release should be directed to the company/organization
issuing the release, not to The Canadian Press.

GET ENERGYNOW’S DAILY EMAIL FOR FREE


10 Must See Events and Features at the Global Petroleum Show (GPS 2017) – See Them HERE

There are more reasons than ever to attend GPS this year with a vast amount of conferences, seminars, networking, and education events – there is something for everyone! Register   Specialty Zone Areas Clean Technology, Pipeline, Digital Oilfield, Transport & Logistics, and Water Innovation. Each of these zones brings together industry leaders to feature new … Read more

GET ENERGYNOW’S DAILY EMAIL FOR FREE


Critical Control Announces Private Placement and Plan of Arrangement

FOR: CRITICAL CONTROL ENERGY SERVICES CORP.
TSX SYMBOL: CCZ

Date issue: May 11, 2017
Time in: 9:17 PM e

Attention:

CALGARY, ALBERTA–(Marketwired – May 11, 2017) – Critical Control Energy
Services Corp. (“Critical Control” or the “Corporation”) (TSX:CCZ) announces
that it intends to complete a non-brokered private placement of units (the
“Units”) consisting of a newly created class of Series A Preferred Shares (the
“Preferred Shares”) and common share purchase warrants (the “Warrants”) for
gross proceeds of a minimum of $3,000,000 to a maximum of $5,000,000 (the
“Offering”). Contemporaneously with the Offering, the Corporation intends on
issuing $4,650,000 of Preferred Shares to the current common shareholders of
the Corporation in exchange for some or all of their existing common shares
(the “Arrangement”).

“The completion of the Offering will immediately improve the Corporation’s
balance sheet, liquidity and cash flow,” said Alykhan Mamdani, President and
CEO of Critical Control. “In management’s opinion, the creation of the
Preferred Share combined with both the Offering and the Arrangement improves
the Corporation’s capital structure by providing greater long term flexibility
to finance growth.”

The Corporation currently has no shares outstanding other than common shares.
The Preferred Shares underlying the Offering and the Arrangement will have a
$2.00 deemed value and a maximum of 4,825,000 Preferred Shares will be
distributed pursuant to the Offering and the Arrangement. The Preferred Shares
will entitle the holders to an 8% cumulative dividend paid quarterly, will be
redeemable by the Corporation after 5 years from initial issuance, and the
cumulative dividend rate shall be reset after the 5-year anniversary to be the
Canada 5-year bond rate plus 5%, with a minimum rate of 8%.

The Offering

The Offering will be for a minimum of 1,500,000 and a maximum of 2,500,000
Units at $2.00 per Unit. Each unit shall consist of one Preferred Share with a
$2.00 deemed value and one Warrant to acquire one common share of the
Corporation for $0.20 per common share. Each Warrant shall expire 2 years from
the date on which it is issued.

Any closing of subscriptions for the Offering (the “Closing”) is subject to the
subscription of a minimum of 1.5 million units for minimum proceeds of $3.0
million. The Closing will also be subject to the completion of the Arrangement
and the approval of the Toronto Stock Exchange to list the Preferred Shares on
the Toronto Stock Exchange.

Management and Directors of the Corporation are expected to subscribe for
375,000 Units, for total gross proceeds of $750,000. Closing is expected to
occur with the Arrangement on or about June 30, 2017.

The Offering is expected to be non-brokered and shall be completed upon
reliance on exemptions from the prospectus requirements of applicable
securities regulations. Subscribers to the Units shall have statutorily imposed
hold periods attributed to the Preferred Shares acquired thereunder and to the
common shares acquired from the issuance of the Warrants. The Offering may be
subject to a finder’s fee.

Proceeds of the Offering will be used to reduce the Corporation’s bank debt.

The Arrangement

The Arrangement will allow existing holders of common shares of the Corporation
to exchange any portion of their common shares for Preferred Shares on the
basis of one Preferred Share for every 12.9 common shares they tender for
conversion. This exchange ratio is based upon a conversion rate of $2.00 per
Preferred Share and a price of $0.155 per common share, representing a premium
of 14.8% over the closing price of the common shares on the Toronto Stock
Exchange on May 11, 2017.

Under the Arrangement, holders of common shares will not be required to
exchange their common shares under the Arrangement and may elect to keep some
or all of their common shares. A maximum of 29,992,500 common shares will be
exchanged for a maximum of 2,325,000 Preferred Shares under the Arrangement. In
the event holders of common shares in aggregate elect to receive more than
2,325,000 Preferred Shares, the maximum number of Preferred Shares shall be
distributed to them on a pari passu basis based upon their election. In the
event the holders of common shares in aggregate elect to receive less than
2,325,000 Preferred Shares, the remaining Preferred Shares will be distributed
pro rata to those holders of common shares who do not make a valid election
subject to a maximum of 2,325,000 Preferred Shares being distributed pursuant
to the Arrangement and in accordance with the aforementioned exchange ratio.

Details of the Arrangement will be distributed to the holders of the common
shares in an information circular associated with the Corporation’s Annual and
Special Meeting to be held in Calgary on June 29, 2017 (the “Meeting”). The
Arrangement is expected to be completed on or about June 30, 2017 through a
statutory plan of arrangement under section 193 of the Business Corporation Act
(Alberta), which will be subject to court approval and approval of the
shareholders of the Corporation at the Meeting. In addition, the Arrangement
will also be contingent upon the Corporation reaching the minimum Offering.

About Critical Control

Critical Control provides solutions for the collection, control and analysis of
measurement and operational data related to oil and gas wells across North
America. We provide services to capture the data, cloud-based software to
visualize and manage it and the business intelligence to make quicker and more
informed operational decisions.

Forward-Looking Information

This press release contains “forward-looking information” within the meaning of
Canadian securities legislation. Forward-looking information generally refers
to disclosure about an issuer’s business, capital, or operations that is
prospective in nature, and includes future-oriented financial information about
the issuer’s prospective financial performance or financial position.

The forward-looking information in this press release relates to the proposed
terms and anticipated benefits of the Arrangement and the Offering. No
assurance can be given that the Arrangement or the Offering will close on these
terms or that the Arrangement and the Offering will close at all. Actual
results could differ materially from those anticipated in this press release
due to prevailing economic conditions, failure to obtain the requisite
regulatory and security holders approvals, and other factors, many of which are
beyond the control of the Corporation.

The Corporation assumes no obligation to update or revise the forward-looking
information in this press release, unless it is required to do so under
Canadian securities legislation.

– END RELEASE – 11/05/2017

For further information:
Critical Control Energy Services Corp.
Alykhan Mamdani
President & CEO
(403) 705-7500

COMPANY:
FOR: CRITICAL CONTROL ENERGY SERVICES CORP.
TSX SYMBOL: CCZ

INDUSTRY: Computers and Software – Software
RELEASE ID: 20170511CC0146

Press Release from Marketwired 1-866-736-3779

All press releases are written by the client and have NO affiliation with the news copy written by The Canadian Press. Any questions that arise due to the content or information provided in the press release should be directed to the company/organization
issuing the release, not to The Canadian Press.

GET ENERGYNOW’S DAILY EMAIL FOR FREE


Chinook Energy Inc. Announces Approval of All Resolutions at 2017 Annual and Special Meeting

FOR: CHINOOK ENERGY INC.TSX SYMBOL: CKEDate issue: May 11, 2017Time in: 7:42 PM eAttention:
CALGARY, ALBERTA–(Marketwired – May 11, 2017) – Chinook Energy Inc. (TSX:CKE)
(“Chinook”) is pleased to announce the voting results from its annual and
specia…

GET ENERGYNOW’S DAILY EMAIL FOR FREE


Enbridge Inc. Announces AGM Voting Results and Election of Directors

FOR: ENBRIDGE INC.TSX SYMBOL: ENBNYSE SYMBOL: ENBDate issue: May 11, 2017Time in: 7:38 PM eAttention:
CALGARY, ALBERTA–(Marketwired – May 11, 2017) – Enbridge Inc.
(TSX:ENB)(NYSE:ENB) (Enbridge or the Company) held its Annual General Meeting
today, t…

GET ENERGYNOW’S DAILY EMAIL FOR FREE


High Arctic Announces AGM Results

FOR: HIGH ARCTIC ENERGY SERVICES INC.
TSX SYMBOL: HWO

Date issue: May 11, 2017
Time in: 7:20 PM e

Attention:

CALGARY, ALBERTA–(Marketwired – May 11, 2017) –

NOT FOR DISTRIBUTION TO U.S. NEWSWIRE SERVICES OR FOR DISSEMINATION IN THE
UNITED STATES. ANY FAILURE TO COMPLY WITH THIS RESTRICTION MAY CONSTITUTE A
VIOLATION OF U.S. SECURITIES LAW

High Arctic Energy Services Inc. (TSX:HWO) (“High Arctic” or the “Corporation”)
is pleased to announce the results of the Annual General and Special Meeting of
the shareholders of High Arctic held on May 10, 2017. All matters put forth
were approved, including the election of each nominee named in the
Corporation’s information circular dated April 5, 2017 as directors of the
Corporation. The detailed results of the vote for the election of directors,
which was conducted by ballot, are set out below:

/T/

VOTES
VOTES FOR WITHHELD/ABSTAINED
——————– ————————
99.53% 0.47%
Thomas M. Alford (32,900,331) (154,742)

99.53% 0.47%
Simon P. D. Batcup (32,898,075) (156,998)

99.25% 0.75%
Michael R. Binnion (32,806,155) (248,918)

97.48% 2.52%
Daniel J. Bordessa (32,221,848) (833,225)

99.53% 0.47%
Steven R. Vasey (32,899,839) (155,234)

99.32% 0.68%
Honourable Joe Oliver (32,829,178) (225,895)

99.42% 0.58%
Ember W.M. Shmitt (32,862,226) (192,847)

/T/

In addition to the annual resolutions, including the re-appointment of
PricewaterhouseCoopers LLP, Chartered Accountants, as auditors, resolutions
were passed approving certain amendments to the Corporation’s Stock Option Plan
and approving the adoption of a Performance Share Unit Plan and a Deferred
Share Unit Plan for the Corporation.

About High Arctic

High Arctic is a publicly traded company listed on the Toronto Stock Exchange
under the symbol “HWO”. The Corporation’s principal focus is to provide
drilling and specialized well completion services, equipment rentals and other
services to the oil and gas industry.

High Arctic’s largest operation is in Papua New Guinea where it provides
drilling and specialized well completion services and supplies rig matting,
camps and drilling support equipment on a rental basis. The Canadian operation
provides well servicing, snubbing services, nitrogen supplies and equipment on
a rental basis to a large number of oil and natural gas exploration and
production companies operating in Western Canada.

– END RELEASE – 11/05/2017

For further information:
Thomas Alford
Interim President & CEO
587-318-3826
[email protected]
OR
Brian Peters
Chief Financial Officer
587-318-2218
[email protected]

COMPANY:
FOR: HIGH ARCTIC ENERGY SERVICES INC.
TSX SYMBOL: HWO

INDUSTRY: Energy and Utilities – Oil and Gas
RELEASE ID: 20170511CC0137

Press Release from Marketwired 1-866-736-3779

All press releases are written by the client and have NO affiliation with the news copy written by The Canadian Press. Any questions that arise due to the content or information provided in the press release should be directed to the company/organization
issuing the release, not to The Canadian Press.

GET ENERGYNOW’S DAILY EMAIL FOR FREE


Peyto Exploration & Development Corp. Announces Results of Directors Vote

FOR: PEYTO EXPLORATION & DEVELOPMENT CORP.
TSX SYMBOL: PEY

Date issue: May 11, 2017
Time in: 6:54 PM e

Attention:

CALGARY, ALBERTA–(Marketwired – May 11, 2017) – Peyto Exploration &
Development Corp. (TSX:PEY) (“Peyto”) is pleased to announce that the nominees
listed in the information circular – proxy statement dated March 22, 2017 were
elected as directors of Peyto at Peyto’s annual meeting held May 11, 2017. The
detailed results of the vote for the election of directors held at Peyto’s
annual meeting of shareholders today are set out below.

Election of Directors

On a vote by ballot, each of the following seven nominees proposed by
management was elected as a director of Peyto:

/T/

Outcome
Nominee of Vote Votes For Votes Withheld
—————————– ——— —————- —————-
Donald Gray Elected 84,358,133 30,027,252
Michael MacBean Elected 111,171,841 3,213,544
Brian Davis Elected 111,299,045 3,086,340
Darren Gee Elected 89,666,706 24,718,679
Gregory Fletcher Elected 100,255,619 14,129,766
Stephen Chetner Elected 76,292,800 38,092,585
Scott Robinson Elected 81,896,881 32,488,504

/T/

– END RELEASE – 11/05/2017

For further information:
Peyto Exploration & Development Corp.
Darren Gee
President and Chief Executive Officer
(403) 237-8911
(403) 451-4100 (FAX)

COMPANY:
FOR: PEYTO EXPLORATION & DEVELOPMENT CORP.
TSX SYMBOL: PEY

INDUSTRY: Energy and Utilities – Oil and Gas
RELEASE ID: 20170511CC0134

Press Release from Marketwired 1-866-736-3779

All press releases are written by the client and have NO affiliation with the news copy written by The Canadian Press. Any questions that arise due to the content or information provided in the press release should be directed to the company/organization
issuing the release, not to The Canadian Press.

GET ENERGYNOW’S DAILY EMAIL FOR FREE


TransGlobe Energy Corporation Reports Voting Results

FOR: TRANSGLOBE ENERGY CORPORATIONTSX SYMBOL: TGLNASDAQ SYMBOL: TGADate issue: May 11, 2017Time in: 6:48 PM eAttention:
CALGARY, ALBERTA–(Marketwired – May 11, 2017) – TransGlobe Energy Corporation
(“TransGlobe”) (TSX:TGL)(NASDAQ:TGA) announced the v…

GET ENERGYNOW’S DAILY EMAIL FOR FREE


Bri-Chem Announces First Quarter 2017 Financial Results

FOR: BRI-CHEM CORP.TSX SYMBOL: BRYDate issue: May 11, 2017Time in: 6:37 PM eAttention:
EDMONTON, ALBERTA–(Marketwired – May 11, 2017) –
NOT FOR DISTRIBUTION TO U.S. NEWSWIRE SERVICES OR FOR DISSEMINATION IN THE U.S.
Bri-Chem Corp. (“Bri-Chem” or “Com…

GET ENERGYNOW’S DAILY EMAIL FOR FREE


Africa Oil 2017 First Quarter Financial and Operating Results

FOR: AFRICA OIL CORP.
TSX SYMBOL: AOI
OMX SYMBOL: AOI

Date issue: May 11, 2017
Time in: 6:15 PM e

Attention:

VANCOUVER, BRITISH COLUMBIA–(Marketwired – May 11, 2017) – Africa Oil Corp.
(TSX:AOI)(OMX:AOI) (“Africa Oil” or the “Company”) is pleased to announce its
financial and operating results for the three months ended March 31, 2017.

As at March 31, 2017, the Company had cash of $450.1 million and working
capital of $419.0 million as compared to cash of $463.1 million and working
capital of $435.0 million at December 31, 2016. The Company continues to work
closely with its Joint Venture Partners to focus efforts on advancing the South
Lokichar Basin development in Blocks 10BB and 13T (Kenya) by undertaking
activities aimed at increasing resources and resource certainty while
progressing development studies and planning. We are pleased to have
recommenced drilling activities in the South Lokichar Basin during the fourth
quarter of 2016 and to have agreed with our Joint Venture Partners to extend
the ongoing exploration and drilling campaign in the South Lokichar Basin.

In addition to the drilling and operational activities to support the South
Lokichar Final Investment Decision for the Kenya Full Field Development by the
end of 2018, engineering studies and contracting activities are underway in
preparation for the start of Front End Engineering Design (FEED), which is
expected in the second half of 2017. In parallel to the upstream development
work, the Kenya Joint Venture and the Government of Kenya continue to progress
the export pipeline commercial and finance studies and preparations are under
way for the Environmental Social Impact Assessment and FEED which are also
planned for the second half of 2017. The Kenya crude export pipeline is
expected to run from South Lokichar to the Kenyan port of Lamu.

The Company has completed the following significant operational activities
during and subsequent to the first quarter of 2017:

/T/

— During January 2017, the Company announced that the Erut-1 well in Block

13T, Northern Kenya, discovered a gross oil interval of 55 meters with
25 meters of net oil pay at a depth of 700 meters, extending the proven
oil limits to the northernmost end of the South Lokichar Basin;
— The Amosing-6 well was drilled in Block 10BB, near the basin bounding
fault, and encountered 35 metres of net gas and oil pay;
— The Ngamia-10 well was drilled in an untested fault compartment and
encountered 65 metres of net oil pay. The data from these appraisal
wells will be incorporated into the ongoing field development planning
activities;
— Following completion of the Ngamia-10 well, the rig was moved to the
previously drilled Etom-2 well to prepare the well for a Drill Stem
Test. The rig is currently drilling the fourth well of this campaign,
the Emekuya exploration well, which will target the north-eastern flank
of the Etom Complex;
— The EOPS Agreement between the Kenya Joint Venture and the Government of
Kenya was signed on 14 March 2017 allowing all EOPS upstream contracts
to be awarded. The first stage of the EOPS will be the evacuation of the
stored crude oil, which was produced during extended well testing in
2015, to Mombasa by road. This will be followed by EOPS production of
2,000 bopd in the fourth quarter of 2017. The EOPS will provide
important information which will assist in full field development
planning;
— Water injection testing on the Amosing-2A, Amosing-3, and Ngamia-5 wells
has been successfully concluded, achieving good water injection rates
and proving the feasibility of water injection for the development of
these fields. This success has enabled the Ngamia-11 water flood pilot
to be incorporated into the EOPS activities which, along with the
dynamic data collected from previous tests, will be used to finalize
reservoir characteristics for the Field Development Plan.

/T/

2017 First Quarter Financial Results

/T/

Results of Operations

(Thousands United States Dollars)
(unaudited)

—————————————————————————-

Three months Three months
ended ended
March 31, March 31,
(thousands) 2017 2016
—————————————————————————-
Salaries and benefits $ 250 $ 459
Equity-based compensation 455 690
Travel 197 184
Office and general 57 33
Donation 850 550
Depreciation 25 2
Professional fees 110 1,276
Stock exchange and filing fees 187 137
Share of loss from equity investment 280 341
—————————————————————————-
Operating expenses $ 2,411 $ 3,672
—————————————————————————-

/T/

Operating expenses decreased $1.3 million during the first quarter of 2017
compared to the same period in 2016. The $1.1 million decrease in professional
fees relates to increased cost during the first quarter of 2016 related to the
completion of the farmout transaction with Maersk. Salaries and benefits
decreased $0.2 million during the first quarter of 2017 compared to the same
period in 2016 due to the recovery of costs relating to the secondment of an
employee. These decreases were offset by a $0.9 million donation to the Lundin
Foundation during the first quarter of 2017 compared to a $0.6 million donation
during the first quarter of 2016.

/T/

Financial income and expense is made up of the following items:

(Thousands of United States Dollars)
(unaudited)

—————————————————————————-
For the three months ended March 31, March 31,
2017 2016
—————————————————————————-

Interest and other income $ 769 $ 366
Bank charges (11) (7)
Foreign exchange loss 12 (49)
—————————————————————————-

Finance income $ 781 $ 366
Finance expense $ (11) $ (56)
—————————————————————————-

/T/

The Company holds the vast majority of its cash on hand in US dollars, the
Company’s functional currency. Interest Income fluctuates in accordance with
cash balances, the currency that the cash is held in, and prevailing market
interest rates.

/T/

Consolidated Balance Sheets

(Thousands United States Dollars)
(unaudited)

—————————————————————————-

March December
31, 2017 31, 2016
—————————————————————————-

ASSETS

Current assets
Cash and cash equivalents $ 450,080 $ 463,061
Accounts receivable 331 213
Due from related party 71 57
Prepaid expenses 1,084 1,155
—————————————————————————-
451,566 464,486
Long-term assets
Equity investment 7,050 7,330
Property and equipment 174 197
Intangible exploration assets 549,800 534,929
—————————————————————————-
557,024 542,456

Total assets $ 1,008,590 $ 1,006,942
—————————————————————————-

LIABILITIES AND EQUITY
Current liabilities

Accounts payable and accrued liabilities $ 32,584 $ 29,501
—————————————————————————-
32,584 29,501

Total liabilities 32,584 29,501
—————————————————————————-

Equity attributable to common shareholders

Share capital 1,290,796 1,290,389
Contributed surplus 49,476 49,677
Deficit (364,266) (362,625)
—————————————————————————-
Total equity attributable to common
shareholders 976,006 977,441
—————————————————————————-
Total liabilities and equity attributable to
common shareholders $ 1,008,590 $ 1,006,942
—————————————————————————-

/T/

Expenditures on intangible exploration assets of $14.9 million were incurred
during the three months ended March 31, 2017, which relate primarily to costs
associated with the recommencement of drilling activities in the South Lokichar
Basin and South Lokichar development studies. The Company is debt free.

/T/

Consolidated Statement of Cash Flows

(Thousands United States Dollars)
(unaudited)

—————————————————————————-
For the three months ended March 31, March 31,
2017 2016
—————————————————————————-
Cash flows provided by (used in):
Operations:
Net loss and comprehensive loss for the
period $ (1,641) $ (3,362)
Items not affecting cash:
Equity-based compensation 455 690
Depreciation 25 2
Share of loss from equity investment 280 341
Unrealized foreign exchange (gain) loss (12) 49
Changes in non-cash operating working
capital 155 (262)
—————————————————————————-
(738) (2,542)
Investing:
Property and equipment expenditures (2) –
Intangible exploration expenditures (14,871) (12,266)
Farmout proceeds received on closing – 386,970
Farmout proceeds released from
restricted cash – 52,500
Changes in non-cash investing working
capital 2,867 (5,169)
—————————————————————————-
(12,006) 422,035
Financing:
Common shares issued 304 –
Settlement of Restricted Share Units (553) –
—————————————————————————-
(249) –
Effect of exchange rate changes on cash and
cash equivalents denominated in foreign
currency 12 (49)
—————————————————————————-
Increase (decrease) in cash and cash
equivalents (12,981) 419,444
Cash and cash equivalents, beginning of the
period $ 463,061 $ 104,205
—————————————————————————-
Cash and cash equivalents, end of the period $ 450,080 $ 523,649
—————————————————————————-
Supplementary information:
Interest paid Nil Nil
Income taxes paid Nil Nil
—————————————————————————-

/T/

The following table breaks down the material components of intangible
exploration expenditures for the three months ended March 31, 2017 and 2016:

/T/

—————————————————————————-
For the three
months ended March 31, 2017 March 31, 2016
(thousands) Kenya Ethiopia Total Kenya Ethiopia Total
—————————————————————————-
Drilling and
completion $ 7,665 $ 16 $ 7,681 $ 5,332 $ (2) $ 5,330
Development studies 1,885 – 1,885 3,228 – 3,228
Exploration surveys
and studies 379 14 393 1,535 63 1,598
PSA and G&A related 4,593 319 4,912 1,878 232 2,110
—————————————————————————-
Total $ 14,522 $ 349 $ 14,871 $ 11,973 $ 293 $ 12,266
—————————————————————————-

/T/

The Company incurred $14.5 million of intangible exploration expenditures in
Kenya for three months ended March 31, 2017. Drilling and completion
expenditures primarily relate to the drilling of Erut-1 in Block 13T, the
drilling of the Ngamia-10 and Amosing-6 appraisal wells in Block 10BB as well
as the completion of the water injection testing on the Amosing-2A, Amosing-3,
and Ngamia-5 wells in Block 10BB. Development study expenditures are associated
with studies aimed at progressing towards project sanction for the South
Lokichar Basin. Exploration studies costs continue to be incurred in Kenya in
conjunction with exploration and appraisal drilling campaign which recommenced
in the fourth quarter of 2016.

The Company incurred $0.3 million of intangible exploration expenditures in
Ethiopia for the three months ended March 31, 2017, which consists of license
fees and general and administrative costs.

/T/

Consolidated Statement of Equity

(Thousands United States Dollars)
(unaudited)

—————————————————————————-

March 31, March 31,
2017 2016
—————————————————————————-

Share capital:

Balance, beginning of the period $ 1,290,389 $ 1,290,389
Exercise of options 407 –
—————————————————————————-
Balance, end of the period 1,290,796 1,290,389
—————————————————————————-
Contributed surplus:
Balance, beginning of the period $ 49,677 $ 46,353
Equity-based compensation 455 690
Settlement of Restricted Share Units (553) –
Exercise of options (103) –
—————————————————————————-
Balance, end of the period 49,476 47,043
—————————————————————————-
Deficit:
Balance, beginning of the period $ (362,625) $ (344,863)
Net loss and comprehensive loss
attributable to common shareholders (1,641) (3,362)
—————————————————————————-
Balance, end of the period (364,266) (348,225)
—————————————————————————-

Total equity $ 976,006 $ 989,207
—————————————————————————-

/T/

The Company’s unaudited consolidated financial statements, notes to the
financial statements, management’s discussion and analysis for the three months
ended March 31, 2017 and 2016, and the 2016 Annual Information Form have been
filed on SEDAR (www.sedar.com) and are available on the Company’s website
(www.africaoilcorp.com).

About Africa oil

Africa Oil Corp. is a Canadian oil and gas company with assets in Kenya and
Ethiopia. The Company is listed on the Toronto Stock Exchange and on Nasdaq
Stockholm under the symbol “AOI”.

Additional Information

This information is information that Africa Oil Corp. is obliged to make public
pursuant to the EU Market Abuse Regulation and the Swedish Securities Markets
Act. The information was submitted for publication, through the agency of the
contact person set out below, on May 11, 2017 at 3:15 p.m. Pacific Time.

FORWARD LOOKING INFORMATION

Certain statements made and information contained herein constitute
“forward-looking information” (within the meaning of applicable Canadian
securities legislation). Such statements and information (together, “forward
looking statements”) relate to future events or the Company’s future
performance, business prospects or opportunities. Forward-looking statements
include, but are not limited to, statements with respect to estimates of
reserves and or resources, future production levels, future capital
expenditures and their allocation to exploration and development activities,
future drilling and other exploration and development activities, ultimate
recovery of reserves or resources and dates by which certain areas will be
explored, developed or reach expected operating capacity, that are based on
forecasts of future results, estimates of amounts not yet determinable and
assumptions of management.

All statements other than statements of historical fact may be forward-looking
statements. Statements concerning proven and probable reserves and resource
estimates may also be deemed to constitute forward-looking statements and
reflect conclusions that are based on certain assumptions that the reserves and
resources can be economically exploited. Any statements that express or involve
discussions with respect to predictions, expectations, beliefs, plans,
projections, objectives, assumptions or future events or performance (often,
but not always, using words or phrases such as “seek”, “anticipate”, “plan”,
“continue”, “estimate”, “expect, “may”, “will”, “project”, “predict”,
“potential”, “targeting”, “intend”, “could”, “might”, “should”, “believe” and
similar expressions) are not statements of historical fact and may be
“forward-looking statements”. Forward-looking statements involve known and
unknown risks, uncertainties and other factors that may cause actual results or
events to differ materially from those anticipated in such forward-looking
statements. The Company believes that the expectations reflected in those
forward-looking statements are reasonable, but no assurance can be given that
these expectations will prove to be correct and such forward-looking statements
should not be unduly relied upon. The Company does not intend, and does not
assume any obligation, to update these forward- looking statements, except as
required by applicable laws. These forward-looking statements involve risks and
uncertainties relating to, among other things, changes in oil prices, results
of exploration and development activities, uninsured risks, regulatory changes,
defects in title, availability of materials and equipment, timeliness of
government or other regulatory approvals, actual performance of facilities,
availability of financing on reasonable terms, availability of third party
service providers, equipment and processes relative to specifications and
expectations and unanticipated environmental impacts on operations. Actual
results may differ materially from those expressed or implied by such
forward-looking statements.

ON BEHALF OF THE BOARD

“Keith C. Hill”

President and CEO

– END RELEASE – 11/05/2017

For further information:
Sophia Shane
Corporate Development
(604) 689-7842

COMPANY:
FOR: AFRICA OIL CORP.
TSX SYMBOL: AOI
OMX SYMBOL: AOI

INDUSTRY: Energy and Utilities – Oil and Gas
RELEASE ID: 20170511CC0127

Press Release from Marketwired 1-866-736-3779

All press releases are written by the client and have NO affiliation with the news copy written by The Canadian Press. Any questions that arise due to the content or information provided in the press release should be directed to the company/organization
issuing the release, not to The Canadian Press.

GET ENERGYNOW’S DAILY EMAIL FOR FREE


Serinus Announces Q1 2017 Financial and Operating Results

FOR: SERINUS ENERGY INC.
TSX SYMBOL: SEN
WARSAW SYMBOL: SEN

Date issue: May 11, 2017
Time in: 6:10 PM e

Attention:

CALGARY, ALBERTA–(Marketwired – May 11, 2017) – Serinus Energy Inc.
(TSX:SEN)(WARSAW:SEN) (“Serinus”, “SEN” or the “Company”), is pleased to report
its financial and operating results for the three months ended March 31, 2017.

Q1 2017 Highlights

/T/

— During Q1 2017, production averaged 698 boe/d, down from 1,154 boe/d

during 2016, a decline of 40%. Lower production during 2017 was due to
the shut-in of the Chouech Es Saida field for 54 days of the quarter,
due to labour issues. The Chouech Es Saida field remains shut in since
February 28, 2017. The decrease in Chouech Es Saida production was
partially offset by increased production in Sabria, due to increased
production from the WIN-12 well as compared to Q1, 2016.
— The netback in Q1 2017 was $14.68 per boe, compared to $11.44 per boe in
Q1 2016. The higher netback in 2017 was driven by higher commodity
prices partially offset by higher production expenses and royalty
expenses per boe.
— Funds from operations was $0.2 million for the three-month period ended
March 31, 2017 (Q1 2016: $2.7 million). Funds from operations for the
three months were comprised of funds from operations in Tunisia of $0.9
million offset by a corporate loss from operations of $0.7 million.
— The net loss for the three-month period ended March 31, 2017 was $2.1
million, compared to a net loss from continuing operations of $4.1
million in Q1 2016.
— On May 9, 2017, the Company signed an Engineering, Procurement,
Construction and
Commissioning Contract (“EPCC”) with Confind S.R.L., a Romanian company,
for the construction of a gas facility and associated flowlines and
pipelines for Moftinu development in Romania. Construction will commence
imminently with expected first gas production in the first quarter of
2018.
— The Company filed a short form prospectus, dated February 21, 2017,
which qualified for distribution 72 million common shares of the Company
at CAD$0.35 per share for aggregate gross proceeds of CAD$25.2 million
(net CAD$24.3 million, after agents fees of CAD$0.9 million)(“the
Offering”). The Offering closed on February 24, 2017, and the net
proceeds will be used by the Company to fund the development of the
Moftinu Gas Development Project and pre-work for the 2018 drilling
program in the Satu Mare Concession in Romania, production enhancement
in the Sabria block in Tunisia, and for general corporate purposes.
— At March 31, 2017, the Company was not in compliance with the financial
debt to EBITDA ratio and the debt service coverage ratio at the
consolidated level on its debt held with EBRD. Subsequent to March 31,
2017, EBRD has acknowledged that a waiver for the quarter end covenant
violation is forthcoming, however this has not yet been received by the
Company.

/T/

Notes: Serinus prepares its financial results on a consolidated basis. Unless
otherwise noted by the phrases “allocable to Serinus”, “net to Serinus”,
“attributable to SEN shareholders” or “SEN WI”, all values and volumes refer to
the consolidated figures. Serinus reports in US dollars; all dollar values
referred to herein, whether in dollars or per share values are in US dollars
unless otherwise noted.

Summary Financial Results (US$ 000’s unless otherwise noted)

/T/

Three Months Ended March 31
—————————————–

2017 2016 Change
————- ————- ————-
Net Oil and Gas Revenue (net of
royalties) 2,642 3,400 (22%)

Net Income from Continuing
Operations (2,099) (4,137) 49%
per share, basic and
diluted (0.02) (0.05)

Funds from Continuing Operations 166 2,628 (94%)
per share, basic and
diluted 0.00 0.03 (97%)

Capital Expenditures 858 999 (14%)

Average Production (net to Serinus
from continuing operations)

Oil (Bbl/d) 525 901 (42%)
Gas (Mcf/d) 1,037 1,518 (32%)
————- ————-
BOE (boe/d) 698 1,154 (40%)

Average Sales Price (from
continuing operations)

Oil ($/Bbl) $50.89 $37.12 37%
Gas ($Mcf) $5.85 $5.31 10%
————- ————-
BOE ($/boe) $46.98 $35.97 31%

March 31 December 31
————- ————-
2017 2016
————- ————-
Cash & Equivalents 19,142 4,297
Working Capital (21,934) (38,475)
Long Term Debt – –

Shares Outstanding 150,629,941 78,629,941
Average for Period 106,629,941 78,629,941

/T/

General & Financial Highlights

/T/

— Revenue, net of royalties, for three-month period ended March 31, 2017

decreased to $2.6 million, compared to $3.4 million in Q1 2016, due to
lower production.
— Total royalties paid decreased from $0.4 million in Q1 2016 to $0.3
million in Q1 2017. Much of this decrease was due to lower production
offset by higher average commodity prices.
— Serinus made capital expenditures of $0.8 million in Q1 2017, of which
$0.3 million and $0.5 million were in Tunisia and Romania respectively.
— At March 31, 2017, the Company was not in compliance with the financial
debt to EBITDA ratio and the debt service coverage ratio at the
consolidated level on its debt held with EBRD. Subsequent to March 31,
2017, EBRD has acknowledged that a waiver for the quarter end covenant
violation is forthcoming, however this has not yet been received by the
Company. Given the covenant was breached as at March 31, 2017, Serinus
has reclassified its long-term debt to current in the financial
statements, as required under accounting standards. There is a risk that
the Company will continue to violate certain financial covenants
relating to its debt held with EBRD, particularly given the current
commodity prices. Although the EBRD has previously provided waivers for
covenant breaches there is no certainty this will occur in the future.
If these covenants are not met, the debt may therefore become payable on
demand.

/T/

Operational Highlights

/T/

— During Q1 2017, production averaged 698 boe/d, down from 1,154 during

2016, a decline of 40%. Lower production during 2017 was due to the
shut-in of the Chouech Es Saida field for 54 days of the quarter, due to
labour issues. The Chouech Es Saida field remains shut in since February
28, 2017. The decrease in Chouech Es Saida production was partially
offset by increased production in Sabria, due to increased production
from the WIN-12 well as compared to Q1 2016.
— In Tunisia, the Company incurred $0.3 million of capital expenditures
for the three month period ended March 31, 2017, which included costs
for pumps and parts in preparation of workovers on the CS-1 and CS-3
wells in Chouech Es Saida. In Romania, the Company incurred $0.5 million
of capital expenditures for the three month period ended March 31, 2017,
which included permitting and licensing, land rentals and ongoing
engineering study costs.

/T/

Outlook

The Company is focusing on Romania as the impetus for growth over the next
three years. The Moftinu gas development project is a near-term project that is
expected to begin producing from the gas discovery wells Moftinu-1001 and
Moftinu-1000 in early 2018. The Company signed an EPCC contract on May 9, 2017
and will imminently commence construction of a gas plant with 15 MMcf/d of
operational capacity, with expected first gas production in the first quarter
of 2018.

The Company is also developing the drilling program to meet work commitments
for the extension and plans to drill two additional development wells
(Moftinu-1003 and 1004) with a potential third well in 2018. The Corporation
sees potential production from these wells being able to bring the gas plant to
full capacity in late 2018.

In Tunisia, the Company will focus on carrying out low cost incremental work
programs to increase production from existing wells, including the Sabria N-2
re-entry and installing artificial lift on another Sabria well. The Corporation
views Sabria as a large development opportunity longer term.

Average working interest production in Q2 2017 in Tunisia to the end of April
was 637 boe/d (470 bbl/d of oil, 957 MMcf/d of gas).

The Company’s production has been significantly curtailed in the first quarter
of 2017 because of the shut-in of the Chouech Es Saida field in Tunisia from
February 28, 2017, to date. Assuming the continued shut-in, production is
projected to be approximately 620 boe/d for the second quarter of 2017.
Increasing full year production for 2017 is dependent on the resolution of the
associated security and safety issues that would allow for successful
resumption of production at the Chouech Es Saida field, as well as the timing
of the above-mentioned capital program in Sabria.

Supporting Documents

The full Management Discussion and Analysis (“MD&A”) and Financial Statements
have been filed in English on www.sedar.com and in Polish and English via the
ESPI system, and will also be available on www.serinusenergy.com.

Abbreviations

/T/

—————————————————————————-
bbl Barrel(s) bbl/d Barrels per day
—————————————————————————-
boe Barrels of Oil Equivalent boe/d Barrels of Oil Equivalent
per day
—————————————————————————-
Mcf Thousand Cubic Feet Mcf/d Thousand Cubic Feet per
day
—————————————————————————-
MMcf Million Cubic Feet MMcf/d Million Cubic Feet per day
—————————————————————————-
Mcfe Thousand Cubic Feet Mcfe/d Thousand Cubic Feet
Equivalent Equivalent per day
—————————————————————————-
MMcfe Million Cubic Feet MMcfe/d Million Cubic Feet
Equivalent Equivalent per day
—————————————————————————-
Mboe Thousand boe Bcf Billion Cubic Feet
—————————————————————————-
MMboe Million boe Mcm Thousand Cubic Metres
—————————————————————————-
CAD Canadian Dollar USD U.S. Dollar
—————————————————————————-

/T/

Cautionary Statement:

BOEs may be misleading, particularly if used in isolation. A BOE conversion
ratio of 6 Mcf:1 bbl is based on an energy equivalency conversion method
primarily applicable at the burner tip and does not represent a value
equivalency at the wellhead.

About Serinus

Serinus is an international upstream oil and gas exploration and production
company that owns and operates projects in Tunisia and Romania.

For further information, please refer to the Serinus website
(www.serinusenergy.com).

Translation: This news release has been translated into Polish from the English
original.

Forward-looking Statements This release may contain forward-looking statements
made as of the date of this announcement with respect to future activities that
either are not or may not be historical facts. Although the Company believes
that its expectations reflected in the forward-looking statements are
reasonable as of the date hereof, any potential results suggested by such
statements involve risk and uncertainties and no assurance can be given that
actual results will be consistent with these forward-looking statements.
Various factors that could impair or prevent the Company from completing the
expected activities on its projects include that the Company’s projects
experience technical and mechanical problems, there are changes in product
prices, failure to obtain regulatory approvals, the state of the national or
international monetary, oil and gas, financial, political and economic markets
in the jurisdictions where the Company operates and other risks not anticipated
by the Company or disclosed in the Company’s published material. Since
forward-looking statements address future events and conditions, by their very
nature, they involve inherent risks and uncertainties and actual results may
vary materially from those expressed in the forward-looking statement. The
Company undertakes no obligation to revise or update any forward-looking
statements in this announcement to reflect events or circumstances after the
date of this announcement, unless required by law.

– END RELEASE – 11/05/2017

For further information:
Serinus Energy Inc.
Calvin Brackman
Vice President, External Relations & Strategy
Tel.: +1-403-264-8877
[email protected]
OR
Serinus Energy Inc.
Jeffrey Auld
Chief Executive Officer
Tel.: +1-403-264-8877
[email protected]

COMPANY:
FOR: SERINUS ENERGY INC.
TSX SYMBOL: SEN
WARSAW SYMBOL: SEN

INDUSTRY: Energy and Utilities – Oil and Gas
RELEASE ID: 20170511CC0126

Press Release from Marketwired 1-866-736-3779

All press releases are written by the client and have NO affiliation with the news copy written by The Canadian Press. Any questions that arise due to the content or information provided in the press release should be directed to the company/organization
issuing the release, not to The Canadian Press.

GET ENERGYNOW’S DAILY EMAIL FOR FREE


Federal Liberals to reinforce Trans Mountain pipeline support with B.C.

CALGARY — Canada’s Liberal government will make clear its support of the Trans Mountain pipeline expansion when it meets with the newly elected government of B.C., the country’s natural resources minister said Thursday.

But Jim Carr said it first must be established who won the election on Monday. The results appear to hand Liberal Leader Christy Clark a minority government, but this could change with counts of absentee ballots and recounts.

A total of 43 members of Clark’s party were elected, one seat short of a majority.

The NDP won 41 seats and the Green Party three. Both have said they oppose the Trans Mountain expansion and, if they act together, could potentially try to derail it.

At an event in Calgary, Carr says the pipeline received conditional federal approval after “very rigorous review” and he continues to believe it is in the national interest as a job creator and means to export Alberta crude to Asian markets.

He wouldn’t say whether he thought the pipeline’s prospects of being built were put at risk by the B.C. election results.

The Canadian Press

GET ENERGYNOW’S DAILY EMAIL FOR FREE


Canadian Energy Services & Technology Corp. Announces Results for the First Quarter Ended March 31, 2017, Proposed Corporate Name Change and Declares Cash Dividend

FOR: CANADIAN ENERGY SERVICES & TECHNOLOGY CORP.
TSX SYMBOL: CEU
OTCQX SYMBOL: CESDF

Date issue: May 11, 2017
Time in: 5:39 PM e

Attention:

CALGARY, ALBERTA–(Marketwired – May 11, 2017) – Canadian Energy Services &
Technology Corp. (“CES” or the “Company”) (TSX:CEU)(OTCQX:CESDF) is pleased to
report on its financial and operating results for the three months ended March
31, 2017 (“Q1 2017”). At its upcoming Annual General Meeting in June, CES will
be proposing to shareholders the approval of a change in corporate name to CES
Energy Solutions Corp. CES has significantly transformed its business since its
initial public offering in March 2006, and has broadened its operational
footprint across North America. The proposed new company name will avoid
geographic reference, while the incorporation of the CES acronym will help to
maintain brand recognition. This proposed name change is being implemented at
the corporate level and CES plans to run its various divisional brands in the
local markets and verticals as beforehand. Further, CES announced today that it
will pay a cash dividend of $0.0025 per common share on June 15, 2017 to the
shareholders of record at the close of business on May 31, 2017.

The financial results reported for Q1 2017 are reflective of the improvement in
commodity prices that has led to a rebound in activity in the oil and gas
industry. In contrast, the three months ended March 31, 2016 (“Q1 2016”)
presented challenging market conditions for the industry with oil prices at
historical lows and reduced activity levels. As the industry has rebounded, CES
has gained market share in all of its segments by demonstrating to customers
the benefits of CES’ technologies, service, and attention to problem solving.
Although trough pricing levels continue to exist, the increase in activity has
allowed CES to sell higher volumes of its products across its rationalized cost
structure, and as a result, the financial results of CES in Q1 2017 are
consistently improved in comparison to the results achieved in Q1 2016.

CES generated revenue of $252.4 million during Q1 2017, compared to $137.1
million during Q1 2016, an increase of $115.3 million or 84%. EBITDAC for Q1
2017 was $36.1 million as compared to $6.6 million for Q1 2016, representing an
increase of $29.5 million or 447%. Year-over-year, the Company’s operating
results benefited from increased activity due to the improved commodity price
environment. Furthermore, Q1 2017 includes results attributable to the Permian
based Catalyst Acquisition, completed in the third quarter of 2016, for which
there were no associated results included in Q1 2016. As detailed below, in Q1
2017 all facets of the business in Canada and the US have made positive
contributions to revenue and EBITDAC.

Revenue generated in the US for Q1 2017 was $141.7 million compared to $89.8
million for Q1 2016, an increase of $51.8 million or 58%. This year over year
increase is as a result of the improved market conditions in Q1 2017 with
significant activity growth in the drilling fluids business, market share gains
in drilling fluids and increased US Treatment Points particularly in the
Permian Basin, as a result of the Catalyst Acquisition, for which there were no
associated revenues or Treatment Points in the comparable period in 2016. In
the drilling fluids business, the Company continued to grow market share in the
US with 11% US Market Share in Q1 2017 compared to 10% in Q1 2016.

Revenue generated in Canada for Q1 2017 was $110.7 million compared to $47.3
million for Q1 2016, an increase of $63.4 million or 134%. Throughout the
quarter, PureChem continued to gain market share in Canada in production
chemicals as Canadian Treatment Points have increased 56% from the comparative
period. During Q1 2017, the drilling fluids business increased its operating
days by 102% over Q1 2016, which outpaced the increase in industry rig counts
which increased by 65% over Q1 2016. Furthermore, the Company benefited from a
full winter drilling season this year, as compared to the early Spring break-up
experienced in Q1 2016 when customers curtailed spending and prematurely
stopped drilling in order to preserve capital.

Emerging from the downturn, CES’ balance sheet is well positioned to capitalize
on the improving oilfield activity. In Q1 2017, CES built positive net working
capital and began to draw on its Senior Facility. As of the date hereof, the
Company had a net draw of approximately $50.0 million on its Senior Facility
and its Senior Notes in the amount of $300 million are not due until April
2020. In 2017, it is expected that EBITDAC will exceed expenditures on cash
interest, capital expenditures, and dividends.

CES also announced today that it will pay a cash dividend of $0.0025 per common
share on June 15, 2017 to the shareholders of record at the close of business
on May 31, 2017.

CES Q1 Results Conference Call Details

With respect to the first quarter results, CES will host a conference call /
webcast at 9:00 am MT (11:00 am ET) on Friday, May 12, 2017.

North American toll-free: 1-(877) 291-4570

International / Toronto callers: 647-788-4922

Link to Webcast: http://www.canadianenergyservices.com/

Outlook

The past two years have been extremely challenging as CES has navigated through
the protracted industry downturn. With the improvement in industry activity in
the second half of 2016 and to date in 2017, CES is modestly optimistic with
its outlook. If WTI can remain at or above the USD$50/bbl mark, most of our
customers initiatives are economic and activity should continue to improve in
2017 or at minimum not retrench to first half 2016 levels. As the industry has
rebounded, CES has gained market share in all of its segments by demonstrating
to customers the benefits of CES’ technologies, service, and attention to
problem solving. CES has yet to realize any meaningful price increases in the
recovery. The improvement in financial performance is evidence of the operating
leverage in our consumable chemicals business model, and is a direct result of
the cost reduction initiatives taken in 2016, combined with increased activity
levels as CES has come off its fixed cost base.

CES believes that over time it can continue to grow its share of the oilfield
consumable chemical markets in which it competes. The Catalyst Acquisition in
2016 was another significant step forward in this regard as CES sees the
Permian Basin having the most near-term opportunities for growth. CES’ strategy
is to utilize its decentralized management model; its vertically integrated
manufacturing model; its problem solving through science approach; its patented
and proprietary technologies; and its superior execution to increase market
share. The downturn has made many middlemen, or competitors who are simply
resellers of other company’s products, redundant. By being basic in the
manufacture of the consumable chemicals it sells, CES continues to be price
competitive and a technology leader. Recent competitor consolidations and
business failures will provide further opportunities for CES in this recovery
period. CES believes that its unique value proposition makes it the premier
independent provider of technically advanced consumable chemical solutions to
the North American oilfield.

CES will continue to assess M&A opportunities that will improve CES’
competitive position and enhance profitability. Any acquisitions must meet CES’
stringent financial and operational metrics. In its core businesses, CES will
focus on growing market share, controlling costs, developing or acquiring new
technologies, and making strategic investments as required to position the
business to capitalize on the industry rebound.

Business of CES

CES is a leading provider of technically advanced consumable chemical solutions
throughout the life-cycle of the oilfield. This includes total solutions at the
drill-bit, at the point of completion and stimulation, at the wellhead and
pump-jack, and finally through to the pipeline and midstream market. At the
drill-bit, CES’ designed drilling fluids encompass the functions of cleaning
the hole, stabilizing the rock drilled, controlling subsurface pressures,
enhancing drilling rates, and protecting potential production zones while
conserving the environment in the surrounding surface and subsurface area. At
the point of completion and stimulation, CES’ designed chemicals form a
critical component of fracturing solutions or other forms of remedial well
stimulation techniques. The shift to horizontal drilling and multi-stage
fracturing with long horizontal well completions has been responsible for
significant growth in the drilling fluids and completion and stimulation
chemicals markets. At the wellhead and pump-jack, CES’ designed production and
specialty chemicals provide down-hole solutions for production and gathering
infrastructure to maximize production and reduce costs of equipment
maintenance. Key solutions include corrosion inhibitors, demulsifiers, H2S
scavengers, paraffin control products, surfactants, scale inhibitors, biocides
and other specialty products. Further, specialty chemicals are used throughout
the pipeline and midstream industry to aid in hydrocarbon movement and manage
transportation and processing challenges including corrosion, wax build-up and
H2S.

CES operates in the Western Canadian Sedimentary Basin (“WCSB”) and in several
basins throughout the United States (“US”), with an emphasis on servicing the
ongoing major resource plays. In Canada, CES operates under the trade names
Canadian Energy Services, PureChem Services (“PureChem”), StimWrx Energy
Services Ltd. (“StimWrx”), Sialco Materials Ltd. (“Sialco”), Clear
Environmental Solutions (“Clear”), and EQUAL Transport (“EQUAL”). In the US,
CES operates under the trade names AES Drilling Fluids (“AES”), AES Frac Fluids
(“AES Frac”), Superior Weighting Products (“Superior Weighting”), JACAM
Chemicals (“JACAM”), and Catalyst Oilfield Services (“Catalyst”).

The Canadian Energy Services and AES brands are focused on the design and
implementation of drilling fluids systems and completion solutions sold
directly to oil and gas producers. The StimWrx brand provides near matrix
stimulation and remediation of oil, gas, and injection wells in Western Canada.
The Superior Weighting brand custom grinds minerals including barite, which is
the weighting agent utilized in most drilling fluid systems. The JACAM,
Catalyst, PureChem, and Sialco brands are vertically integrated manufacturers
of advanced specialty chemicals. In addition to being basic in the manufacture
of oilfield chemicals, JACAM, Catalyst, and PureChem also have expanding
distribution channels into the oilfield.

Two complementary business divisions support the operations and augment the
product offerings in the WCSB. Clear is CES’ environmental division, providing
environmental consulting, water management services, and drilling fluids waste
disposal services primarily to oil and gas producers active in the WCSB. EQUAL
is CES’ transport division, providing its customers with trucks and trailers
specifically designed to meet the demanding requirements of off-highway
oilfield work in the WCSB. EQUAL primarily supports the oilfield chemical
business by hauling, handling, managing and warehousing products.

Led by JACAM’s state of the art laboratory in Sterling, Kansas, CES now
operates eight separate lab facilities across North America: two in Houston,
Texas; two in Midland, Texas; and one in each of Carlyle, Saskatchewan; Delta,
British Columbia; and Calgary, Alberta. In 2015, CES significantly expanded its
laboratory capabilities in Calgary with the opening of its new laboratory and
technology center. In the US, CES’ main chemical manufacturing and reacting
facility is located in Sterling, Kansas with additional low-temperature
reacting and chemical blending capabilities in Midland, Texas and additional
chemical blending capabilities in Sonora, Texas. In Canada, CES has a chemical
manufacturing and reacting facility located in Delta, British Columbia with
additional chemical blending capabilities located in Carlyle, Saskatchewan and
Nisku, Alberta. CES also leverages third party partner relationships to drive
innovation in the consumable fluids and chemicals business.

/T/

Financial Highlights

Three Months Ended
March 31,
——————————
($000’s, except per share amounts) 2017 2016
—————————————————————————-
Revenue 252,352 137,149
Gross margin 59,785 23,910
Cash Gross Margin (1) 69,278 32,557
Income (loss) before taxes 7,604 (25,560)
per share – basic 0.03 (0.12)
per share – diluted 0.03 (0.12)
Net income (loss) 7,778 (23,593)
per share – basic 0.03 (0.11)
per share – diluted 0.03 (0.11)
EBITDAC (1 ) 36,107 6,601
per share – basic 0.14 0.03
per share – diluted 0.13 0.03
Funds Flow From Operations (1) 27,523 2,338
per share – basic 0.10 0.01
per share – diluted 0.10 0.01
Dividends declared 1,983 5,079
per share 0.0075 0.0230
—————————————————————————-

Three Months Ended
March 31,
——————————
Shares Outstanding 2017 2016
—————————————————————————-
End of period 264,825,562 222,369,084
Weighted average
– basic 264,169,358 220,928,336
– diluted 272,554,790 220,928,336
—————————————————————————-

As at
——————————
Financial Position ($000’s) December 31,
March 31, 2017 2016
—————————————————————————-
Net working capital 267,687 222,323
Total assets 1,074,012 978,959
Long-term financial liabilities (2) 352,494 306,267
Shareholders’ equity 588,364 568,837
—————————————————————————-
Notes:
(1) CES uses certain performance measures that are not recognizable under
International Financial Reporting Standards (“IFRS”). These performance
measures include net income (loss) before interest, taxes, depreciation
and amortization, gains and losses on disposal of assets, goodwill
impairment, unrealized foreign exchange gains and losses, unrealized
derivative gains and losses, stock-based compensation and other gains
and losses not considered reflective of underlying operations
(“EBITDAC”), and Funds Flow From Operations. Management believes that
these measures provide supplemental financial information that is useful
in the evaluation of CES’ operations. Readers should be cautioned,
however, that these measures should not be construed as alternatives to
measures determined in accordance with IFRS as an indicator of CES’
performance. CES’ method of calculating these measures may differ from
that of other organizations and, accordingly, these may not be
comparable. Please refer to the Non-GAAP measures section of CES’ MD&A
for the three months ended March 31, 2017.
(2) Includes long-term portion of the deferred acquisition consideration,
the Senior Facility, the Senior Notes, and vehicle and equipment finance
leases

/T/

Cautionary Statement

Except for the historical and present factual information contained herein, the
matters set forth in this press release, may constitute forward-looking
information or forward-looking statements (collectively referred to as
“forward-looking information”) which involves known and unknown risks,
uncertainties and other factors which may cause the actual results, performance
or achievements of CES, or industry results, to be materially different from
any future results, performance or achievements expressed or implied by such
forward-looking information. When used in this press release, such information
uses such words as “may”, “would”, “could”, “will”, “intend”, “expect”,
“believe”, “plan”, “anticipate”, “estimate”, and other similar terminology.
This information reflects CES’ current expectations regarding future events and
operating performance and speaks only as of the date of the press release.
Forward-looking information involves significant risks and uncertainties,
should not be read as a guarantee of future performance or results, and will
not necessarily be an accurate indication of whether or not such results will
be achieved. A number of factors could cause actual results to differ
materially from the results discussed in the forward-looking information,
including, but not limited to, the factors discussed below. The management of
CES believes the material factors, expectations and assumptions reflected in
the forward-looking information are reasonable but no assurance can be given
that these factors, expectations and assumptions will prove to be correct. The
forward-looking information contained in this document speaks only as of the
date of the document, and CES assumes no obligation to publicly update or
revise such information to reflect new events or circumstances, except as may
be required pursuant to applicable securities laws or regulations. The material
assumptions in making forward-looking statements include, but are not limited
to, assumptions relating to demand levels and pricing for the oilfield
consumable chemical offerings of the Company; fluctuations in the price and
demand for oil and natural gas; anticipated activity levels of the Company’s
significant customers; commodity pricing; general economic and financial market
conditions; the successful integration of recent acquisitions; the Company’s
ability to finance its operations; levels of drilling and other activity in the
WCSB, the Permian and other US basins, the effects of seasonal and weather
conditions on operations and facilities; changes in laws or regulations;
currency exchange fluctuations; the ability of the Company to attract and
retain skilled labour and qualified management; and other unforeseen conditions
which could impact the Company’s business of supplying oilfield consumable
chemistry to the Canadian and US markets and the Company’s ability to respond
to such conditions.

In particular, this press release contains forward-looking information
pertaining to the following: the proposed name change to CES Energy Solutions
Corp.; the seasonality of CES’ business; the anticipated reduction in exposure
to the effects of spring break-up in the WCSB; the duration of spring break-up;
the certainty and predictability of future cash flows and earnings; the
expectation that cash interest costs, maintenance capital and dividends will be
fully funded from EBITDAC; future estimates as to dividend levels; the
potential means of funding dividends; the intention to make future dividend
payments; the business strategy regarding cash dividend payments in the future;
the amount of cash to be conserved based on the new dividend level and the
ability to retain such cash to preserve the balance sheet and provide liquidity
to fund future growth initiatives; the sufficiency of liquidity and capital
resources to meet long-term payment obligations; potential M&A opportunities;
the long-term capital investments required for CES to execute on its business
plan; the amount of CES’ non-acquisition related capital expenditures in 2017,
including maintenance capital and discretionary expansion capital and the
anticipated timing for spending such capital; the expected timing and cost for
completion of expansions at the JACAM, Catalyst, and PureChem facilities;
management’s opinion of the impact of any potential litigation or disputes;
potential outcomes of the CRA’s intent to challenge the Canadian tax
consequences of the Conversion (as defined herein); the application of critical
accounting estimates and judgements; the timing of adoption of new accounting
standards and the potential impact of new accounting standards on CES’
financial statements; the collectability of accounts receivable; the
effectiveness of CES’ credit risk mitigation strategies and the results of any
U.S. trade credit insurance claims; management’s opinion of the impact of
self-insuring trade credit insurance;
CES’ ability to increase or maintain its market share, including expectations
that PureChem and JACAM will increase market share in the oilfield consumable
chemical market and Catalyst will increase market-share of production and
specialty chemicals in the Permian Basin; CES’ ability to leverage third party
partner relationships to drive innovation in the consumable fluids and
chemicals business; supply and demand for CES’ products and services, including
expectations for growth in CES’ production and speciality chemical sales and
expected growth in the consumable chemicals market; expectations that CES will
rationalize its drilling fluids cost structure; industry activity levels;
commodity prices and related pricing pressure; any forward curves for commodity
prices; treatment under governmental regulatory and taxation regimes;
expectations regarding the impact of proposed changes to Alberta’s oil and gas
royalty regime; expectations regarding expansion of services in Canada and the
U.S.; development of new technologies; expectations regarding CES’ growth
opportunities in Canada and the U.S.; the effect of acquisitions on the Company
including the effect of the Catalyst and StimWrx Acquisitions; expectations
regarding the performance or expansion of CES’ operations; expectations
regarding the diversification of operations away from the drill-bit;
expectations that competitor consolidation and business failures will provide
future opportunities to CES; expectations regarding demand for CES’ services
and technology; the potential for CES to expand its business as it relates to
water usage and handling; investments in research and development and
technology advancements; access to debt and capital markets and cost of
capital; CES’ ability to continue to comply with covenants in debt facilities;
and competitive conditions.

CES’ actual results could differ materially from those anticipated in the
forward-looking information as a result of the following factors: general
economic conditions in Canada, the U.S., and internationally; geopolitical
risk; fluctuations in demand for consumable fluids and chemical oilfield
services, and any downturn in oilfield activity; a decline in activity in the
WCSB, the Permian and other basins in which the Company operates; a decline in
frac related chemical sales; a decline in operator usage of chemicals on wells;
an increase in the number of customer well shut-ins; volatility in market
prices for oil, natural gas, and natural gas liquids and the effect of this
volatility on the demand for oilfield services generally; the declines in
prices for oil, and pricing differentials between world pricing and pricing in
North America; competition, and pricing pressures from customers in the current
commodity environment; currency risk as a result of fluctuations in value of
the U.S. dollar; liabilities and risks, including environmental liabilities and
risks inherent in oil and natural gas operations; sourcing, pricing and
availability of raw materials, consumables, component parts, equipment,
suppliers, facilities, and skilled management, technical and field personnel;
the collectability of accounts receivable, particularly in the current low oil
and natural gas price environment; ability to integrate technological advances
and match advances of competitors; availability of capital; uncertainties in
weather and temperature affecting the duration of the oilfield service periods
and the activities that can be completed; the ability to successfully integrate
and achieve synergies from the Company’s acquisitions; changes in legislation
and the regulatory environment, including uncertainties with respect to oil and
gas royalty regimes, programs to reduce greenhouse gas and other emissions and
regulations restricting the use of hydraulic fracturing; pipeline capacity and
other transportation infrastructure constraints; reassessment and audit risk
associated with the Conversion and other tax filing matters; changes and
proposed changes to U.S. policies including the potential for tax reform,
possible renegotiation of international trade agreements including NAFTA and
potential Border Adjustment Tax; divergence in climate change policies between
Canada and the U.S.; potential changes to the crude by rail industry; changes
to the fiscal regimes applicable to entities operating in the WCSB and the US;
access to capital and the liquidity of debt markets; fluctuations in foreign
exchange and interest rates, and the other factors considered under “Risk
Factors” in CES’ Annual Information Form for the year ended December 31, 2016
and “Risks and Uncertainties” in CES’ MD&A dated May 11, 2017.

CES has filed its Q1 2017 unaudited condensed consolidated financial statements
and notes thereto as at and for the three months ended March 31, 2017, and
accompanying management discussion and analysis in accordance with National
Instrument 51-102 – Continuous Disclosure Obligations adopted by the Canadian
securities regulatory authorities. Additional information about CES will be
available on CES’ SEDAR profile at www.sedar.com and CES’ website at
www.CanadianEnergyServices.com.

THE TORONTO STOCK EXCHANGE HAS NOT REVIEWED AND DOES NOT ACCEPT RESPONSIBILITY
FOR THE ADEQUACY OR ACCURACY OF THIS RELEASE.

– END RELEASE – 11/05/2017

For further information:
Tom Simons
President and Chief Executive Officer
Canadian Energy Services & Technology Corp.
(403) 269-2800
OR
Craig F. Nieboer, CA
Chief Financial Officer
Canadian Energy Services & Technology Corp.
(403) 269-2800
Or by email at: [email protected]

COMPANY:
FOR: CANADIAN ENERGY SERVICES & TECHNOLOGY CORP.
TSX SYMBOL: CEU
OTCQX SYMBOL: CESDF

INDUSTRY: Energy and Utilities – Equipment, Energy and Utilities –
Oil and Gas
RELEASE ID: 20170511CC0122

Press Release from Marketwired 1-866-736-3779

All press releases are written by the client and have NO affiliation with the news copy written by The Canadian Press. Any questions that arise due to the content or information provided in the press release should be directed to the company/organization
issuing the release, not to The Canadian Press.

GET ENERGYNOW’S DAILY EMAIL FOR FREE


Maxim Power Corp. Announces 2017 First Quarter Financial and Operating Results

FOR: MAXIM POWER CORP.
TSX SYMBOL: MXG

Date issue: May 11, 2017
Time in: 5:38 PM e

Attention:

CALGARY, ALBERTA–(Marketwired – May 11, 2017) – Maxim Power Corp. (“MAXIM” or
the “Corporation”) (TSX:MXG) announced today the release of financial and
operating results for the first quarter ended March 31, 2017. The unaudited
condensed consolidated interim financial statements, accompanying notes and
Management Discussion and Analysis (“MD&A”) will be available on SEDAR and on
MAXIM’s website on May 11, 2017. All figures reported herein are Canadian
dollars unless otherwise stated.

The Financial Highlights below include the results from MAXIM’s continuing
operations and Maxim Power (USA), Inc. (“MUSA”) which is recorded as
discontinued operations in MAXIM’s financial statements. COMAX France S.A.S.
(“COMAX”) has been excluded for comparative purposes as the segment was sold in
December 2016. Refer to MAXIM’s unaudited condensed consolidated interim
financial statements and MD&A for further details.

FINANCIAL HIGHLIGHTS

/T/

Three Months Ended March 31
($ in thousands except per share amounts) 2017 2016
—————————————————————————-
Revenue $ 16,225 $ 15,052
Adjusted EBITDA (1) (2,041) (3,543)
Net loss attributable to shareholders (3,585) (9,973)
Per share – basic and diluted $ (0.07) $ (0.18)
FFO (1) (622) (3,794)
Per share – basic and diluted $ (0.01) $ (0.07)
Net Generation Capacity (MW) (2) 603 603
Average Alberta market power price ($ per
MWh) $ 22.40 $ 18.12
Average Milner realized power price ($ per
MWh) $ 29.01 $ 20.95
Average Northeast US realized power price
(US$ per MWh) $ 68.96 $ 37.25
(1) Select financial information was derived from the unaudited condensed
consolidated interim financial statements and is prepared in accordance
with GAAP, except adjusted earnings before interest, taxes,
depreciation and amortization (“EBITDA”) and adjusted net loss.
Adjusted EBITDA is provided to assist management and investors in
determining the Corporation’s approximate operating cash flows before
interest, income taxes, and depreciation and amortization and certain
other income and expenses. Funds from operating activities before
changes in working capital (“FFO”) is provided to assist management and
investors in determining the Corporation’s cash flows generated from
operations before the cash impact of working capital fluctuations.
Adjusted EBITDA and FFO do not have any standardized meaning prescribed
by GAAP and may not be comparable to similar measures presented by
other companies.
(2) Generation capacity is manufacturer’s nameplate capacity net of
minority ownership interests of third parties and uncontacted capacity
on contracted generating facilities. Includes 447 MW of net generation
capacity from MUSA.

/T/

OPERATING RESULTS

During the first quarter of 2017, revenue, adjusted EBITDA and FFO increased,
and net loss attributable to shareholders decreased compared to the same period
in 2016. Revenue, adjusted EBITDA and FFO increased as a result of higher
realized Northeast U.S. power prices. In addition, adjusted EBITDA and FFO
increased as a result of lower fuel and maintenance costs in conjunction with
realized gains on commodity risk management activities in Canada, partially
offset by an increase in foreign exchange risk management costs realized in
relation to the MUSA sale’s process. In addition to the discussion noted above,
net loss attributable to shareholders decreased in 2017 as a result of
inventories write-downs in 2016.

AGREEMENT TO SELL MUSA

As previously reported on April 3, 2017, MAXIM announced that it has closed the
sale of 100% of its ownership interest in its wholly-owned subsidiary MUSA to
an affiliate of Hull Street Energy, LLC. The implied enterprise value was
approximately $106 million USD inclusive of working capital. Net proceeds to
MAXIM after accounting for debt and transaction costs are approximately $84
million USD.

MAXIM will utilize $8 million CAD of the net sales proceeds as collateral for
letters of credit that are securing potential obligations of the Corporation
and $5 million USD to fulfill obligations under the FERC Settlement agreement
previously disclosed on September 26, 2016. The remainder of the proceeds will
be held by MAXIM for strategic corporate purposes. Refer to page 12 of the MD&A
for details on the Corporation’s pro-forma financial position after collecting
the proceeds on sale.

MILNER (“M1”) TEMPORARY SUSPENSION OF GENERATION

On May 1, 2017, MAXIM provided notice to the Alberta Electric System Operator
(“AESO”) to temporarily suspend the generation of electricity at M1 effective
July 28, 2017. The decision to temporarily suspend the operations at M1 was due
to continued record low Alberta power prices, which have undermined
profitability for a prolonged period. Laying up M1 operations will result in a
75% reduction of plant staff through a combination of layoffs and severances
for an undetermined period. Prior to suspension, M1 will remain available to
the AESO as a long lead time asset and it is unlikely that the unit will be
dispatched. MAXIM is currently maintaining a smaller operating team to
undertake maintenance and repairs for possible resumption of generation as
power market conditions improve. A significant improvement in Alberta power
prices will be required to justify resuming operations.

STRATEGIC REVIEW

As previously announced on November 10, 2016, the Corporation commenced
consideration of various strategic and financing alternatives potentially
available to MAXIM. Since that date, MAXIM closed the sale of 100% of its
ownership interest in COMAX and its parent MAXIM Power Europe B.V., and
subsequently in 2017 closed the sale its of 100% of its ownership interest in
its wholly-owned subsidiary MUSA. MAXIM continues to own 156 MW of generating
capacity in Canada. MAXIM also has permitted power generation development
projects totalling up to 996 MW (refer to Growth Initiatives section below) and
a permitted metallurgical coal development project in Alberta. MAXIM will
provide updates on initiatives pertaining to these investments as these
considerations progress.

GROWTH INITIATIVES

MAXIM has four electrical generating development projects in Alberta totalling
996 MW of capacity. These projects are at various stages of the permitting
phase, with 796 MW having AUC permits and the remainder in the early stage of
permitting. The Corporation is currently evaluating the viability of each
project in the context of recent regulatory announcements by the Government of
Alberta. These regulatory announcements include provision for the transition of
Alberta’s “energy only” power market to a “capacity market” by 2021. The pace
and success of the transition outlined above will determine decisions on
advancing development of these projects. MAXIM has not made any definitive
commitments to the timing or certainty of advancing development of these
projects.

MAXIM also owns a metallurgical coal development initiative located north of
Grande Cache, Alberta that in turn owns metallurgical coal leases for M14 and
M16S (“SUMMIT”). Current estimates for M14 are 18.9 million tonnes of low-mid
volatile metallurgical coal reserves with a mine life of 17 years based on the
NI 43-101 Technical Report filed on SEDAR on March 21, 2013. M16S is located 30
kilometers northwest of M14 and represents 1,792 hectares or 29% of SUMMIT’s
total area of coal leases. A NI 43-101 Technical Report has not been prepared
for M16S. M14 is permitted for a run-of-mine production rate of up to 1,300,000
tonnes per year. MAXIM has not made any definitive commitments to the timing or
certainty of advancing development of this project.

About MAXIM

Based in Calgary, Alberta, MAXIM is an independent power producer, which
acquires or develops, owns and operates innovative and environmentally
responsible power and power related projects. MAXIM currently owns and operates
2 power plants in Alberta, having 156 MW of electric generating capacity. MAXIM
trades on the TSX under the symbol “MXG”. For more information about MAXIM,
visit our website at www.maximpowercorp.com.

Statements in this release which describe MAXIM’s intentions, expectations or
predictions, or which relate to matters that are not historical facts are
forward-looking statements. These forward-looking statements involve known and
unknown risks and uncertainties which may cause the actual results,
performances or achievements of MAXIM to be materially different from any
future results, performances or achievements expressed in or implied by such
forward-looking statements. MAXIM may update or revise any forward-looking
statements, whether as a result of new information, future events or changing
market and business conditions and will update such forward-looking statements
as required pursuant to applicable securities laws.

– END RELEASE – 11/05/2017

For further information:
Michael R. Mayder
Senior Vice President, Finance and CFO
(403) 750-9311

COMPANY:
FOR: MAXIM POWER CORP.
TSX SYMBOL: MXG

INDUSTRY: Energy and Utilities – Utilities, Energy and Utilities –
Pipelines
RELEASE ID: 20170511CC0121

Press Release from Marketwired 1-866-736-3779

All press releases are written by the client and have NO affiliation with the news copy written by The Canadian Press. Any questions that arise due to the content or information provided in the press release should be directed to the company/organization
issuing the release, not to The Canadian Press.

GET ENERGYNOW’S DAILY EMAIL FOR FREE


Parex Resources Announces Voting Results for Election of Directors

FOR: PAREX RESOURCES INC.TSX Symbol: PXTDate issue: May 11, 2017Time in: 4:59 PM eAttention:
CALGARY, AB –(Marketwired – May 11, 2017) –
Not for distribution to US Newswire Services or for dissemination in the
United States
Parex Resources Inc. (“Par…

GET ENERGYNOW’S DAILY EMAIL FOR FREE


Enbridge commits to greater disclosure on indigenous and environmental issues

CALGARY — Enbridge Inc. (TSX:ENB) says it will increase disclosure on how it factors in indigenous and environmental issues when making acquisitions, despite shareholders voting about two-thirds against a resolution calling for just that on Thursday.

“We thought, and still do, that the idea of providing more information on our approach to investments and acquisitions was a very good one,” said chief executive Al Monaco at the company’s annual general meeting.

He said the company would add the information to its corporate social responsibility reporting as part of the company’s efforts to be more transparent.

“Whether it’s a green party, whether it’s a community, or any other constituency or stakeholder, our job is to make sure they understand our approach to the business,” said Monaco.  

His comments come as the pipeline operator looks to advance about $28 billion worth of projects, with some of the largest ones still requiring U.S. regulatory approvals.

The Line 3 replacement pipeline, which received Canadian approval last year, is awaiting a draft environmental impact statement from Minnesota, where it has faced significant opposition. A court challenge from the Assembly of Manitoba Chiefs also must be resolved before construction begins in that province.

The project stretches 1,660 kilometres from Hardisty, Alta., to Superior, Wisc., and at $8.5-billion is the largest project in the company’s history.

Enbridge also closed its acquisition of a 27.6 per cent interest in the Bakken Pipeline System for US$1.5 billion, which includes the contentious Dakota Access Pipeline, during the quarter.

It was the acquisition of that pipeline which prompted the shareholder resolution on acquisitions, but Monaco said the company still thought it a sound investment despite the opposition and protests that flared up last fall.

“It was hard to miss what was going on out there, and we were very concerned about it. Frankly, we spent a lot of time pondering this issue given the circumstances,” he said.  

For the first quarter ending March 31, Enbridge saw earnings of $638 million or $0.54 a share, sliding from $1.2 billion or $1.38 per share for the same quarter last year.

For the full year, Enbridge said it was forecasting adjusted earnings of between $7.2 billion and $7.6 billion after closing its multibillion-dollar deal to take over Spectra Energy in late February. That compares to $4.7 billion last year.


Ian Bickis, The Canadian Press

GET ENERGYNOW’S DAILY EMAIL FOR FREE


Essential Energy Services Announces Election of Board of Directors

FOR: ESSENTIAL ENERGY SERVICES LTD.TSX SYMBOL: ESNDate issue: May 11, 2017Time in: 4:38 PM eAttention:
CALGARY, ALBERTA–(Marketwired – May 11, 2017) – Essential Energy Services Ltd.
(TSX:ESN) (“Essential”) announced that at its annual general meeting…

GET ENERGYNOW’S DAILY EMAIL FOR FREE


Enbridge Income Fund Holdings Inc. Announces Election of Directors

FOR: ENBRIDGE INCOME FUND HOLDINGS INC.TSX SYMBOL: ENFDate issue: May 11, 2017Time in: 3:02 PM eAttention:
CALGARY, ALBERTA–(Marketwired – May 11, 2017) – Enbridge Income Fund Holdings
Inc. (the Company) (TSX:ENF) announced that the nominees listed i…

GET ENERGYNOW’S DAILY EMAIL FOR FREE


Iraq, Algeria support extension of oil production cuts

BAGHDAD — Iraq and Algeria support the extension of oil production cuts by OPEC and non-OPEC producers through the end of the year to try to boost prices, they said in a joint statement Thursday.

The oil ministers of the two countries held a press conference in Baghdad where Iraqi Oil Minister Jabar Ali al-Luaibi said “there might be new ideas to be presented” at an OPEC meeting on May 25, without providing further details.

In late November, the Organization of the Petroleum Exporting Countries agreed to cut production by 1.2 million barrels a day, the first such reduction agreement since 2008. The following month, 11 non-OPEC oil-producing countries pledged to cut an additional 558,000 barrels a day, reaching an overall reduction of 1.8 million.

In March, OPEC announced the possibility that such cuts would be extended.

Iraq — OPEC’s second-largest producer and a country that relies on oil revenues for nearly 95 per cent of its budget — committed to reduce daily production by 210,000 barrels to 4.351 million.

News of a possible extension of the OPEC cuts and reports that U.S. crude stockpiles have dropped by 5.2 million barrels last week slightly boosted worldwide oil prices.

Crude oil sold for over $100 a barrel in the summer of 2014, before bottoming out below $30 a barrel in January 2016. Brent Crude, used to price international oils, now trades at around $50 a barrel in London.

The Associated Press


GET ENERGYNOW’S DAILY EMAIL FOR FREE


Moller-Maersk profit up as oil unit improves, shipping lags

COPENHAGEN — Danish shipping and oil group A.P. Moller-Maersk says its first-quarter profit increased by 19.1 per cent to $253 million, partly thanks to an improvement at the energy division.

Revenue of $8.96 billion was just higher than in the same period a year earlier.

Chief Executive Soeren Skou said the Maersk Oil unit delivered strong earnings but the core shipping business, Maersk Line, dropped to a $66 million loss in the first quarter, mainly due to an 80 per cent increase in bunker prices.

Skou said “we reiterate our guidance for the year,” adding the that Copenhagen-based group expected its underlying profit above the 2016 result of $11 million.

Maersk shares increased nearly 2 per cent to 11,870 kroner in morning trading in Copenhagen.

The Associated Press

GET ENERGYNOW’S DAILY EMAIL FOR FREE


ATCO Ltd. Reports on Voting Results from the 2017 Annual Meeting of Share Owners

FOR: ATCO LTD.
TSX SYMBOL: ACO.X
TSX SYMBOL: ACO.Y

Date issue: May 11, 2017
Time in: 12:22 PM e

Attention:

CALGARY, ALBERTA–(Marketwired – May 11, 2017) – ATCO Ltd.
(TSX:ACO.X)(TSX:ACO.Y)

The following matter was voted upon at the Annual Meeting of Share Owners of
ATCO Ltd. (the “Corporation”) held on May 10, 2017 in Calgary, Alberta. This
matter is described in greater detail in the 2017 Notice of Annual Meeting of
Share Owners and Management Proxy Circular dated March 7, 2017.

By a resolution passed by ballot, each of the following 10 nominees proposed by
management was elected as a Director of the Corporation to hold office until
the next annual meeting of share owners of the Corporation or until his/her
successor is elected or appointed:

/T/

—————————————————————————-

%
NOMINEES VOTES FOR IN FAVOUR
—————————————————————————-
Robert T. Booth 11,569,551 99.9
—————————————————————————-
Denis M. Ellard 11,574,411 99.9
—————————————————————————-
C. Anthony Fountain 11,576,111 99.9
—————————————————————————-
Michael R.P. Rayfield 11,575,211 99.9
—————————————————————————-
Robert J. Routs 11,575,711 99.9
—————————————————————————-
Nancy C. Southern 11,572,536 99.9
—————————————————————————-
Linda A. Southern-Heathcott 11,574,596 99.9
—————————————————————————-
Roger J. Urwin 11,574,811 99.9
—————————————————————————-
Susan R. Werth 11,575,036 99.9
—————————————————————————-
Charles W. Wilson 11,574,011 99.9
—————————————————————————-

/T/

With approximately 7,000 employees and assets of $20 billion, ATCO is a
diversified global corporation delivering service excellence and innovative
business solutions in Structures & Logistics (workforce housing, innovative
modular facilities, construction, site support services, and logistics and
operations management); Electricity (electricity generation, transmission, and
distribution); Pipelines & Liquids (natural gas transmission, distribution and
infrastructure development, energy storage, and industrial water solutions);
and Retail Energy (electricity and natural gas retail sales). More information
can be found at www.ATCO.com.

Forward-Looking Information:

Certain statements contained in this news release may constitute
forward-looking information. Forward-looking information is often, but not
always, identified by the use of words such as “anticipate”, “plan”,
“estimate”, “expect”, “may”, “will”, “intend”, “should”, and similar
expressions.

Forward-looking information involves known and unknown risks, uncertainties and
other factors that may cause actual results or events to differ materially from
those anticipated in such forward-looking information.

The Company’s actual results could differ materially from those anticipated in
this forward-looking information as a result of regulatory decisions,
competitive factors in the industries in which the Company operates, prevailing
economic conditions, and other factors, many of which are beyond the control of
the Company.

The Company believes that the expectations reflected in the forward-looking
information are reasonable, but no assurance can be given that these
expectations will prove to be correct and such forward-looking information
should not be unduly relied upon.

Any forward-looking information contained in this news release represents the
Company’s expectations as of the date hereof, and is subject to change after
such date. The Company disclaims any intention or obligation to update or
revise any forward-looking information whether as a result of new information,
future events or otherwise, except as required by applicable securities
legislation.

– END RELEASE – 11/05/2017

For further information:
Media & Investor Inquiries:
B.R. (Brian) Bale
Senior Vice President &
Chief Financial Officer
403-292-7502

COMPANY:
FOR: ATCO LTD.
TSX SYMBOL: ACO.X
TSX SYMBOL: ACO.Y

INDUSTRY: Energy and Utilities – Equipment, Energy and Utilities –
Utilities, Manufacturing and Production – Packaging and Containers,
Energy and Utilities – Pipelines
RELEASE ID: 20170511CC0078

Press Release from Marketwired 1-866-736-3779

All press releases are written by the client and have NO affiliation with the news copy written by The Canadian Press. Any questions that arise due to the content or information provided in the press release should be directed to the company/organization
issuing the release, not to The Canadian Press.

GET ENERGYNOW’S DAILY EMAIL FOR FREE


Alberta Innovates and Natural Resources Canada announce $26.2M in funding for oil and gas clean tech projects, industry to kick in additional $43.3M

FOR: ALBERTA INNOVATES
Date issue: May 11, 2017Time in: 12:00 PM eAttention:
CALGARY, ALBERTA–(Marketwired – May 11, 2017) – Demonstrating the strength of
collaboration, Alberta Innovates has teamed up with Natural Resources (NRCan)
and industry part…

GET ENERGYNOW’S DAILY EMAIL FOR FREE


Waterous Energy Fund Completes Acquisition of 67% Ownership of Northern Blizzard Resources Inc.

FOR: WATEROUS ENERGY FUND
Date issue: May 11, 2017Time in: 11:00 AM eAttention:
CALGARY, ALBERTA–(Marketwired – May 11, 2017) – Waterous Energy Fund (“WEF”)
is pleased to announce that its affiliates, WEF GP (International) Ltd., the
general partner …

GET ENERGYNOW’S DAILY EMAIL FOR FREE


Exito Energy II Inc. and Good Life Networks Inc. Mail Addendum to Meeting Materials to Correct Typographic Error

FOR: EXITO ENERGY II INC.TSX VENTURE SYMBOL: EXI.PDate issue: May 11, 2017Time in: 10:45 AM eAttention:
CALGARY, ALBERTA–(Marketwired – May 11, 2017) –
THIS PRESS RELEASE IS NOT FOR PUBLICATION OR DISSEMINATION IN THE UNITED
STATES. FAILURE TO COMPLY…

GET ENERGYNOW’S DAILY EMAIL FOR FREE


EnerGulf Resources Inc. Corporate Update

FOR: ENERGULF RESOURCES INC.TSX VENTURE SYMBOL: ENGFRANKFURT SYMBOL: EKSDate issue: May 11, 2017Time in: 9:36 AM eAttention:
VANCOUVER, BRITISH COLUMBIA–(Marketwired – May 11, 2017) – NOT FOR
DISSEMINATION IN THE UNITED STATES OR TO UNITED STATES NEW…

GET ENERGYNOW’S DAILY EMAIL FOR FREE


Clean Harbors Signs Definitive Agreement to Acquire Lonestar West Inc.

FOR: LONESTAR WEST INC.
TSX VENTURE SYMBOL: LSI

AND CLEAN HARBORS, INC.
NYSE SYMBOL: CLH

Date issue: May 11, 2017
Time in: 9:11 AM e

Attention:

– Acquisition Strengthens Clean Harbors’ Daylighting and Hydro Excavation
Expertise and Service Offerings

– Lonestar Shareholders to Receive CAD $0.72 per Share

– Transaction Valued at CAD $44.1 Million, Including Equity Payout and
Assumption of Debt

– Transaction Expected to Close in July, 2017

NORWELL, MASSACHUSETTS and SYLVAN LAKE, ALBERTA–(Marketwired – May 11, 2017) –
Clean Harbors, Inc. (“Clean Harbors”) (NYSE:CLH) and Lonestar West Inc.
(“Lonestar”) (TSX VENTURE:LSI) today announced a definitive agreement whereby
Clean Harbors will acquire the outstanding shares of Lonestar in an all-cash
transaction valued at CAD $44.1 million.

Under the terms of the agreement, Lonestar shareholders will receive CAD $0.72
per share and Clean Harbors will assume CAD $22.3 million in outstanding debt.
The purchase price represents an 84.6% premium over the closing price of the
Lonestar shares on the TSX Venture Exchange (“TSXV”) for May 10, 2017, and an
82.2% premium over the weighted average trading price of the Lonestar shares on
the TSXV for the 20 trading days ending May 10, 2017.

The transaction will enable Clean Harbors to:

/T/

— Broaden its daylighting and hydro excavation capabilities
— Capitalize on the growing demand for these services
— Expand into new geographies, while accelerating growth in existing

regions
— Add economies of scale and achieve operating efficiencies
— Maximize cross-selling opportunities
— Acquire a business with the potential for strong cash flow generation

/T/

Daylighting and hydro excavation are non-destructive methods of excavation that
use pressurized water to agitate the earth and a powerful vacuum to remove
debris and safely expose underground utilities, pipelines and other
infrastructure.

“Daylighting and hydro excavation services are markets that we believe offer
strong growth prospects,” said Alan S. McKim, Chairman, President and Chief
Executive Officer. “With the addition of Lonestar, we see an opportunity to
accelerate our position in that marketplace and double our scale. Given the
versatility of hydrovacs, we can leverage these highly desirable assets across
a number of our lines of business. Geographically, this transaction aligns well
with our existing footprint, as Lonestar serves key markets across Canada and
the United States. We look forward to adding James Horvath and his talented
team to our Daylighting services group.”

James P. Horvath, Lonestar’s President and Chief Executive Officer, said, “This
transaction, which has the full support of our Board of Directors and
management team, will deliver fair value to our shareholders with a significant
premium to recent trading prices. It will also directly benefit our employees
and customers. With its exceptional reputation for quality and service, Clean
Harbors is an ideal partner that strategically enhances our ability to grow.
The company has a proven track record in the hydro excavation space, deep
customer relationships across key industries and an expansive network of North
American locations. We are excited to join such an established leader.”

Lonestar has more than 160 employees and maintains a network of 12 operating
centers in key areas throughout Canada and the United States. The company
generated CAD $43 million of revenues in 2016. Lonestar provides services for
drilling operations, oil sands projects, plant maintenance, as well as
commercial, municipal and civil projects. Clean Harbors expects the acquisition
will be accretive in 2017, excluding one-time fees and acquisition-related
expenses.

Under the terms of the definitive agreement, the acquisition will be
accomplished by way of an amalgamation (the “Amalgamation”) pursuant to the
Canada Business Corporations Act. The proposed Amalgamation is subject to
certain conditions including, without limitation, the approval by: the holders
of Lonestar shares representing at least two-thirds of votes cast in person or
by proxy at the meeting of Lonestar shareholders to be held to approve the
Amalgamation and appropriate regulatory and other authorities. There is no
financing condition to completion of the transaction. The Lonestar
shareholders’ meeting to approve the Amalgamation is expected to be held on
July 12, 2017 and the closing of the Amalgamation is anticipated to be on July
14, 2017. An information circular in respect of the meeting is expected to be
mailed to Lonestar shareholders at the beginning of June, 2017. Each of the
directors and officers of Lonestar and certain other principal shareholders,
collectively holding approximately 35.7% of the issued and outstanding Lonestar
shares, have entered into agreements with Clean Harbors pursuant to which such
holders have agreed to vote such Lonestar shares in favor of the Amalgamation
at the Lonestar shareholders’ meeting.

The Board of Directors of Lonestar has unanimously approved the Amalgamation
and determined that the Amalgamation is in the best interests of Lonestar and
the Lonestar shareholders and recommends that the Lonestar shareholders vote in
favor of the Amalgamation.

Industrial Alliance Securities Inc. is acting as exclusive financial advisor to
Lonestar in connection with the Amalgamation and has provided the Board of
Directors of Lonestar with its verbal opinion that, as of the date hereof,
subject to receipt and review of the final documentation relating to such
opinion and the Amalgamation, and certain assumptions, limitations and
qualifications, the consideration to be received by the Lonestar shareholders
pursuant to the Amalgamation is fair, from a financial point of view, to the
Lonestar shareholders.

The definitive agreement contains provisions that, among other things: prohibit
Lonestar from soliciting or initiating discussions regarding any other business
combination or sale of material assets, subject to certain conditions; grant
Clean Harbors the right to match competing unsolicited proposals; provide for a
non-completion fee of CAD $1.1 million, plus reimbursement of expenses, payable
to Clean Harbors in certain circumstances if the Amalgamation is not completed.

About Clean Harbors

Clean Harbors (NYSE:CLH) is North America’s leading provider of environmental,
energy and industrial services. The Company serves a diverse customer base,
including a majority of the Fortune 500, across the chemical, energy,
manufacturing and additional markets, as well as numerous government agencies.
These customers rely on Clean Harbors to deliver a broad range of services such
as end-to-end hazardous waste management, emergency spill response, industrial
cleaning and maintenance, and recycling services. Through its Safety-Kleen
subsidiary, Clean Harbors also is North America’s largest re-refiner and
recycler of used oil and a leading provider of parts washers and environmental
services to commercial, industrial and automotive customers. Founded in 1980
and based in Massachusetts, Clean Harbors operates throughout the United
States, Canada, Mexico and Puerto Rico. For more information, visit
www.cleanharbors.com.

About Lonestar West

Based in Sylvan Lake, Alberta, Lonestar West Inc. operates a fleet of 140
Hydrovac, Vacuum and Auxiliary units throughout Western Canada, Ontario,
California, and the southern United States. It is focused on profitably growing
its HVAC services to become a major competitor in the North American market.
For more information please visit the Lonestar West website at
www.lonestarwest.com.

Safe Harbor Statement

Any statements contained herein that are not historical facts are
forward-looking statements within the meaning of the Private Securities
Litigation Reform Act of 1995. These forward-looking statements are generally
identifiable by use of the words “believes,” “expects,” “intends,”
“anticipates,” “plans to,” “estimates,” “projects,” or similar expressions.
Such statements may include, but are not limited to, statements about future
financial and operating results, the Company’s planned carve-out and other
statements that are not historical facts. Such statements are based upon the
beliefs and expectations of Clean Harbors’ management as of this date only and
are subject to certain risks and uncertainties that could cause actual results
to differ materially including, without limitation, those items identified as
“risk factors” in Clean Harbors’ most recently filed Form 10-K and Form 10-Q.
Therefore, readers are cautioned not to place undue reliance on these
forward-looking statements. Clean Harbors undertakes no obligation to revise or
publicly release the results of any revision to these forward-looking
statements other than through its filings with the Securities and Exchange
Commission, which may be viewed in the “Investors” section of Clean Harbors’
website at www.cleanharbors.com.

NEITHER THE TSX VENTURE EXCHANGE NOR ITS REGULATION SERVICES PROVIDER (AS THAT
TERM IS DEFINED IN THE POLICIES OF THE TSX VENTURE EXCHANGE) ACCEPTS
RESPONSIBILITY FOR THE ADEQUACY OR ACCURACY OF THIS RELEASE.

– END RELEASE – 11/05/2017

For further information:
Investors:
Jim Buckley
SVP Investor Relations
Clean Harbors, Inc.
781.792.5100
[email protected]
OR
Media:
Eric Kraus
EVP Corporate Communications & Public Affairs
Clean Harbors, Inc.
781.792.5100
[email protected]
OR
James Horvath
President & CEO
Lonestar West Inc.
403.887.2074
[email protected]

COMPANY:
FOR: LONESTAR WEST INC.
TSX VENTURE SYMBOL: LSI

AND CLEAN HARBORS, INC.
NYSE SYMBOL: CLH

INDUSTRY: Energy and Utilities – Oil and Gas
RELEASE ID: 20170511CC0058

Press Release from Marketwired 1-866-736-3779

All press releases are written by the client and have NO affiliation with the news copy written by The Canadian Press. Any questions that arise due to the content or information provided in the press release should be directed to the company/organization
issuing the release, not to The Canadian Press.

GET ENERGYNOW’S DAILY EMAIL FOR FREE


Dundee Energy Announces Notification of TSX Continued Listing Review

FOR: DUNDEE ENERGY LIMITEDTSX SYMBOL: DENDate issue: May 11, 2017Time in: 9:05 AM eAttention:
TORONTO, ONTARIO–(Marketwired – May 11, 2017) – Dundee Energy Limited (“Dundee
Energy” or the “Corporation”) (TSX:DEN) today announced that it has been
noti…

GET ENERGYNOW’S DAILY EMAIL FOR FREE


Range Energy Resources Inc.: Shewashan Operations Update

FOR: RANGE ENERGY RESOURCES INC.
CSE SYMBOL: RGO
FRANKFURT SYMBOL: YGK

Date issue: May 11, 2017
Time in: 8:00 AM e

Attention:

VANCOUVER, BRITISH COLUMBIA–(Marketwired – May 11, 2017) – Range Energy
Resources Inc. (“Range” or the “Company”) (CSE:RGO)(FRANKFURT:YGK) announced
today that, Gas Plus Khalakan (“GPK”), the sole contractor of the Khalakan PSC
in the Kurdistan Region of Iraq, issued an operations update regarding the
Shewashan field.

GPK, received a report from DeGolyer and MacNaughton (D&M) providing a revised
year end 2016 reserve audit for the Shewashan field which has led to a material
increase in the estimated reserves and net present worth of the Shewashan oil
field.

The D&M 2016 reserve report estimate of Shewashan’s 2P gross reserves is 113.8
Mbbl, representing a 53% increase in 2P gross reserves above the 2015 D&M
reserve audit. The increase to GPK’s reserves is attributed to the larger area
mapped following seismic reprocessing.

/T/

Reserves Summary
———————————- ———————————-
Oil Condensate
———————————- ———————————-
Proved Probable Possible Proved Probable Possible
(Mbbl) (Mbbl) (Mbbl) (Mbbl) (Mbbl) (Mbbl)
——— ———— ———– ——— ———— ———–

Gross 37,237 76,576 67,726 0 0 0
Net 15,086 17,729 12,726 0 0 0

———————————————————————-
Sales Gas
———————————————————————-
Proved Probable Possible
(Mbbl) (Mbbl) (Mbbl)
———————- ———————– ———————–

Gross 0 0 0
Net 0 0 0

Note: Probable and possible reserves have not been risk adjusted to make

them comparable to proved reserves.

/T/

The present net worth (discounted at 10%), of the future net revenue attributed
to GPK’s interest in the proved plus probable reserves of the Shewashan oil
field, utilizing the Base Case price of U.S.$55.00 per barrel escalated at 3%
per year from 2018, increased substantially to USD$ 422.5 million, an increase
of 135% above the $179.8 million valuation in the 2015 D&M reserve audit.

/T/

Valuation Summary – Base Case
———————————————————————–
Proved Proved plus Probable
———————————– ———————————–
Future Net Present Worth Future Net Present Worth
Revenue at 10 Percent Revenue at 10 Percent
(M U.S. $) (M U.S. $) (M U.S. $) (M U.S. $)
—————– —————– —————– —————–

Base
Case 299,830 218,912 660,182 422,494

Note: Values for probable reserves have not been risk adjusted to make them

comparable to values for proved reserves.

/T/

THE CSE AND FRANKFURT STOCK EXCHANGES HAVE NOT REVIEWED AND DO NOT ACCEPT
RESPONSIBILITY FOR THE ADEQUACY OR ACCURACY OF THE CONTENT OF THIS PRESS
RELEASE.

Two oil price sensitivity cases ($45.00 and $65.00 per barrel) were evaluated
by D&M to present alternatives outcomes to the future revenue estimates for the
estimated reserves.

/T/

Valuation Summary – Sensitivity Cases
—————————————————————
Proved Proved plus Probable
——————————- ——————————-
Future Net Present Worth Future Net Present Worth
Revenue at 10 Percent Revenue at 10 Percent
(M U.S. $) (M U.S. $) (M U.S. $) (M U.S. $)
————— ————— ————— —————

Low Case 199,532 141,401 572,197 359,528
High Case 335,887 252,167 731,911 473,089

Note: Values for probable quantities have not been risk adjusted to make

them comparable to values for proved quantities. Reserves have been
estimated using the Base Case scenario, and quantities in the
sensitivity cases should not be confused with reserves.

/T/

It is important to note that key producing wells in nearby fields have
exhibited high rates of decline as a result of water breakthrough. The
Shewashan field remains in the early stages of development and any further
increase in both reserves and present net worth should be viewed on the basis
that only future well performance will determine the level of recovery possible
from the matrix.

D&M’s estimates of the gross 1C, 2C and 3C contingent resources for the
Shewashan Field are summarized as follows;

/T/

Gross Contingent Resources
————————————————————–
Oil Condensate Sales Gas
(Mbbl) (Mbbl) (MMcf)
——————– ——————– ——————–

1C 4,306 0 8,311
2C 2,903 0 23,386
3C 207,852 0 78,163

Notes:
1. Application of any risk factor to contingent resources quantities does
not equate contingent resources with reserves.
2. There is no certainty that it will be commercially viable to produce
any portion of the contingent resources evaluated herein.
3. The contingent resources estimated in this report have an economic
status of Undetermined, since the evaluation of those contingent
resources is at a stage such that it is premature to clearly define
the ultimate chance of commerciality.
4. In certain categories, due to various field development and economic
consideration, there may be a reduction to the aggregation of 2C
and/or 3C contingent resources as described herein.

/T/

Operations Update: 1st Quarter 2017:

Shewashan #4:

The 4th well drilled on the Shewashan field, Shewashan #4, continues to drill
forward in the cretaceous reservoir. The well will now be completed as a
deviated producer in the cretaceous reservoir. This well is to increase the
near term production of the Shewashan field.

Production Update:

Production of the Shewashan field has been limited to the 2,000 bbl/d level
during the first quarter 2017 as a result of ongoing selective well testing and
a water isolation program. The downhole modifications of the Shewashan #3 well
have successfully eliminated the earlier water production and maintained oil
production at approximately 1,500 bbl/day. Further work is to be done with the
intent of increasing oil production.

The Shewashan #2 well is currently on restricted production as the water
isolation program is ongoing and the well will be recompleted. The Shewashan #2
modifications are to be completed in the second quarter 2017.

The Shewashan #1 well remains offline. The well is expected to be recompleted
upon the conclusion of the Early Production Facility (EPF) construction and the
Shewashan #2 well modifications.

To view an image of Shewashan EPF under construction – April 2017, please visit
the following link: http://media3.marketwire.com/docs/1094353a.pdf

Oil Sales:

The Company continues to supply the Kurdistan Region’s refining market and
during the first quarter 2017 oil production averaged 2,097 bbl/d.

The recent stability of Brent oil prices has allowed GPK to operate profitably.

Readers are encouraged to read the full GPK Operations Update which can be
found at the NewAge website. http://www.newafricanglobalenergy.com/Related_News.

Mr. Toufic Chahine, Chairman of Range, commented: “The substantial increase in
the Shewashan field’s 2P reserves and present net worth help demonstrate the
signficant value of the Shewashan field and we are pleased to see this growth
over a relatively short period of time. We commend GPK’s efforts to enhance the
productivity of the Shewashan field and the Range board is committed to allow
the company to continue the development of this oil field. With three wells
successfully drilled it is still early in the fields development cycle and as
we learn more about the underlying reservoir geology, we look forward to
additional news from the Shewashan -4 drilling results.”

The Company is a 24.95% indirect shareholder of GPK through its ownership of
49.9% of the shares of New Age
Alzarooni 2 Limited (“NAAZ2”). NAAZ2 owns 50% of the shares of GPK.

Production rates and quantities, reserves and resources, both projected and
historical are provided in this release according to disclosures provided by
GPK. Range expects GPK to utilize reporting procedures that are in compliance
with the COGE Handbook standards and NI 51-101 (National Instrument Standards
of Disclosure for Oil and Gas Activities).

For further information on Range Energy Resources Inc., please visit the
Company’s web site at www.rangeenergyresources.com.

On Behalf of the Board of Directors:

Toufic Chahine

Chairman

This news release contains certain statements that may be deemed to include
“forward-looking statements”. Forward looking statements are statements that
are not historical facts and are generally, but not always, identified by the
words “expects”, “plans”, “anticipates”, “believes”, “intends”, “estimates”,
“projects”, “potential” and similar expressions, or that events or conditions
“will”, “would”, “may”, “could” or “should” occur. Although Range Energy
believes the expectations expressed in such forward-looking statements are
based on reasonable assumptions, such statements are not guarantees of future
performance and actual results may differ materially from those in forward
looking statements. Forward looking statements are based on the beliefs,
estimates and opinions of Range Energy’s management on the date the statements
are made. Except as required by law, Range Energy Reso urces Inc. undertakes no
obligation to update these forward-looking statements in the event that
management’s beliefs, estimates or opinions, or other factors, should change.

– END RELEASE – 11/05/2017

For further information:
Toufic Chahine
Chairman
604-688-9600
604-687-3141 (FAX)
[email protected]

COMPANY:
FOR: RANGE ENERGY RESOURCES INC.
CSE SYMBOL: RGO
FRANKFURT SYMBOL: YGK

INDUSTRY: Energy and Utilities – Oil and Gas
RELEASE ID: 20170511CC0036

Press Release from Marketwired 1-866-736-3779

All press releases are written by the client and have NO affiliation with the news copy written by The Canadian Press. Any questions that arise due to the content or information provided in the press release should be directed to the company/organization
issuing the release, not to The Canadian Press.

GET ENERGYNOW’S DAILY EMAIL FOR FREE


Valener and Gaz Metro Report Their Fiscal 2017 Second Quarter Results

FOR: VALENER INC.
TSX SYMBOL: VNR
TSX SYMBOL: VNR.PR.A

Date issue: May 11, 2017
Time in: 7:00 AM e

Attention:

MONTREAL, QUEBEC–(Marketwired – May 11, 2017) –

Valener

/T/

— Adjusted net income(1,2) of $0.85 per common share in the second quarter

of fiscal 2017 compared to $0.83 per share in the second quarter of
fiscal 2016;
— Normalized operating cash flows(1) per common share of $0.29 for the
second quarter of fiscal 2017, unchanged from the second quarter of
fiscal 2016; and
— Extension of the dividend growth target for common shares
— Compound annual growth of 4% for four additional years starting in
fiscal 2019.

/T/

Gaz Metro

/T/

— Adjusted net income(1,3) of $142.5 million for the second quarter of

fiscal 2017, up $2.0 million from the second quarter of fiscal 2016;
— Adjusted net income(1,3) per unit of $0.85 compared to $0.84 for the
second quarter of fiscal 2016;
— Standard Solar, Inc.: acquisition completed in April (following the
announcement in March);
— Liquefaction, storage and regasification (“LSR”): commissioning of new
facilities tripling the plant’s liquefaction capacity; and
— Vermont Gas Systems, Inc.: full commissioning of the system development
project in Addison County.

( 1) Financial measures not defined by U.S. generally accepted accounting
principles (“GAAP”).
(2) Adjusted net income attributable to common shareholders.
(3) Adjusted net income attributable to Partners.
A reconciliation of non-GAAP financial measures is presented hereafter.

/T/

Valener Inc. (“Valener”) (TSX:VNR)(TSX:VNR.PR.A), the public investment vehicle
in Gaz Metro Limited Partnership (“Gaz Metro”), today reported adjusted net
income(1) attributable to common shareholders of $32.9 million for the second
quarter of fiscal 2017, up $0.8 million or 2.5% from the second quarter of
fiscal 2016. This resulted in an adjusted net income of $0.85 per common share
for the second quarter of fiscal 2017 compared to $0.83 per common share for
the second quarter of fiscal 2016.

Net income attributable to common shareholders was $31.5 million for the second
quarter of fiscal 2017 compared to $28.4 million for the second quarter of
fiscal 2016.

Normalized operating cash flows stood at $11.3 million ($0.29 per common share)
in the second quarter of fiscal 2017, consistent with the second-quarter
results of fiscal 2016.

In addition, Valener announced the extension, for four additional years, of the
compound annual growth target of 4% on its common share dividends. “Given the
quality of its underlying assets and their growing, predictable returns, not to
mention the innovative non-regulated projects such as added capacity at the
natural gas liquefaction plant in Montreal and the recent acquisition of
Standard Solar in the United States, Valener will have increased, accordingly,
its annual dividend for eight consecutive years from fiscal 2015 to fiscal
2022,” said Pierre Monahan, Chairman of Valener’s board of directors.

/T/

Summary of Valener’s results

For the three months For the six months
ended March 31 ended March 31
————————————————
(in millions of dollars,
unless otherwise indicated) 2017 2016 2017 2016
—————————————————————————-
Net income 32.6 29.5 56.7 70.0
—————————————————————————-
Net income attributable to
common shareholders 31.5 28.4 54.5 67.8
—————————————————————————-
Adjusted net income
attributable to common
shareholders (1) 32.9 32.1 53.2 48.9
Per common share (in $) (1) 0.85 0.83 1.37 1.27
—————————————————————————-
Normalized operating cash
flows (1) 11.3 11.3 23.5 21.7
Per common share (in $) (1) 0.29 0.29 0.61 0.56
============================================================================
(1) These financial measures are not defined by GAAP. A reconciliation of
non-GAAP financial measures is presented hereafter.

/T/

Gaz Metro’s results

For the second quarter of fiscal 2017, net income attributable to the Partners
of Gaz Metro totalled $142.5 million, a $2.0 million year-over-year increase
owing mainly to higher net income generated by natural gas distribution
activities in Quebec (“Gaz Metro-QDA”) and Vermont.

In addition, Gaz Metro completed the construction of a second liquefaction
train at its plant in Montreal East, effectively tripling its production
capacity. “Our plant’s annual liquefaction capacity now exceeds 9 billion cubic
feet of LNG,” said Sophie Brochu, President and Chief Executive Officer of Gaz
Metro. “It’s the only facility of its kind in Eastern Canada. Together with our
partner, Investissement Quebec, we can now more than ever fully leverage LNG’s
potential to meet the energy needs of industries that operate far from the gas
network and to serve customers in the heavy road and marine transportation
sectors.”

“What’s more, by acquiring Standard Solar, Gaz Metro is positioning itself to
capitalize on the projected growth in solar energy in the U.S.,” she continued.
“This acquisition reflects Gaz Metro’s commitment to further establishing its
presence in the renewable energy sector while continuing to grow its current
operations.”

/T/

Seigneurie de Beaupre wind farms – Valener and Gaz Metro

For the three months For the six months
ended March 31 ended March 31
—————————————————————————-
2017 2016 2017 2016
—————————————————————————-
Actual output of Wind Farms
2 and 3 (in MWh) 245,119 243,954 458,431 452,869
Actual output of Wind Farm 4
(in MWh) 62,180 60,373 117,412 112,514
—————————————————————————-
Cash flows related to the
operating activities of
Wind Farms 2 and 3 (in
millions of $) 11.1 8.9 24.6 24.1
Cash flows related to the
operating activities of
Wind Farm 4 (in millions of
$) 2.7 2.7 5.0 18.5
—————————————————————————-
Distributions paid by Wind
Farms 2 and 3 (in millions
of $) – – – –
Distributions paid by Wind
Farm 4 (in millions of $) – – 0.7 –
—————————————————————————-
(1) Includes a $12.9 million payment received from Hydro-Quebec in the first
quarter of fiscal 2016 relating to a note receivable for the
reimbursement of certain construction costs.

/T/

Seigneurie de Beaupre Wind Farms 2 and 3 General Partnership (“Wind Farms 2 and
3”) and Seigneurie de Beaupre Wind Farm 4 General Partnership (“Wind Farm 4”)
generated a combined 307,299 MWh of electricity in the second quarter of fiscal
2017, a year-over-year increase of 2,972 MWh, or 1.0%, owing to stronger winds
than those of second-quarter 2016. The resulting operating cash flows for the
second quarter of 2017 totalled $13.8 million, up $2.2 million from the same
quarter in fiscal 2016.

Wind Farms 2 and 3 and Wind Farm 4 used these cash flows to pay distributions
of $7.4 million and $1.3 million, respectively, in April 2017.

/T/

Gaz Metro’s segment results – Net income and adjusted net income
attributable to Partners(1)

For the three months For the six months
ended March 31 ended March 31
————————————————
(in millions of dollars) 2017 2016 2017 2016
—————————————————————————-
Energy Distribution
Gaz Metro-QDA 114.4 112.9 178.5 166.3
Impact of recognizing
regulatory assets related
to employee future
benefits (Gaz Metro-QDA)
(2) – – – 79.3
Vermont (3) 22.4 20.5 42.8 38.8
—————————————————————————-
136.8 133.4 221.3 284.4
—————————————————————————-
Natural Gas Transportation
(3) 6.7 7.4 11.6 11.9
—————————————————————————-
Electricity Production (3) 1.5 1.5 2.3 2.0
—————————————————————————-
Energy Services, Storage and
Other (3) 1.6 0.9 2.6 1.9
Gain on remeasuring CDH
following the acquisition
(4) – – 12.5 –
—————————————————————————-
1.6 0.9 15.1 1.9
—————————————————————————-
Corporate Affairs (3) (4.1) (2.7) (6.4) (5.1)
—————————————————————————-
Net income attributable to
Partners 142.5 140.5 243.9 295.1
—————————————————————————-
Adjustments (2) (4) – – (12.5) (79.3)
—————————————————————————-
Adjusted net income
attributable to Partners
(1) 142.5 140.5 231.4 215.8
============================================================================
(1) This financial measure is not defined by GAAP. A reconciliation of non-
GAAP financial measures is presented hereafter.
(2) One-time adjustment to account for a regulatory asset related to
employee future benefits and resulting from the conversion to GAAP.
(3) Net of financing costs of investments in this segment. These costs
consist of the interest on long-term debt incurred by Gaz Metro to
finance investments in the subsidiaries, joint ventures and entities
subject to significant influence in each of these segments.
(4) $12.5 million gain on remeasuring, at fair value, Gaz Metro’s ownership
interest in CDH Solutions & Operations Limited Partnership (“CDH”)
(which holds 100% of the issued and outstanding units of CCUM) following
Gaz Metro’s acquisition of an additional 50% interest.

/T/

SEGMENT INFORMATION

Energy Distribution

In Quebec

For the second quarter of fiscal 2017, Gaz Metro-QDA’s net income attributable
to Partners totalled $114.4 million, a $1.5 million year-over-year increase
that was mainly due to:

/T/

— growth of investments in the rate base; and
— the favourable impact of recognizing a $2.8 million share in

overearnings during the second quarter of fiscal 2017;

/T/

partly offset by lower distribution revenues as a result of an overall average
price decrease following changes in customer consumption.

Given this recognition of the share in overearnings, Gaz Metro expects that the
fiscal 2017 net income generated by the Quebec Energy Distribution segment will
slightly exceed the earnings projected in the 2017 rate case.

Biomethanation

The project to purchase renewable natural gas (“RNG”) from the city of
Saint-Hyacinthe continues to move forward, with the first injections of RNG
scheduled for June 2017. The city will produce up to 13 million cubic metres of
RNG per year, most of which will be injected into Gaz Metro’s gas network.
Quebec’s natural gas consumers will therefore gain access to a locally produced
source of clean, renewable energy.

In Vermont

Through Green Mountain Power Corporation (“GMP”) and Vermont Gas Systems
(“VGS”), the Energy Distribution segment in Vermont recorded net income
attributable to Partners of $22.4 million in the second quarter of fiscal 2017,
a $1.9 million or 9.3% year-over-year increase that was mainly due to:

/T/

— an increase in GMP’s rate base; and
— a timing difference between revenue and cost recognition.

/T/

Addison project

On April 12, 2017, VGS completed construction and put into service the
extension to its natural gas distribution system in Addison County. The project
is viewed as beneficial for the State of Vermont given that, aside from its
environmental advantages, natural gas is a competitive energy solution compared
to other fossil fuels. A 0.6 km segment is currently the subject of legal
proceedings before the Supreme Court of Vermont. In December 2016, the Supreme
Court of Vermont authorized VGS to continue the work without ruling on the
merits of the appeal. The hearings before the Supreme Court of Vermont took
place in April 2017 and a decision is expected to follow this year.

Solar power

As part of its commercial goal of continuing to offer sources of renewable
energy generation to Vermont residents, GMP submitted three new solar farm
projects, each having a capacity of 5 MW, to the Vermont Public Service Board
(“VPSB”) in March 2017. Each farm will also have the capacity to store 2 MW of
energy. Located in the State of Vermont, these projects will be held in
partnership and represent an investment of approximately US$26 million for GMP.
VPSB approvals are expected in early 2018 and construction is scheduled for
autumn 2018.

Natural Gas Transportation

For the second quarter of fiscal 2017, the Natural Gas Transportation segment
generated net income attributable to Partners of $6.7 million, down $0.7
million year over year mainly because of a decrease in volumes transported by
Portland Natural Gas Transmission System (a Gaz Metro entity subject to
significant influence) given fewer short-term contracts.

Electricity Production

The Electricity Production segment recorded net income attributable to Partners
of $1.5 million in the second quarter of fiscal 2017, unchanged from the net
income of $1.5 million generated in the same quarter of fiscal 2016.

Acquisition of Standard Solar

In April 2017, Gaz Metro, through one of its subsidiaries, made a strategic
acquisition by acquiring all of the issued and outstanding common shares of
Standard Solar for a net cash consideration of US$16.3 million. Based in the
State of Maryland, Standard Solar is a U.S. leader in the solar power sector
and provides development, engineering, supply management, construction and
solar power systems operations and maintenance services in the commercial,
industrial and institutional sectors. Standard Solar operates in many U.S.
states and currently has a large portfolio of construction-ready projects for a
total capacity of nearly 80 MW, a significant project-development portfolio,
and over 100 MW of solar generation capacity under management. With this
acquisition, Gaz Metro is growing its presence and expertise in the solar power
sector-one of the fastest growing sectors in the United States. In keeping with
Gaz Metro’s strategic vision, this acquisition will deepen Gaz Metro’s existing
know-how in the solar power sector and build on its presence in the renewable
energy segment, all while ensuring the long-term growth of its activities.

Energy Services, Storage and Other

For the second quarter of fiscal 2017, the Energy Services, Storage and Other
segment recorded net income attributable to Partners of $1.6 million, a $0.7
million year-over-year increase that primarily reflects a $0.4 million
favourable impact of acquiring an additional interest in CDH Solutions &
Operations Limited Partnership (“CDH”), which owns Climatisation et Chauffage
Urbains de Montreal, s.e.c.

LSR plant

In April 2017, Gaz Metro put into service new infrastructure at the LSR plant.
The plant now has an annual production capacity of more than 9 billion cubic
feet of liquefied natural gas. As a result, Gaz Metro can better meet the
growing demand in road and marine transport markets and in areas located far
from Gaz Metro-QDA’s gas system, particularly the Nord-du-Quebec and Cote-Nord
regions of Quebec and the Northeastern United States. As at March 31, 2017, Gaz
Metro and its partner, Investissement Quebec, had invested $66.5 million and
$48.2 million, respectively, in the project.

Corporate Affairs

The Corporate Affairs segment recorded a net loss of $4.1 million for the
second quarter of fiscal 2017 compared to a net loss of $2.7 million for the
second quarter of fiscal 2016, mainly because of higher development costs on
various projects, in particular the Standard Solar acquisition.

Financial initiatives

On March 31, 2017, Gaz Metro issued 4,545,455 new units as part of a private
placement for total proceeds of $100 million. The placement proceeds were used
for general business purposes.

Valener subscribed to its proportional share of the outstanding units, i.e.,
1,318,291 Gaz Metro units for approximately $29 million. Gaz Metro inc. also
subscribed to its proportional share of these units.

Reconciliation of non-GAAP financial measures

For additional information on non-GAAP financial measures, refer to Valener’s
MD&A for the three-month and six-month periods ended March 31, 2017 and 2016.

/T/

Valener
Reconciliation of normalized operating cash flows

For the three months For the six months
ended March 31 ended March 31
—————————————————————————-
(in millions of dollars) 2017 2016 2017 2016
—————————————————————————-
Cash flows related to
operating activities 12.4 12.4 25.7 23.9
Dividends to preferred
shareholders (1.1) (1.1) (2.2) (2.2)
—————————————————————————-
Normalized operating cash
flows 11.3 11.3 23.5 21.7
—————————————————————————-

Valener
Reconciliation of adjusted net income attributable to common shareholders

For the three months For the six months
ended March 31 ended March 31
—————————————————————————-
(in millions of dollars) 2017 2016 2017 2016
—————————————————————————-
Net income 32.6 29.5 56.7 70.0
Loss (gain) on derivative
financial instruments – 2.8 (0.8) 2.7
Income taxes on the gain
(loss) on derivative
financial instruments – (0.7) 0.2 (0.7)
Share in Gaz Metro’s net
income adjustments – – (3.6) (23.0)
Income taxes related to Gaz
Metro’s net income
adjustments – – 0.7 –
Deferred income taxes
related to the outside-
basis temporary difference
on the interest in Gaz
Metro 1.4 1.6 2.2 2.1
Cumulative dividends on
Series A preferred shares (1.1) (1.1) (2.2) (2.2)
—————————————————————————-
Adjusted net income
attributable to common
shareholders 32.9 32.1 53.2 48.9
—————————————————————————-

Gaz Metro Limited Partnership
Reconciliation of adjusted net income attributable to Partners

For the three months For the six months
ended March 31 ended March 31
—————————————————————————-
(in millions of dollars) 2017 2016 2017 2016
—————————————————————————-
Net income attributable to
Partners 142.5 140.5 243.9 295.1
Impact of the regulatory
treatment related to
employee future benefits
(Gaz Metro-QDA) – – – (79.3)
Gain on remeasuring CDH
following the acquisition – – (12.5) –
—————————————————————————-
Adjusted net income
attributable to Partners 142.5 140.5 231.4 215.8
Per unit, basic and diluted
(in $) 0.85 0.84 1.38 1.28
—————————————————————————-

/T/

Conference call

Valener will hold a conference call today at 11:00 am (Eastern Time) to discuss
its results and those of Gaz Metro for the period ended March 31, 2017. The
public is invited to join the call at 647-788-4922 or toll-free at
877-223-4471. A simultaneous webcast will also be available using the link
provided under “Events and Presentations” in the “Investors” section of
www.valener.com. A replay of the webcast will be archived on the Company’s
website for 365 days following the call; a phone replay will be available for
30 days by dialing 416-621-4642 or toll-free 800-585-8367 (access code:
5485664).

Overview of Valener

Valener is a widely held public company that serves as the investment vehicle
in Gaz Metro. Through its investment in Gaz Metro, Valener offers its
shareholders a solid investment in a diversified and largely regulated energy
portfolio in Quebec and Vermont. As a strategic partner, Valener, on the one
hand, contributes to Gaz Metro’s growth, and on the other, invests in wind
power production in Quebec alongside Gaz Metro. Valener favours energy sources
and uses that are innovative, clean, competitive and profitable. Valener’s
common and preferred shares are listed on the Toronto Stock Exchange under the
“VNR” symbol for common shares and the “VNR.PR.A” symbol for Series A preferred
shares. www.valener.com

Overview of Gaz Metro

With more than $7 billion in assets, Gaz Metro is a leading energy provider. It
is the largest natural gas distribution company in Quebec, where its network of
over 10,000 km of underground pipelines serves more than 300 municipalities and
over 205,000 customers. Gaz Metro is also present in Vermont, producing
electricity and distributing electricity and natural gas to meet the needs of
more than 315,000 customers. Gaz Metro is actively involved in the development
and operation of innovative, promising energy projects, including natural gas
as fuel and liquefied natural gas as a replacement to higher emission-producing
energies, the production of wind and solar power, and the development of
biomethane. Gaz Metro is a major energy sector player that takes the lead in
responding to the needs of its customers, regions and municipalities, local
organizations and communities while also satisfying the expectations of its
Partners (Gaz Metro inc. and Valener) and employees. www.gazmetro.com

Cautionary note regarding forward-looking statements

This press release may contain forward-looking information within the meaning
of applicable securities laws. Such forward-looking information reflects the
intentions, plans, expectations and opinions of the management of Gaz Metro
inc. (“GMi”), in its capacity as General Partner of Gaz Metro, acting as
manager of Valener (“the management of the manager”), and is based on
information currently available to the management of the manager and
assumptions about future events. Forward-looking statements can often be
identified by words such as “plans,” “expects,” “estimates,” “seeks,”
“targets,” “forecasts,” “intends,” “anticipates” or “believes” or similar
expressions, including the negative and conjugated forms of these words.
Forward-looking statements involve known and unknown risks and uncertainties
and other factors beyond the control of the management of the manager. A number
of factors could cause the actual results of Valener or of Gaz Metro to differ
significantly from historical results or current expectations, as described in
the forward-looking statements, including but not limited to the general nature
of the aforementioned, terms of decisions rendered by regulatory agencies,
uncertainty that approvals will be obtained by Gaz Metro from regulatory
agencies and interested parties to carry out all of its activities and the
socio-economic risks associated with such activities, uncertainty related to
the implementation of Quebec’s 2030 Energy Policy, the competitiveness of
natural gas in relation to other energy sources in the context of fluctuating
global oil prices, the reliability or costs of natural gas supply and
electricity supply, the integrity of the natural gas and electricity
distribution systems, the evolution and profitability of Seigneurie de Beaupre
Wind Farms 2 and 3 General Partnership (“Wind Farms 2 and 3”) and Seigneurie de
Beaupre Wind Farm 4 GP (“Wind Farm 4”) and other development projects,
Valener’s ability to generate sufficient cash to support its anticipated target
annual dividend growth rate on its common shares, the ability to complete
attractive acquisitions and the related financing and integration aspects, the
ability to complete new development projects, the ability to secure future
financing, general economic conditions, exchange rate and interest rate
fluctuations, weather conditions and other factors described in section E) Risk
Factors Relating to Valener and in section R) Risk Factors Relating to Gaz
Metro of Valener’s MD&A for the fiscal year ended September 30, 2016 and in
subsequent Valener quarterly MD&As that might address changes to these risks.
Although the forward-looking statements contained herein are based on what the
management of the manager believes to be reasonable assumptions, in particular
assumptions that no unforeseen changes in the legislative and regulatory
framework of energy markets in Quebec and in the United States will occur; that
the applications filed with various regulatory agencies will be approved as
submitted; that natural gas prices will remain competitive; that the supply of
natural gas and electricity will be maintained or will be available at
competitive costs; that no significant event will occur outside the ordinary
course of business, such as a natural disaster or other calamity, or threat to
cybersecurity (or cyberattack); that Gaz Metro can continue to distribute
substantially all of its net income (excluding non-recurring items); that Wind
Farms 2 and 3 and Wind Farm 4 will be able to make distribution payments to
their partners; that Valener will be able to generate sufficient cash to
support its anticipated target annual dividend growth rate on its common
shares; that Green Mountain Power Corporation will be able to continue
achieving efficiency gains and synergies from the merger with Central Vermont
Public Service Corporation; that Valener and Gaz Metro will be able to present
their information in accordance with U.S. GAAP beyond 2018 or, after 2018, will
adopt International Financial Reporting Standards (“IFRS”) that permit the
recognition of regulatory assets and liabilities; that liquidity needs for Gaz
Metro’s development projects will be obtained through a combination of
operating cash flows, borrowings on credit facilities, capital injections from
partners, and issuances of debt securities; and that the subsidiaries will
obtain the required authorizations and funds needed to finance their
development projects. In addition to the other assumptions described in the
Valener MD&A for the year ended September 30, 2016, the management of the
manager cannot assure investors that actual results will be consistent with
these forward-looking statements. These forward-looking statements are made as
of this date, and the management of the manager assumes no obligation to update
or revise them to reflect new events or circumstances, except as required
pursuant to applicable securities laws. These statements do not reflect the
potential impact of any unusual item or any business combination or other
transaction that may be announced or that may occur after the date hereof.
Readers are cautioned to not place undue reliance on these forward-looking
statements.

Photos, videos (b-roll) and logos are available in Gaz Metro’s Multimedia
library.

– END RELEASE – 11/05/2017

For further information:
Investors and Analysts
Mariem Elsayed
Investor Relations
514-598-3253
www.valener.com
OR
Media
Marie-Christine Demers
Public Affairs and Communications
514-598-3449
www.twitter.com/gazmetro
www.gazmetro.com/salledepresse

COMPANY:
FOR: VALENER INC.
TSX SYMBOL: VNR
TSX SYMBOL: VNR.PR.A

INDUSTRY: Energy and Utilities – Alternative Energy, Energy and
Utilities – Oil and Gas , Energy and Utilities – Utilities, Energy
and Utilities – Clean Technology
RELEASE ID: 20170511CC0016

Press Release from Marketwired 1-866-736-3779

All press releases are written by the client and have NO affiliation with the news copy written by The Canadian Press. Any questions that arise due to the content or information provided in the press release should be directed to the company/organization
issuing the release, not to The Canadian Press.

GET ENERGYNOW’S DAILY EMAIL FOR FREE


ENF Reports First Quarter Results; Declares Monthly Dividend

FOR: ENBRIDGE INCOME FUND HOLDINGS INC.TSX SYMBOL: ENFDate issue: May 11, 2017Time in: 7:00 AM eAttention:
CALGARY, ALBERTA–(Marketwired – May 11, 2017) –
HIGHLIGHTS
(all financial figures are unaudited and in Canadian dollars unless otherwise
noted)…

GET ENERGYNOW’S DAILY EMAIL FOR FREE


Enbridge Inc. Reports First Quarter Results

FOR: ENBRIDGE INC.
TSX SYMBOL: ENB
NYSE SYMBOL: ENB

Date issue: May 11, 2017
Time in: 7:00 AM e

Attention:

CALGARY, ALBERTA–(Marketwired – May 11, 2017) –

Q1 HIGHLIGHTS

(all financial figures are unaudited and in Canadian dollars unless otherwise
noted)

/T/

— First quarter earnings were $638 million or $0.54 per common share,

including the impact of a number of unusual, non-recurring or non-
operating factors
— First quarter adjusted earnings were $675 million or $0.57 per common
share
— First quarter adjusted earnings before interest and income taxes (EBIT)
were $1,515 million
— First quarter available cash flow from operations (ACFFO) was $1,215
million or $1.03 per common share
— On February 27, 2017, Enbridge completed the stock-for-stock transaction
to acquire Spectra Energy Corp (Spectra Energy), becoming the largest
energy infrastructure company in North America
— Enbridge provided its full year 2017 post-merger guidance for ACFFO of
$3.60 to $3.90 per share, and adjusted earnings before interest and
taxes of $7.2 to $7.6 billion
— Thus far in 2017, Enbridge has brought $2.4 billion of growth projects
into service, including the Athabasca Twin crude oil pipeline, the
Norlite diluent pipeline, and the Jackfish Lake natural gas pipeline
expansion
— In February, Enbridge secured a 50% interest in the Hohe See Offshore
Wind Project in Germany for $1.7 billion, and closed its 27.6%
investment in the Bakken Pipeline System for US$1.5 billion
— On April 25, 2017, Enbridge launched an Open Season for an expansion of
190 million cubic feet per day (mmcf/d) on its T-South natural gas
pipeline in British Columbia at an estimated cost of approximately $1
billion; assuming a successful Open Season, the expansion could come
into service by late 2020
— During the first quarter of 2017, the Company further bolstered its
balance sheet through a secondary offering of $0.6 billion of Enbridge
Income Fund Holdings Inc. (ENF); with the completion of this secondary
offering, Enbridge has now exceeded the $2 billion asset monetizaton
target it established at the time of the announcement of its combination
with Spectra Energy
— On April 28, 2017, Enbridge and its affiliate Enbridge Energy Partners,
L.P. (EEP) announced the conclusion and outcomes of EEP’s strategic
review which strengthens its commercial structure and financial outlook
— On May 4, 2017, Enbridge announced an incremental increase in its common
share dividend of approximately 5%, bringing the quarterly dividend
payable on June 1, 2017 to $0.61 per share

/T/

Enbridge Inc. (Enbridge or the Company) (TSX:ENB)(NYSE:ENB) today reported
first quarter 2017 adjusted EBIT of $1,515 million. First quarter ACFFO was
$1,215 million, or $1.03 per common share. These results reflect approximately
one month of financial contribution from the assets acquired in the Spectra
Energy merger transaction which closed on February 27, 2017.

ACFFO per share for the first quarter of 2017 was lower than the first quarter
of 2016 due to a number of factors including the timing of the closing of the
Spectra Energy combination, the impact of warmer than normal weather on the
Company’s gas distribution franchises and transactions undertaken in 2016 to
strengthen the balance sheet. The impact of the shares issued at closing of the
merger transaction is amplified by the fact that the legacy Spectra Energy
assets typically contribute a disproportionate share (25% to 30%) of their
annual ACFFO in the first two months of the year. The impact of liquids
mainline apportionment on the performance of downstream pipelines and changes
in the effective foreign exchange rate also impacted the quarter-over-quarter
results. The ACFFO contribution from Liquids Pipelines is expected to improve
in future quarters as a result of planned capacity optimizations, an improved
foreign exchange hedge rate and the impact of incremental cash flow from new
projects being placed into service.

2017 Guidance

Looking forward, the Company expects to generate consolidated ACFFO per share
of between $3.60 and $3.90 for the full 2017 year. This guidance range
reflects, among other factors, the positive impact of ongoing strength in
Mainline crude oil volumes, the full year contributions of $2 billion of new
growth projects coming into service during 2016 and partial year contributions
from over $13 billion of new growth projects in 2017, as well as additional
utility rate base growth, offset primarily by the seasonal impact of the timing
of close of the Spectra Energy acquisition described above, the previously
announced shipper-requested deferral of the Wood Buffalo Extension Project
in-service date to December 1, 2017 and mild first quarter weather.

“We were very pleased to complete the closing of the Spectra Energy combination
in the first quarter and we are now in good position to capitalize on the
strategic and financial merits of the transaction,” said Al Monaco, President
and Chief Executive Officer of Enbridge Inc. “After adjusting for the timing of
the deal-close and other factors noted above, our 2017 full year run-rate and
future outlook remains in line with our original assumptions and expectations
for the post-Spectra Enbridge. Integration of the businesses is going well and
we’ve made very good early progress in capturing the synergies from the
transaction.”

Growth Project Execution

Enbridge continued to progress the execution of its $27 billion secured growth
capital program, and has brought $2.4 billion of projects into service thus far
in 2017, including the Athabasca Twin pipeline, the Norlite diluent pipeline
and the Jackfish Lake natural gas pipeline expansion. These projects all are
supported by low-risk take-or-pay contracts or similar commercial arrangements
that will generate highly predictable earnings and cash flow. Over the
remainder of the year the Company expects to bring a further $11 billion of
growth projects into service in 2017, primarily in the third and fourth
quarters of the year, followed by another $4 billion of projects in 2018. Given
the timing and return profiles of these projects, the full earnings and cash
flow impacts will be seen in 2018 and beyond.

In February 2017, Enbridge added to its secured project inventory with the
announcement of the Hohe See Offshore Wind Project in Germany. As co-developer,
Enbridge will participate in the construction and operation of the project.
Once in service in late 2019, Enbridge’s total investment in the project will
be $1.7 billion (EUR1.07 billion).

Also in February 2017, Enbridge closed the acquisition of a 27.6% interest in
the Bakken Pipeline System. The System consists of the Dakota Access Pipeline
and the Energy Transfer Crude Oil Pipeline projects and connects the prolific
Bakken formation in North Dakota to eastern PADD II and the United States Gulf
Coast. The pipelines are expected to go into service in the second quarter of
2017.

On April 25, 2017, Enbridge launched a binding Open Season on its British
Columbia Pipeline T-South system for delivery of an incremental 190 mmcf/d of
natural gas into the Huntington/Sumas market at the Canadian/United States
border. The system is currently fully contracted and an expansion is necessary
to meet increasing customer demand as a result of rapidly growing production in
the prolific Montney and Duvernay regions. The project would include looping of
T-South and upgrades at compressor stations along the pipeline system at a cost
of approximately $1 billion. Subject to the outcome of the Open Season, the
project could be brought into service by late 2020.

“These recent opportunities demonstrated the magnitude and diversity of our
development pipeline,” noted Mr. Monaco.

“The Bakken Pipeline System enhances our presence in the Bakken and the United
States Gulf Coast and will be accretive to ACFFO immediately in 2017. The Hohe
See Offshore Wind Project illustrates the growth opportunities available to us
in European Offshore wind. And through our early Open Season process on our
western Canadian system we are expecting strong demand for the expansion of our
T-South gas pipeline given the attractive fundamentals supporting natural gas
production growth from the Montney and the Duvernay.”

Funding Progress

During the first quarter of 2017, Enbridge further strengthened its liquidity
and financial flexibility raising an additional $0.2 billion in committed term
credit and close to $0.3 billion of new equity through its dividend
reinvestment, “paid-in-kind” and “at the market” offering programs, across the
Enbridge group. In March of 2017, the Company raised additional funds through
sale of the Ozark pipeline for net proceeds of approximately $0.3 billion.

In addition, Enbridge raised approximately $0.6 billion of equity with the sale
of a portion of its interest in the Fund Group through a secondary offering of
shares of ENF. The sale was in keeping with the Company’s previously
communicated objective to gradually increase the public’s economic interest in
the Fund Group to approximately 20% over time and increase ENF’s public market
capitalization and trading liquidity. Enbridge currently holds an 84.6%
interest in the Fund Group and expects to retain a significant interest going
forward.

At the time of the announcement of the Spectra Energy merger in 2016, Enbridge
also announced its intention to divest $2 billion of assets to strengthen the
balance sheet and create further financing flexibility for the combined Company
going forward. With the sale of the Ozark pipeline, completion of the ENF
secondary offering and other asset sales completed in the fourth quarter of
2016, the Company has divested approximately $2.3 billion of assets, exceeding
its previously announced target.

Sponsored Vehicle Restructuring & Simplification

The Company believes that well-structured sponsored vehicles will continue be
an attractive alternative source of funding and an effective means through
which to enhance value and returns on energy infrastructure assets held within
the broader Enbridge group. In recent months, the Company has taken several
actions to strengthen and streamline its sponsored vehicles including the
simplification of DCP Midstream Partners, L.P. and the privatization of
Midcoast Energy Partners, L.P.

Most recently, on April 28, 2017, the Company announced the outcome of a
strategic review of EEP, which resulted in the implementation of a number of
restructuring actions to enhance the commercial and financial positon of EEP
and restore its effectiveness as a Sponsored Vehicle. Through these actions,
EEP will become a self-funding pure-play liquids pipeline Master Limited
Partnership with a low-risk business model, highly visible embedded organic
growth and a strong investment grade credit profile.

Commenting on the conclusion of the EEP strategic review, Mr. Monaco noted,
“EEP holds some of our most strategic and high-quality long-life critical
infrastructure assets in North America. The restructuring actions will position
EEP to create long term value for both its unitholders and Enbridge.”

Dividend Increase

In January 2017, Enbridge announced an increase in its quarterly common share
dividend by 10% to $0.583 per share, marking the twenty-second consecutive year
in which the Company has raised its dividend. On May 4, 2017, as previously
contemplated, Enbridge further increased its quarterly common share dividend by
approximately 5% to $0.61 per share, which in combination with the January
dividend increase, provides a total increase of 15% above the prevailing
quarterly rate in 2016.

“Our confidence in providing a 15% dividend per share increase this year
reflects the strength and stability of our base assets and a very positive
longer term outlook for the combined business,” noted Mr. Monaco. “Over the
longer term, we expect that the strength and diversity of our existing asset
base together with six strong growth platforms will enable Enbridge to deliver
dividend growth in the range of 10% to 12% per annum through 2024.”

Mr. Monaco concluded, “We firmly believe that the newly combined company, with
its low-risk business model and diversified platforms for growth, will create
strong value for all of our stakeholders well into the next decade.”

FIRST QUARTER 2017 PERFORMANCE OVERVIEW

For more information on Enbridge Inc.’s (Enbridge or the Company) growth
projects and operating results, please see Management’s Discussion and Analysis
(MD&A) which is filed on SEDAR and EDGAR and also available on the Company’s
website at www.enbridge.com/InvestorRelations.aspx.

HIGHLIGHTS

/T/

Three months ended
March 31,
2017 2016
—————————————————————————-
(unaudited, millions of Canadian dollars, except per
share amounts)
Earnings attributable to common shareholders
Liquids Pipelines 1,124 1,612
Gas Pipelines and Processing 339 61
Gas Distribution 275 239
Green Power and Transmission 50 49
Energy Services 156 (6)
Eliminations and Other (315) 221
——————–
Earnings before interest and income taxes 1,629 2,176
Interest expense (486) (412)
Income taxes (198) (417)
Earnings attributable to noncontrolling interests and
redeemable
noncontrolling interests (224) (61)
Preference share dividends (83) (73)
—————————————————————————-
Earnings attributable to common shareholders 638 1,213
Earnings per common share 0.54 1.38
Diluted earnings per common share 0.54 1.38
—————————————————————————-
—————————————————————————-
Adjusted earnings
Liquids Pipelines 970 1,084
Gas Pipelines and Processing 336 87
Gas Distribution 269 240
Green Power and Transmission 50 48
Energy Services (5) 1
Eliminations and Other (105) (86)
——————–
Adjusted earnings before interest and income taxes(1) 1,515 1,374
Interest expense(2) (465) (394)
Income taxes(2) (144) (176)
Noncontrolling interests and redeemable noncontrolling
interests(2) (148) (68)
Preference share dividends (83) (73)
—————————————————————————-
Adjusted earnings(1) 675 663
Adjusted earnings per common share(1) 0.57 0.76
—————————————————————————-
—————————————————————————-
Cash flow data
Cash provided by operating activities 1,677 1,861
Cash used in investing activities (3,523) (1,852)
Cash provided by financing activities 1,593 751
—————————————————————————-
—————————————————————————-
Available cash flow from operations(3)
Available cash flow from operations 1,215 1,114
Available cash flow from operations per common share 1.03 1.27
—————————————————————————-
—————————————————————————-
Dividends
Common share dividends declared 548 460
Dividends paid per common share 0.583 0.530
—————————————————————————-
—————————————————————————-
Shares outstanding (millions)
Weighted average common shares outstanding 1,177 876
Diluted weighted average common shares outstanding 1,187 882
—————————————————————————-
—————————————————————————-
Operating data
Liquids Pipelines – Average deliveries (thousands of
barrels per day)
Canadian Mainline(4) 2,593 2,543
Lakehead System(5) 2,748 2,735
Regional Oil Sands System(6) 1,318 1,151
Gas Pipelines – Average throughput (millions of cubic
feet per day)
Alliance Pipeline Canada 1,629 1,659
Alliance Pipeline US 1,724 1,757
Canadian Midstream(7) 2,738 –
Gas Pipelines and Processing – Volumes processed
(millions of cubic feet per day)
Canadian Midstream(8) 2,036 –
US Midstream(9) 5,510 1,167
Gas Pipelines and Processing – natural gas liquids (NGL)
production (thousands of barrels per day)
US Midstream(9) 486 138
Gas Distribution – Enbridge Gas Distribution Inc. (EGD)
Volumes (billions of cubic feet) 171 174
Number of active customers (thousands)(10) 2,168 2,138
Heating degree days(11)
Actual 1,686 1,709
Forecast based on normal weather volume 1,875 1,831
Gas Distribution – Union Gas
Volumes (billions of cubic feet) 149 –
Number of active customers (thousands)(10) 1,461 –
Heating degree days(11)
Actual 601 –
Forecast based on normal weather volume 576 –
—————————————————————————-
—————————————————————————-
1 Adjusted EBIT, adjusted earnings and adjusted earnings per common share
are non-GAAP measures that do not have any standardized meaning
prescribed by GAAP – see Non-GAAP Measures.
2 These balances are presented net of adjusting items.
3 ACFFO is defined as cash flow provided by operating activities before
changes in operating assets and liabilities (including changes in
environmental liabilities) less distributions to noncontrolling
interests and redeemable noncontrolling interests, preference share
dividends and maintenance capital expenditures, and further adjusted for
unusual, non-recurring or non-operating factors. ACFFO and ACFFO per
common share are non-GAAP measures that do not have any standardized
meaning prescribed by GAAP.
4 Canadian Mainline throughput volume represents mainline system
deliveries ex-Gretna, Manitoba which is made up of United States and
eastern Canada deliveries originating from western Canada.
5 Lakehead Pipeline System (Lakehead System) throughput volume represents
mainline system deliveries to the United States
mid-west and eastern Canada.
6 Volumes are for the Athabasca mainline, Athabasca Twin, Waupisoo
Pipeline and Woodland Pipeline and exclude laterals on the Regional Oil
Sands System.
7 Canadian Midstream throughput volumes represent throughput from the
Western Canada Transmission & Processing assets only.
8 Canadian Midstream processing volumes represent the volumes processed
through the Tupper Main and Tupper West gas plants (Tupper Plants) and
the Western Canada Transmission & Processing assets.
9 US Midstream processing volumes and NGL production represent the volumes
processed and produced from the Field Services assets and the Midcoast
Energy Partnership assets as well as the Aux Sable processing plant.
10 Number of active customers is the number of natural gas consuming EGD
and Union Gas customers at the end of the period.
11 Heating degree days is a measure of coldness that is indicative of
volumetric requirements for natural gas utilized for heating purposes in
EGD’s and Union Gas’s franchise area. It is calculated by accumulating,
for the fiscal period, the total number of degrees each day by which the
daily mean temperature falls below 18 degrees Celsius. The figures given
are those accumulated in the Greater Toronto Area.

/T/

EARNINGS BEFORE INTEREST AND INCOME TAXES

For the three months ended March 31, 2017, EBIT was $1,629 million compared
with $2,176 million for the three months ended March 31, 2016. As discussed
below in Adjusted EBIT, the first quarter of 2017 earnings were positively
impacted by the contributions from new assets following the completion of the
Merger Transaction on February 27, 2017.

The quarter-over-quarter decrease in EBIT was largely driven by the Liquids
Pipelines segment, which delivered lower adjusted EBIT for the three months
ended March 31, 2017, mainly attributable to a lower effective foreign exchange
rate, the divestiture of certain Liquids Pipelines assets and a change in
normalization policy for recording make-up rights. EBIT for the rest of the
year is expected to be positively impacted by increased throughput optimization
on the mainline system and the effect of new projects coming into service in
2017.

The comparability of the Company’s earnings quarter-over-quarter is also
impacted by a number of unusual, non-recurring or non-operating factors that
are enumerated in the Non-GAAP Reconciliation tables and discussed in the
results for each reporting segment, the most significant of which are changes
in unrealized derivative fair value gains and losses. For the three months
ended March 31, 2017, the Company’s EBIT reflected $416 million of unrealized
derivative fair value gains compared with gains of $932 million in the
corresponding 2016 period. The Company has a comprehensive long-term economic
hedging program to mitigate interest rate, foreign exchange and commodity price
risks which create volatility in short-term earnings. Over the long term,
Enbridge believes its hedging program supports the reliable cash flows and
dividend growth upon which the Company’s investor value proposition is based.

EBIT for the first quarter of 2017 also reflected charges of $152 million ($111
million after-tax) with respect to costs incurred in conjunction with the
Merger Transaction, as well as $129 million ($92 million after-tax) of employee
severance costs in relation to the Company’s enterprise-wide reduction of
workforce in March 2017 and restructuring costs in connection with the
completion of the Merger Transaction.

EARNINGS ATTRIBUTABLE TO COMMON SHAREHOLDERS

Earnings attributable to common shareholders were $638 million for the three
months ended March 31, 2017, or earnings of $0.54 per common share, compared
with $1,213 million, or earnings of $1.38 per common share, for the three
months ended March 31, 2016. As further discussed in Adjusted EBIT, first
quarter earnings were positively impacted by contributions from assets acquired
following the completion of the Merger Transaction on February 27, 2017.

In addition to the factors discussed in EBIT above and in Adjusted EBIT and
Adjusted Earnings below, the quarter-over-quarter comparability of earnings
attributable to common shareholders was impacted by a number of unusual,
non-recurring and non-operating factors that are summarized under Non-GAAP
Reconciliation – EBIT to Adjusted Earnings.

A lower earnings per common share for the three months ended March 31, 2017
compared with the corresponding 2016 period also reflected the issuance of
approximately 691 million common shares in February 2017 as part of the
consideration for the Merger Transaction, and other issuances of approximately
75 million common shares in 2016, inclusive of 56 million common shares issued
in March 2016.

ADJUSTED EARNINGS BEFORE INTEREST AND INCOME TAXES

For the three months ended March 31, 2017, adjusted EBIT was $1,515 million, an
increase of $141 million over the comparable period in 2016. The first quarter
of 2017 adjusted EBIT reflected 33 days of results of operations from new
assets following the completion of the Merger Transaction on February 27, 2017.
Contributions from these new assets were the key driver for the
quarter-over-quarter growth in consolidated adjusted EBIT.

Growth in consolidated adjusted EBIT was most pronounced in the Gas Pipelines
and Processing segment, where a majority of the new assets acquired through the
Merger Transaction are reported. Quarter-over-quarter growth for this segment
also reflected contributions from the Tupper Main and Tupper West gas plants
acquired in April 2016, as well as higher adjusted EBIT from Alliance Pipeline
that was driven by strong demand for seasonal firm service in the first quarter
of 2017.

Adjusted EBIT for Liquids Pipelines in the first quarter of 2017 was lower than
the comparable period in 2016, attributable to several factors, including a
lower quarter-over-quarter foreign exchange hedge rate used to record Canadian
Mainline revenues. The IJT Benchmark Toll and its components are set in United
States dollars and the majority of the Company’s foreign exchange risk on
Canadian Mainline revenues is hedged. The effective hedge rate for the
translation of Canadian Mainline United States dollar transactional revenues
for the first quarter of 2017 was $1.04 compared with $1.11 for the
corresponding period in 2016. In addition, the Canadian dollar foreign exchange
rate at which United States operations were translated strengthened from $1.37
in the first quarter of 2016 to $1.32 for the corresponding period in 2017.

Further contributing to lower quarter-over-quarter EBIT was the sale of certain
assets and reduced surcharges on the Bakken System and lower contributions on
rail facilities owned by EEP due to expiry of contracts. In addition, EBIT
generated by the United States Mid-Continent and Gulf Coast Systems were lower
in the first quarter of 2017 as, effective January 1, 2017, the Company no
longer adjusts for revenue that is deferred from certain take or pay tolling
arrangements with make-up rights in its determination of adjusted EBIT. EBIT
for the rest of the year is expected to be positively impacted by increased
throughput optimization on the mainline system and the effect of new projects
coming into service in 2017.

Within the Gas Distribution segment, Enbridge Gas Distribution Inc. (EGD)
generated lower adjusted EBIT in the first quarter of 2017 compared with the
corresponding 2016 period, primarily due to lower distribution revenues
attributable to warmer than normal weather in the first quarter of 2017.
Effective January 1, 2017, EGD ceased to exclude the effect of warmer/colder
weathers from its adjusted EBIT. The effect of the warmer weather in EGD’s
adjusted EBIT for the first quarter of 2017 was approximately $29 million. The
quarter-over-quarter decrease in EGD’s adjusted EBIT was more than offset by
contributions from Union Gas since the completion of the Merger Transaction.

Within Eliminations and Other, higher operating and administrative expenses
drove an increase in the quarter-over-quarter adjusted loss. Operating and
administrative costs were higher in the first quarter of 2017 due to higher
information technology and other centralized service costs post integration
with Spectra Energy and proportionally lower recoveries from business units
during the quarter.

ADJUSTED EARNINGS

Adjusted earnings were $675 million, or $0.57 per common share, for the three
months ended March 31, 2017 compared with $663 million, or $0.76 per common
share, for the three months ended March 31, 2016.

Partially offsetting the quarter-over-quarter adjusted EBIT growth discussed
above was higher interest expense as a result of debt assumed in the Merger
Transaction. Preference share dividends were also higher quarter-over-quarter
reflecting additional preference shares issued in the fourth quarter of 2016 to
partially fund the Company’s growth capital program.

Income taxes were lower in the first quarter of 2017 despite the
quarter-over-quarter increase in adjusted earnings due to a valuation allowance
expense recorded in the first quarter of 2016.

Adjusted earnings attributable to noncontrolling interests and redeemable
noncontrolling interests increased in the first quarter of 2017 compared with
the corresponding 2016 period. The increase was driven by additional
noncontrolling interests in respect of the assets acquired in the Merger
Transaction and an increase in earnings attributable to noncontrolling
interests as a result of the EEP restructuring.

Interest expense, income taxes and noncontrolling interests and redeemable
noncontrolling interests were also impacted by adjustments for unusual,
non-recurring and non-operating factors.

Adjusted earnings per common share for the three months ended March 31, 2017
compared with the corresponding 2016 period also reflected the issuance of
approximately 691 million common shares in February 2017 as part of the
consideration for the Merger Transaction, and other issuances of approximately
75 million common shares in 2016, inclusive of 56 million common shares issued
in March 2016.

AVAILABLE CASH FLOW FROM OPERATIONS

ACFFO for the first quarter of 2017 was $1,215 million, or $1.03 per common
share, compared with $1,114 million, or $1.27 per common share, for the first
quarter of 2016. The year-over-year growth in ACFFO amount was driven by the
same factors as discussed in Adjusted EBIT above, as well as other items
discussed below. However, ACFFO per common share has decreased
quarter-over-quarter as the Company’s ACFFO per common share was impacted by
the increase in the number of common shares outstanding which resulted from the
completion of the Merger Transaction on February 27, 2017, and other issuances
in 2016, as noted above in Adjusted Earnings.

Also contributing to the quarter-over-quarter increase in ACFFO were higher
cash distributions that the Company received from its equity investments,
resulting from their improved operating performance as well as distributions
from newly acquired equity investments which were a part of the Merger
Transaction.

The above positive effects on ACFFO quarter-over-quarter were partially offset
by higher maintenance capital expenditures in the first quarter of 2017, which
reflected the spending on assets acquired in the Merger Transaction and a
higher spending in Liquids Pipelines on certain leasehold improvements. The
increase was partially offset by a decrease in maintenance capital expenditures
in the Gas Distribution segment due to the timing of higher spending in 2016 on
EGD’s Work and Asset Management System (WAMS) program; and a decrease,
excluding the effect of the Merger Transaction, in the Gas Pipelines and
Processing segment due to a shift in the timing of maintenance capital
expenditure to the later quarters of 2017.

Also partially offsetting the increase in ACFFO was higher interest expense and
higher preference share dividends in the first quarter of 2017, as discussed in
Adjusted Earnings above.

The increase in ACFFO quarter-over-quarter was also partially offset by
increased distributions to noncontrolling interests related to assets acquired
in the Merger Transaction, and to redeemable noncontrolling interests due to
increased public ownership in the Fund Group (comprising the Enbridge Income
Fund, Enbridge Commercial Trust, Enbridge Income Partners LP (EIPLP) and the
subsidiaries and investees of EIPLP).

Other non-cash adjustments include various non-cash items presented in the
Company’s Consolidated Statements of Cash Flows, as well as adjustments for
unearned revenues received in each period.

FORWARD-LOOKING INFORMATION

Forward-looking information, or forward-looking statements, have been included
in this news release to provide information about the Company and its
subsidiaries and affiliates, including management’s assessment of Enbridge and
its subsidiaries’ future plans and operations. This information may not be
appropriate for other purposes. Forward-looking statements are typically
identified by words such as “anticipate”, “expect”, “project”, “estimate”,
“forecast”, “plan”, “intend”, “target”, “believe”, “likely” and similar words
suggesting future outcomes or statements regarding an outlook. Forward-looking
information or statements included or incorporated by reference in this
document include, but are not limited to, statements with respect to the
following: expected EBIT or expected adjusted EBIT; expected earnings/(loss) or
adjusted earnings/(loss); expected earnings/(loss) or adjusted earnings/(loss)
per share; expected ACFFO or ACFFO per share; expected future cash flows;
financial strength and flexibility; expected costs related to announced
projects and projects under construction; expected in-service dates for
announced projects and projects under construction; expected capital
expenditures; expected equity funding requirements for the Company’s
commercially secured growth program; expected future growth and expansion
opportunities; expected closing of acquisition and dispositions; estimated cost
and impact to the Company’s overall financial performance of complying with the
settlement consent decree related to Line 6B and Line 6A; estimated future
dividends; adjusted earnings per share guidance; ACFFO per share guidance;
dividend per share growth guidance; expectations on impact of hedging program;
expected future actions of regulators; expected costs related to leak
remediation and potential insurance recoveries; expectations regarding
commodity prices; supply forecasts; expectations regarding the impact of the
Merger Transaction including the combined Company’s scale, financial
flexibility, growth program, future business prospects and performance;
dividend payout policy; dividend growth; dividend payout expectation; strategic
alternatives currently being evaluated in connection with the United States
Sponsored Vehicle Strategy and the regulatory framework and recovery of
deferred costs by Enbridge Gas New Brunswick Inc.

Although Enbridge believes these forward-looking statements are reasonable
based on the information available on the date such statements are made and
processes used to prepare the information, such statements are not guarantees
of future performance and readers are cautioned against placing undue reliance
on forward-looking statements. By their nature, these statements involve a
variety of assumptions, known and unknown risks and uncertainties and other
factors, which may cause actual results, levels of activity and achievements to
differ materially from those expressed or implied by such statements. Material
assumptions include assumptions about the following: the expected supply of and
demand for crude oil, natural gas, NGL and renewable energy; prices of crude
oil, natural gas, NGL and renewable energy; exchange rates; inflation; interest
rates; availability and price of labour and construction materials; operational
reliability; customer and regulatory approvals; maintenance of support and
regulatory approvals for the Company’s projects; anticipated in-service dates;
weather; the realization of anticipated benefits and synergies of the Merger
Transaction, governmental legislation, acquisitions and the timing thereof; the
success of integration plans; cost of complying with the settlement consent
decree related to Line 6B and Line 6A; impact of the dividend policy on the
Company’s future cash flows; credit ratings; capital project funding; expected
EBIT or expected adjusted EBIT, expected earnings/(loss) or adjusted
earnings/(loss); expected earnings/(loss) or adjusted earnings/(loss)per share;
expected future cash flows and expected future ACFFO and ACFFO per share; and
estimated future dividends. Assumptions regarding the expected supply of and
demand for crude oil, natural gas, NGL and renewable energy, and the prices of
these commodities, are material to and underlie all forward-looking statements.
These factors are relevant to all forward-looking statements as they may impact
current and future levels of demand for the Company’s services. Similarly,
exchange rates, inflation and interest rates impact the economies and business
environments in which the Company operates and may impact levels of demand for
the Company’s services and cost of inputs, and are therefore inherent in all
forward-looking statements. Due to the interdependencies and correlation of
these macroeconomic factors, the impact of any one assumption on a
forward-looking statement cannot be determined with certainty, particularly
with respect to the impact of the Merger Transaction on the Company, expected
EBIT, adjusted EBIT, earnings/(loss), adjusted earnings/(loss), ACFFO and
associated per share amounts, or estimated future dividends. The most relevant
assumptions associated with forward-looking statements on announced projects
and projects under construction, including estimated completion dates and
expected capital expenditures, include the following: the availability and
price of labour and construction materials; the effects of inflation and
foreign exchange rates on labour and material costs; the effects of interest
rates on borrowing costs; the impact of weather; and customer, government and
regulatory approvals on construction and in-service schedules and cost recovery
regimes.

Enbridge’s forward-looking statements are subject to risks and uncertainties
pertaining to the impact of the Merger Transaction, adjusted EBIT, adjusted
earnings and adjusted earnings per share guidance, ACFFO and ACFFO per share
guidance, dividend per share growth guidance, operating performance, dividend
policy, regulatory parameters, project approval and support, renewals of rights
of way, weather, economic and competitive conditions, public opinion, changes
in tax laws and tax rates, exchange rates, interest rates, commodity prices,
supply of and demand for commodities, and the settlement consent decree related
to Line 6B and Line 6A, including but not limited to those risks and
uncertainties discussed in this news release and in the Company’s other filings
with Canadian and United States securities regulators. The impact of any one
risk, uncertainty or factor on a particular forward-looking statement is not
determinable with certainty as these are interdependent and Enbridge’s future
course of action depends on management’s assessment of all information
available at the relevant time. Except to the extent required by applicable
law, Enbridge assumes no obligation to publicly update or revise any
forward-looking statements made in this news release or otherwise, whether as a
result of new information, future events or otherwise. All subsequent
forward-looking statements, whether written or oral, attributable to Enbridge
or persons acting on the Company’s behalf, are expressly qualified in their
entirety by these cautionary statements.

CONFERENCE CALL

Enbridge will hold a joint conference call on Thursday, May 11, 2017 at 9:00
a.m. Eastern Time (7:00 a.m. Mountain Time) with Enbridge Income Fund Holdings
Inc., Enbridge Energy Partners, L.P., and Spectra Energy Partners, L.P. to
discuss the first quarter 2017 results. Analysts, members of the media and
other interested parties can access the call toll-free at 1-866-215-5508 or
within and outside North America at 1-514-841-2157 using the access code of
44798051#. The call will be audio webcast live at
http://edge.media-server.com/m/p/9gxn6d2m. A webcast replay and podcast will be
available approximately two hours after the conclusion of the event and a
transcript will be posted to the website within 24 hours. The replay will be
available for seven days after the call at toll-free 1-888-843-7419 or within
and outside North America at 1-630-652-3042 (access code 44798051#).

The conference call will begin with presentations by the Company’s President
and Chief Executive Officer and the Chief Financial Officer, followed by a
question and answer period for investment analysts.

Enbridge is North America’s premier energy infrastructure company with
strategic business platforms that include an extensive network of crude oil,
liquids and natural gas pipelines, regulated natural gas distribution utilities
and renewable power generation. The Company safely delivers an average of 2.8
million barrels of crude oil each day through its Mainline and Express
Pipeline, and accounts for nearly 68% of United States-bound Canadian crude oil
production, and moves approximately 20% of all natural gas consumed in the
United States serving key supply basins and demand markets. The Company’s
regulated utilities serve approximately 3.5 million retail customers in
Ontario, Quebec, New Brunswick and New York State. Enbridge also has a growing
involvement in electricity infrastructure with interests in more than 2,500 MW
of net renewable generating capacity, and an expanding offshore wind portfolio
in Europe. The Company has ranked on the Global 100 Most Sustainable
Corporations index for the past eight years; its common shares trade on the
Toronto and New York stock exchanges under the symbol ENB. Life takes energy
and Enbridge exists to fuel people’s quality of life. For more information,
visit www.enbridge.com. None of the information contained in, or connected to,
Enbridge’s website is incorporated in or otherwise part of this news release.

DIVIDEND DECLARATION

On May 4, 2017, the Enbridge Board of Directors declared the following
quarterly dividends. All dividends are payable on June 1, 2017, to shareholders
of record on May 15, 2017.

/T/

—————————————————————————-
Common Shares $0.61000
Preference Shares, Series A $0.34375
Preference Shares, Series B $0.25000
Preference Shares, Series D $0.25000
Preference Shares, Series F $0.25000
Preference Shares, Series H $0.25000
Preference Shares, Series J US$0.25000
Preference Shares, Series L US$0.25000
Preference Shares, Series N $0.25000
Preference Shares, Series P $0.25000
Preference Shares, Series R $0.25000
Preference Shares, Series 1 US$0.25000
Preference Shares, Series 3 $0.25000
Preference Shares, Series 5 US$0.27500
Preference Shares, Series 7 $0.27500
Preference Shares, Series 9 $0.27500
Preference Shares, Series 11 $0.27500
Preference Shares, Series 13 $0.27500
Preference Shares, Series 15 $0.27500
Preference Shares, Series 17 $0.32188
—————————————————————————-
—————————————————————————-

/T/

NON-GAAP MEASURES

This news release contains references to adjusted EBIT, adjusted
earnings/(loss), adjusted earnings/(loss) per common share, ACFFO, and ACFFO
per common share. Adjusted EBIT represents EBIT adjusted for unusual,
non-recurring or non-operating factors on both a consolidated and segmented
basis. Adjusted earnings/(loss) represents earnings or loss attributable to
common shareholders adjusted for unusual, non-recurring or non-operating
factors included in adjusted EBIT, as well as adjustments for unusual,
non-recurring or non-operating factors in respect of interest expense, income
taxes, noncontrolling interests and redeemable noncontrolling interests on a
consolidated basis. These factors, referred to as adjusting items, are
reconciled and discussed in the financial results sections for the affected
business segments in the Company’s MD&A.

ACFFO is defined as cash flow provided by operating activities before changes
in operating assets and liabilities (including changes in environmental
liabilities) less distributions to noncontrolling interests and redeemable
noncontrolling interests, preference share dividends and maintenance capital
expenditures, and further adjusted for unusual, non-recurring or non-operating
factors.

Management believes the presentation of adjusted EBIT, adjusted
earnings/(loss), adjusted earnings/(loss) per common share, ACFFO and ACFFO per
common share gives useful information to investors and shareholders as they
provide increased transparency and insight into the performance of the Company.
Management uses adjusted EBIT and adjusted earnings/(loss) to set targets and
to assess the performance of the Company. Management also uses ACFFO to assess
the performance of the Company and to set its dividend payout target. Adjusted
EBIT, adjusted EBIT for each segment, adjusted earnings/(loss), adjusted
earnings/(loss) per common share, ACFFO and ACFFO per common share are not
measures that have standardized meaning prescribed by generally accepted
accounting principles in the United States of America (U.S. GAAP) and are not
U.S. GAAP measures. Therefore, these measures may not be comparable with
similar measures presented by other issuers.

NON-GAAP RECONCILIATION – EBIT TO ADJUSTED EARNINGS

/T/

Three months ended
March 31,
2017 2016
—————————————————————————-
(millions of Canadian dollars)
Earnings before interest and income taxes 1,629 2,176
Adjusting items(1):
Change in unrealized derivative fair value gains(2) (416) (932)
Unrealized intercompany foreign exchange loss 7 60
Hydrostatic testing – (12)
Make-up rights adjustments(3) – 67
Leak remediation costs, net of leak insurance
recoveries 4 15
Warmer than normal weather(4) – 17
Project development and transaction costs 153 –
Employee severance and restructuring costs 129 –
Other 9 (17)
—————————————————————————-
Adjusted earnings before interest and income taxes 1,515 1,374
—————————————————————————-
Interest expense (486) (412)
Income taxes (198) (417)
Earnings attributable to noncontrolling interest and
redeemable noncontrolling
interests (224) (61)
Preference share dividends (83) (73)
Adjusting items in respect of:
Interest expense 21 18
Income taxes 54 241
Noncontrolling interests and redeemable noncontrolling
interests 76 (7)
—————————————————————————-
Adjusted earnings 675 663
—————————————————————————-
—————————————————————————-
1 The above table summarizes adjusting items by nature. For a detailed
listing of adjusting items by segment, refer to individual segment
discussions in the Company’s MD&A for the quarter ended March 31, 2017.
2 Changes in unrealized derivative fair value gains are presented net of
amounts realized on the settlement of derivative contracts during the
applicable period.
3 Effective January 1, 2017, the Company no longer makes such an
adjustment to its EBIT. For further details refer to Liquids Pipelines
segment discussion in the Company’s MD&A for the quarter ended March 31,
2017.
4 Effective January 1, 2017, the Company no longer makes such an
adjustment to its EBIT. For further details refer to Gas Distribution
segment discussion in the Company’s MD&A for the quarter ended March 31,
2017.

/T/

NON-GAAP RECONCILIATION – ADJUSTED EBIT TO ACFFO

To facilitate understanding of the relationship between adjusted EBIT and
ACFFO, the following table provides a reconciliation of these two key non-GAAP
measures.

/T/

Three months ended
March 31,
2017 2016
—————————————————————————-
(millions of Canadian dollars)
Adjusted earnings before interest and income taxes 1,515 1,374
Depreciation and amortization(1) 672 559
Maintenance capital(2) (182) (151)
—————————————————————————-
2,005 1,782
Interest expense(3) (479) (394)
Current income taxes(3) (41) (47)
Distributions to noncontrolling interests (191) (184)
Distributions to redeemable noncontrolling interests (54) (42)
Preference share dividends (83) (73)
Cash distributions less than equity earnings(3) (13) (22)
Other non-cash adjustments 71 94
—————————————————————————-
Available cash flow from operations 1,215 1,114
—————————————————————————-
—————————————————————————-
1 Depreciation and amortization:
Liquids Pipelines 356 346
Gas Pipelines and Processing 136 74
Gas Distribution 112 80
Green Power and Transmission 51 48
Eliminations and Other 17 11
—————————————————————————-
672 559
—————————————————————————-
—————————————————————————-
2 Maintenance capital:
Liquids Pipelines (51) (43)
Gas Pipelines and Processing (40) (11)
Gas Distribution (65) (81)
Green Power and Transmission (1) (1)
Eliminations and Other (25) (15)
—————————————————————————-
(182) (151)
—————————————————————————-
—————————————————————————-
3 These balances are presented net of adjusting items.

/T/

NON-GAAP RECONCILIATION – AVAILABLE CASH FLOW FROM OPERATIONS

/T/

Three months ended
March 31,
2017 2016
—————————————————————————-
(millions of Canadian dollars)
Cash provided by operating activities – continuing
operations 1,677 1,861
Adjusted for changes in operating assets and
liabilities(1) (241) (122)
——————–
1,436 1,739
Distributions to noncontrolling interests (191) (184)
Distributions to redeemable noncontrolling interests (54) (42)
Preference share dividends (83) (73)
Maintenance capital expenditures(2) (182) (151)
Significant adjusting items:
Weather normalization – 13
Make-up rights 13 67
Project development and transaction costs 152 –
Realized inventory revaluation allowance – (268)
Employee severance and restructuring costs(3 ) 127 –
Other items (3) 13
—————————————————————————-
Available cash flow from operations 1,215 1,114
—————————————————————————-
—————————————————————————-
Available cash flow from operations per common share 1.03 1.27
—————————————————————————-
—————————————————————————-
1 Changes in operating assets and liabilities include changes in
environmental liabilities, net of recoveries.
2 Maintenance capital expenditures are expenditures that are required for
the ongoing support and maintenance of the existing pipeline system or
that are necessary to maintain the service capability of the existing
assets (including the replacement of components that are worn, obsolete
or completing their useful lives). For the purpose of ACFFO, maintenance
capital excludes expenditures that extend asset useful lives, increase
capacities from existing levels or reduce costs to enhance revenues or
provide enhancements to the service capability of the existing assets.
3 Realized inventory revaluation allowance relates to losses on sale of
previously written down inventory for which there is an approximate
offsetting realized derivative gain in ACFFO.

/T/

– END RELEASE – 11/05/2017

For further information:
Enbridge Inc. – Media
Suzanne Wilton
(403) 231-7385 or Toll Free: (888) 992-0997
Email: [email protected]
OR
Enbridge Inc. – Investment Community
Jonathan Gould
(403) 231-3916 or Toll Free: (800) 481-2804
Email: [email protected]

COMPANY:
FOR: ENBRIDGE INC.
TSX SYMBOL: ENB
NYSE SYMBOL: ENB

INDUSTRY: Energy and Utilities – Oil and Gas
RELEASE ID: 20170511CC0023

Press Release from Marketwired 1-866-736-3779

All press releases are written by the client and have NO affiliation with the news copy written by The Canadian Press. Any questions that arise due to the content or information provided in the press release should be directed to the company/organization
issuing the release, not to The Canadian Press.

GET ENERGYNOW’S DAILY EMAIL FOR FREE


Valener Declares Quarterly Dividends and Extends 4% Annual Common Dividend Growth Target Through 2022

FOR: VALENER INC.TSX SYMBOL: VNRTSX SYMBOL: VNR.PR.ADate issue: May 11, 2017Time in: 7:00 AM eAttention:
MONTREAL, QUEBEC–(Marketwired – May 11, 2017) – Valener Inc. (“Valener”)
(TSX:VNR)(TSX:VNR.PR.A) today announced that its Board of Directors decl…

GET ENERGYNOW’S DAILY EMAIL FOR FREE


TransGlobe Energy Corporation Announces First Quarter 2017 Financial and Operating Results

FOR: TRANSGLOBE ENERGY CORPORATIONTSX SYMBOL: TGLNASDAQ SYMBOL: TGADate issue: May 11, 2017Time in: 6:00 AM eAttention:
CALGARY, ALBERTA–(Marketwired – May 11, 2017) – TransGlobe Energy Corporation
(“TransGlobe” or the “Company”) (TSX:TGL)(NASDAQ:TGA…

GET ENERGYNOW’S DAILY EMAIL FOR FREE


MEG Energy reports first quarter 2017 results

FOR: MEG ENERGY CORP.
TSX Symbol: MEG

Date issue: May 11, 2017
Time in: 5:00 AM e

Attention:

MEG Energy’s fully-funded 2017 growth program gets off to a strong start,
heading toward production increases commencing in the third quarter; All
financial figures in Canadian dollars ($ or C$) unless otherwise noted

CALGARY, AB –(Marketwired – May 11, 2017) – MEG Energy Corp. (TSX: MEG)
today reported first quarter 2017 operating and financial results. Highlights
include:

/T/

— Quarterly production volumes of 77,245 barrels per day (bpd);
— Net operating costs of $8.43 per barrel and non-energy operating costs

of $5.20 per barrel;
— Total cash capital investment of $78 million, primarily directed towards
the eMSAGP growth initiative at Christina Lake Phase 2B;
— Cash and cash equivalents of $549 million as of March 31, 2017; and
— The completion of a comprehensive refinancing which has contributed to a
strengthened financial profile, with its equity component primarily
funding MEG’s 20,000 bpd growth plans at Christina Lake.

/T/

MEG’s first quarter 2017 production was 77,245 bpd, compared to 76,640 bpd for
the first quarter of 2016. Production for the first quarter met the forecast
provided by the company in its 2016 year end disclosure, and was partially
impacted by preparatory work to facilitate the drilling of infill wells and
pipeline maintenance at the Christina Lake project. MEG increased production
over first quarter 2016 levels primarily due to the continued implementation
of eMSAGP, which has improved reservoir efficiency and allowed for
redeployment of steam, enabling the company to place additional wells into
production. MEG is on track to meet its annual production guidance of 80,000
bpd to 82,000 bpd and targets exit production for 2017 of 86,000 bpd to 89,000
bpd.

“By initiating the expansion of eMSAGP to our Phase 2B assets which represent
75% of our production, we are embarking on a step change for MEG’s business,”
said Bill McCaffrey, President and Chief Executive Officer. “We are very
excited that our drilling program is proceeding on time and on budget and when
we see production ramp up beginning in the third quarter, the benefits of this
technology will become evident. Where we have already implemented it, the
eMSAGP process has enabled us to increase production, reduce costs and cut the
steam-oil ratio by about 50% to an industry-leading range of 1.0 to 1.25.”

MEG anticipates that the company’s next project, known as the Phase 2B
brownfield expansion, will proceed in 2018, with actual timing to be
determined as the company formulates its 2018 capital budget later this year.
This expansion will add a further 13,000 barrels per day and can be done
concurrently with the implementation of eMSAGP. The company expects the eMSAGP
and brownfield expansions to bring production to approximately 113,000 barrels
per day and reduce corporate cash costs by $6 to $7 per barrel.

For the first quarter of 2017, non-energy operating costs averaged $5.20 per
barrel compared to $6.45 per barrel for the same period in 2016, mainly due to
efficiency gains and a continued focus on cost management. Energy operating
costs averaged $4.18 per barrel for the first quarter of 2017 compared to
$2.90 per barrel for the first quarter of 2016, primarily due to increased
natural gas prices.

MEG realized adjusted funds flow of $43 million for the first quarter of 2017
compared to negative adjusted funds flow of $131 million for the same period
in 2016. The increase in adjusted funds flow is directly correlated to
increased bitumen realization as a result of an increase in average U.S. crude
oil benchmark pricing. Adjusted funds flow was also impacted by MEG’s bitumen
production exceeding sales volumes as the company focused on maximizing future
revenues, as well as a transitional one-time $9 million interest expense
associated with MEG’s debt restructuring incurred to take advantage of a lower
early redemption premium on MEG’s 2021 notes.

The company recorded a first quarter 2017 operating loss of $79 million
compared to an operating loss of $197 million for the same period in 2016. The
decrease in operating loss reflects the same factors impacting adjusted funds
flow.

Capital Investment and Financial Liquidity

Total cash capital investment during the first quarter of 2017 was $78
million, compared to $35 million for the same period in 2016. Capital
investment in 2017 was primarily directed towards the company’s eMSAGP
production growth initiative at Christina Lake Phase 2B. In the first quarter,
the company drilled 14 out of a total of 39 infill wells planned for 2017,
with as many as 28 additional SAGD well pairs planned for the remainder of the
year. MEG expects to fund the remaining 2017 capital program with a
combination of internally generated funds flow and $549 million of cash on
hand as of March 31, 2017.

MEG has entered into a series of hedges designed to protect its capital
program against downward movements in crude oil prices. MEG’s five-year
covenant-lite US$1.4 billion credit facility remains undrawn.

Operational and Financial Highlights

The following table summarizes selected operational and financial information
of the Corporation for the periods noted. All dollar amounts are stated in
Canadian dollars ($ or C$) unless otherwise noted:

/T/

—————————————————————————-

2017 2016 2015
—————————————————————————-
($ millions, except
as indicated) Q1 Q4 Q3 Q2 Q1 Q4 Q3 Q2
—————————————————————————-
Bitumen production –
bbls/d 77,245 81,780 83,404 83,127 76,640 83,514 82,768 71,376

Bitumen realization
– $/bbl 37.93 36.17 30.98 30.93 11.43 23.17 31.03 44.54

Net operating costs
– $/bbl(1) 8.43 8.24 7.76 7.43 8.53 8.52 9.10 9.43

Non-energy operating
costs – $/bbl 5.20 4.99 5.32 5.81 6.45 5.66 5.98 7.01

Cash operating
netback – $/bbl(2) 22.33 21.73 16.74 16.09 (3.71) 9.05 16.41 29.64

Adjusted funds
flow(3) 43 40 23 7 (131) (44) 24 99
Per share,
diluted(3) 0.16 0.18 0.10 0.03 (0.58) (0.20) 0.11 0.44
Operating earnings
(loss)(3) (79) (72) (88) (98) (197) (140) (87) (23)
Per share,
diluted(3) (0.29) (0.32) (0.39) (0.43) (0.88) (0.62) (0.39) (0.10)
Revenue(4) 560 566 497 513 290 445 460 555
Net earnings
(loss)(5) 2 (305) (109) (146) 131 (297) (428) 63
Per share, basic 0.01 (1.34) (0.48) (0.65) 0.58 (1.32) (1.90) 0.28
Per share, diluted 0.01 (1.34) (0.48) (0.65) 0.58 (1.32) (1.90) 0.28

Total cash capital
investment(6) 78 63 19 20 35 54 32 90

Cash and cash
equivalents 549 156 103 153 125 408 351 438
Long-term debt(7) 4,945 5,053 4,910 4,871 4,859 5,190 5,024 4,678
—————————————————————————-

/T/

/T/

(1) Net operating costs include energy and non-energy operating costs,

reduced by power revenue.
(2) Cash operating netback is calculated by deducting the related diluent
expense, transportation, operating expenses, royalties and realized
commodity risk management gains (losses) from proprietary blend revenues
and power revenues, on a per barrel of bitumen sales volume basis.
(3) Adjusted funds flow, Operating earnings (loss) and the related per share
amounts do not have standardized meanings prescribed by IFRS and
therefore may not be comparable to similar measures used by other
companies. For the three months ended March 31, 2017 and March 31, 2016,
the non-GAAP measure of adjusted funds flow is reconciled to net cash
provided by (used in) operating activities and the non-GAAP measure of
operating earnings (loss) is reconciled to net earnings (loss) in
accordance with IFRS under the heading “NON-GAAP MEASURES” and discussed
further in the “ADVISORY” section.
(4) The total of Petroleum revenue, net of royalties and Other revenue as
presented on the Interim Consolidated Statement of Earnings and
Comprehensive Income.
(5) Includes a net unrealized foreign exchange gain of $36.7 million on the
Corporation’s U.S. dollar denominated debt and U.S. dollar denominated
cash and cash equivalents for the three months ended March 31, 2017. The
net earnings for the three months ended March 31, 2016 includes a net
unrealized foreign exchange gain of $320.3 million.
(6) Defined as total capital investment excluding dispositions, capitalized
interest, capitalized cash-settled stock-based compensation and non-cash
items.
(7) On December 8, 2016, Fitch Ratings (“Fitch”) assigned the Corporation a
first-time Long-Term Issuer Default Rating of B, and assigned a rating
of BB to the Corporation’s covenant-lite revolving credit facility and
term loan and a rating of B to the Corporation’s Senior Unsecured Notes.
On January 12, 2017, Fitch assigned a BB rating to the Corporation’s new
Senior Secured Second Lien Notes (see the “Capital Resources” section of
the MD&A contained in MEG’s First Quarter 2017 Report to Shareholders).
Fitch’s rating outlook is negative. On January 12, 2017, Standard &
Poor’s Ratings Services (“S&P”) assigned a BB+ rating to the
Corporation’s new Senior Secured Second Lien Notes. On January 12, 2017,
Moody’s Investors Service (“Moody’s”) upgraded the Corporation’s
Corporate Family Rating to B3 from Caa2, the Probability of Default
Rating to B3-PD from Caa2-PD and the Corporation’s Senior Unsecured
Notes rating to Caa2 from Caa3. Moody’s Speculative Grade Liquidity
Rating was raised to SGL-1 from SGL-2. Moody’s also assigned a rating of
Ba3 to the Corporation’s covenant-lite revolving credit facility and
refinanced term loan and a rating of Caa1 to the new Senior Secured
Second Lien Notes. Moody’s rating outlook was changed to stable from
negative.

/T/

Basis of Presentation

MEG prepares its financial statements in accordance with International
Financial Reporting Standards (“IFRS”) and presents financial results in
Canadian dollars ($ or C$), which is the corporation’s functional currency.

Non-GAAP Measures

Certain financial measures in this new release including: net marketing
activity, funds flow, adjusted funds flow, operating earnings (loss),
operating cash flow and total debt are non-GAAP measures. These terms are not
defined by IFRS and, therefore, may not be comparable to similar measures
provided by other companies. These non-GAAP financial measures should not be
considered in isolation or as an alternative for measures of performance
prepared in accordance with IFRS.

Funds Flow and Adjusted Funds Flow

Funds flow and adjusted funds flow are non-GAAP measures utilized by the
Corporation to analyze operating performance and liquidity. Funds flow
excludes the net change in non-cash operating working capital while the IFRS
measurement “net cash provided by (used in) operating activities” includes
these items. Adjusted funds flow excludes the net change in non-cash operating
working capital, payments on onerous contracts, and decommissioning
expenditures while the IFRS measurement “net cash provided by (used in)
operating activities” includes these items. Funds flow and adjusted funds flow
are not intended to represent net cash provided by (used in) operating
activities calculated in accordance with IFRS. Funds flow and adjusted funds
flow are reconciled to net cash provided by (used in) operating activities in
the table below.

/T/

—————————————————————————-

Three months ended March 31
—————————————————————————-
($000) 2017 2016
—————————————————————————-
Net cash provided by (used in) operating
activities $ 45,806 $ (220,671)
Net change in non-cash operating
working capital items (8,187) 87,840
—————————————————————————-
Funds flow 37,619 (132,831)
Adjustments:
Payments on onerous contracts 4,134 629
Decommissioning expenditures 1,422 962
—————————————————————————-
Adjusted funds flow $ 43,175 $ (131,240)
—————————————————————————-

/T/

Operating Earnings (Loss)

Operating earnings (loss) is a non-GAAP measure which the Corporation uses as
a performance measure to provide comparability of financial performance
between periods by excluding non-operating items. Operating earnings (loss) is
defined as net earnings (loss) as reported, excluding unrealized foreign
exchange gains and losses, unrealized gains and losses on derivative financial
instruments, unrealized gains and losses on commodity risk management, onerous
contracts expense, and the respective deferred tax impact on these
adjustments. Operating earnings (loss) is reconciled to “Net earnings (loss)”,
the nearest IFRS measure, in the table below.

/T/

—————————————————————————-

Three months ended March 31
—————————————————————————-
($000) 2017 2016
—————————————————————————-
Net earnings (loss) $ 1,588 $ 130,829
Adjustments:
Unrealized net loss (gain) on foreign
exchange(1) (36,707) (320,281)
Unrealized loss (gain) on derivative
financial liabilities(2) (2,241) 5,489
Unrealized loss (gain) on commodity risk
management(3) (59,599) (16,963)
Onerous contracts expense(4) 2,375 4,371
Deferred tax expense (recovery) relating
to these adjustments 15,230 (731)
—————————————————————————-
Operating earnings (loss) $ (79,354) $ (197,286)
—————————————————————————-

/T/

/T/

Unrealized net foreign exchange gains and losses result from the
(1) translation of U.S. dollar denominated long-term debt and cash and cash
equivalents using period-end exchange rates.
Unrealized gains and losses on derivative financial liabilities result
from the interest rate floor on the Corporation’s long-term debt and
(2) interest rate swaps entered into to effectively fix a portion of its
variable rate long-term debt.
Unrealized gains or losses on commodity risk management contracts
(3) represent the change in the mark-to-market position of the unsettled
commodity risk management contracts during the period.
During the three months ended March 31, 2017, onerous contracts expense
was recognized primarily due to changes in estimated future cash flow
sublease recoveries related to the onerous office lease provision for
(4) certain corporate office building lease contracts. During the three
months ended March 31, 2016, onerous contracts expenses were recognized
primarily due to the reduction of the Corporation’s capital program for
2016 and its impact on drilling contracts.

/T/

This document may contain forward-looking information including but not
limited to: expectations of future production, revenues, expenses, cash flow,
operating costs, steam-oil ratios, pricing differentials, reliability,
profitability and capital investments; estimates of reserves and resources;
anticipated reductions in operating costs as a result of optimization and
scalability of certain operations; and anticipated sources of funding for
operations and capital investments. Such forward-looking information is based
on management’s expectations and assumptions regarding future growth, results
of operations, production, future capital and other expenditures, plans for
and results of drilling activity, environmental matters, and business
prospects and opportunities.

By its nature, such forward-looking information involves significant known and
unknown risks and uncertainties, which could cause actual results to differ
materially from those anticipated. These risks include, but are not limited
to: risks associated with the oil and gas industry, for example, results
securing access to markets and transportation infrastructure; availability of
capacity on the electricity transmission grid; uncertainty of reserve and
resource estimates; uncertainty associated with estimates and projections
relating to production, costs and revenues; health, safety and environmental
risks; risks of legislative and regulatory changes to, amongst other things,
tax, land use, royalty and environmental laws; assumptions regarding and the
volatility of commodity prices, interest rates and foreign exchange rates,
and, risks and uncertainties related to commodity price, interest rate and
foreign exchange rate swap contracts and/or derivative financial instruments
that MEG may enter into from time to time to manage its risk related to such
prices and rates; risks and uncertainties associated with securing and
maintaining the necessary regulatory approvals and financing to proceed with
MEG’s future phases and the expansion and/or operation of MEG’s projects;
risks and uncertainties related to the timing of completion, commissioning,
and start-up, of MEG’s future phases, expansions and projects; the operational
risks and delays in the development, exploration, production, and the
capacities and performance associated with MEG’s projects; and uncertainties
arising in connection with any future disposition of assets.

Although MEG believes that the assumptions used in such forward-looking
information are reasonable, there can be no assurance that such assumptions
will be correct. Accordingly, readers are cautioned that the actual results
achieved may vary from the forward-looking information provided herein and
that the variations may be material. Readers are also cautioned that the
foregoing list of assumptions, risks and factors is not exhaustive.

Further information regarding the assumptions and risks inherent in the making
of forward-looking statements can be found in MEG’s most recently filed Annual
Information Form (“AIF”), along with MEG’s other public disclosure documents.
Copies of the AIF and MEG’s other public disclosure documents are available
through the SEDAR website which is available at www.sedar.com.

The forward-looking information included in this document is expressly
qualified in its entirety by the foregoing cautionary statements. Unless
otherwise stated, the forward-looking information included in this document is
made as of the date of this document and MEG assumes no obligation to update
or revise any forward-looking information to reflect new events or
circumstances, except as required by law.

A full version of MEG’s First Quarter 2017 Report to Shareholders, including
unaudited financial statements, is available at www.megenergy.com/investors
and at www.sedar.com.

A conference call will be held to review the financial results at 7:30 a.m.
Mountain Time (9:30 a.m. Eastern Time) on Thursday, May 11, 2017. The
U.S./Canada toll-free conference call number is 1 866-225-0198. The
international/local conference call number is 416-340-2218.

MEG Energy Corp. is focused on sustainable in situ oil sands development and
production in the southern Athabasca oil sands region of Alberta, Canada. MEG
is actively developing enhanced oil recovery projects that utilize SAGD
extraction methods. MEG’s common shares are listed on the Toronto Stock
Exchange under the symbol “MEG.”

– END RELEASE – 11/05/2017

For further information:

For further information, please contact:

Investors
Helen Kelly
Director, Investor Relations
403-767-6206
Email contact: https://go.marketwire.com/Public/InformationRequestForm.aspx?id%3dU0C8MGoBqaY9CSDj9RjFSQ%3d%3d%26contact%3diirdhatrU2Jkl9oiMHmgfyWf7KrBs34UDUabFckO%2bFA%3d

Media
Davis Sheremata
Senior Advisor, External Communications
587-233-8311
Email contact: https://go.marketwire.com/Public/InformationRequestForm.aspx?id%3dU0C8MGoBqaY9CSDj9RjFSQ%3d%3d%26contact%3dtFZ6Jczy7o88ofLNMudY6MGRR5Jbbgx0ECsmY8VByF0%3d

COMPANY:
FOR: MEG ENERGY CORP.
TSX Symbol: MEG

INDUSTRY: Energy and Utilities – Oil and Gas
RELEASE ID: 20170511CC027

Press Release from Marketwired 1-866-736-3779

All press releases are written by the client and have NO affiliation with the news copy written by The Canadian Press. Any questions that arise due to the content or information provided in the press release should be directed to the company/organization
issuing the release, not to The Canadian Press.

GET ENERGYNOW’S DAILY EMAIL FOR FREE


NuVista Energy Ltd.: Report on Voting from the 2017 Shareholders Meeting

FOR: NUVISTA ENERGY LTD.TSX SYMBOL: NVADate issue: May 11, 2017Time in: 12:20 AM eAttention:
CALGARY, ALBERTA–(Marketwired – May 11, 2017) – NuVista Energy Ltd. (TSX:NVA)
(“NuVista”) announces that the following matters were approved at the annual
an…

GET ENERGYNOW’S DAILY EMAIL FOR FREE


Saskatchewan premier says B.C. election result ‘concerning’ for pipeline project

REGINA — Saskatchewan Premier Brad Wall says the result of the British Columbia election is concerning if the province ends up being led by an NDP-led coalition.

Wall says that’s because the B.C. New Democrats have been clear that they will do whatever they can to kill Kinder Morgan’s Trans Mountain pipeline expansion project to the west coast.

Premier Christy Clark’s Liberal party, which supports the pipeline, won 43 seats — one short of a majority — in Tuesday’s general election.

The NDP won 41 seats and the Greens hold the balance of power with three seats — both parties ran on platforms that included opposition to the pipeline.

Wall says Evraz, a steel-making factory in Regina, has been selected to build the pipe for Trans Mountain.

He says the pipeline would help increase the value Saskatchewan received for its oil because it would get it to the coast where it would gain access to world markets and better prices.

“The bottom line is that I do have to be concerned for jobs at Evraz in Regina,” Wall said Wednesday at the Saskatchewan legislature.

“That’s a big part of my job. I should be concerned about the health of our energy sector in the province, and that’s linked in many ways to pipelines that get oil to port.

“So if there is a party that gets elected in some other province that has a potentially negative effect on that — I don’t care what the party is — then it’s incumbent on us to point out what our interests might be.”

Walls said it would also be bad for B.C. if a government were to say no to major projects such as the pipeline.

“B.C. is a port province. Its economy, certainly the ports, depend on exports from other provinces.”

Desjardins Capital Markets analysts said that a minority government in B.C. could present significant challenges for the Canadian energy sector.

They said Trans Mountain would be the most immediate casualty, with an effect on heavy oil producers. Oil and gas producers in the Montney Formation, which straddles B.C. and Alberta, could also face greater uncertainty, they added.

The Canadian Press

GET ENERGYNOW’S DAILY EMAIL FOR FREE


B.C. election brings unwelcome uncertainty for business as Greens hold balance

CALGARY — British Columbia’s election has brought unwelcome doubt for the business sector, given the prospect of an ascendant Green party influencing policy on pipelines, natural gas exports, hydroelectricity and other resource projects.

Christy Clark’s Liberal party took 43 seats, two ahead of the NDP, but just shy of the 44 seats needed to take a majority. Recounts and absentee ballots could still sway the final tally, such as with the Courtenay-Comox riding swinging to the NDP by a mere nine votes.

As it stands, the anti-pipeline, anti-fracking, anti-liquefied natural gas Greens hold the balance of power with their three seats, though party leader Andrew Weaver has said he is open to compromise and his top priority is to remove big money from politics.

The results only create more unpredictability for the Trans Mountain pipeline expansion, shale gas development and the Site C hydro dam that is already under construction, said Martin Pelletier, managing director at TriVest Wealth Council.

“The bottom line is, yesterday to today, there’s a lot more uncertainty around resource development and infrastructure build-out,” said Pelletier.

Throughout the campaign, the Liberals were regarded in some circles as the more investment-friendly party compared to their NDP rivals, whose leader cast doubt on the future of Site C and promised to use “every tool in the toolbox” to stop the Trans Mountain expansion.

While the political picture was muddied, the reaction from politicians and businesses with arguably the most at stake was clear: cautious.

Alberta NDP Premier Rachel Notley and Ian Anderson, president of Kinder Morgan Canada, issued brief statements congratulating all three parties, taking care not to make mention of a specific winner.

Notley supports the Kinder Morgan-led Trans Mountain development, a project that has faced blowback in some parts of B.C. Construction of the pipeline expansion is expected to begin in September.

In Edmonton, Alberta Energy Minister Marg McCuaig-Boyd said she doesn’t believe the Trans Mountain expansion is in jeopardy.

“We worked really hard to get to ‘Yes’ on those (pipeline) approvals and we’re still going to use our climate leadership plan as the guide to getting those pipelines,” said McCuaig-Boyd.

Desjardins Capital Markets analysts said in a note that a minority government in B.C. could present significant challenges for the Canadian energy sector. They said Trans Mountain would be the most immediate casualty, with a knock-on effect on heavy oil producers. Oil and gas producers in the Montney Formation, which straddles both B.C. and Alberta, could also face greater uncertainty, they added. 

“We view a minority government outcome as one of the most challenging potential outcomes for the Canadian energy sector,” they wrote.

RBC Capital Markets analyst Walter Spracklin said in a note that the results were negative for Westshore Terminals Investment Corp. (TSX:WTE), since Clark has proposed a levy on U.S. coal shipments through its Vancouver port in response to the softwood lumber dispute. Its stock closed down 3.6 per cent at $21.14 on the S&P/TSX composite index.

— With files from Dean Bennett in Edmonton.

Ian Bickis, The Canadian Press

GET ENERGYNOW’S DAILY EMAIL FOR FREE


NEB proposes to review upstream, downstream emissions from Energy East

CALGARY — Canada’s national energy regulator has proposed that the new review of the Energy East Pipeline consider upstream and downstream emissions from the project.

The National Energy Board is seeking public input until the end of the month on the topics that should be considered during hearings into Energy East, with an update to that expected by the summer.

The NEB says the hearing panel has specifically asked for feedback on the issue of greenhouse gas emissions during production and consumption of the oil that would be shipped along the 4,500-kilometre pipeline.

The original Energy East review was derailed last September after members of the regulatory panel overseeing the hearings resigned amid questions about a potential conflict of interest.

In January, the NEB invalidated nearly two years of decisions made by the previous panel, a setback for TransCanada’s $15.7-billion development, and a new panel was appointed.

The review panel will examine a proposed pipeline that would carry 1.1 million barrels of crude per day from Alberta and Saskatchewan to refineries in Eastern Canada and a marine terminal in New Brunswick.

The review also covers TransCanada’s 279-kilometre Eastern Mainline natural gas pipeline application, which was submitted along with Energy East because some existing gas pipeline would be converted to oil under the Energy East plan.

The Canadian Press

GET ENERGYNOW’S DAILY EMAIL FOR FREE


Gov’t to begin seismic surveys in Atlantic in drilling push

WASHINGTON — The Trump administration said Wednesday it is moving forward on seismic surveys in the Atlantic Ocean, the first step toward offshore drilling in a region where it has been blocked for decades.

The Interior Department said it is reviewing six applications by energy companies that were rejected by the Obama administration.

Environmental groups and many East Coast lawmakers oppose the surveys, saying loud sounds from seismic air guns could hurt marine life.

The oil and gas industry has pushed for the surveys, which map potential drilling sites for oil and natural gas. No surveys have been conducted in the mid- and south-Atlantic regions for at least 30 years.

The regions, as defined by the Interior Department, stretch from northern Florida to Delaware. Any new drilling activity is expected to be limited to the coasts of Virginia, North and South Carolina and Georgia.

President Donald Trump signed an executive order last month aimed at expanding drilling in the Arctic and Atlantic oceans, part of his promise to unleash the nation’s energy reserves in an effort to reduce imports of foreign oil.

Trump’s order reversed an action by former President Barack Obama and faces fierce opposition from environmental activists and many Democrats, who say offshore drilling harms whales, walruses and other wildlife and exacerbates global warming.

The Interior Department said in a statement that the surveys are needed to update information about the Outer Continental Shelf that was gathered more than 30 years ago, “when technology was not as advanced as today.”

In addition to providing data on potential sites for offshore oil and natural gas production, seismic surveys are also used to locate sites for offshore wind structures, pinpoint potential seafloor hazards and locate sand and gravel resources for beach restoration, the department said.

Data from seismic surveys also assists officials in determining fair market value of offshore resources.

The surveys help “a variety of federal and state partners better understand our nation’s offshore areas … and evaluate resources that belong to the American people,” said Interior Secretary Ryan Zinke.

Last year, Obama designated the bulk of U.S.-owned waters in the Arctic Ocean and certain areas in the Atlantic as indefinitely off limits to oil and gas leasing. The December designation was in addition to a five-year drilling plan announced in November that also blocked Atlantic drilling.

Environmental groups hope the indefinite ban, which relies on an arcane provision in a 1953 law, will be difficult for Trump or other presidents to reverse. The Obama administration said at the time it was confident the president’s order would withstand legal challenge. The 1953 law provides no authority for subsequent presidents to undo so-called permanent withdrawals of oil and gas leases from the Outer Continental Shelf.

Obama’s order placed off limits 31 ocean canyons stretching from New England to Virginia.

Matthew Daly, The Associated Press

GET ENERGYNOW’S DAILY EMAIL FOR FREE


Alberta confident Trans Mountain line will be built despite B.C. election result

EDMONTON — Alberta Energy Minister Marg McCuaig-Boyd says she doesn’t believe the outcome of the B.C. election puts the Trans Mountain pipeline expansion in jeopardy.

McCuaig-Boyd notes that the Kinder Morgan line taking Alberta crude to ports in British Columbia has already been approved by the federal government.

And she says her government will continue to work to get the pipeline to completion.

The future of the expansion was put in question after Tuesday’s general election in B.C.

Premier Christy Clark’s Liberal party, which supports the pipeline, won 43 seats, one short of a majority.

The NDP won 41 seats and the Greens hold the balance of power with three seats — both parties ran on platforms that included opposition to the pipeline.

McCuaig-Boyd says she is not worried.

“I don’t know that (opponents) have the (legal) tools to stop it,” she said Wednesday.

“We’ve taken out intervener status to defend Alberta. This is not just about Alberta. This is about Canada. This is a good project.”

In an updated prospectus filed Wednesday, Kinder Morgan Canada said it is looking to sell shares at between $19 and $22 to help fund the $7.4-billion Trans Mountain expansion project rather than using a joint venture to fund it.

The Canadian Press

GET ENERGYNOW’S DAILY EMAIL FOR FREE


Environmentalists triumph as Senate upholds drilling rule

WASHINGTON — Environmentalists notched a rare win in the Republican-led Senate on Wednesday as a GOP effort to reverse an Obama-era rule restricting harmful methane emissions unexpectedly failed.

The 51-49 vote against the repeal measure was a blow to the fossil-fuel industry and groups linked to the conservative Koch Brothers, which had waged a public campaign to overturn the Interior Department rule.

The rule, finalized in November, would force energy companies to capture methane that’s burned off or “flared” at drilling sites because it earns less money than oil. An estimated $330 million a year in methane — the component of natural gas — is wasted through leaks or intentional releases, enough to power about 5 million homes a year.

The Interior Department said in a statement Wednesday that the rule imposes significant burdens on energy production and they would review it.

The vote marked the first time that the Republican-led Congress has rejected a bid to overturn a rule imposed by President Barack Obama using the previously obscure Congressional Review Act.

For months, Republicans have rammed through a host of reversals of Obama-era rules on gun rights, coal production, hunting and money for family planning clinics, among other issues. The review act requires just a simple majority in both chambers to overturn rules recently imposed by the executive branch.

The latest target was the Interior Department rule on methane.

Republicans and industry groups complained that the federal rule duplicates state regulations in place throughout the West and would decrease energy production on federal lands, raise energy costs and eliminate jobs.

Democrats and environmental groups countered that the rule protects the public health and generates tens of millions of dollars in revenue for state, local and tribal governments.

Fred Krupp, president of the Environmental Defence Fund, called the Senate vote “a signal victory” since President Donald Trump took office and said it shows there is “a lot of support for sensible environmental regulations going forward.”

Three Republican senators — Maine’s Susan Collins, Lindsey Graham of South Carolina and John McCain of Arizona — joined forces with Democrats to block the efforts to overturn the rule.

Graham and Collins had publicly opposed the repeal effort, but McCain’s vote surprised many on both sides of the debate.

McCain said in a statement he is concerned that the Bureau of Land Management rule may be “onerous,” but said undoing the rule through the Congressional Review Act would have prevented the government from issuing a similar rule in the future.

“I believe that the public interest is best served if the Interior Department issues a new rule to revise and improve the BLM methane rule,” McCain said.

Sen. John Hoeven, R-N.D., said Republican senators were caught off-guard by the final vote.

“We really thought we were there,” he told reporters. “We’ll keep on working on it.”

Gleeful Democrats hailed the vote as a breakthrough in the GOP-controlled Congress.

“Today’s vote is a win for American taxpayers, a win for public health and a win for our climate,” said Sen. Ed Markey, D-Mass.

“Special interests in Washington, D.C., tried to override this common-sense rule, and today we stopped them in their tracks,” added Sen. Maria Cantwell, D-Wash.

The American Petroleum Institute, the oil and gas industry’s top lobbying group, called the Senate vote disappointing, but said in a statement it looks forward to working with the Trump administration on policies to boost energy production.

Sen. Ron Wyden, D-Ore., said the vote reflected growing questions by lawmakers about the wisdom of rushing though disapproval measures under the Congressional Review Act. “More members are getting concerned about the implications,” Wyden said.

Jamie Williams, president of the Wilderness Society, an environmental group that had pushed to defend the Obama rule, said the Senate vote was the result of grassroots efforts by voters across the country.

“In recent months, thousands of Americans asked the Senate to stand up for clean air and against the oil lobby, and their efforts were successful today,” Williams said.

Sen. Tom Udall, D-N.M., said New Mexico and other Western states where drilling is common will be able to prevent the waste of taxpayer-owned natural gas and shrink a huge methane plume that hangs over the Four Corners region of Arizona, New Mexico, Utah and Colorado.

Both sides of the debate targeted Sen. Cory Gardner, a first-term senator who heads the Republican Senate campaign committee. The federal rule is based on a Colorado regulation widely popular in the state. Gardner voted to reverse the rule.

___

Associated Press writers Richard Lardner and Kevin Freking contributed to this story.

Follow Matthew Daly: https://twitter.com/MatthewDalyWDC

Matthew Daly, The Associated Press

GET ENERGYNOW’S DAILY EMAIL FOR FREE


Company in settlement talks over money for 13-year oil leak

BATON ROUGE, La. — A company that has failed to stop an oil leak that began nearly 13 years ago in the Gulf of Mexico is negotiating a possible court settlement that could allow it to recover millions of dollars it set aside for work to end the leak.

A federal judge agreed Wednesday to give Taylor Energy Co. more time for settlement talks with Justice Department attorneys.

Taylor Energy sued the federal government in January 2016, accusing regulators of violating a 2008 agreement requiring the company to deposit approximately $666 million in a trust to pay for leak response work. The New Orleans-based company argued the government must return the remaining $432 million.

The leak began off Louisiana’s coast after a Taylor Energy-owned oil platform toppled during Hurricane Ivan in 2004. Waves whipped up by Ivan triggered an underwater mudslide that buried a cluster of oil wells under treacherous mounds of sediment, preventing the company from using conventional techniques to plug its wells.

Taylor Energy has claimed nothing can be done to completely eliminate chronic sheens at the site. Regulators have warned that the leak could last a century or more if left unchecked.

Taylor Energy has lobbied for years to recover at least a portion of the money remaining in the trust. But federal authorities rebuffed the company’s settlement overtures in 2015 and ordered it to perform more work at the site.

Taylor Energy said in its lawsuit that it had spent more than $480 million on its efforts to stop the leak, with $234 million of that money coming from the trust.

A court filing Monday says attorneys for the company and federal government met April 19 to discuss a “settlement framework” to resolve the suit that Taylor Energy filed in the U.S. Court of Federal Claims.

“This framework contemplated certain actions to take place over the next few months that should be concluded by late summer,” the lawyers wrote in a joint request for the case to be “stayed,” or suspended, until Oct. 30.

The attorneys didn’t specify what those “actions” could be, but said the stay will allow them to “focus their full attention on achieving an amicable resolution undistracted by deadlines in this litigation.”

A 2015 investigation by The Associated Press revealed evidence that the leak is worse than the company, or government, have publicly reported during their secretive response. Presented with AP’s findings that year, the Coast Guard provided a new leak estimate that was about 20 times larger than one cited by the company in a 2014 court filing.

Using satellite images and Coast Guard pollution reports, West Virginia-based watchdog group SkyTruth estimated in 2015 that between 300,000 gallons (1.1 million litres) and 1.4 million gallons (5.3 million litres) of oil had spilled from the site since 2004. The group is still monitoring Taylor’s leak: On its website, SkyTruth posted an April 27 satellite image of a slick that it said contained at least 12,000 gallons (4.5 million litres) of oil.

SkyTruth president John Amos said he hasn’t seen any signs that the leak rate is subsiding.

“If anything, we may actually be concerned it’s slowly increasing,” he added Wednesday.

Ian MacDonald, a Florida State University oceanography professor who was an expert witness for environmental groups that sued Taylor Energy, has flown over the leak site roughly 20 times in the past five years. MacDonald maintains Taylor Energy and the Coast Guard are trying to minimize the problem by using the term “sheen” to describe the oil visible on the water’s surface.

“These are oil slicks,” MacDonald said. “On a calm day, it’s mousse. It produces genuinely thick oil that nobody would mistake for sheen.”

Michael Kunzelman, The Associated Press

GET ENERGYNOW’S DAILY EMAIL FOR FREE


Virginia-based energy giant changes name to Dominion Energy

RICHMOND, Va. — Richmond, Virginia-based energy giant Dominion Resources Inc. has changed its name to Dominion Energy Inc.

The company said in a news release that shareholders voted Wednesday to approve the new name.

The proposed change was announced in February. Chairman, president and CEO Thomas Farrell II said at the time that it would unify the company’s brands throughout the 18 states where it does business.

Dominion Energy’s electric and natural gas utilities and other businesses will change their names to conform in the coming days. Changes to company bills, employee uniforms and other identifying marks will occur in the coming months.

The company will also get a new logo.

Dominion operates one of the nation’s largest natural gas storage systems and serves more than 6 million utility and retail energy customers.

The Associated Press

GET ENERGYNOW’S DAILY EMAIL FOR FREE


Freehold Royalties Ltd. Shareholders Approve Resolutions at Annual Meeting

FOR: FREEHOLD ROYALTIES LTD.TSX SYMBOL: FRUDate issue: May 10, 2017Time in: 8:01 PM eAttention:
CALGARY, ALBERTA–(Marketwired – May 10, 2017) – Freehold Royalties Ltd.
(Freehold) (TSX:FRU) announced today that all nominees listed in its notice of
mee…

GET ENERGYNOW’S DAILY EMAIL FOR FREE


Corridor Announces First Quarter Results

FOR: CORRIDOR RESOURCES INC.
TSX SYMBOL: CDH

Date issue: May 10, 2017
Time in: 8:00 PM e

Attention:

HALIFAX, NOVA SCOTIA–(Marketwired – May 10, 2017) – Corridor Resources Inc.
(“Corridor”) (TSX:CDH) announced today its first quarter financial results.

The following table provides a summary of Corridor’s financial and operating
results for the three months ended March 31, 2017, with comparisons to the
three months ended March 31, 2016. Corridor’s unaudited financial statements
and management’s discussion and analysis for the first quarter have been filed
on SEDAR at www.sedar.com and are available on Corridor’s website at
www.corridor.ca.

All amounts referred to in this press release are in Canadian dollars unless
otherwise stated.

Selected Financial Information

/T/

—————————————————————————-

Three months ended March 31
thousands of dollars except per share
amounts 2017 2016
—————————————————————————-
Sales $ 4,467 $ 6,495
Net income $ 1,825 $ 1,283
Net income per share – basic and diluted $ 0.021 $ 0.014
Cash flow from operations (1) $ 3,683 $ 3,353
Working capital $ 33,226 $ 29,636
Total assets $ 105,316 $ 134,424
—————————————————————————-
—————————————————————————-

/T/

Q1 2017 Netback Analysis

/T/

—————————————————————————-

Three months ended March 31
thousands of dollars except $/boe (2) 2017 2016
—————————————————————————-
Natural gas sales $ 4,166 $ 6,314
Realized financial derivatives gain 1,094 –
Other revenues 301 181
Royalties (92) (137)
Transportation expense (428) (1,355)
Production expense (789) (717)
—————————————————————————-
Field operating netback $ 4,252 $ 4,286
—————————————————————————-

Natural gas production per day (mmscfpd) 7.2 8.1
Barrels of oil equivalent per day (boepd) 1,196 1,354
Average natural gas price ($/mscf) $ 6.45 $ 8.54

Natural gas revenues ($/boe) $ 38.69 $ 51.25
Realized financial derivatives gain ($/boe) 10.16 –
Other revenues ($/boe) 2.80 1.47
Royalties ($/boe) (0.86) (1.11)
Transportation expense ($/boe) (3.97) (11.00)
Production expense ($/boe) (7.33) (5.82)
—————————————————————————-
Field operating netback ($/boe) $ 39.49 $ 34.79
General and administrative expenses ($/boe) (6.05) (5.85)
Interest, foreign exchange gains and other
($/boe) 0.76 (1.73)
—————————————————————————-
Cash flow from operations ($/boe) (1) $ 34.20 $ 27.21
—————————————————————————-
—————————————————————————-

1. Cash flow from operations is a non-IFRS measure. Cash flow from

operations represents net earnings adjusted for non-cash items including
depletion, depreciation and amortization, deferred income taxes, share-
based compensation and other non-cash expenses. See “Non-IFRS Financial
Measures” in Corridor’s MD&A for the three months ended March 31, 2017.
2. For the purpose of calculating unit revenues and costs, natural gas has
been converted to barrels of oil equivalent (“boe”) on the basis of six
thousand cubic feet (“mscf”) of natural gas being equal to one barrel of
oil. Boe may be misleading, particularly if used in isolation. A boe
conversion ratio of six mscf to one barrel is based on an energy
equivalency conversion method primarily applicable at the burner tip and
does not represent a value equivalency at the wellhead.

/T/

2017 First Quarter Highlights

/T/

— Achieved a cash flow from operations of $34.20/BOE, a 26% increase over

Q1 2016.

— Increased Corridor’s cash flow from operations to $3,683 thousand in Q1

2017 from $3,353 thousand in Q1 2016, despite 24% lower average natural
gas prices and 12% lower production rates in Q1 2017 versus Q1 2016.
Corridor achieved this result through a combination of: 1) successful
financial hedges in place during Q1 2017, which resulted in a realized
gain of $1,094 thousand; 2) a reduction in transportation expenses from
$1,355 thousand in Q1 2016 to $428 thousand in Q1 2017, due primarily to
the Company’s forward sale agreement in effect from December 1, 2016 to
March 31, 2017 for the sale of 4,755 mmbtupd of natural gas production
to the local Maritimes market as opposed to the New England market; and
3) higher foreign exchange gains in Q1 2017.

— At March 31, 2017, Corridor had cash and cash equivalents of $30,669

thousand, working capital of $33,226 thousand and no outstanding debt.

— Subsequent to quarter end, on April 11, 2017, Corridor entered into a

financial hedge for the period from December 1, 2017 to March 31, 2018
for 2,500 mmbtu per day of natural gas production (approximately 2.3
mmscf per day) at a fixed price of $US7.40/mmbtu.

/T/

Outlook

The following table provides a comparison of Corridor’s results for the period
from April 1, 2016 to March 31, 2017 as compared to the guidance disclosed in
Corridor’s management’s discussion and analysis for the year ended December 31,
2016 dated March 30, 2017.

/T/

—————————————————————————-

March 30, 2017
Actual results guidance
—————————————————————————-
AGT average natural gas price $ US 3.40/mmbtu $ US 3.40/mmbtu
USD/CAD average exchange rate $ 1.31 USD/CAD $ 1.31 USD/CAD
Average natural gas price realized $ 5.70/mscf $ 5.70/mscf
Average daily natural gas production 5.5 mmscfpd 5.5 mmscfpd
Field operating netback $ 7.2 million $ 7.2 million
Cash flow from operations(1) $ 4.6 million $ 4.4 million
Field operating netback per mscf $ 3.58/mscf $ 3.55/mscf
Field operating netback per boe $ 21.48/boe $ 21.30/boe
Cash flow from operations(1) per mscf $ 2.28/mscf $ 2.20/mscf
Cash flow from operations(1) per boe $ 13.68/boe $ 13.20/boe
Working capital as at March 31, 2017 $ 33.2 million $ 33.2 million
—————————————————————————-
—————————————————————————-

1. “Cash flow from operations” is a non-IFRS financial measure; see “Non-

IFRS Financial Measures”.

/T/

Corridor’s cash flow from operations for the period from April 1, 2016 to March
31, 2017 increased to $4.6 million from $4.4 million due to the fluctuation in
the USD/CAD exchange rate during the quarter which resulted in higher than
expected foreign exchange gains in Q1 2017.

Operations Review

Anticosti Island

As reported on April 6, 2017, Corridor, together with other partners of
Anticosti Hydrocarbons L.P., has entered into negotiations with the Government
of Quebec with the goal of terminating the exploration joint venture project on
Anticosti Island. The Anticosti joint venture is a limited partnership formed
in 2014 between Corridor, Ressources Quebec Inc., a subsidiary of
Investissement Quebec (an affiliate of the Government of Quebec), Petrolia Inc.
and Saint-Aubin E&P Quebec Inc. No assurance can be given that the negotiations
will be successfully concluded. Corridor will only update the market further on
the matter if an agreement is reached or the negotiations end without agreement.

New Brunswick

Over the past two years, Corridor has employed a production optimization
strategy whereby it has restricted its production (to varying degrees) in the
McCully field in New Brunswick during the months from spring to fall. These
voluntary shut-ins allow the producing horizons in Corridor’s wells to build up
reservoir pressure, which in turn results in flush production once the wells
are placed back on unrestricted production. Corridor typically plans the
restarting of the McCully field production to coincide with the North American
heating season (generally considered to be November 1 to March 31) when natural
gas prices have historically traded at significant premiums at Algonquin
City-Gates (AGT), Corridor’s natural gas market. Corridor’s production
optimization objective is to achieve similar field operating netback when
compared to a continuous production model, while deferring production volumes
for the future and extending the McCully field reserve life. The 12% decrease
in Corridor’s average daily natural gas production in Q1 2017 compared to Q1
2016 is largely due to management’s decision to only partially restrict
production during the summer/fall of 2016 versus a much more extensive shut-in
in the summer/fall of 2015, the effect of which led to more flush production in
Q1 2016 versus Q1 2017. In keeping with its past practices, Corridor initiated
a shut-in of the vast majority of its production at McCully on April 1, 2017.

Future natural gas prices at AGT recently traded at an average of approximately
$3.30 USD/mmbtu from now until the beginning of the heating season, while the
2017/18 heating season prices recently traded at an average of approximately
$7.00USD/mmbtu, with prices approximating $9.00 USD/mmbtu in January and
February 2018. As a component of its production optimization strategy, Corridor
entered into a financial hedge for the period from December 1, 2017 to March
31, 2018 for 2,500 mmbtu per day of natural gas production (approximately 2.3
mmscf per day) at a fixed price of $US7.40/mmbtu.

Corridor has gained some key learnings from its production optimization
strategy over the past two years. For example, the flush production volumes
have generally lasted longer than originally expected. In addition, the
elevated production rates and flowing pressures following the shut-in periods
have helped reduce certain operating costs. Finally, the pressure build-up data
gathering has been instrumental in modeling flush production expectations for
economic analysis, as well as production uplift opportunities.

Old Harry

Corridor intends to purchase a user license for a controlled source
electro-magnetic (“CSEM”) data program to investigate the resistivity of
geological prospects over the Newfoundland and Labrador sector of the Old Harry
prospect, similar to resistivity logging in well bores of potential hydrocarbon
zones. Highly resistive layers in a geological structure measured with CSEM
technology could indicate hydrocarbon bearing reservoirs and, therefore, would
serve to reduce exploration risk and increase the likelihood of finding
commercial quantities of hydrocarbons. The undertaking of the CSEM program,
currently planned by an independent service provider for a seven to ten day
period in the fall of 2017, is subject to the receipt of the necessary
regulatory approvals and vessel availability.

Annual and Special Meeting

Corridor’s annual and special meeting of shareholders will be held at the
offices of Bennett Jones LLP, 4500 Bankers Hall East, 855 – 2nd Street S.W.,
Calgary Alberta on Thursday, May 11, 2017 at 3:00 p.m. (MDT). Steve Moran,
President and CEO, will make a presentation. A new management presentation will
be made available on Corridor’s website at www.corridor.ca on May 12, 2017.

President’s Message

“We are very pleased with our results from the first quarter of 2017” said
Steve Moran, President and CEO. “Despite lower natural gas prices and
production volumes in the first quarter of 2017, we generated a 26% increase in
our cash flow from operations over Q1 2016 to a top decile of $34.20 per boe.”
Management is finalizing its production optimization strategy for the period
from April 1, 2017 to March 31, 2018 and plans to provide capital, production
and revenue guidance for that period in due course. The Company is well
positioned with $33.2 million of working capital as at March 31, 2017.

Corridor is a Canadian junior resource company engaged in the exploration for
and development and production of petroleum and natural gas onshore in New
Brunswick and Quebec and offshore in the Gulf of St. Lawrence. Corridor
currently has natural gas production and reserves in the McCully Field near
Sussex, New Brunswick. In addition, Corridor has a shale gas prospect in New
Brunswick, an offshore conventional hydrocarbon prospect in the Gulf of St.
Lawrence and an unconventional hydrocarbon prospect through a 21.67% interest
in Anticosti Hydrocarbons L.P., a joint venture which has undiscovered
resources on Anticosti Island, Quebec.

Forward Looking Statements

This press release contains certain forward-looking statements and
forward-looking information (collectively referred to herein as
“forward-looking statements”) within the meaning of Canadian securities laws.
All statements other than statements of historical fact are forward-looking
statements. Forward-looking information typically contains statements with
words such as “anticipate”, “believe”, “plan”, “continuous”, “estimate”,
“expect”, “may”, “will”, “project”, “should”, or similar words suggesting
future outcomes. In particular, this press release contains forward-looking
statements pertaining to: business plans and strategies (including optimization
strategies to shut-in production in 2017), exploration and development plans
(including the acquisition of CSEM) and the timing and cost of such plans; the
benefits of CSEM data; negotiations with the Government of Quebec to terminate
the Anticosti joint venture; expectations of the natural gas prices and
premiums at AGT and plans to provide guidance for the period from April 1, 2017
to March 31, 2018.

Undue reliance should not be placed on forward-looking statements, which are
inherently uncertain, are based on estimates and assumptions, and are subject
to known and unknown risks and uncertainties (both general and specific) that
contribute to the possibility that the future events or circumstances
contemplated by the forward-looking statements will not occur. There can be no
assurance that the plans, intentions or expectations upon which forward-looking
statements are based will in fact be realized. Actual results will differ, and
the difference may be material and adverse to Corridor and its shareholders.

Forward-looking statements are based on Corridor’s current beliefs as well as
assumptions made by, and information currently available to, Corridor
concerning anticipated financial performance, business prospects, strategies,
regulatory developments, discussions to date with the Government of Quebec,
future natural gas commodity prices, future natural gas production levels, the
ability to obtain equipment in a timely manner to carry out development
activities, the ability to market natural gas successfully to current and new
customers, the impact of increasing competition, the ability to obtain
financing on acceptable terms, and the ability to add production and reserves
through development and exploration activities. Although management considers
these assumptions to be reasonable based on information currently available to
it, they may prove to be incorrect. By their very nature, forward-looking
statements involve inherent risks and uncertainties, both general and specific,
and risks that forward-looking statements will not be achieved. These factors
may be found under the heading “Risk Factors” in Corridor’s Annual Information
Form for the year ended December 31, 2016.

The forward-looking statements contained in this press release are made as of
the date hereof and Corridor does not undertake any obligation to update
publicly or to revise any of the included forward-looking statements, except as
required by applicable law. The forward-looking statements contained herein are
expressly qualified by this cautionary statement.

Oil and Gas Advisory

Boe Conversion

All calculations converting natural gas to crude oil equivalent have been made
using a ratio of six mscf of natural gas to one barrel of crude oil equivalent.
Boes may be misleading, particularly if used in isolation. A boe conversion
ratio of six mscf of natural gas to one barrel of crude oil equivalent is based
on an energy equivalency conversion method primarily applicable at the burner
tip and does not represent a value equivalency at the wellhead.

– END RELEASE – 10/05/2017

For further information:
Corridor Resources Inc.
Steve Moran
President and CEO
(902) 429-4511
(902) 429-0209 (FAX)
www.corridor.ca

COMPANY:
FOR: CORRIDOR RESOURCES INC.
TSX SYMBOL: CDH

INDUSTRY: Energy and Utilities – Oil and Gas
RELEASE ID: 20170510CC0135

Press Release from Marketwired 1-866-736-3779

All press releases are written by the client and have NO affiliation with the news copy written by The Canadian Press. Any questions that arise due to the content or information provided in the press release should be directed to the company/organization
issuing the release, not to The Canadian Press.

GET ENERGYNOW’S DAILY EMAIL FOR FREE


Prairie Provident Announces First Quarter 2017 Financial and Operating Results

FOR: PRAIRIE PROVIDENT RESOURCES INC.
TSX SYMBOL: PPR

Date issue: May 10, 2017
Time in: 7:47 PM e

Attention:

CALGARY, ALBERTA–(Marketwired – May 10, 2017) – Prairie Provident Resources
Inc. (“Prairie Provident”, “PPR” or the “Company”) (TSX:PPR) is pleased to
announce its operating and financial results for the three months ended March
31, 2017, and to provide an operational update. PPR’s consolidated financial
statements (“Financial Statements”) and related Management’s Discussion and
Analysis (“MD&A”) for the three months ended March 31, 2017 are available on
its website and filed on SEDAR.

Prairie Provident was formed through the business combination of Lone Pine
Resources Inc. and Lone Pine Resources Canada Ltd. (now Prairie Provident
Resources Canada Ltd.) (collectively, “Lone Pine”) and Arsenal Energy Inc.
(“Arsenal”) which was effected on September 12, 2016 (the “Arsenal
Acquisition”). Financial Statements referenced herein present the results for
the historical Lone Pine properties for the period up to September 12, 2016 and
for the combination of Lone Pine and Arsenal after September 12, 2016. This is
a significant factor in understanding the year-over-year and
quarter-over-quarter financial results of Prairie Provident. This news release
contains forward-looking information and statements and non-IFRS measures.
Readers are cautioned that the news release should be read in conjunction with
the Company’s disclosures under the headings “Forward-Looking Statements” and
“Non-IFRS Measures” included at the end of this news release.

FIRST QUARTER 2017 HIGHLIGHTS

/T/

— Achieved average first quarter 2017 production of 5,637 boe/d (55%

liquids), a 71% increase over the same period in 2016 due primarily to
approximately 1,500 boe/d of Wheatland production additions and
approximately 1,100 boe/d of production from Arsenal’s properties;
— Further contributing to the first quarter production increase was
approximately 125 boe/d of production averaged over the first quarter
related to the acquisition of approximately 1,100 boe/d of high quality
light oil assets in the Greater Red Earth area of Northern Alberta (“Red
Earth Acquisition”), which is included in PPR’s operating results after
the closing date of March 22, 2017;
— Generated first quarter adjusted funds from operations of $5.9 million
($0.06 per diluted share), up 444% from the same period in 2016 due to
increased production, higher average realized prices, and lower
operating expenses;
— Operating netbacks (after realized hedging gains) for the quarter were
$16.25/boe, 31% higher than the first quarter of 2016 due to a 57%
improvement in realized prices and a 21% reduction in per boe operating
costs;
— Capital expenditures in the quarter totaled $48.4 million, which
included $40.9 million for the Red Earth Acquisition, $5.9 million for
the ongoing drilling program at Wheatland and $0.9 million on the second
phase of the Evi waterflood project;
— Drilled four wells at Wheatland during the first quarter (100% success
rate) and brought two wells on stream that were drilled in Q4 2016;
— Issued 5,195,000 CEE flow-through shares at $0.77 per share and
5,971,000 subscription receipts at $0.67 per unit (each comprised of one
common share and one-half of one common share warrant) for total gross
proceeds of $8.0 million;
— Increased borrowing capacity on the Company’s credit facility to $65
million in conjunction with the Red Earth Acquisition; and
— Exited the first quarter with bank debt of $45.5 million or 70% drawn on
the Company’s $65 million credit facility (together with outstanding
letters of credit, $50.9 million or 78% of the credit facility was
utilized).

/T/

FINANCIAL AND OPERATING HIGHLIGHTS

/T/

Three Months Ended
March 31
—————————————————————————-
—————————————————————————-
($000s except per unit amounts) 2017 2016
—————————————————————————-
—————————————————————————-
Financial
Oil and natural gas revenue 19,208 7,203
Net earnings 7,262 3,197
Per share – basic & diluted(1) 0.07 0.03
Adjusted funds from operations(2) 5,934 1,090
Per share – basic & diluted(3) 0.06 0.01
Capital expenditures (net of proceeds from
dispositions) 48,386 10,732
—————————————————————————-
—————————————————————————-
Production Volumes
Crude oil (bbls/d) 2,832 1,884
Natural gas (Mcf/d) 15,073 7,698
Natural gas liquids (bbls/d) 293 124
—————————————————————————-
Total (boe/d) 5,637 3,291
—————————————————————————-
% Liquids 55% 61%
—————————————————————————-
—————————————————————————-
Average Realized Prices
Crude oil ($/bbl) 55.89 33.63
Natural gas ($/Mcf) 2.97 1.86
Natural gas liquids ($/bbl) 35.46 12.23
—————————————————————————-
Total ($/boe) 37.86 24.05
—————————————————————————-
—————————————————————————-
Operating Netback ($/boe)(4)
Realized price 37.86 24.05
Royalties (5.97) (2.17)
Operating costs (17.02) (21.47)
—————————————————————————-
Operating netback 14.87 0.41
Realized gains on derivative instruments 1.38 11.97
—————————————————————————-
Operating netback, after realized gains on
derivative instruments 16.25 12.38
—————————————————————————-
—————————————————————————-
Notes:
(1)(3) As the historical financial statements were prepared on a combined
and consolidated basis (see note 3(a) to the Annual Financial Statements
for the year ended December 31, 2016), it is not possible to measure per
share amounts until subsequent to the closing of the Arsenal Acquisition
on September 12, 2016 when Lone Pine and Arsenal were brought under a
common parent entity. The Company calculated per share information for the
current and historical periods by assuming that the common shares issued
upon the closing of the Arsenal Acquisition at September 12, 2016 were
outstanding since the beginning of the period.
(2)(4) Adjusted funds from operations and operating netback are non-IFRS
measures and are defined below under “Other Advisories”.

—————————————————————————-
—————————————————————————-

As at
Capital Structure As at December 31,
($000s) March 31, 2017 2016
—————————————————————————-
Working capital (deficit)(1) (13,126) (4,380)
Long-term debt (46,587) (15,047)
———————————
Total net debt(2) (59,713) (19,427)
Current debt capacity(3) 14,117 34,117
Common shares outstanding (in millions) 115.4 104.2
—————————————————————————-
—————————————————————————-
Notes:
(1) Working capital (deficit) is a non-IFRS measure calculated as current
assets less current liabilities excluding the current portion of
derivative instruments, the current portion of decommissioning liabilities
and flow-through share premium. See “Other Advisories” below.
(2) Net debt is a non-IFRS measure, calculated by adding working capital
(deficit) and long-term debt. See “Other Advisories” below.
(3) Current debt capacity reflects the credit facility of $65 million at
March 31, 2017 and $55 million at December 31, 2016.

—————————————————————————-

Three months ended
March 31
—————————————————————————-
2017 2016
—————————————————————————-
Drilling Activity
Gross wells 4 3
Working interest wells 3.95 2.9
Success rate, net wells (%) 100 100
—————————————————————————-
—————————————————————————-

/T/

OPERATIONS UPDATE

Wheatland, AB

Prairie Provident’s successful 2016 capital program at Wheatland included the
drilling of 14 wells and achieving organic production additions of
approximately 1,650 boe/d, which brought total production in the region to
approximately 2,500 boe/d at year-end. During the first quarter of 2017, a
total of $3.9 million was invested to drill and case four Ellerslie wells (100%
success rate), while two wells completed in the fourth quarter of 2016 were
brought on-stream in February 2017. Average sales volumes in the Wheatland area
were approximately 2,500 boe/d (30% light/medium oil) in the first quarter and
production is expected to increase in the second quarter of 2017 as volumes
from the four wells that were drilled in the first quarter come on-stream.

Our 2017 capital budget continues to include the planned drilling of up to 14
wells at Wheatland, with four drilled to date. Prairie Provident anticipates
following up on recent well results during the second quarter and resuming its
Wheatland drilling program in the third and fourth quarters of 2017, the extent
of which will be subject to commodity prices. The total number of wells in the
area has now reached 22, of which 18 are on production.

Drilling to date in the northern and central region of the play has yielded
three significant discoveries and three development wells were drilled on these
projects in the first quarter of 2017. Also in the first quarter of 2017, an
exploratory well was drilled in the far western block on a large mapped
Ellerslie feature over 12 sections of PPR lands. This exploration well is
currently being tied in and future development plans will depend in part on the
longer-term production rates from this well. Our focus for 2017 will be on
follow-up locations across the fairway, while future exploration in the
southern sections is expected to be tested over the next two years.

Prairie Provident has maintained its reduced drilling cycle times
(approximately 8.5 days) at Wheatland by pad drilling and utilizing a mono-bore
drilling design, which has significantly reduced surface costs, lowered the
environmental footprint and increased the anticipated return on capital. We
remain optimistic about maintaining these efficiencies despite the increased
competition for oilfield services and suppliers.

Princess, AB

For the first quarter of 2017, our Princess properties produced average sales
volumes of approximately 425 boe per day (85% medium oil). During the quarter,
PPR focused on identifying and selecting up to eight potential drilling
locations at Princess, conducting pre-drilling activities, and pursuing the
necessary approvals to drill four of the eight identified locations. A total of
15 additional locations have been identified in the Detrital and Glauconite
formations. In addition, PPR intends to tie-in two discovery wells in early Q3.
The Company continues to evaluate options to alleviate gas and water handling
bottlenecks, which are inherent in the area, to allow for expanded drilling.

Evi, AB

During the first quarter of 2017, capital expenditures at Evi totaled $0.9
million which included advancing the waterflood project through the conversion
of four wells to injection wells. The Company currently has 24 injection wells
(22 horizontals and 2 verticals) in operation and 8.25 of 37 sections in the
main Evi area are under waterflood.

The existing waterflooded patterns continue to show encouraging results with
flattened decline. The Red Earth Acquisition brought additional flood expansion
prospects and the Company is evaluating potential acceleration of the
waterflood project in the next budget cycle. Over the long-term, our full field
waterflood scenario contemplates converting an additional 20 producing wells to
injection wells for projected total future costs of approximately $20 million.

At Evi, average sales volumes for the quarter of approximately 1,625 boe per
day (98% light oil) included approximately 125 boe/d of production averaged
over the period related to the Red Earth Acquisition that closed on March 22,
2017. The Red Earth Acquisition, which added approximately 1,100 boe/d (98% oil
and liquids) of run-rate production, is complementary to existing Evi
operations and provides for synergistic opportunities to reduce estimated area
operating costs by $2 million per year (or $2.00/boe). The initial stages of
our integration on these new assets have gone smoothly.

The Evi properties provide the Company with a stable cash flow base that
complements its development programs, and lowers decline rates, while
generating economics (rates of return, payback and recycle ratio) that remain
robust, even at current strip pricing. PPR believes that the waterflood program
will continue to stabilize production from this play and enhance long-term
recoveries.

2017 OUTLOOK AND GUIDANCE

PPR’s capital allocation process considers numerous operational dynamics and
financial factors. We incorporate competitive elements into the process such
that projects with the highest rates of return are given top priority and
growth on a per share basis is a central tenet of the planning process. We
invested less than $10 million of our 2017 capital budget in the first quarter,
and yet are well positioned with current production volumes close to our
expected annual average. Through 2017, we will continue to focus on improving
corporate netbacks by targeting the production of higher value streams (oil /
condensate rich liquids) and enhancing our capital efficiencies through various
operational initiatives such as pad drilling and operating in areas with
underutilized infrastructure capacity.

Oil prices have remained volatile through the first quarter and into the second
quarter of 2017 given deteriorating confidence in OPEC’s compliance on
production cuts, while the Canadian energy sector continues to consider the
potential implementation of various trade tariff policies by the new
administration in the United States. We remain cautiously optimistic on a
tightening supply / demand balance for energy commodities in the second half of
2017 and believe that our company remains uniquely positioned to navigate
through this challenging macro environment. We remain committed to pursue a
combination of per share and returns focused growth.

Our credit facility was increased to $65 million in conjunction with the March
2017 closing of the Red Earth Acquisition and we exited the first quarter
approximately 70% drawn on the facility. While our leverage level is well
supported by our reserves base and future cash flows, it is above the target
level that we are comfortable maintaining on a run-rate basis. Our second
quarter 2017 capital activity is expected to be slower due to spring break-up
and as we calibrate the direction of commodity prices. For the balance of 2017,
our capital budget contemplates up to an additional ten wells at Wheatland and
up to eight wells at Princess that are ready for development; however, we
remain focused on prudent capital management and will scale our 2017 budget
depending on commodity prices.

With a strong hedging program that has protected approximately 70% of our 2017
estimated base production volumes (net of royalties), and forecast 2017
adjusted funds from operations between $31 – $35 million, we anticipate that
PPR can fund our $25 – 35 million capital budget. We are committed to managing
our capital structure to enhance financial flexibility for funding PPR’s future
growth

PPR continues to expect significant 2017 production per share growth (target of
55%) and our inventory of conventional horizontal and vertical wells provides
the Company with over five years of drilling opportunities to underpin
long-term per share growth. As additional optionality, our waterflood
initiatives are expected to lower corporate decline rates and stabilize
production levels over the medium and longer term.

The 2017 program assumes price forecasts of USD$54.00/bbl WTI, CAD$2.75/GJ
AECO, and a Canadian/US dollar exchange rate of $0.76 and anticipates the
following:

/T/

Targets
Exit production (boe/d) 7,500 – 8,000
Annual production (boe/d) (1) 6,100 – 6,600
% of liquids 60% – 65%
Operating expenses ($/boe) 16.00 – 17.00
Operating netback ($/boe) (2) 16.00 – 17.00
Operating netback, after realized gains from derivative
instruments ($/boe) (2) 17.00 – 18.00
Royalties (%) 16%
G&A, excluding stock-based compensation and net of capitalized
G&A ($/boe) 3.00 – 4.00
Capital expenditures ($millions) 25 – 35
(1) Includes production from the Red Earth Acquisition since March 22, 2017,
the closing date of the transaction.
(2) Operating netback is a non-IFRS measure (see “Other Advisories” below).

/T/

ABOUT PRAIRIE PROVIDENT:

Prairie Provident is a Calgary-based company engaged in the exploration and
development of oil and natural gas properties in Alberta. The Company’s
strategy is to grow organically in combination with accretive acquisitions of
conventional oil prospects, which can be efficiently developed. Prairie
Provident’s operations are primarily focused at Wheatland and Princess in
Southern Alberta targeting the Ellerslie and the Lithic Glauc formations, along
with an early stage waterflood project at Evi in the Peace River Arch. Prairie
Provident protects its balance sheet through an active hedging program and
manages risk by allocating capital to opportunities offering maximum
shareholder returns.

FORWARD-LOOKING STATEMENTS

This news release contains certain forward-looking information and statements
within the meaning of applicable Canadian securities laws. Statements involving
forward-looking information relate to future performance, events or
circumstances, and are based upon internal assumptions, plans, intentions,
expectations and beliefs. All statements other than statements of current or
historical fact constitute forward-looking information. Forward-looking
information is typically, but not always, identified by words such as
“anticipate”, “believe”, “expect”, “intend”, “plan”, “budget”, “forecast”,
“target”, “estimate”, “propose”, “potential”, “project”, “continue”, “may”,
“will”, “should” or similar words suggesting future outcomes or events or
statements regarding an outlook. In particular, but without limiting the
foregoing, this news release contains forward-looking information and
statements pertaining to the following: projected capital expenditure plans,
production and product mix; production growth expectations; development and
exploration plans at Wheatland, Princess and Evi (including with respect to
numbers of wells and drilling locations at Wheatland and Princess and Evi
waterflood activities and expectations); opportunities for operating cost
reductions in the Greater Red Earth area; continued focus on corporate netbacks
and capital efficiency and anticipated activities in furtherance thereof;
future hedging arrangements; projected annual and exit production, operating
costs, operating netback, royalties, G&A expenses, capital expenditures and
adjusted funds from operations of Prairie Provident for 2017 and beyond;
assumptions as to future commodity prices; risk management plans for 2017 and
beyond; use of excess funds from operations for debt repayment; per share
production growth; drilling inventory numbers; the potential conversion of
additional injection wells at Evi and projected costs thereof; expected
benefits of Evi waterflood initiatives; and future merger and acquisition
activities.

The forward-looking information and statements contained in this news release
reflect material factors and expectations and assumptions of Prairie Provident
including, without limitation: commodity prices and foreign exchange rates for
2017 and beyond; the timing and success of future drilling, development and
completion activities (and the extent to which the results thereof meet
Management’s expectations); the continued availability of financing (including
borrowings under the Company’s credit facility) and cash flow to fund current
and future expenditures, with external financing on acceptable terms; future
capital expenditure requirements and the sufficiency thereof to achieve the
Company’s objectives; the performance of both new and existing wells;
production from the Red Earth Acquisition and capital and operating costs in
respect thereof; the timely availability and performance of facilities,
pipelines and other infrastructure in areas of operation; the geological
characteristics and quality of Prairie Provident’s properties and the
reservoirs in which the Company conducts oil and gas activities (including
field production and decline rates); successful integration of the Red Earth
Acquisition assets into the Company’s operations; the successful application of
drilling, completion and seismic technology; future exploration, development,
operating, transportation, royalties and other costs; the Company’s ability to
economically produce oil and gas from its properties and the timing and cost to
do so; the predictability of future results based on past and current
experience; prevailing weather conditions; prevailing legislation and
regulatory requirements affecting the oil and gas industry (including royalty
regimes); the timely receipt of required regulatory approvals; the availability
of capital, labour and services on timely and cost-effective basis; the
creditworthiness of industry partners and the ability to source and complete
acquisitions; and the general economic, regulatory and political environment in
which the Company operates. Prairie Provident believes the material factors,
expectations and assumptions reflected in the forward-looking information and
statements are reasonable but no assurance can be given that these factors,
expectations and assumptions will prove to be correct.

All information and statements that are in the nature of a financial outlook
are forward-looking statements as they relate to prospective financial
performance, financial position or cash flows based on assumptions about future
economic conditions and courses of action. Financial outlook information in
this news release includes statements regarding future funds flow from
operations and operating netback, which are subject to the assumptions, risk
factors, limitations and qualifications set forth above. All financial outlook
information is made as of the date of this news release and is provided for the
sole purpose of describing the Company’s internal expectations on cash flows
for 2017, and should not be used, and may be inappropriate for, any other
purpose.

Although Prairie Provident believes that the expectations and assumptions upon
which the forward-looking information in this news release is based are
reasonable based on currently available information, undue reliance should not
be placed on such information, which is inherently uncertain, relies on
assumptions and expectations, and is subject to known and unknown risks,
uncertainties and other factors, both general and specific, many of which are
beyond the Company’s control, that may cause actual results or events to differ
materially from those indicated or suggested in the forward-looking
information. Prairie Provident can give no assurance that the forward-looking
information contained herein will prove to be correct or that the expectations
and assumptions upon which they are based will occur or be realized. These
include, but are not limited to: risks inherent to oil and gas exploration,
development, exploitation and production operations and the oil and gas
industry in general, including geological, technical, engineering, drilling,
completion, processing and other operational problems and potential delays,
cost overruns, production or reserves loss or reduction in production, and
environmental, health and safety implications arising therefrom; uncertainties
associated with the estimation of reserves, production rates, product type and
costs; adverse changes in commodity prices, foreign exchange rates or interest
rates; the ability to access capital when required and on acceptable terms; the
ability to secure required services on a timely basis and on acceptable terms;
increases in operating costs; environmental risks; changes in laws and
governmental regulation (including with respect to royalties, taxes and
environmental matters); adverse weather or break-up conditions; competition for
labour, services, equipment and materials necessary to further the Company’s
oil and gas activities; and changes in plans with respect to exploration or
development projects or capital expenditures in respect thereof. These and
other risks are discussed in more detail in the Company’s current annual
information form and other documents filed by it from time to time with
securities regulatory authorities in Canada, copies of which are available
electronically under Prairie Provident’s issuer profile on the SEDAR website at
www.sedar.com and on the Company’s website at www.ppr.ca. This list is not
exhaustive.

The forward-looking information and statements contained in this news release
speak only as of the date of this news release, and Prairie Provident assumes
no obligation to publicly update or revise them to reflect new events or
circumstances, or otherwise, except as may be required pursuant to applicable
laws. All forward-looking information and statements contained in this news
release are expressly qualified by this cautionary statement.

OTHER ADVISORIES

The oil and gas industry commonly expresses production volumes and reserves on
a “barrel of oil equivalent” basis (“boe”) whereby natural gas volumes are
converted at the ratio of six thousand cubic feet to one barrel of oil. The
intention is to sum oil and natural gas measurement units into one basis for
improved analysis of results and comparisons with other industry participants.
A boe conversion ratio of six thousand cubic feet to one barrel of oil is based
on an energy equivalency conversion method primarily applicable at the burner
tip. It does not represent a value equivalency at the wellhead nor at the plant
gate, which is where Prairie Provident sells its production volumes. Boes may
therefore be a misleading measure, particularly if used in isolation. Given
that the value ratio based on the current price of crude oil as compared to
natural gas is significantly different from the energy equivalency ratio of
6:1, utilizing a 6:1 conversion ratio may be misleading as an indication of
value.

Non-IFRS Measures

The Company uses certain terms in this news release and within the MD&A that do
not have a standardized or prescribed meaning under International Financial
Reporting Standards (IFRS), and, accordingly these measures may not be
comparable with the calculation of similar measures used by other companies.
For a reconciliation of each non-IFRS measure to its nearest IFRS measure,
please refer to the “Non-IFRS Measures” section in the MD&A. Non-IFRS measures
are provided as supplementary information by which readers may wish to consider
the Company’s performance, but should not be relied upon for comparative or
investment purposes. The non-IFRS measures used in this news release are
summarized as follows:

Working Capital – Working capital (deficit) is calculated as current assets
less current liabilities excluding the current portion of derivative
instruments, the current portion of decommissioning liabilities and
flow-through share premium. This measure is used to assist management and
investors in understanding liquidity at a specific point in time. The current
portion of derivatives instruments is excluded as management intends to hold
derivative contracts through to maturity rather than realizing the value at a
point in time through liquidation; the current portion of decommissioning
expenditures is excluded as these costs are discretionary; and the current
portion of flow-through share premium liabilities are excluded as it is a
non-monetary liability.

Net Debt – Net debt is defined as long-term debt plus working capital surplus
or deficit. Net debt is commonly used in the oil and gas industry for assessing
the liquidity of a company.

Operating Netback – Operating netback is a non-IFRS measure commonly used in
the oil and gas industry. This measure assists management and investors to
evaluate operating performance at the oil and gas lease level. Operating
netbacks included in this news release were determined by calculating oil and
gas revenues less royalties less operating costs, and dividing that number by
gross working interest production. Operating netback, including realized
commodity (loss) and gain, adjusts the operating netback for only realized
gains and losses on derivative instruments.

Adjusted Funds from Operations – Adjusted funds from operations is calculated
based on cash flow from operating activities before changes in non-cash working
capital, transaction costs, restructuring costs, decommissioning expenditures
and other non-recurring items. Management believes that such a measure provides
an insightful assessment of Prairie Provident’s operating performance on a
continuing basis by eliminating certain non-cash charges and charges that are
non-recurring and uses the measure to assess its ability to finance operating
activities, capital expenditures and debt repayment. Adjusted funds from
operations as presented is not intended to represent cash flow from operating
activities, net earnings or other measures of financial performance calculated
in accordance with IFRS.

– END RELEASE – 10/05/2017

For further information:
Prairie Provident Resources Inc.
Tim Granger
President and Chief Executive Officer
(403) 292-8110
[email protected]
www.ppr.ca

COMPANY:
FOR: PRAIRIE PROVIDENT RESOURCES INC.
TSX SYMBOL: PPR

INDUSTRY: Energy and Utilities – Oil and Gas
RELEASE ID: 20170510CC0134

Press Release from Marketwired 1-866-736-3779

All press releases are written by the client and have NO affiliation with the news copy written by The Canadian Press. Any questions that arise due to the content or information provided in the press release should be directed to the company/organization
issuing the release, not to The Canadian Press.

GET ENERGYNOW’S DAILY EMAIL FOR FREE


Pulse Seismic Inc. Announces Voting Results at Shareholders’ Annual Meeting

FOR: PULSE SEISMIC INC.TSX SYMBOL: PSDOTCQX SYMBOL: PLSDFDate issue: May 10, 2017Time in: 7:39 PM eAttention:
CALGARY, ALBERTA–(Marketwired – May 10, 2017) – Pulse Seismic Inc. (“Pulse” or
the “Company”) (TSX:PSD)(OTCQX:PLSDF) announced today the vot…

GET ENERGYNOW’S DAILY EMAIL FOR FREE


Dakota Access pipeline leaked 84 gallons of oil in April

BISMARCK, N.D. — The Dakota Access pipeline leaked 84 gallons of oil in South Dakota early last month, which an American Indian tribe says bolsters its argument that the pipeline jeopardizes its water supply and deserves further environmental review.

The April 4 spill was relatively small and was quickly cleaned up, and it didn’t threaten any waterways. The state’s Department of Environment and Natural Resources posted a report in its website’s searchable database, but it didn’t take any other steps to announce it to the public, despite an ongoing lawsuit by four Sioux tribes seeking to shut down the pipeline.

Brian Walsh, an environmental scientist with the agency, said Wednesday that the state doesn’t issue news releases on spills unless there is a threat to public health, a fishery or a drinking water system. He said there was no such threat with the Dakota Access leak, which happened nearly 100 miles east of the Missouri River’s Lake Oahe reservoir, which is the tribes’ water supply.

“We realize Dakota Access gets a lot of attention. We also try to treat all of our spills in a consistent manner,” Walsh said. “We treated this as we would treat any other 84-gallon oil spill.”

The leak occurred at a rural pump station in the northeast of the state as crews worked to get the four-state pipeline fully operational, Walsh said. The oil was contained on site by a plastic liner and containment walls and quickly cleaned up. Some oil-contaminated gravel will be disposed of at an area landfill, he said.

Such incidents have happened with other pipelines in South Dakota, and the Dakota Access leak didn’t come as a surprise, according to Walsh. The state is happy with the response of Texas-based pipeline developer Energy Transfer Partners and won’t issue a fine, he said.

“Size-wise, an 84-gallon release is pretty small relative to a lot of other things we work on,” Walsh said. “I would characterize it as a small operational spill that was cleaned up right away.”

The Standing Rock Sioux tribe, which was the initial plaintiff in the lawsuit, said the leak proves that the pipeline is a threat to its water and cultural sites.

“These spills are going to be nonstop,” tribal Chairman Dave Archambault said. “With 1,200 miles of pipeline, spills are going to happen. Nobody listened to us. Nobody wants to listen, because they’re driven by money and greed.”

Tribal attorney Jan Hasselman said the leak shows the need for more environmental study of the pipeline, which will move oil from North Dakota through South Dakota and Iowa to a distribution point in Illinois. The U.S. Army Corps of Engineers had planned additional study but scrapped the idea after President Donald Trump earlier this year pushed for completion of the pipeline that had been stalled by months of protests and lawsuits.

Energy Transfer Partners maintains that the pipeline is safe. Spokeswoman Vicki Granado issued a statement saying the spilled oil “stayed in the containment area as designed.”

No other spills have been reported along the pipeline in South Dakota, according to Walsh. A federal spill report database does not show any reports from Energy Transfer Partners or its subsidiary Dakota Access LLC in any of the other states through which the pipeline passes.

Granado didn’t comment on whether there have been any other problems as crews get the pipeline ready to be fully operational by June 1.

The Indigenous Environmental Network, which helped organize large-scale protests against the pipeline in North Dakota last year and earlier this year, issued a statement saying “the fact that this occurred before Dakota Access even becomes operational is all the more concerning.”

___

Follow Blake Nicholson on Twitter at https://twitter.com/NicholsonBlake

Blake Nicholson, The Associated Press

GET ENERGYNOW’S DAILY EMAIL FOR FREE


Gear Energy Ltd. Announces Results of Directors Vote

FOR: GEAR ENERGY LTD.
TSX SYMBOL: GXE

Date issue: May 10, 2017
Time in: 7:35 PM e

Attention:

CALGARY, ALBERTA–(Marketwired – May 10, 2017) – Gear Energy Ltd. (“Gear”)
(TSX:GXE) is pleased to announce that the nominees listed in the management
proxy circular dated March 31, 2017 were elected as directors of Gear. The
detailed results of the vote for the election of directors held at Gear’s
annual meeting of shareholders held today (the “Meeting”) are set out below.

On a vote by ballot, each of the following six nominees proposed by management
was elected as a director of Gear:

/T/

Nominee Outcome of Vote Votes For % For Votes Withheld % Withheld
————— ————— ———– —– ————– ———-
Raymond Cej Elected 98,900,261 97.83 2,190,261 2.17
Harry English Elected 100,058,603 98.98 1,031,919 1.02
Ingram Gillmore Elected 99,900,623 98.82 1,189,898 1.18
Donald Gray Elected 98,736,735 97.67 2,353,786 2.33
John O’Connell Elected 100,197,573 99.12 892,948 0.88
Kevin Olson Elected 100,209,114 99.13 881,408 0.87

/T/

For details of the voting results on the other matters considered at the
Meeting, see Gear’s Report of Voting Results filed pursuant to National
Instrument 51-102 on www.sedar.com.

– END RELEASE – 10/05/2017

For further information:
Gear Energy Ltd.
Ingram Gillmore
President & CEO
403-538-8463
[email protected]
OR
Gear Energy Ltd.
David Hwang
Vice President Finance & CFO
403-538-8437
[email protected]
www.gearenergy.com

COMPANY:
FOR: GEAR ENERGY LTD.
TSX SYMBOL: GXE

INDUSTRY: Energy and Utilities – Oil and Gas
RELEASE ID: 20170510CC0131

Press Release from Marketwired 1-866-736-3779

All press releases are written by the client and have NO affiliation with the news copy written by The Canadian Press. Any questions that arise due to the content or information provided in the press release should be directed to the company/organization
issuing the release, not to The Canadian Press.

GET ENERGYNOW’S DAILY EMAIL FOR FREE


Kinder Morgan looking to raise $1.75 billion in Trans Mountain pipeline IPO

CALGARY — Kinder Morgan Canada is looking to raise $1.75 billion through an initial public offering of assets including the Trans Mountain pipeline system.

In an updated prospectus filed Wednesday, the company said it’s looking to sell shares at between $19 and $22 to help fund the $7.4 billion Trans Mountain Expansion Project, rather than using a joint venture to fund it.

The Kinder Morgan Canada Ltd. Partnership would hold both the Trans Mountain pipeline and the expansion project, the Puget Sound pipeline system in Washington State, a condensate pipeline, along with storage and terminals along the pipeline routes.

Houston-based Kinder Morgan would still hold a majority share, with as much as a 77 per cent interest in the entity.

The U.S. company said it’s confident in interest from the investment community for the deal. The regulatory filing said Kinder Morgan Canada aims to close the IPO the week of May 29.

The filing comes a day after the B.C. election in which the Liberal party, which supports the pipeline, won 43 seats, one short of a majority. The NDP and Green parties, which oppose the pipeline, hold 41 and three seats respectively.

The final tally of the election could yet change, with several recounts planned and absentee ballots still to be counted.  

The Canadian Press

GET ENERGYNOW’S DAILY EMAIL FOR FREE


CORRECTION-Strad Energy Services Announces First Quarter Results

FOR: STRAD ENERGY SERVICES LTD.
TSX SYMBOL: SDY

Date issue: May 10, 2017
Time in: 7:06 PM e

Attention:

CALGARY, ALBERTA–(Marketwired – May 10, 2017) –

The following press release replaces the one disseminated on May 10, 2017 at
18:08 ET. There was an error in the conference call section displaying an
incorrect number. The corrected conference call information can be found below:

NOT FOR DISTRIBUTION TO U.S. NEWS WIRE SERVICES OR FOR DISSEMINATION IN THE
UNITED STATES (“U.S.”)

The news release contains “forward-looking information and statements” within
the meaning of applicable securities laws. For full disclosure of the
forward-looking information and statements and the risks to which they are
subject, see the “Cautionary Statement Regarding Forward-Looking Information
and Statements” later in this news release.

Strad Energy Services Ltd., (“Strad” or the “Company”) (TSX:SDY), a North
American-focused, energy services company, today announced its financial
results for the three months ended March 31, 2017. All amounts are stated in
Canadian dollars unless otherwise noted.

FIRST QUARTER SELECTED FINANCIAL AND OPERATIONAL HIGHLIGHTS:

/T/

— Revenue of $27.7 million increased 81% compared to $15.3 million for the

same period in 2016;

— Adjusted EBITDA(1) of $4.5 million compared to $0.4 million for the same

period in 2016;

— Loss per share was $(0.04) compared to $(0.08) for the same period in

2016;

— On February 7, 2017, the Company closed a bought deal financing with a

syndicate of underwriters. A total of 8,928,572 Class A shares (“common
shares”) were issued, including 1,164,596 common shares issued pursuant
to the exercise of the over-allotment option, for gross proceeds of
$15.0 million. Share issue costs of $1.0 million were incurred in
relation to the financing;

— On February 15, 2017, the Company closed the strategic acquisition of

Got Mats?, a private company, located in Elkhorn, Manitoba.
Consideration of $4.5 million was paid, consisting of $1.0 million in
cash and the issuance of 2,143,375 common shares, valued at the closing
February 15, 2017, share price of $1.65;

— On February 22, 2017, the Company closed the acquisition of two private

companies, located in Fort St. John, British Columbia. Consideration of
$2.8 million was paid, consisting of $1.8 million of cash, and the
issuance of 561,798 common shares, valued at the closing February 22,
2017, share price of $1.83 per share;

— Capital additions totaled $3.5 million during the first quarter of 2017;

and

— Total funded debt(2) to EBITDA(3) ratio was 1.8 : 1 at the end of the

first quarter of 2017.

/T/

Notes:

/T/

(1) Earnings before interest, taxes, depreciation and amortization and other

adjustments (“adjusted EBITDA”) is not a recognized measure under IFRS;
see “Non-IFRS Measures Reconciliation”.
(2) Funded debt includes bank indebtedness plus long-term debt plus current
and long-term obligations under finance lease less cash.
(3) EBITDA is based on trailing twelve months adjusted EBITDA plus share
based payments, plus additional one time charges.

/T/

“Improving customer sentiment during the first quarter of 2017 combined with
strategic acquisitions completed over the past nine months have resulted in a
significant improvement in our financial performance compared to the first
quarter of 2016,” said Andy Pernal, President and Chief Executive Officer. “In
Canada, our business benefited from higher utilization of our expanded surface
equipment fleet, increased rig activity levels and challenging weather
conditions which resulted in the early activation of our matting fleet. In the
U.S., market conditions continued to be challenging from a pricing perspective
in our operating regions despite increases in demand during the first quarter.”

“We improved our financial flexibility and balance sheet strength through the
successful completion of the bought deal financing as well as through cost
management to ensure efficiencies gained over the past two years are maintained
as the industry recovers and our business grows,” said Michael Donovan, Chief
Financial Officer of Strad. “During the first quarter, we allocated $3.5
million to capital additions primarily to support the growth of our matting
business and energy infrastructure customer vertical in the U.S. and Canada.”

The Company is also announcing the retirement of Mr. John Hagg from the
Company’s Board of Directors effective May 31, 2017. Strad’s Chairman of the
Board, Rob Grandfield, said, “On behalf of Strad, I would like to extend the
Company’s sincere thanks to John for his service to Strad over the last 10
years including his years as Chairman of the Board. We wish him all the best
with his retirement.”

FIRST QUARTER FINANCIAL HIGHLIGHTS

/T/

($000’s, except per share amounts) Three months ended March 31,
————————————–
2017 2016 % Chg.
Revenue 27,660 15,258 81
—————————————————————————-
Adjusted EBITDA(1) 4,496 398 1,030
Adjusted EBITDA as a % of revenue 16% 3%
Per share ($), basic 0.08 0.01 700
Per share ($), diluted 0.08 0.01 700
—————————————————————————-
Net loss (2,347) (2,994) 22
Per share ($), basic (0.04) (0.08) 50
Per share ($), diluted (0.04) (0.08) 50
—————————————————————————-
Funds from operations(2) 5,527 1,737 218
Per share ($), basic 0.08 0.03 167
Per share ($), diluted 0.08 0.03 167
—————————————————————————-

Capital expenditures(3) 3,470 421 724
—————————————————————————-

Total assets 194,094 154,960 25
Long-term debt 15,589 15,500 1
Total long-term liabilities 27,601 22,111 25
—————————————————————————-
Common shares – end of period (‘000’s) 60,013 37,280
Weighted avg common shares (‘000’s)
Basic 55,643 36,944
Diluted 55,643 36,944

/T/

Notes:

/T/

(1) Earnings before interest, taxes, depreciation and amortization and other

adjustments (“adjusted EBITDA”) is not a recognized measure under IFRS;
see “Non-IFRS Measures Reconciliation”.
(2) Funds from operations is cash flow from operating activities excluding
changes in non-cash working capital. Funds from operations is not a
recognized measure under IFRS; see “Non-IFRS Measures Reconciliation”.
(3) Includes assets acquired under finance lease and purchases of intangible
assets.

/T/

FINANCIAL POSITION AND RATIOS

/T/

As at March 31, As at December
($000’s except ratios) 2017 2016
————— —————

Working capital(1) 17,495 15,636
Funded debt(2) 19,289 29,025
Total assets 194,094 185,321

Funded debt to EBITDA(3) 1.8 : 1.0 3.2 : 1.0

/T/

Notes:

/T/

(1) Working capital is calculated as current assets less current

liabilities.
(2) Funded debt includes bank indebtedness plus long-term debt plus current
and long-term obligations under finance lease less cash.
(3) EBITDA is based on trailing twelve months adjusted EBITDA plus share
based payments, plus additional one time charges. See “Non-IFRS Measures
Reconciliation”.

/T/

FIRST QUARTER RESULTS

Strad reported an increase in revenue and adjusted EBITDA of 81% and 1,030%,
respectively during the three months ended March 31, 2017, compared to the same
period in 2016. Strad’s first quarter results were impacted by higher drilling
activity levels in the WCSB region and slightly higher revenue from the U.S.
Operations offset by lower overall Product Sales compared to the prior period.
Despite the overall increase in drilling activity and utilization of Strad’s
equipment fleets, pricing continued to be challenging across all of the
Company’s operating regions muting the impact of higher activity levels on
revenue during the three months ended March 31, 2017. Adjusted EBITDA margin
percentage increased 16% compared to 3% in the prior year, due to higher
utilization and a relatively fixed cost structure.

Strad’s Canadian Operations reported an increase in revenue and adjusted EBITDA
of 144% and 183%, respectively, during the three months ended March 31, 2017,
compared to the same period in 2016. Increased revenue was a result of higher
drilling activity throughout the first quarter and a corresponding increase in
surface equipment utilization and an increase in the surface equipment fleet
due to the acquisitions completed in the third quarter of 2016 and the first
quarter of 2017. These revenue gains were offset by lower pricing during the
first quarter of 2017 compared to the same period in 2016. Revenue during the
first quarter was further impacted by the deployment of Strad’s matting fleet
earlier in the 2017 season compared to the prior year.

Strad’s U.S. Operations reported an increase in revenue of 6% and an increase
in adjusted EBITDA of 146% compared to the same period in 2016. Rig counts in
two of Strad’s targeted U.S. resource plays were also higher during the first
three months of 2017 compared to the same period in 2016. Rig counts in the
Bakken, Rockies and Marcellus regions changed by (6)%, 56%, and 40%,
respectively.

Strad’s Product Sales operations reported a decrease in revenue of 13%,
primarily the result of a decrease in rental fleet equipment sales in the three
months ending March 31, 2017, as compared to the same period in 2016.

During the first quarter of 2017, capital expenditures were $1.3 million in
Canada and $2.2 million in the U.S. Capital expenditures related primarily to
wood matting additions in Canada and the U.S. Strad’s 2017 capital budget of
$15.0 million will be evaluated during the year based on affordability and
activity levels.

RESULTS OF OPERATIONS

Canadian Operations

/T/

Three months ended March 31,
————————————–
($000’s) 2017 2016 % chg.

Revenue 20,946 8,575 144
Operating expenses 14,711 5,814 153
Selling, general and administrative 1,383 1,076 29
Share based payments 84 –
Net income 1,599 440 266
Adjusted EBITDA(1) 4,768 1,685 183
Adjusted EBITDA as a % of revenue 23% 20%

Capital expenditures(2) 1,260 83 1,418
Gross capital assets 157,446 114,108 38
Total assets 123,519 74,779 65

Equipment Fleet:

Surface Equipment 4,100 2,600 58
Utilization % (3) 41% 20%
Matting 64,200 48,800 32
Utilization % 39% 36%

/T/

Notes:

/T/

(1) Earnings before interest, taxes, depreciation and amortization and other

adjustments (“adjusted EBITDA”) is not a recognized measure under IFRS;
see “Non-IFRS Measures Reconciliation”.
(2) Includes assets acquired under finance lease and purchases of intangible
assets.
(3) Equipment utilization includes surface and matting equipment on rent
only and is calculated using gross asset value.

/T/

Revenue for the three months ended March 31, 2017, of $20.9 million increased
144% compared to $8.6 million for the same period in 2016. Increased revenue
during the quarter was primarily a result of higher utilization in matting and
surface equipment rentals as compared to Q1 2016. The increase in utilization
is partially the result of the acquisitions that occurred in the third quarter
of 2016 (Redneck acquisition) and first quarter of 2017 (Got Mats? acquisition)
as well as an increase in drilling activity levels during the first quarter of
2017. Industry rig counts increased by approximately 89% during the three
months ended March 31, 2017, as compared to the same period in 2016. These
factors were offset by a slight decrease in prices for the three months ended
March 31, 2017, as compared to the same period in 2016.

During the first quarter, revenue from energy infrastructure projects was
approximately $7.9 million or 38% of total revenue for Canadian Operations.
This has increased from $3.1 million of 36% of total Canadian Operations
revenue in the first quarter of 2016.

During the first quarter, Strad’s matting rental fleet increased to
approximately 64,200 pieces, compared to approximately 48,800 pieces as at
March 31, 2016. Part of the increase was due to the Got Mats? acquisition that
was completed in February 2017. Utilization increased by 8% during the first
quarter of 2017, compared to the first quarter of 2016, due to the increase in
energy infrastructure projects. During the first quarter, Strad’s surface
equipment fleet increased to approximately 4,100 pieces, compared to
approximately 2,600 pieces as at March 31, 2016. A key driver to the increase
in fleet size was the Redneck acquisition in the third quarter of 2016.
Utilization increased by 105% during the first quarter of 2017, compared to the
same period in 2016, due to increased market share resulting from third quarter
2016 acquisition of Redneck and the first quarter 2017 acquisitions, as well as
an increase in drilling activity.

Adjusted EBITDA for the three months ended March 31, 2017, of $4.8 million,
increased 183% compared to $1.7 million for the same period in 2016. Adjusted
EBITDA as a percentage of revenue, for the three months ended March 31, 2017,
increased to 23% compared to 20% for the same period in 2016.

Operating expenses for the three months ended March 31, 2017, of $14.7 million
increased 153% compared to $5.8 million for the same period in 2016. The
increase in operating expenses during the first three months of 2017 is a
result of increased activity levels, utilization rates, and fleet size, as well
as an increase in repairs and maintenance costs, as compared to the same period
in 2016. An increase in repairs and maintenance is expected during periods
where utilization rates increase after a long period of lower utilization as
the Company incurs reactivation costs prior to deployment.

Selling, general and administrative costs (“SG&A”) for the three months ended
March 31, 2017, of $1.4 million increased 29% compared to $1.1 million for the
same period in 2016. SG&A costs increased as a result of the third quarter 2016
Redneck acquisition and first quarter 2017 acquisitions.

U.S. Operations

/T/

Three months ended March 31,
—————————————-
($000’s) 2017 2016 % chg.

Revenue 5,066 4,786 6
Operating expenses 3,952 4,130 (4)
Selling, general and administrative 896 1,092 (18)
Share based payments 17 –
Net loss (2,207) (1,910) (16)
Adjusted EBITDA(1) 201 (436) (146)
Adjusted EBITDA as a % of revenue 4% (9)%

Capital expenditures(2) 2,185 296 638
Gross capital assets 141,305 142,458 (1)
Total assets 69,644 82,491 (16)

Equipment Fleet:
Surface Equipment 2,050 2,070 (1)
Utilization % (3) 25% 18%
Matting 18,600 12,550 48
Utilization % 18% 20%

/T/

Notes:

/T/

(1) Earnings before interest, taxes, depreciation and amortization and other

adjustments (“adjusted EBITDA”) is not a recognized measure under IFRS;
see “Non-IFRS Measures Reconciliation”.
(2) Includes assets acquired under finance lease and purchases of intangible
assets.
(3) Equipment utilization includes surface and matting equipment on rent
only and is calculated using gross asset value.

/T/

Revenue for the three months ended March 31, 2017, increased 6% to $5.1 million
from $4.8 million for the same period in 2016. The increase in revenue is due
to a combination of higher surface equipment utilization rates and a
strengthened U.S. dollar when compared to the same period in 2016, which is
slightly offset by price declines quarter-over-quarter. The increase in surface
equipment utilization is the result of higher rig counts in the Rockies and
Marcellus resource plays. Average rig counts in the Rockies and Marcellus
regions increased by 56%, and 40%, respectively, during the first three months
of 2017 compared to the same quarter in 2016.

The U.S. matting fleet increased by 6,050 pieces to 18,600 as at March 31,
2017, compared to 12,550 pieces as at March 31, 2016, which increased revenue
generated from the matting business and was partially offset by a decrease in
utilization from 20% in the first quarter of 2016 to 18% during the first
quarter of 2017. The U.S. surface equipment fleet decreased slightly by 20
pieces of equipment to 2,050 pieces as at March 31, 2017, compared to 2,070
pieces as at March 31, 2016.

Adjusted EBITDA for the three months ended March 31, 2017, increased to $0.2
million compared to $(0.4) million for the same period in 2016. Adjusted EBITDA
as a percentage of revenue, for the three months ended March 31, 2017, was 4%
compared to (9)% for the same period in 2016. The increase in both adjusted
EBITDA and adjusted EBITDA as a percentage of revenue is primarily due to an
increase in utilization and activity levels, offset by lower pricing in the
first quarter of 2017 compared to the same period in 2016.

Operating expenses for the three months ended March 31, 2017, of $4.0 million
decreased 4% compared to $4.1 million for the same period in 2016. SG&A costs
for the three months ended March 31, 2017, of $0.9 million decreased 18%
compared to $1.1 million for the same period in 2016. The decrease in operating
and SG&A expenses is due to cost reductions implemented by management including
staff reductions and reductions in discretionary spending.

Product Sales

/T/

Three months ended March 31,
—————————————
($000’s) 2017 2016 % chg.

Revenue 1,648 1,897 (13)
Operating expenses 1,083 1,845 (41)
Selling, general and administrative 50 – –
Share based payments – –
Net loss (270) (294)
Adjusted EBITDA(1) 515 51 910
Adjusted EBITDA as a % of revenue 31% 3%

Capital expenditures(2) 25 –
Total assets 27 67 (60)

/T/

Notes:

/T/

(1) Earnings before interest, taxes, depreciation and amortization and other

adjustments (“adjusted EBITDA”) is not a recognized measure under IFRS;
see “Non-IFRS Measures Reconciliation”.
(2) Includes assets acquired under finance lease and purchases of intangible
assets.

/T/

Product Sales are comprised of in-house manufactured products sold to external
customers, third party equipment sales to existing customers and sales of
equipment from Strad’s existing fleet to customers.

Revenue for the three months ended March 31, 2017, decreased 13% to $1.6
million from $1.9 million for the same period in 2016, resulting primarily from
lower rental asset equipment sales. During the three months ended March 31,
2017, Product Sales consisted of $0.2 million of in-house manufactured
products, $0.5 million of third party equipment sales and $0.9 million of
rental fleet sales compared to $0.4 million, $0.1 million and $1.4 million,
respectively, during the same period in 2016.

Adjusted EBITDA for the three months ended March 31, 2017, increased to $0.5
million from $50 thousand for the same period in 2016. Adjusted EBITDA as a
percentage of revenue, for the three months ended March 31, 2017, was 31%
compared to 3% for the same period in 2016.

Operating expenses for the three months ended March 31, 2017, of $1.1 million
decreased 41% compared to $1.8 million for the same period in 2016. Operating
expenses vary with individual transactions and business activity levels.

OUTLOOK

The increase in drilling activity we experienced during the fourth quarter of
2016 continued into the first quarter of 2017 resulting in improved revenue and
adjusted EBITDA quarter-over-quarter. We particularly noted an increase in
demand for our services in the WCSB during the first quarter where the average
rig count increased from 158 in the first quarter of 2016 to 298 in the first
quarter of 2017. The addition of Redneck in the third quarter of 2016 had a
positive impact on our results this quarter due to our expanded equipment
offering in the Deep Basin, one of the most active oil and gas basins in North
America.

Pricing for the majority of our products and services during the first quarter
remained at levels consistent with the fourth quarter of 2016 as pricing with
the majority of our customers was agreed to in the last six months of 2016. Wet
weather conditions in the WCSB resulted in an early start to the matting
season. Stronger demand and a shortage of matting products translated into
double digit price increases at the end of the first quarter and into the
second quarter. We expect pricing in this segment to remain strong through the
2017 matting season, assuming demand levels continue. Increasing prices for all
of our products and services will continue to be a primary focus for our team
as activity levels continue to improve year-over-year.

During the first quarter, we continued to progress on our strategic priorities
being continued growth of the energy infrastructure customer vertical,
continued focus on increasing our size and scale and maintaining our lean cost
structure.

Energy infrastructure revenue accounted for 32% of total revenue, 38% of total
Canadian Operations revenue and 10% of total U.S. Operations revenue during the
first quarter of 2017. We added approximately 4,050 sheets of wood matting to
our U.S. fleet, which were subsequently deployed to various energy
infrastructure projects in the U.S. We expect this segment to increasingly
become a more significant portion of our U.S. Operations revenue as we continue
to add new customers.

Growing our size and scale using a combination of growth capital and tuck-in
acquisitions continued during the first quarter with the addition of Got Mats?
and two private companies in British Columbia along with deploying $3.5 million
in capital expenditures of the total $15.0 million 2017 capital budget. New
capital was primarily allocated to matting opportunities in the U.S. to support
the growth of the energy infrastructure customer vertical. We expect to deploy
the remainder of our 2017 capital budget primarily to matting in both Canada
and the U.S. as opportunities arise.

Looking ahead to the second quarter of 2017 and beyond, we expect the trend of
higher activity levels year-over-year and further price increases in both
Canada and the U.S. to continue, assuming current demand for our products and
services continues throughout 2017. We will continue our focus on managing our
cost structure as activity levels increase to ensure the efficiencies we gained
over the past two years are maintained driving margin improvement. Maintaining
our balance sheet strength and financial flexibility is key to ensuring we are
positioned to take advantage of further opportunities.

LIQUIDITY AND CAPITAL RESOURCES

/T/

December 31,
($000’s) March 31, 2017 2016
————— —————

Current assets 35,930 31,852
Current liabilities 18,435 16,216
————— —————
Working capital(1) 17,495 15,636

Banking facilities
Operating facility 2,776 1,478
Syndicated revolving facility 15,589 26,501
————— —————
Total facility borrowings 18,365 27,979

Total credit facilities(2) 48,500 48,500
————— —————
Unused credit capacity 30,135 20,521

/T/

Notes:

/T/

(1) Working capital is calculated as current assets less current

liabilities.
(2) Facilities are subject to certain limitations on accounts receivable,
inventory, and net book value of fixed assets and are secured by a
general security agreement over all of the Company’s assets. As at March
31, 2017, Strad had access to $48.5 million of credit facilities.

/T/

As at March 31, 2017, working capital was $17.5 million compared to $15.6
million at December 31, 2016. The change in current assets is a result of a 16%
increase in accounts receivable to $28.3 million for the first quarter of 2017
compared to $24.5 million for the fourth quarter of 2016. The increase in
accounts receivable is due to an increase in rental equipment related revenue
during the first quarter as compared to the fourth quarter of 2016. Inventory
decreased by 8% to $3.6 million at March 31, 2017, from $3.9 million at
December 31, 2016, and prepaid expenses remained consistent at $1.1 million.
The decrease in inventory relates to the normal course of business.

The change in current liabilities is a result of a 7% increase in accounts
payable and accrued liabilities to $14.9 million at March 31, 2017, compared to
$13.9 million at year end. The accounts payable increase correlates to the
increase in activity and operating expenses during the first quarter of 2017
compared to the fourth quarter of 2016. Bank indebtedness increased to $2.8
million at the end of the first quarter compared to bank indebtedness of $1.5
million for the fourth quarter of 2016.

Funds from operations for the three months ended March 31, 2017, increased to
$5.5 million compared to $1.7 million for the three months ended March 31,
2016. Capital expenditures totaled $3.5 million for the three months ended
March 31, 2017. Strad’s total facility borrowing decreased by $9.6 million for
the three months ended March 31, 2017, compared to the fourth quarter of 2016.
Management monitors funds from operations and the timing of capital additions
to ensure adequate capital resources are available to fund Strad’s capital
program.

As at March 31, 2017, the Company’s syndicated banking facility consists of an
operating facility with a maximum principal amount of $7.0 million CAD and $5.0
million USD, and a $36.5 million syndicated revolving facility, both of which
are subject to certain limitations on accounts receivable, inventory and net
book value of fixed assets and are secured by a general security agreement over
all of the Company’s assets. As at March 31, 2017, the Company has access to
the maximum credit facilities. The syndicated banking facility bears interest
at bank prime plus a variable rate, which is dependent on the Company’s funded
debt to EBITDA ratio. The Company’s syndicated banking facility matures on
September 29, 2018.

Based on the Company’s current credit facility, the interest rate will increase
to bank prime plus 3.50% on prime rate advances and at the prevailing rate plus
a stamping fee of 4.50% on bankers’ acceptances during the covenant waiver
period which continues through the first quarter of 2017. The covenant waiver
was obtained as a result of the Redneck acquisition and not as a result of any
covenant breach. For the three months ended March 31, 2017, the overall
effective rates on the operating facility and revolving facility were 5.30% and
5.60%, respectively. As of March 31, 2017, $2.8 million was drawn on the
operating facility and $15.6 million was drawn on the revolving facility.
Required payments on the revolving facility are interest only.

As at March 31, 2017, the Company was in compliance with all of the financial
covenants under its credit facilities.

The relevant definitions of financial debt covenant ratio terms as set forth in
the Company’s syndicated banking facility are as follows:

/T/

— Funded debt includes bank indebtedness plus long-term debt plus current

and long-term obligations under finance lease less cash.
— EBITDA is based on trailing twelve months adjusted EBITDA plus share
based payments, plus charges.
— Interest expense ratio is calculated as the ratio of trailing twelve
months adjusted EBITDA plus share based payments to trailing twelve
months interest expense on loans and borrowings.

/T/

The above noted definitions are not recognized under IFRS and are provided
strictly for the purposes of the financial debt calculation.

/T/

As at March 31, As at December
Financial Debt Covenants 2017 31, 2016
—————————————————————————-
Funded debt to EBITDA ratio (not to exceed
5.5:1.0)
Funded debt 19,289 29,025
EBITDA 10,774 9,119
—————————————————————————-
Ratio 1.8 3.2
—————————————————————————-
—————————————————————————-

EBITDA to interest coverage ratio (no less
than 1.75:1.0)
EBITDA 10,774 9,119
Interest expense 1,584 1,557
—————————————————————————-
Ratio 6.8 5.9
—————————————————————————-
—————————————————————————-

/T/

NON-IFRS MEASURES RECONCILIATION

Certain supplementary measures in this press release do not have any
standardized meaning as prescribed under IFRS and, therefore, are considered
non-IFRS measures. These measures are described and presented in order to
provide shareholders and potential investors with additional information
regarding the Company’s financial results, liquidity and its ability to
generate funds to finance its operations. These measures are identified and
presented, where appropriate, together with reconciliations to the equivalent
IFRS measure. However, they should not be used as an alternative to IFRS,
because they may not be consistent with calculations of other companies. These
measures are further explained below.

Earnings before interest, taxes, depreciation and amortization and other
adjustments (“adjusted EBITDA”) is not a recognized measure under IFRS.
Management believes that in addition to net income, adjusted EBITDA is a useful
supplemental measure as it provides an indication of the results generated by
the Company’s principal business activities prior to consideration of how those
activities are financed or how the results are taxed. Adjusted EBITDA is
calculated as net income (loss) plus interest, finance fees, taxes,
depreciation and amortization, loss on disposal of property, plant and
equipment, loss on foreign exchange, less gain on foreign exchange and gain on
disposal of property, plant and equipment. Segmented adjusted EBITDA is based
upon the same calculation for defined business segments, which are comprised of
Canadian Operations, U.S. Operations and Product Sales.

Funds from operations are cash flow from operating activities excluding changes
in non-cash working capital. It is a supplemental measure to gauge performance
of the Company before non-cash items. Working capital is calculated as current
assets minus current liabilities. Working capital, cash forecasting and banking
facilities are used by Management to ensure funds are available to finance
growth opportunities.

Funded debt is calculated as bank indebtedness plus long-term debt plus current
and long-term portion of finance lease obligations less cash.

/T/

Reconciliation of Funds from Operations
($000’s)

Three months ended March 31,
—————————————————————————-
2017 2016
—————————————————————————-

Net cash generated from operating activities 3,541 5,246
Less:
Changes in non-cash working capital (1,986) 3,509
—————————————————————————-
Funds from Operations 5,527 1,737
—————————————————————————-

Reconciliation of Adjusted EBITDA
($000’s)

Three months ended March 31,
—————————————————————————-
2017 2016
—————————————————————————-

Net loss $ (2,347) $ (2,994)
Add (deduct):
Depreciation and amortization 6,383 5,149
Gain on disposal of PP&E (78) (193)
Deferred income tax (recovery) expense 116 (1,201)
Financing fees 73 47
Interest expense 436 244
Gain on foreign exchange (87) (437)
Current income tax recovery – (217)
—————————————————————————-
Adjusted EBITDA 4,496 398
—————————————————————————-

Reconciliation of quarterly non-IFRS measures
($000’s)

Three months ended
—————————————————————————-
Mar 31, Dec 31, Sep 30, Jun 30,
2017 2016 2016 2016
—————————————————————————-

Net loss $ (2,347) $ (3,105) $ (3,746) $ (6,958)
Add:
Depreciation and amortization 6,383 7,610 4,930 4,516
Gain on disposal of PP&E (78) (105) (35) (268)
(Gain) loss on foreign
exchange (87) 123 17 3
Current income tax (recovery)
expense – 204 (242) (918)
Deferred income tax
(recovery) expense 116 (403) (39) 1,438
Interest expense 436 415 318 157
Finance fees 73 43 44 47
—————————————————————————-
Adjusted EBITDA 4,496 4,782 1,247 (1,983)
—————————————————————————-

Three months ended
—————————————————
Mar 31, 2016 Dec 31, 2015 Sep 30, 2015 Jun 30, 2015
—————————————————

Net loss $ (2,994) $ (8,316) $ (20,362) $ (1,887)
Add:
Depreciation and
amortization 5,149 7,126 9,616 7,020
Gain on disposal of PP&E (193) (99) (30) (80)
(Gain) loss on foreign
exchange (437) 216 380 (81)
Current income tax
recovery (217) (677) (432) (18)
Deferred income tax
recovery (1,201) (4,033) (2,776) (1,541)
Interest expense 244 427 311 391
Impairment loss – 7,822 17,277 –
Finance fees 47 34 37 50
—————————————————————————-
Adjusted EBITDA 398 2,500 4,021 3,854
—————————————————————————-

Reconciliation of funded debt
($000’s)

Three months Year Ended
ended March 31, December 31,
2017 2016
—————————————————————————-
Bank indebtedness 2,776 1,478
Long term debt 15,589 26,501
Current and long term obligations under
finance lease 924 1,046
—————————————————————————-
Total funded debt 19,289 29,025
—————————————————————————-

/T/

CAUTIONARY STATEMENT REGARDING FORWARD-LOOKING INFORMATION AND STATEMENTS

Certain statements and information contained in this press release constitute
forward-looking information and statements within the meaning of applicable
securities laws. The use of any of the words “expect”, “plan”, “continue”,
“estimate”, “anticipate”, “potential”, “targeting”, “intend”, “could”, “might”,
“should”, “believe”, “may”, “predict”, or “will” and similar expressions are
intended to identify forward-looking information or statements. More
particularly, this press release contains forward-looking statements concerning
future capital expenditures of the Company and funding thereof, changes and
expectations in margins to be experienced by Strad, anticipated cash flow,
debt, demand for the Company’s products and services, drilling activity in
North America, pricing of the Company’s products and services, introduction of
new products and services and the potential for growth and expansion of certain
components of the Company’s business, anticipated benefits from cost reductions
and timing thereof, and expected exploration and production industry activity
including the effects of industry trends on demand for the Company’s products.
These statements relate to future events or to the Company’s future financial
performance and involve known and unknown risks, uncertainties and other
factors that may cause the Company’s actual results, levels of activity,
performance or achievements to be materially different from future results,
levels of activity, performance or achievements expressed or implied by such
forward-looking statements.

Various assumptions were used in drawing the conclusions or making the
projections contained in the forward-looking statements throughout this press
release. The forward-looking information and statements included in this press
release are not guarantees of future performance and should not be unduly
relied upon. Forward-looking statements are based on current expectations,
estimates and projections that involve a number of risks and uncertainties,
which could cause actual results to differ materially from those anticipated
and described in the forward-looking statements. Such information and
statements involve known and unknown risks, uncertainties and other factors
that may cause actual results or events to differ materially from those
anticipated in such forward-looking information or statements. In addition to
other material factors, expectations and assumptions which may be identified in
this press release and other continuous disclosure documents of the Company
referenced herein, assumptions have been made in respect of such
forward-looking statements and information regarding, among other things: the
Company will continue to conduct its operations in a manner consistent with
past operations; the general continuance of current industry conditions;
anticipated financial performance, business prospects, impact of competition,
strategies, the general stability of the economic and political environment in
which the Company operates; exchange and interest rates; tax laws; the
sufficiency of budgeted capital expenditures in carrying out planned
activities; the availability and cost of labour and services and the adequacy
of cash flow; debt and ability to obtain financing on acceptable terms to fund
its planned expenditures, which are subject to change based on commodity
prices; market conditions and future oil and natural gas prices; and potential
timing delays. Although Management considers these material factors,
expectations and assumptions to be reasonable based on information currently
available to it, no assurance can be given that they will prove to be correct.

Readers are cautioned that the foregoing lists of factors are not exhaustive.
Additional information on these and other factors that could affect the
Company’s operations and financial results are included in reports on file with
the Canadian Securities Regulatory Authorities and may be accessed through the
SEDAR website (www.sedar.com) or at the Company’s website. The forward-looking
statements and information contained in this press release are expressly
qualified by this cautionary statement. The Company does not undertake any
obligation to publicly update or revise any forward-looking statements or
information, whether as a result of new information, future events or
otherwise, except as may be required by applicable securities laws.

This press release shall not constitute an offer to sell, nor the solicitation
of an offer to buy, any securities in the United States, nor shall there be any
sale of securities mentioned in this press release in any state in the United
States in which such offer, solicitation or sale would be unlawful prior to
registration or qualification under the securities laws of any such state.

FIRST QUARTER EARNINGS CONFERENCE CALL

Strad Energy Services Ltd. has scheduled a conference call to begin promptly at
8:00 a.m. MT (10:00 a.m. ET) on Thursday, May 11th, 2017.

The conference call dial in number is 1-844-388-0561, followed by Conference ID
code 93452009

The conference call will also be accessible via webcast at www.stradenergy.com.

A replay of the call will be available approximately one hour after the
conference call ends until Thursday, May 18th, 2017, at 1:00pm ET. To access
the replay, call 1-855-859-2056, followed by pass code 93452009.

/T/

Strad Energy Services Ltd.
Interim Consolidated Statement of Financial Position
(Unaudited)
—————————————————————————-

As at March 31, As at December
(in thousands of Canadian dollars) 2017 31, 2016
$ $

Assets
Current assets
Cash 877 369
Trade receivables 28,303 24,460
Inventories 3,611 3,890
Prepaids and deposits 1,052 1,111
Income taxes receivable 2,087 2,022
——————————–
35,930 31,852

Non-current assets
Property, plant and equipment 155,074 150,622
Intangible assets 621 665
Long term assets 1,981 2,023
Deferred income tax assets 488 159
——————————–
Total assets 194,094 185,321
——————————–
——————————–

Liabilities
Current liabilities
Bank indebtedness 2,776 1,478
Accounts payable and accrued liabilities 14,908 13,893
Current portion of obligations under finance
lease 751 845
——————————–
18,435 16,216
Non-current liabilities
Long-term debt 15,589 26,501
Obligations under finance lease 173 201
Deferred income tax liabilities 11,839 10,321
——————————–
Total liabilities 46,036 53,239

Equity
Share capital 154,755 135,935
Contributed surplus 12,381 12,243
Accumulated other comprehensive income 26,328 26,963
Deficit (45,406) (43,059)
——————————–
Total equity 148,058 132,082
——————————–
Total liabilities and equity 194,094 185,321
——————————–
——————————–

Strad Energy Services Ltd.
Interim Consolidated Statement of Loss and Comprehensive Loss
For the three months ended March 31, 2017 and 2016
(Unaudited)
—————————————————————————-
(in thousands of Canadian dollars,
except per share amounts)

Three Months Ended
March 31,
2017 2016
$ $

Revenue 27,660 15,258
Expenses
Operating expenses 19,746 11,789
Depreciation 6,316 4,944
Amortization of intangible assets 43 181
Amortization of long term assets 24 24
Selling, general and administration 3,280 3,030
Share-based payments 138 41
Gain on disposal of property, plant and
equipment (78) (193)
Foreign exchange gain (87) (437)
Finance fees 73 47
Interest expense 436 244
————————————
Loss before income tax (2,231) (4,412)
Income tax expense (recovery) 116 (1,418)
————————————
Loss for the period (2,347) (2,994)
————————————
————————————

Other comprehensive loss
Items that may be reclassified
subsequently to net loss
Cumulative translation adjustment (635) (5,790)
————————————
Total comprehensive loss for the period (2,982) (8,784)
————————————
————————————

Loss per share:
Basic $ (0.04) $ (0.08)
Diluted $ (0.04) $ (0.08)

Strad Energy Services Ltd.
Interim Consolidated Statement of Cash Flow
For the three months ended March 31, 2017 and 2016
(Unaudited)
—————————————————————————-

Three months ended
(in thousands of Canadian dollars) March 31,
2017 2016
Cash flow provided by (used in) $ $
(revised)

Operating activities
Loss for the period (2,347) (2,994)
Adjustments for items not affecting cash:
Depreciation and amortization 6,383 5,149
Deferred income tax (recovery) expense 116 (1,201)
Share-based payments 138 41
Interest expense and finance fees 509 291
Unrealized foreign exchange loss (gain) 559 (455)
Gain on disposal of property, plant and
equipment (78) (193)
Book value of used fleet sales in operating
activities 247 1,099
Changes in items of non-cash working capital (1,986) 3,509
——————————–
Net cash generated from operating activities 3,541 5,246
——————————–

Investing activities
Purchase of property, plant and equipment (3,470) (379)
Proceeds from sale of property, plant and
equipment 145 611
Purchase of intangible assets – (42)
Cash paid on business acquisition (2,750) –
Cash assumed on business acquisition 322 –
Changes in items of non-cash working capital (549) (3)
——————————–
Net cash generated from (used in) investing
activities (6,302) 187
——————————–

Financing activities
Proceeds on issuance of long-term debt – 3,000
Repayment of long-term debt (10,912) (3,000)
Repayment of finance lease obligations (net) (258) (178)
Issuance of shareholder loan (net of
repayments) – 58
Interest expense and finance fees (509) (291)
Issuance of common shares 15,000 –
Share issue costs (1,020) –
Changes in items of non-cash working capital (148) (2)
——————————–
Net cash generated from (used in) financing
activities 2,153 (413)
——————————–
Effect of exchange rate changes on cash and
cash equivalents (182) (545)
——————————–
Increase (decrease) in cash and cash
equivalents (790) 4,475
——————————–

Cash and cash equivalents (including bank
indebtedness) – beginning of year (1,109) (2,874)
——————————–
Cash and cash equivalents (including bank
indebtedness) – end of period (1,899) 1,601
——————————–
——————————–

Cash paid for income tax – –
Cash paid for interest 262 262
——————————–

/T/

ABOUT STRAD ENERGY SERVICES LTD.

Strad is a North American energy services company that provides rental
equipment and matting solutions to the oil and gas and energy infrastructure
sectors. Strad focuses on providing complete customer solutions in Canada and
the United States.

Strad is headquartered in Calgary, Alberta, Canada. Strad is listed on the
Toronto Stock Exchange under the trading symbol “SDY”.

– END RELEASE – 10/05/2017

For further information:
Strad Energy Services Ltd.
Andy Pernal
President and Chief Executive Officer
(403) 775-9202
(403) 232-6901 (FAX)
[email protected]
OR
Strad Energy Services Ltd.
Michael Donovan
Chief Financial Officer
(403) 775-9221
(403) 232-6901 (FAX)
[email protected]
www.stradenergy.com

COMPANY:
FOR: STRAD ENERGY SERVICES LTD.
TSX SYMBOL: SDY

INDUSTRY: Energy and Utilities – Oil and Gas
RELEASE ID: 20170510CC0127

Press Release from Marketwired 1-866-736-3779

All press releases are written by the client and have NO affiliation with the news copy written by The Canadian Press. Any questions that arise due to the content or information provided in the press release should be directed to the company/organization
issuing the release, not to The Canadian Press.

GET ENERGYNOW’S DAILY EMAIL FOR FREE


Critical Control Announces First Quarter 2017 Financial Results

FOR: CRITICAL CONTROL ENERGY SERVICES CORP.
TSX SYMBOL: CCZ

Date issue: May 10, 2017
Time in: 7:03 PM e

Attention:

CALGARY, ALBERTA–(Marketwired – May 10, 2017) – Critical Control Energy
Services Corp. (TSX:CCZ) today reported its financial results for the three
months ended March 31, 2017.

“The results of the business process reengineering undertaken by management in
2016 are evident in our improved margins and reduced general and administrative
expenses in the quarter”, said Alykhan Mamdani. “While the uncertainty in the
oil and gas industry continues, the changes we have made to our operations and
the investment we have made in our software products enables the Company to
weather the turbulence and the opportunity to grow.”

Revenue

/T/

— The decline in the price of oil and gas since the fourth quarter of 2014

impacted the industry causing reduced expenditure in exploration,
development and operations. As a consequence, the Corporation’s revenue
declined to $7.6 million in 2017 compared to $9.0 million in 2016, a
15.6% overall decline.
— Strong recurring revenue in the Corporation’s Software segment together
with growth driven from the continued penetration of the Corporation’s
software in both Canada and the United States offset declines from shut
in wells and the cost saving measures implemented by industry. As a
result, Software revenue fell by only 8.5% to $4.1 million in 2017 from
$4.5 million in 2016.
— Despite industry factors and the subsequent competitive environment, the
Corporation’s recurring revenue from its Services business remained
relatively steady generating US$2.9 million in revenue in 2017, a 12.4%
decrease from the previous period. The Corporation’s revenue from
fabrication of measurement related equipment for new wells hit the
Corporation’s revenue the hardest causing non-recurring revenue in the
Services business to fall by 75.9% to $0.1 million.

/T/

Gross margin

/T/

— Management’s measures to reengineer the Corporation’s business to exit

the downturn in a more competitive position continues to increase gross
margin from 39.6% to 46.1%.
— Gross margin in Software improved from 54.5% to 59.8% despite a strong
competitive environment and pressures to provide price concessions
during the downturn.
— Despite the reduction of gross margin in the Corporation’s fabrication
business from negative 27.9% in 2016 to negative 62.9% in 2017, the
total gross margin in Services improved from 25.5% to 30.0%. This
resulted from management’s focus on streamlining the operations in the
first half of 2016.

/T/

Earnings and net earnings

/T/

— The Corporation’s loss before tax dropped to less than $0.1 million from

a loss of $1.4 million in 2016. This change was a result of decreased
general and administrative costs in 2017 compared to results from 2016
which included a $0.3 million one-time reorganization expenses and a
$0.7 million foreign currency loss.

/T/

Outlook and Guidance

The decline in energy prices resulted in oil and gas producers shutting in
production, reducing operating costs associated with the Corporation’s
services, demanding price reductions and in certain cases, filing for creditor
protection. These factors combined with competitive pressures from other
service companies negatively impacted the Corporation’s revenue through 2016.

Notwithstanding the foregoing, the Corporation has further penetrated its
client base with its software solutions and reengineered its operations to
reduce costs to maintain, and in some cases grow, its margins.

The impact of the Corporation’s internal business process reengineering and
reorganization in 2016 are evident in the Corporation’s results in the first
quarter of 2017 with improved gross margins and reduced general and
administrative expenses. Management is optimistic that these margins are
sustainable through 2017 at today’s commodity prices and will continue to
improve in the event industry activity increases. Notwithstanding the
foregoing, commodity prices or increased competitive pressures are
unpredictable and a material change will affect profitability.

Simultaneous with cost saving measures, the Corporation has continued its
investment in enhancing its existing software portfolio and adding new software
products to reduce energy producer’s cost and risk. Management intends on
continuing this investment during 2017. The growth from these initiatives has
enabled the Corporation to offset reduced revenue from its existing products
during the downturn in 2016 and management expects this investment to
differentiate the Corporation from its competitors and provide an avenue of
growth regardless of industry conditions in 2017. This expectation is based
upon the Corporation’s ability to develop its software on a timely basis, bring
it to market cost effectively and to successfully penetrate the Corporation’s
existing client base with new software capabilities to address existing costs
and operational risks.

Cash available to the Corporation in cash and availability on its secured lines
of credit has declined from $1.1 million as at December 31, 2016 to $0.5
million as at March 31, 2017. This decline is attributed primarily to
investment by the Corporation in capitalized research and development and the
payment of costs associated with charges expensed in 2016 related to the
restructuring necessary to increase gross margin and reduce general and
administrative costs, the beneficial results of which can be seen in the
current quarter. Payment of these restructuring costs expensed in 2016 are
expected to be materially complete by the end of second quarter of 2017 and the
Corporation’s budget for capitalized research and development significantly
declines during the course of 2017 and therefore Management expects that
current cash flow from operations combined with cash available is sufficient to
fund the operational obligations of the Corporation. Notwithstanding the
forgoing, the ability of the Corporation to invest in additional research and
development or complete existing research and development in the event existing
projects get delayed or extended will be curtailed due to the Corporation’s
access to capital. In such event, additional funds will be required to be
raised by the Corporation through the issuance of debt, equity or a combination
thereof, the success of which cannot be definitive.

About Critical Control

Critical Control provides solutions for the collection, control and analysis of
measurement and operational data related to oil and gas wells across North
America. We provide services to capture the data, cloud based software to
visualize and manage it and the business intelligence to make quicker and more
informed operational decisions.

– END RELEASE – 10/05/2017

For further information:
Alykhan Mamdani
President & CEO
Tel (403) 705-7500

COMPANY:
FOR: CRITICAL CONTROL ENERGY SERVICES CORP.
TSX SYMBOL: CCZ

INDUSTRY: Computers and Software – Software
RELEASE ID: 20170510CC0126

Press Release from Marketwired 1-866-736-3779

All press releases are written by the client and have NO affiliation with the news copy written by The Canadian Press. Any questions that arise due to the content or information provided in the press release should be directed to the company/organization
issuing the release, not to The Canadian Press.

GET ENERGYNOW’S DAILY EMAIL FOR FREE


Trilogy Energy Corp. Announces Director Election Results From Its 2017 Annual Meeting of Shareholders

FOR: TRILOGY ENERGY CORP.TSX SYMBOL: TETDate issue: May 10, 2017Time in: 6:28 PM eAttention:
CALGARY, ALBERTA–(Marketwired – May 10, 2017) – Trilogy Energy Corp.
(“Trilogy”) (TSX:TET) announces that at its annual meeting of shareholders held
on May 9…

GET ENERGYNOW’S DAILY EMAIL FOR FREE


Pine Cliff Energy Ltd. Announces First Quarter 2017 Results

FOR: PINE CLIFF ENERGY LTD.TSX SYMBOL: PNEDate issue: May 10, 2017Time in: 6:00 PM eAttention:
CALGARY, ALBERTA–(Marketwired – May 10, 2017) – Pine Cliff Energy Ltd. (“Pine
Cliff” or the “Company”) (TSX:PNE) is pleased to announce the filing of its
f…

GET ENERGYNOW’S DAILY EMAIL FOR FREE


Wilmington Announces 2017 First Quarter Results

FOR: WILMINGTON CAPITAL MANAGEMENT INC.TSX SYMBOL: WCM.ATSX SYMBOL: WCM.BDate issue: May 10, 2017Time in: 5:54 PM eAttention:
TORONTO, ONTARIO–(Marketwired – May 10, 2017) – Wilmington Capital Management
Inc. (TSX:WCM.A)(TSX:WCM.B) (“Wilmington” or t…

GET ENERGYNOW’S DAILY EMAIL FOR FREE


Granite Oil Corp. Announces Results of Shareholder Meeting

FOR: GRANITE OIL CORP.
TSX SYMBOL: GXO
OTCQX SYMBOL: GXOCF

Date issue: May 10, 2017
Time in: 5:50 PM e

Attention:

CALGARY, ALBERTA–(Marketwired – May 10, 2017) – GRANITE OIL CORP. (“Granite”
or the “Company”) (TSX:GXO)(OTCQX:GXOCF) is pleased to announce the results
from its 2017 annual general meeting of shareholders held on May 10, 2017 in
Calgary, Alberta (the “Meeting”). Each of the matters voted upon at the Meeting
is discussed in detail in the Company’s Management Information Circular dated
April 10, 2017, a copy of which is available on the Company’s SEDAR profile at
www.sedar.com. The voting results for each of the matters voted on by the
shareholders at the Meeting is provided below.

1. Fixing the Number of Directors

The shareholders passed a resolution fixing the number of directors to be
elected at the Meeting at seven. The vote in respect of this matter was carried
out by ballot. The detailed results of voting are as follows.

/T/

# Votes For % Votes For # Votes Against % Votes Against
—————————————————————————-
18,487,020 99.98 2,913 0.02

/T/

2. Election of Directors

All of the nominees named in the Company’s Management Information Circular were
elected as directors of the Company. The vote in respect of this matter was
carried out by ballot. The detailed results of voting are as follows.

/T/

Nominee # Votes For % Votes For # Votes Withheld % Votes Withheld
—————————————————————————-
Kevin Andrus 15,238,365 82.42 3,249,568 17.58
Brendan Carrigy 18,484,254 99.98 3,679 0.02
Martin Cheyne 18,474,893 99.93 13,040 0.07
Henry Hamm 15,248,073 82.48 3,239,860 17.52
Michael Kabanuk 18,483,854 99.98 4,079 0.02
Dennis Nerland 12,178,382 65.87 6,309,551 34.13
Bradley Porter 15,191,502 82.17 3,296,431 17.83

/T/

3. Reappointment of Auditor

The shareholders approved the reappointment of KPMG LLP, Chartered Accountants,
as the auditors of the Company to hold office until the close of the next
annual meeting of shareholders of the Company, at a remuneration to be fixed by
the directors. The vote in respect of this matter was carried out by ballot.
The detailed results of voting are as follows.

/T/

# Votes For % Votes For # Votes Withheld % Votes Withheld
—————————————————————————-
18,413,740 99.59 76,193 0.41

/T/

– END RELEASE – 10/05/2017

For further information:
Granite Oil Corp.
Michael Kabanuk
President & CEO
(587) 349-9123

COMPANY:
FOR: GRANITE OIL CORP.
TSX SYMBOL: GXO
OTCQX SYMBOL: GXOCF

INDUSTRY: Energy and Utilities – Oil and Gas
RELEASE ID: 20170510CC0116

Press Release from Marketwired 1-866-736-3779

All press releases are written by the client and have NO affiliation with the news copy written by The Canadian Press. Any questions that arise due to the content or information provided in the press release should be directed to the company/organization
issuing the release, not to The Canadian Press.

GET ENERGYNOW’S DAILY EMAIL FOR FREE


EnergyNow.ca – Global Petroleum Show (DMG Energy Events) Announce Digital Marketing Partnership

Digital Marketing Partnership   May 10, 2017 Enerpoint iMedia Corp. (EnergyNow.ca & the EnergyNow SHOWCASE Digital Directory) is pleased to announce that it has entered into an exclusive partnership with the Global Petroleum Show 2017 through to 2019 (DMG Energy Events) as their Digital Marketing Partner.  As the Global Petroleum Show’s Digital Marketing Partner, EnergyNow.ca (http://www.energynow.ca) & … Read more

GET ENERGYNOW’S DAILY EMAIL FOR FREE


Ancient site discovery in Albania halts work on gas pipeline

TIRANA, Albania — Work on building a massive gas pipeline through southeastern Europe has been suspended after the discovery of an ancient settlement in eastern Albania, the Trans Adriatic Pipeline company said Wednesday.

The contractor says a “wealth of ceramics” was found in the village of Turan in eastern Albania. The findings are believed to date to the early Iron Age in the 10th and 9th centuries B.C., and to the late Roman period in the 4th and 6th centuries.

The company, created to plan, develop and build the pipeline, said the area was closed off. Work is expected to resume within one month, once the relevant institutions conclude their report.

The company has hired more than 30 cultural heritage experts and archaeologists to monitor work across the pipeline route “to ensure that any archaeological remains are identified and rescued.”

Any such finds in Albania are delivered to the competent Albanian authorities.

The tiny western Balkan country has numerous ancient sites, and it is believed that many others are yet to be discovered.

Albania’s 215-kilometre (133-mile) segment of the Trans Adriatic Pipeline is expected to be complete in 2019.

The pipeline runs for 878 kilometres (545 miles) from Azerbaijan to Turkey, through Greece to Albania, then heading to southern Italy via the Adriatic Sea.

The first gas deliveries to Europe are expected in 2020.

Llazar Semini, The Associated Press

GET ENERGYNOW’S DAILY EMAIL FOR FREE


TWO NEW Courses on Heavy-Oil Recovery Processes – See Them Here – PEICE

Heavy oil production methods are continually changing and improving.  Understaning the various recovery processes which can potentially be used, and how they are applied based on reservoir geological specifics is essential to the optimization of production. In response to the developents that have taken place in the last few years, PEICE will be offering two … Read more

GET ENERGYNOW’S DAILY EMAIL FOR FREE


The Dehumanization of the Recruiting Process in Alberta is Poor Business Practice – Wendy Ferguson – BHRLR, CPHR

          By Wendy Ferguson – BHRLR, CPHR – Ferguson HR Consulting I posted this commentary at the end of 2016 and it went more viral than anything I’ve written to date.  It really hit home to so many so I wanted to publish it again and especially now that we are … Read more

GET ENERGYNOW’S DAILY EMAIL FOR FREE


Want to Know What Is Going On With Oil Prices? READ ON! – David Yager – Yager Management

          David Yager – Yager Management Ltd. Oilfield Service Management Consulting – Oil & Gas Writer – Energy Policy Analyst May 10, 2017 For an industry suffering from Post-Traumatic Stress Disorder (PTSD) almost 2.5 years after the oil price collapse, May 4 was a very long day. After trading within one … Read more

GET ENERGYNOW’S DAILY EMAIL FOR FREE


Dutch appeals court rules Russia knowingly bankrupted Yukos

THE HAGUE, Netherlands — A Dutch appeals court ruled Tuesday that Russian authorities knowingly plunged oil giant Yukos into bankruptcy in 2006 by ordering it to pay huge tax bills, the latest ruling in a long-running battle over the assets of a Dutch Yukos subsidiary.

Amsterdam Appeals Court said the Yukos bankruptcy could not be recognized under Dutch law and that a curator appointed to sell off parts of Yukos in 2007 did not have the right to sell the shares in Dutch-based Yukos Finance BV.

The shares were bought at auction for $307 million by Promneftstroi, the Dutch court said.

A foundation representing former Yukos shareholders welcomed the decision, which upheld a 2007 ruling by a lower court.

Former Yukos Chief Executive Steve Theede said in a statement the Dutch ruling “exposed the extent to which the Russian Federation will go to manipulate the legal process and ignore the rule of law.”

Theede said the Amsterdam ruling “should resolve the case once and for all.”

There was no immediate comment from Russian authorities.

Courts around the world have examined the Yukos case as former shareholders attempt to recover assets.

In 2014, the Permanent Court of Arbitration ruled that Russia launched “a full assault on Yukos and its beneficial owners in order to bankrupt Yukos and appropriate its assets” and silence its CEO Mikhail Khodorkovsky.

However, another Dutch court last year quashed that ruling — and a $50 billion award Russia had been ordered to pay — saying the arbitration panel did not have jurisdiction in the case.

The Associated Press

GET ENERGYNOW’S DAILY EMAIL FOR FREE


The Most Trusted Sand Solution – Specialized Desanders

Sand is an extremely destructive force in the oil and gas industry.  It puts your people, your production and your profits all at risk. Headquartered in Calgary, Alberta, Specialized Desanders has two field offices in the province, as well as one in Pennsylvania. It is the most trusted sand management solution.  Innovation involves exploring novel … Read more

GET ENERGYNOW’S DAILY EMAIL FOR FREE


Suncor to file for approval of 160,000-bpd Lewis thermal oilsands project

CALGARY — Suncor Energy (TSX:SU) says it will apply this year for provincial regulatory permission to build a new Alberta oilsands project that could eventually produce up to 160,000 barrels per day.

The Lewis project hasn’t been officially sanctioned by Suncor, but the company says construction on its first phase may begin in 2024.

The project is located about 25 kilometres northeast of Fort McMurray in northern Alberta.

Suncor says it will consider using new technologies including vaporized solvents and electromagnetic heating to replace steam to produce the heavy bitumen crude through wells at Lewis, thus using less energy and water.

Suncor’s proposed 80,000-bpd Meadow Creek East project south of Fort McMurray in northern Alberta received regulatory approval in March and an application is to be filed this year for its 40,000-bpd Meadow Creek West project.

CEO Steve Williams said recently Suncor has options to build steam-driven projects that could produce some 400,000 bpd, but won’t build any until after 2020.

The Canadian Press

Note to readers: This is a corrected story. A previous version incorrectly said in headlines that Suncor had already filed for approval for the Lewis project. The story also incorrectly stated that an application for Meadow Creek West had already been filed.

GET ENERGYNOW’S DAILY EMAIL FOR FREE


Raging River Exploration Inc. Announces First Quarter Operating and Financial Results, Increases 2017 Guidance and Reaffirms Credit Facilities

FOR: RAGING RIVER EXPLORATION INC.
TSX SYMBOL: RRX

Date issue: May 08, 2017
Time in: 7:28 PM e

Attention:

CALGARY, ALBERTA–(Marketwired – May 8, 2017) – Raging River Exploration Inc.
(the “Company” or “Raging River”) (TSX:RRX) announces its operating and
financial results for the three months ended March 31, 2017. Selected financial
and operational information is outlined below and should be read in conjunction
with the unaudited interim financial statements and the related management’s
discussion and analysis (“MD&A”). These filings will be available at
www.sedar.com and the Company’s website at www.rrexploration.com.

Financial and Operating Highlights

/T/

—————————————————————————-

Three months ended Percent
March 31, Change
———————-
2017 2016
—————————————————————————-
Financial (thousands of dollars except
share data)
Petroleum and natural gas revenue 112,017 50,382 122
Funds from operations (1) 72,752 29,904 143
Per share – basic 0.31 0.14 121
– diluted 0.31 0.14 121
Net earnings (loss) 15,343 (7,852) 295
Per share – basic 0.07 (0.04) 275
– diluted 0.07 (0.04) 275
Development capital expenditures 112,685 37,380 201
Net debt(1)(3) 249,475 44,564 460
Shareholders’ equity 917,366 817,839 12
Weighted average shares (thousands)
Basic 231,152 216,493 7
Diluted 231,501 216,493 7
Shares outstanding, end of period
(thousands)
Basic 231,156 226,014 2
Diluted 236,603 232,741 2
—————————————————————————-
Operating (6:1 boe conversion)

Average daily production

Crude oil and NGLs (bbls/d) 19,476 15,034 30
Heavy crude oil (bbls/d) 1,419 154 821
Natural gas (mcf/d) 11,161 7,900 41
—————————————————————————-
Barrels of oil equivalent (2)(boe/d) 22,755 16,505 38
—————————————————————————-

Netbacks ($/boe)

Operating
Oil and gas sales(3) 54.70 33.54 63
Royalties (5.22) (3.27) 60
Operating expenses (10.50) (8.95) 17
Transportation expenses (1.45) (1.37) 6

—————————————————————————-

Field netback(1) 37.53 19.95 88
Realized gain on commodity contracts 0.13 0.14 (7)
—————————————————————————-
Operating netback 37.66 20.09 87

General and administrative expense (1.02) (1.26) (19)
Financial charges (0.99) (0.82) 21
Asset retirement expenditures (0.12) (0.03) 300
Current taxes recovery – 1.93 (100)
—————————————————————————-
Funds flow netback(1) 35.53 19.91 78
—————————————————————————-
Net earnings (loss) per boe 7.48 (5.23) 243
—————————————————————————-
Wells drilled(4)
Gross 99 57 74
Net 94.5 56.5 67
Success 99% 100% (1)
—————————————————————————-
(1) See “Non-IFRS Measures.”
(2) See ‘”Barrels of Oil Equivalent.”
(3) Excludes unrealized risk management contracts.
(4) Excludes injection and service wells.

/T/

FIRST QUARTER 2017 HIGHLIGHTS

/T/

— Achieved another quarterly production record with average production of

22,755 boe/d (92% oil), an increase of 38% over the comparable period in
2016. This represents a 29% production per share increase from the
comparable period of 2016.
— The Company’s capital expenditures were $112.7 million inclusive of $25
million on waterflood initiatives, $6 million on land and $81.7 million
of development capital resulting in the drilling of 94.5 net Viking
horizontal wells at a 99% success rate.
— Achieved record funds flow from operations (“FFO”) of $72.8 million
($0.31/share basic), an increase of 143% from the first quarter of 2016.
— Generated first quarter net earnings of $15.3 million, an increase of
295% from the first quarter 2016.
— The Company generated field operating netbacks of $37.53/boe and funds
flow netbacks of $35.53/boe.
— Continued diligent cost control with top decile general and
administrative costs of $1.02/boe, a reduction of 19% from the
comparable period in 2016.
— Maintained balance sheet strength with first quarter exit net debt of
$249.5 million representing 0.9 times debt to the first quarter
annualized FFO.

/T/

REAFFIRMS CREDIT FACILITIES

Raging River’s borrowing base was reviewed and we are pleased to announce that
the syndicate of lenders underwriting the Company’s credit facilities have
unanimously reaffirmed the borrowing base at $400 million, on similar terms.
The next borrowing base redetermination is scheduled for October 2017.

UPDATED 2017 GUIDANCE

The board of directors have approved an updated capital budget of $340 million,
an increase of 10% from the previously approved $310 million budget. The
continued strength of the balance sheet has given the Company the flexibility
to increase the budget to fund several key initiatives including:

/T/

— $10 million of incremental capital to fund water handling facilities in

our Gleneath and Eureka areas. The result of these expenditures are
expected to reduce corporate operating costs in 2018 and beyond by an
estimated $0.40/boe.
— $10 million of incremental capital for new play development. These funds
will be primarily allocated towards incremental undeveloped land
acquisitions.
— $10 million of incremental developmental capital resulting in increased
2017 average production guidance to 22,750 boe/d from 22,500 boe/d.

/T/

OPERATIONS UPDATE

Break-up conditions to date have been normal. Three of 31 drilled but
uncompleted wells were completed in mid-April and are currently on-stream. We
anticipate that completion activities on the remaining drilled but uncompleted
wells will begin around May 15th. Raging River’s four operated drilling rigs
are expected to commence operations prior to June 1st.

With limited new production additions not expected until late in the second
quarter of 2017, we estimate that the second quarter production levels will be
approximately 3% lower than first quarter production levels with significant
growth in the second half of 2017.

Extended reach horizontal (“ERH”) well results continue to be strong. To date,
the Company has placed 73.3 net ERH wells on production with 50% of the wells
on stream for six months. Average per well results show a 1.8 to 2.0 times
improvement over the comparable offsetting short lateral wells. As a result of
the ERH success, we continue to optimize our drilling program and expect that
50% of the remaining wells drilled in 2017 will now be ERH wells.

OUTLOOK

Raging River has successfully adjusted for the new paradigm in long term WTI
crude oil prices of approximately US$50/bbl. From January 2015 through to March
2017, WTI crude oil prices have averaged US$46.70/bbl. During this period of
time Raging River has:

/T/

— Increased production per share by 45%.
— Increased FFO per share by 85%.
— Increased the economic drilling inventory to greater than 3,000

horizontal locations.
— Maintained net debt/FFO at approximately 0.9 times.

/T/

Although the equity markets have not been kind to most western Canadian energy
companies in the first quarter of 2017, including Raging River, we are
committed to our continued track record of sustainable per share production,
earnings and reserves growth while maintaining a pristine balance sheet.

Additional corporate information can be found in our corporate presentation on
our website at www.rrexploration.com.

FORWARD LOOKING STATEMENTS: This press release contains forward-looking
statements. More particularly, this press release contains statements
concerning the anticipated timing associated with certain drilling and
completion activities, anticipated number of wells to be drilled throughout the
balance of the year, anticipated second quarter 2017 production levels,
anticipated growth in production in the second half of 2017, the expected
initiatives to be funded with the increased 2017 capital budget, the expected
impact on operating costs in 2018 from certain facilities and projects,
expectation of full year 2017 production guidance based on the Company’s
revised capital budget, expectation of percentage of ERH wells to be drilled in
2017, anticipated future drilling locations and Raging River’s intent to
continue its track record of sustainable per share production, earnings and
reserves growth while maintaining a pristine balance sheet. In addition, the
use of any of the words “guidance”, “initial, “scheduled”, “can”, “will”,
“prior to”, “estimate”, “anticipate”, “believe”, “potential”, “should”,
“unaudited”, “forecast”, “future”, “continue”, “may”, “expect”, “project”, and
similar expressions are intended to identify forward-looking statements. The
forward-looking statements contained herein are based on certain key
expectations and assumptions made by the Company, including but not limited to
expectations and assumptions concerning the success of optimization and
efficiency improvement projects, the availability of capital, current
legislation, receipt of required regulatory approval, the success of future
drilling and development activities, the performance of existing wells, the
performance of new wells, Raging River’s growth strategy, general economic
conditions, availability of required equipment and services and prevailing
commodity prices.

Although the Company believes that the expectations and assumptions on which
the forward-looking statements are based are reasonable, undue reliance should
not be placed on the forward-looking statements because the Company can give no
assurance that they will prove to be correct. Since forward-looking statements
address future events and conditions, by their very nature they involve
inherent risks and uncertainties. Actual results could differ materially from
those currently anticipated due to a number of factors and risks. These
include, but are not limited to, risks associated with the oil and gas industry
in general (e.g., operational risks in development, exploration and production;
delays or changes in plans with respect to exploration or development projects
or capital expenditures; as the uncertainty of reserve estimates; the
uncertainty of estimates and projections relating to production, costs and
expenses, and health, safety and environmental risks), commodity price and
exchange rate fluctuations, changes in legislation affecting the oil and gas
industry and uncertainties resulting from potential delays or changes in plans
with respect to exploration or development projects or capital expenditures.
Refer to Raging River’s most recent Annual Information Form dated March 6,
2017, on Sedar at www.sedar.com, and the risk factors contained therein.

The forward-looking statements contained in this press release are made as of
the date hereof and the Company undertakes no obligation to update publicly or
revise any forward-looking statements or information, whether as a result of
new information, future events or otherwise, unless so required by applicable
securities laws.

NON-IFRS MEASURES: This document contains the terms “funds flow from
operations” (or “cash flow”), “net debt”, “field netback”, “operating netback”
and “funds flow netback”, which do not have a standardized meaning prescribed
by International Financial Reporting Standards (“IFRS”) and therefore may not
be comparable with the calculation of similar measures by other companies.
Management uses funds flow from operations to analyze operating performance and
leverage. Management believes “net debt” is a useful supplemental measure of
the total amount of current and long-term debt of the Company. Mark-to-market
risk management contracts are excluded from the net debt calculation.
Management believes “field netback”, “operating netback” and “funds flow
netback” are useful supplemental measures of firstly, the amount of revenues
received after royalties and operating and transportation costs, secondly, the
amount of revenues received after royalties, operating, transportation costs
and realized gain (loss) on derivatives, and thirdly, the amount of revenues
received after royalties, operating, transportation costs, realized gain (loss)
on derivatives, general and administrative costs, financial charges and asset
retirement obligations. Additional information relating to certain of these
non-IFRS measures, including the reconciliation between funds from operations
and cash flow from operating activities, can be found in the MD&A.

BARRELS OF OIL EQUIVALENT: The term “boe” or barrels of oil equivalent may be
misleading, particularly if used in isolation. A boe conversion ratio of six
thousand cubic feet of natural gas to one barrel of oil equivalent (6 Mcf: 1
bbl) is based on an energy equivalency conversion method primarily applicable
at the burner tip and does not represent a value equivalency at the wellhead.
Additionally, given that the value ratio based on the current price of crude
oil, as compared to natural gas, is significantly different from the energy
equivalency of 6:1; utilizing a conversion ratio of 6:1 may be misleading as an
indication of value.

CAUTION RESPECTING DRILLING LOCATIONS: This press release discloses drilling
locations in three categories: (i) proved locations; (ii) probable locations;
and (iii) unbooked locations. Proved locations and probable locations are
derived from the Company’s most recent independent reserves evaluation as
prepared by Sproule as of December 31, 2016 and account for drilling locations
that have associated proved and/or probable reserves, as applicable. Unbooked
locations are internal estimates based on the Company’s prospective acreage and
an assumption as to the number of wells that can be drilled per section based
on industry practice and internal review. Unbooked locations do not have
attributed reserves or resources. Of the 3,153 drilling locations of the
Company identified herein, 1,104 are proved locations, 75 are probable
locations and 1,974 are unbooked locations. Unbooked locations have been
identified by management as an estimation of our multi-year drilling activities
based on evaluation of applicable geologic, seismic, engineering, production
and reserves information. In Raging River’s most recent Annual Information Form
dated March 6, 2017 the Company had disclosed that it had 3,600 future drilling
locations as at December 31, 2016; this number has been reduced as a result of
drilling on Raging River’s properties since December 31, 2016 and due to the
Company expecting to drill more ERH wells in its future development plans (the
Company expects that fewer ERH wells are required than short lateral wells to
recover the same resources). There is no certainty that the Company will drill
all unbooked drilling locations and if drilled there is no certainty that such
locations will result in additional oil and gas reserves, resources or
production. The drilling locations on which we actually drill wells will
ultimately depend upon the availability of capital, regulatory approvals,
seasonal restrictions, oil and natural gas prices, costs, actual drilling
results, additional reservoir information that is obtained and other factors.
While certain of the unbooked drilling locations have been derisked by drilling
existing wells in relative close proximity to such unbooked drilling locations,
the majority of other unbooked drilling locations are farther away from
existing wells where management has less information about the characteristics
of the reservoir and therefore there is more uncertainty whether wells will be
drilled in such locations and if drilled there is more uncertainty that such
wells will result in additional oil and gas reserves, resources or production.

INITIAL RATES OF PRODUCTION: References in this press release to performance
and production rates associated with ERH wells are useful in confirming the
presence of hydrocarbons, however such rates are not determinative of: the
future production and decline rates of such ERH wells, the rates other ERH
wells to be drilled by the Company will commence production and decline
thereafter, and are not indicative of long term performance or of ultimate
recovery. While encouraging, readers are cautioned not to place reliance on
such rates in calculating the aggregate production for the Company. The Company
cautions that such production rates should be considered to be preliminary.

– END RELEASE – 08/05/2017

For further information:
Raging River Exploration Inc.
Mr. Neil Roszell
President and Chief Executive Officer
403-767-1250
403-387-2951 (FAX)
OR
Raging River Exploration Inc.
Mr. Jerry Sapieha, CA
Vice President, Finance and Chief Financial Officer
403-767-1265
403-387-2951 (FAX)
www.rrexploration.com

COMPANY:
FOR: RAGING RIVER EXPLORATION INC.
TSX SYMBOL: RRX

INDUSTRY: Energy and Utilities – Oil and Gas
RELEASE ID: 20170508CC0111

Press Release from Marketwired 1-866-736-3779

All press releases are written by the client and have NO affiliation with the news copy written by The Canadian Press. Any questions that arise due to the content or information provided in the press release should be directed to the company/organization
issuing the release, not to The Canadian Press.

GET ENERGYNOW’S DAILY EMAIL FOR FREE


Liquor Stores N.A. Ltd. Reports First Quarter 2017 Results

FOR: LIQUOR STORES N.A. LTD.TSX SYMBOL: LIQDate issue: May 08, 2017Time in: 6:52 PM eAttention:
Investor Conference Call on May 9, 2017 at 7.30 A.M. MT
EDMONTON, ALBERTA–(Marketwired – May 8, 2017) – Liquor Stores N.A. Ltd. (the
“Company” or “Liquor …

GET ENERGYNOW’S DAILY EMAIL FOR FREE


Crew Energy Inc. Announces First Quarter 2017 Financial and Operating Results, Updated Montney Resource Evaluation and Non-Core Asset Disposition – Part 1

FOR: CREW ENERGY INC.
TSX SYMBOL: CR

Date issue: May 08, 2017
Time in: 5:50 PM e

Attention:

CALGARY, ALBERTA–(Marketwired – May 8, 2017) – Crew Energy Inc. (TSX:CR)
(“Crew” or the “Company”) is pleased to announce our operating and financial
results for the three month period ended March 31, 2017, along with an updated
independent Montney Resource Evaluation. Our Financial Statements and Notes, as
well as Management’s Discussion and Analysis (“MD&A”) for the three month
period ended March 31, 2017 are available on Crew’s website and filed on SEDAR.

Q1 HIGHLIGHTS

/T/

— Production for the quarter averaged 23,231 boe per day, 4% higher than

the previous quarter primarily attributable to an 8% increase in
liquids-rich natural gas production from northeast British Columbia (“NE
BC”).

— Funds from operations totaled $27.7 million in the first quarter, more

than double the same period in 2016, and increased 125% on a per share
basis to $0.18 per share from $0.08 per share in Q1 2016.

— Benchmark prices increased for all products resulting in stronger

revenues, while our continued focus on cost control contributed to
operating netbacks that averaged $17.16 per boe compared to $9.13 per
boe in the first quarter of 2016.

— At our liquids-rich Septimus and West Septimus (“Greater Septimus”)

area, operating costs were 25% lower than Q1 2016 at $3.34 per boe while
transportation costs were 24% lower at $1.67 per boe, contributing to an
operating netback of $19.41 per boe.

— Crew closed a $300 million senior debt financing in March, 2017 and

exited the quarter undrawn on our re-confirmed $235 million bank credit
facility, affording the Company ample financial flexibility to execute
on our longer-term, Montney-focused development strategy.

— In NE BC, drilled 11 wells and completed five wells, and at

Lloydminster, drilled four wells and completed two wells, and currently
have an inventory of 20 drilled and uncompleted wells, 18 of which are
in Greater Septimus and Groundbirch.

— Continued the advancement of Crew’s Montney development plan with site

work on the West Septimus facility expansion to 120 mmcf per day and the
acquisition of 10 contiguous sections of surface rights that will
accommodate the planned Groundbirch facility and the drilling of a
minimum of 150 wells.

— Subsequent to the end of the quarter, we entered into an Agreement of

Purchase and Sale for the disposition of non-core assets in the Goose
area of NE BC comprised of approximately 18,400 net acres of undeveloped
land with no production or assigned reserves for $49 million (subject to
certain closing adjustments and costs). The transaction is expected to
close prior to the end of the second quarter, subject to customary
closing conditions.

— Updated Crew’s independent Montney Resource Evaluation which reflected a

2% increase to the risked Best Estimate Economic Contingent Resource
(“ECR”) assessment to 9.2 TCFE and a modest increase to the Total
Petroleum Initially In Place (“TPIIP”) estimate to 112.2 TCFE (prior to
the Goose disposition). Continued annual increases in our resource
estimate demonstrates the value in Crew’s ongoing Montney-focused
drilling and development strategy to realize significant long-term value
through reserves additions from this massive resource.

FINANCIAL & OPERATING HIGHLIGHTS:

—————————————————————————
—————————————————————————

Three months Three months
FINANCIAL ended ended
($ thousands, except per share amounts) March 31, 2017 March 31, 2016
—————————————————————————
Petroleum and natural gas sales 57,298 36,343
Funds from operations(1) 27,719 11,714
Per share
– basic 0.19 0.08
– diluted 0.18 0.08
Net income /(loss) 8,056 (6,795)
Per share
– basic 0.05 (0.05)
– diluted 0.05 (0.05)

Exploration and Development expenditures 75,164 17,763
Property acquisitions (net of dispositions) (352) 956
——————————-
Net capital expenditures 74,812 18,719

—————————————————————————
—————————————————————————
Capital Structure As at As at
($ thousands) March 31, 2017 Dec. 31, 2016
—————————————————————————
Working capital deficiency(2) 8,588 10,006
Bank loan – 88,036
——————————-
8,588 98,042
Senior Unsecured Notes 293,046 147,329
——————————-
Total Net Debt 301,634 245,371
Current Debt Capacity(3) 535,000 385,000
Common Shares Outstanding (thousands) 147,127 146,812
—————————————————————————
—————————————————————————
Notes:
(1) Funds from operations is calculated as cash provided by operating
activities, adding the change in non-cash working capital,
decommissioning obligation expenditures and accretion of deferred
financing costs. Funds from operations is used to analyze the
Company’s operating performance and leverage. Funds from operations
does not have a standardized measure prescribed by International
Financial Reporting Standards and therefore may not be comparable with
the calculations of similar measures for other companies. See “Non-
IFRS Measures” contained within Crew’s MD&A.
(2) Working capital deficiency includes cash and cash equivalents plus
accounts receivable less accounts payable and accrued liabilities.
(3) Current Debt Capacity reflects the newly approved bank facility of
$235 million plus $300 million in senior unsecured notes outstanding.

—————————————————————————-
—————————————————————————-

Three months Three months
ended ended
Operations March 31, 2017 March 31, 2016
—————————————————————————-
Daily production
Light crude oil (bbl/d) 530 303
Heavy crude oil (bbl/d) 1,857 2,799
Natural gas liquids (bbl/d) 3,363 3,359
Natural gas (mcf/d) 104,887 104,224
——————————–
Total (boe/d @ 6:1) 23,231 23,832
Average prices (1)
Light crude oil ($/bbl) 59.74 37.34
Heavy crude oil ($/bbl) 42.93 20.45
Natural gas liquids ($/bbl) 45.71 25.95
Natural gas ($/mcf) 3.54 2.34
Oil equivalent ($/boe) 27.40 16.76
—————————————————————————-
Notes:
(1) Average prices are before deduction of transportation costs and do not
include gains and losses on financial instruments.

—————————————————————————
—————————————————————————

Three months Three months
ended ended
March 31, 2017 March 31, 2016
—————————————————————————
Netback ($/boe)
Revenue 27.40 16.76
Realized commodity hedging gain/(loss) (0.39) 2.21
Royalties (2.18) (0.88)
Operating costs (5.38) (6.45)
Transportation costs (2.29) (2.51)
——————————-
Operating netback (1) 17.16 9.13
G&A (1.50) (1.76)
Interest on long-term debt (2.41) (1.98)
——————————-
Funds from operations 13.25 5.39

Drilling Activity

Gross wells 15 4
Working interest wells 15.0 4.0
Success rate, net wells (%) 93% 100%
—————————————————————————
—————————————————————————
Notes:
(1) Operating netback equals petroleum and natural gas sales including
realized hedging gains and losses on commodity contracts less
royalties, operating costs and transportation costs calculated on a
boe basis. Operating netback and funds from operations netback do not
have a standardized measure prescribed by International Financial
Reporting Standards and therefore may not be comparable with the
calculations of similar measures for other companies. See “Non-IFRS
Measures” contained within Crew’s MD&A.

/T/

OVERVIEW

During the first three months of 2017, activity levels increased across the
Western Canadian Sedimentary Basin in response to frozen ground conditions and
an improved commodity price environment. This resulted in a tight supply-demand
dynamic for field services, particularly reservoir stimulation. Crew was able
to complete five of a planned ten wells in the quarter and as a result
underspent our forecasted first quarter budget by deferring these operations
until after spring break up. Our production of 23,231 boe per day was at the
lower end of our guidance range for the quarter and is reflective of these
service delays. Work on the expansion of our West Septimus facility to double
throughput capacity continued in the quarter, and is currently ahead of
schedule, with commissioning of the expanded facility currently planned for the
fourth quarter of 2017.

We continued to move forward on Crew’s long term growth plan by successfully
closing a $300 million senior note financing, which has a 6.5% coupon and a
term through March, 2024. This financing has positioned Crew with $535 million
of total credit capacity and enhances our ability to manage through continued
commodity price volatility for an extended period. Upon the closing of this
financing, we repaid the balance on our $235 million credit facility, resulting
in an undrawn bank facility, and after the end of the quarter, the credit
facility was approved for extension at the same level. Subsequent to quarter
end, we entered into an agreement to dispose of our non-core Goose property in
NE BC for proceeds of approximately $49 million. Upon closing, which is
expected prior to the end of the second quarter, we will have monetized a
portion of our asset base that was not within Crew’s long-term development
horizon.

MONTNEY RESOURCE EVALUATION UPDATE

Crew is pleased to report the results of its annual updated independent Montney
resource evaluation conducted by Sproule Associates Ltd. (“Sproule”) on our
principal NE BC Montney lands including Septimus, West Septimus, Groundbirch /
Monias, Attachie and Tower as well as other minor NE BC Montney lands,
effective December 31, 2016 (the “Resource Evaluation”). Sproule performed
detailed mapping across the evaluated areas which included section by section
estimates of reservoir parameters, such as pressure, temperature, porosity, and
water saturation, which make up the TPIIP determination. At 112.2 TCFE, Crew’s
TPIIP estimate provides the Company with significant opportunities to continue
increasing the current ECR estimates plus add reserves with further drilling.
Crew’s risked best estimate ECR on natural gas increased 3% to 7.7 Tcf, natural
gas liquids (“ngl”) risked best estimate ECR was 1% higher at 227 million
barrels, while our crude oil risked best estimate ECR decreased by 2 million
bbls to 21 million bbls. All numbers referenced from the Resource Evaluation
are prior to the pending disposition of Crew’s Goose asset.

The updated Resource Evaluation demonstrates the significant potential of our
lands, offering multiple years of future running room and significant value
creation opportunities. Although the play remains in its early stages of
development, with new and enhanced drilling and completions techniques, Crew
and other area operators continue to further delineate and de-risk the
potential of this massive play and demonstrate results from the Montney that
continue to improve.

FINANCIAL

Crew’s first quarter funds from operations of $27.7 million was consistent with
the previous quarter but 137% higher than the first quarter of 2016, reflecting
stronger year over year commodity prices, and operating and transportation
costs that were 17% and 9% lower, respectively. We continue to see compelling
returns from Greater Septimus, where our first quarter operating netback from
the area was $19.41 per boe compared to $17.16 per boe corporately, reflecting
the strong economics and returns generated in our core Montney operating areas.

Crew’s realized light oil price improved by 60% in the first quarter of 2017
over the first quarter of 2016, while our heavy oil price increased 110% and
our ngl prices were 76% higher than the same period in 2016. Improved first
quarter oil and ngl prices were the result of improved world oil prices
prompted by OPEC’s (Organization of Petroleum Exporting Countries) decision to
limit production in the first half of 2017 in order to reduce global
inventories. This action stabilized world oil prices late in 2016 resulting in
a 50% improvement in Crew’s Canadian dollar denominated WTI benchmark price.
Higher oil prices also supported stronger demand and pricing for the
condensate, propane and butane that make up Crew’s ngl mix. Crew’s realized
natural gas price increased 51% over Q1 of 2016 as a result of stronger North
American natural gas prices. Natural gas prices were supported by lower supply
related to reduced capital investment and lower inventories resulting from
warmer 2016 summer weather, liquefied natural gas exports from the U.S. gulf
coast and increased U.S. exports to Mexico.

First quarter 2017 capital expenditures totaled $75 million which included the
drilling of eleven Montney wells and four heavy oil wells. Operations during
the quarter also included the completion of five Montney wells and two heavy
oil wells. Drilling and completion expenditures for the quarter were $10
million lower than budgeted as a lack of available completion services
restricted the first quarter program to five of a planned ten Montney
completions. During the quarter we also continued with the expansion of our
West Septimus facility from 60 mmcf per day to 120 mmcf per day. Major
equipment fabrication was ahead of schedule resulting in $14.1 million charged
to the expansion which represents an additional $5 million of capital accrual
towards the project in the quarter.

GET ENERGYNOW’S DAILY EMAIL FOR FREE


Crew Energy Inc. Announces First Quarter 2017 Financial and Operating Results, Updated Montney Resource Evaluation and Non-Core Asset Disposition – Part 2

Consistent with our efforts to maintain a strong balance sheet, control costs,
and ensure liquidity to execute our strategy, on May 1, 2017 Crew entered into
a new arrangement resulting in the replacement of one of the partners in our
Septimus Gas Processing Complex (comprised of the Septimus and West Septimus
facilities). This new arrangement will not impact Crew’s current 28% ownership
or operatorship of the complex, while the other remaining partner retains a 22%
ownership and the new partner a 50% ownership. This change to the arrangement
will save the Company approximately $1 million per year on processing costs
associated with the current complex further reducing overall Greater Septimus
operating costs. As part of this arrangement, the new partner has agreed to
fund 50% of the current West Septimus facility expansion. Crew has retained the
option to buy both partners’ interest in these facilities at future dates.

On March 14, 2017, Crew closed an offering of $300 million aggregate principal
amount of 6.5% senior unsecured notes due March 14, 2024. Proceeds from the
note offering were partially used to redeem Crew’s $150 million, 8.375% senior
unsecured notes due 2020, with the excess proceeds used to repay indebtedness
under our credit facility and for the continued development of our Montney
assets. Successful completion of this offering enhances Crew’s liquidity and
financial flexibility. Total net debt at the end of the quarter was $301.6
million, including working capital deficiency and our new $300 million ($293.0
million net of deferred financing costs) 6.5% senior unsecured notes that have
a seven year term with repayment due in March of 2024. The Company also
recently completed our annual bank facility review with the facility renewed at
the same level of $235 million. The pending disposition of our non-core Goose
asset will further contribute to our flexibility and add cash to our balance
sheet.

TRANSPORTATION, MARKETING & HEDGING

Crew’s realized natural gas price has outperformed the benchmark indices for
the last six quarters, which demonstrates the value of our active marketing and
hedging program, diversified sales markets as well as the 19% higher heat
content of our natural gas over industry standards. One of the many advantages
of our Montney land base is that we are situated with access to all three major
export pipeline systems which provides substantial market and operational
optionality. During the first quarter, our natural gas sales portfolio was
allocated 45% to Chicago City Gate, 26% to AECO, 19% to Alliance ATP and 10% to
Station 2. Crew will continue to plan for processing and transportation
diversification that is timed to coincide with our longer term growth strategy,
and afford us the ability to access new markets. Our transportation arrangement
on the Spectra pipeline increased from 13 mmcf per day to 30 mmcf per day
effective April 1, 2017. In the second quarter of 2018, we also secured 60 mmcf
per day of capacity on the TransCanada pipeline system (“TCPL”), affording
improved market diversity for natural gas from our Greater Septimus and
Groundbirch areas. In mid-2019, we have also secured an additional 60 mmcf per
day of firm capacity on the TCPL system.

In the interests of managing our commodity price risk and exposure, Crew
continued to systematically add 2017 and 2018 hedges during the first quarter.
For the balance of 2017, Crew’s total natural gas hedged position is
approximately 50% of our forecast 2017 gas sales at a transportation-adjusted
equivalent price of $2.92 per gj, which when adjusting for the higher heat
content of Crew’s gas, equates to $3.62 per mcf. For liquids, we have
approximately 50% of our 2017 light oil and natural gas liquids sales hedged at
an average price of CDN$68.17 per bbl.

OPERATIONS

NE BC Montney – Greater Septimus Overview

During the first quarter, Crew continued to focus on drilling and completions
activities primarily at our Greater Septimus area, while advancing our West
Septimus facility expansion. We directed the majority of our first quarter
capital to our Greater Septimus, including $14.1 million allocated to the
doubling of our West Septimus processing facility from 60 mmcf per day to 120
mmcf per day. In addition, Crew drilled ten (10.0 net) Montney wells and
completed three (3.0 net) Montney wells of our budgeted eight well Greater
Septimus completions program in the quarter.

Crew continued to see efficiency improvements in the first quarter as the first
five wells drilled off the 4-22 pad achieved a record low average 12.6 drilling
days per well at an average well cost of $1.5 million, contributing to strong
capital efficiencies and supporting returns. Following up on the success of our
first two ultra condensate-rich wells, we spud the first well on a six well pad
directly offsetting the 7-30 wells which continue to exceed expectations.

Late in 2016, industry activity increased significantly in NE BC, particularly
the demand for reservoir stimulation services. All industry participants,
including Crew, have been subject to scheduling challenges with service
companies. The delays Crew experienced with completions in turn delayed new
production volumes coming on-stream in the quarter. These delays reduced
capital expenditures for completions by approximately $10 million in Q1
relative to our budget, which were partially offset by the West Septimus
facility expansion running ahead of schedule.

Crew’s geographic location in the Montney has typically provided year round
access to conduct our drilling and completions operations, or at worst,
resulted in modest delays during spring break-up. For the first time in Crew’s
operational history in the Montney, we were forced to completely shut down
these activities in the middle of April. This year’s spring break up was a
‘perfect storm’ of an initial spring thaw, complicated by a significant period
of cool, snowy weather which led to extremely poor road conditions and
resultant road bans. Given the circumstances, and an emphasis on prioritizing
our capital efficiencies, Crew has adjusted our operational plan to incorporate
an extended spring break-up period during which no drilling or completions
activity will be undertaken until June. Crew currently has three drilling rigs
sitting on Crew leases, a significant inventory of 18 wells drilled and
uncompleted in NE BC and has made arrangements to secure necessary equipment
and services to complete the wells once access to our well sites is available.

Greater Septimus

/T/

—————————————————————————
—————————————————————————

Q1 Q4 Q3 Q2 Q1
Production & Drilling 2017 2016 2016 2016 2016
—————————————————————————
Average Daily
Production (boe/d) 17,440 17,307 18,592 17,131 18,149
Wells drilled (gross /
net) 10 / 10.0 8 / 7.7 8 / 7.0 – 4 / 4.0
Wells completed 3 5 7 7 3
—————————————————————————

—————————————————————————
—————————————————————————
Operating Netback Q1 Q4 Q3 Q2 Q1
($ per boe) 2017 2016 2016 2016 2016
—————————————————————————
Revenue 26.49 25.10 20.56 16.06 16.69
Royalties (1.66) (1.47) (0.94) (0.69) (0.79)
Realized commodity
hedge (loss)/gain (0.41) (0.39) 1.11 3.24 1.34
Operating costs (3.34) (3.34) (3.61) (4.02) (4.43)
Transportation costs (1.67) (1.68) (1.59) (1.97) (2.21)
—————————————————————————
Operating netback 19.41 18.22 15.53 12.62 10.60
—————————————————————————

/T/

First quarter production at Greater Septimus averaged 17,440 boe per day,
representing approximately 76% of the Company’s total production volumes.
Greater Septimus operating netbacks of $19.41 per boe were the highest in the
past five quarters, due to increased revenue, and supported by low operating
costs of $3.34 per boe and $1.67 per boe transportation costs, which have been
kept stable despite inflationary pressures as industry activity levels
increase.

Crew’s ultra condensate-rich area is the Company’s new focus for development at
Greater Septimus. Results from area wells at the 7-30 pad are compelling in the
current environment, including C7-30 which has produced 70,000 bbls of
condensate in 220 days on production with an average condensate gas ratio
(“CGR”) of 187 bbls per mmcf, and B7-30 which has produced 40,000 bbls of
condensate over 165 days with an average CGR of 133 bbls per mmcf.

Three new well completions at Septimus in late 2016 have resulted in record
well performance at an all-in average well cost of $3.8 million. Over a 123 day
period, the wells each produced 0.8 bcf of natural gas with a well head
condensate yield of 19 bbls per mmcf and have continued to produce at a current
average rate of 4.7 mmcf per day per well.

NE BC Montney – Groundbirch overview

Crew spud the first of two delineation wells at Groundbirch that will employ
the latest completion technology as part of further delineating our significant
Groundbirch resource (which represents 18.7 TCFE of TPIIP in our Resource
Evaluation) and in preparation for development drilling in 2018 as part of our
long-term growth plan. The Company also acquired ownership of 10 sections of
surface rights at Groundbirch on which we have planned the construction of a
gas plant and associated Montney development of a minimum of 150 wells.
Ownership is expected to reduce surface lease costs, improve access and timing
of operations, provide access to a major rail line for potential trans-load
capability in addition to providing access to proprietary gravel for lease and
road maintenance and construction.

NE BC Montney – Tower overview

Crew’s Montney Tower area continues to represent significant future development
opportunity for the Company as crude oil prices strengthen. We realized
increased oil production at Tower in Q1 as a result of successfully completing
two light oil wells in the fourth quarter of 2016 and two light oil wells in
the first quarter of 2017. These four wells were drilled in 2014 prior to the
collapse in oil prices, and were designed to be completed using plug and perf
technology, which has been the predominant completion technique within the
light oil window of the Montney relative to the then available open-hole
completion technology. The first two wells have been on production for 60 and
80 days at average rates of 365 and 600 boe per day, with 53% and 64% liquids,
respectively. The second two wells were completed late in the first quarter and
achieved average rates of 445 and 520 boe per day, with 55% and 58% liquids
over 35 and 60 days, respectively. In both sets of wells, the stronger of the
two was placed in Crew’s “Upper B” interval of the upper Montney while the
other two wells tested the deeper Montney “C” stratigraphic interval of the
upper Montney. All four wells presently flow without the aid of artificial
lift. Crew has also undertaken the first stage of facility modifications to
install gas lift which we believe will allow us to further optimize fluid
production rates from these wells.

Lloydminster, AB/SK overview

At Lloydminster, Crew drilled four (4.0 net) oil wells including two dual-leg
horizontal wells, completed two (2.0 net) wells and recompleted four (3.5 net)
oil wells in the quarter. Production at our Lloydminster heavy oil property
averaged 1,865 boe per day in the first quarter of 2017 which reflects minimal
impact from the drilling and completion operations, and is part of the
Company’s plan to maintain heavy oil production in the range of 2,000 boe per
day. The two completions were vertical wells in the Swimming area (Sparky
formation) and the Wildmere area (Colony formation). The wells were placed on
production in early March and by mid-April were producing at a combined average
rate of 220 bbls of oil per day. Crew’s two dual leg horizontal wells also
located in the Swimming area are expected to be completed when road ban
restrictions are removed.

OUTLOOK

Crew has assembled a sizeable and uniquely situated land base of 474 net
sections (prior to the impact of the pending Goose disposition) which offers
exposure to condensate-rich natural gas and light oil. The intrinsic value of
Crew’s acreage coupled with owned and operated facilities and infrastructure,
firm transportation arrangements, a diversified marketing strategy, a strong
balance sheet and a returns-focused strategy provide the foundation for
long-term profitable growth and value creation. Under our current plan, we
expect to exit 2017 in a strong financial position with an estimated debt to
annualized fourth quarter 2017 funds from operations ratio of 1.5 times. Given
these strengths, we believe our share price does not always reflect the
underlying value of Crew’s assets and as such, the Company intends to apply to
implement a normal course issuer bid (“NCIB”) through the facilities of the
Toronto Stock Exchange (the “TSX”) and alternative Canadian trading platforms,
pursuant to which Crew would have the ability to repurchase, from time to time,
our outstanding shares for cancellation. This NCIB is expected to commence
later in May following application being made to, and approved by, the TSX and
will terminate one year later.

Exiting the first quarter, Crew has an inventory of 18 drilled but uncompleted
wells that we intend to complete in order to bring on new volumes, and will
continue to time our completions to ensure new volumes come on-stream with the
commissioning of our West Septimus facility expansion. In the interests of
creating value for our shareholders, we remain focused on return-on-capital in
the development of our assets. Crew’s activity levels can be scaled back in a
weak market to preserve our valuable reserves. We believe in the potential of
our Montney assets, and are excited by the results from the ultra
condensate-rich area which offers attractive economics in the current
environment. Additional improvements in well results will be pursued through
enhanced completions, while striving to improve operational efficiencies. With
stronger financial liquidity, proceeds from the pending sale of Goose and the
$300 million note offering, we are well positioned to continue executing our
Montney focused strategy over the near and longer-term.

We have revised our capital planning based on the previously referenced delays,
with our projected second quarter capital program reduced by approximately $30
million to between $25 and $35 million. Production additions will be heavily
weighted to the fourth quarter, concurrent with the commissioning of our West
Septimus plant expansion. Also, during the second quarter of 2017, the
third-party McMahon gas processing facility will be shut down for an estimated
21 days, which will impact Crew’s volumes by approximately 900 boe per day in
the second quarter. This shut down, combined with the production delays caused
by the extended spring break-up, results in second quarter 2017 production
estimates of approximately 20,000 to 21,000 boe per day. We anticipate that Q3
and Q4 2017 production will average between 24,500 to 26,500 boe per day, and
29,500 to 31,500 boe per day, respectively, spending approximately $100 million
in the last half of 2017. Accordingly, our 2017 annual production guidance is
reduced by 4% to 24,000 to 26,000 boe per day, with a positive impact to our
forecast 2017 exit rate, which is increasing to over 31,000 boe per day while
our $200 million capital budget remains unchanged.

We are very pleased to have secured additional financial flexibility, and have
a high-quality asset base that only continues to improve with time and
technology. We would like to thank our employees and Board of Directors for
their commitment to Crew, and our shareholders for their ongoing support
through ongoing market challenges.

A summary of Crew’s operational and financial highlights are as follows:

/T/

—————————————————————————-
2017 Average production(1) 24,000 – 26,000 boe/d
—————————————————————————-
2017 Exit production(1) greater than 31,000 boe/d
—————————————————————————-
Total proved + probable reserves(2) 324 MMboe
—————————————————————————-
Total proved + probable BT NPV10(2) $2 billion
—————————————————————————-
Resource TPIIP(3) 112.2 TCFE
—————————————————————————-
Montney potential drilling
locations(4) 5,782
—————————————————————————-
2017 Capital program(1) $200 MM
—————————————————————————-
Net debt(5) $301.6 MM
—————————————————————————-
Exit 2017 net debt / funds from
operations(1) approx. 1.5x
—————————————————————————-
Basic shares outstanding(5) 147.1 MM
—————————————————————————-
Tax pools(5) approx. $1 billion
—————————————————————————-
(1) Forecast. See “Forward Looking Information and Statements”
(2) Reserves included herein are stated on a company gross basis (working
interest before deduction of royalties without including any royalty
interests). Information presented herein in respect of reserves and related
information is based on our independent reserves evaluation for the year
ended December 31, 2016 prepared by Sproule Associates Limited (“Sproule”)
details of which were provided in our press release issued on February 9,
2017.
(3) As per the Resource Evaluation as at December 31, 2016 prepared by
Sproule in accordance with the NI 51-101 and current COGE Handbook
guidelines
(4) Potential drilling locations are the total number of risked Contingent
(2,071) and Prospective (3,355) resource locations as identified in Crew’s
year end independent Resource Evaluation plus the 2P booked locations (356)
as identified in the independent reserves evaluation for the year ended
December 31, 2016, both of which were prepared in accordance with the COGE
Handbook provisions and NI 51-101
(5) As at March 31, 2017

/T/

GET ENERGYNOW’S DAILY EMAIL FOR FREE


Crew Energy Inc. Announces First Quarter 2017 Financial and Operating Results, Updated Montney Resource Evaluation and Non-Core Asset Disposition – Part 3

DECEMBER 31, 2016 RESOURCE EVALUATION

The following discussion in “Crew Northeast British Columbia Montney Resource
Evaluation” is subject to a number of cautionary statements, assumptions and
risks as set forth therein. See “Information Regarding Disclosure on Oil and
Gas Reserves, Resources and Operational Information” at the end of this release
for additional cautionary language, explanations and discussion, and see
“Forward-looking Information and Statements” for a statement of principal
assumptions and risks that may apply. See also “Definitions of Oil and Gas
Resources and Reserves” in this news release. The discussion includes reference
to TPIIP, DPIIP and ECR as per the Resource Evaluation as at December 31, 2016,
prepared in accordance with the NI 51-101 and current COGE Handbook guidelines.
Unless otherwise indicated in this news release, all references to ECR and
prospective volumes are Best Estimate ECR and Best Estimate prospective
volumes, respectively. All information referenced in the Resource Evaluation is
prior to the pending disposition of Crew’s Goose area, expected to close in the
second quarter of 2017.

In accordance with NI 51-101 Crew’s contingent resources have been
subclassified into specified project maturity subclasses. Those that apply to
Crew’s resources include “development pending”, “development on hold”, and
“development not viable”. Sproule considers the ‘development pending’ and
‘development on hold’ project maturity subclasses to be economic and are
therefore included in ECR. The economic status of the ‘development not viable’
project maturity subclass is undetermined and is therefore not included in the
ECR reported. The “development not viable” sub-classification represented less
than 2% of the sum of all three sub-classifications on a BOE basis, and
accordingly, has not been considered to be material for reporting purposes.
Crew does not have any resources within the “development unclarified” subclass.

CREW NORTHEAST BRITISH COLUMBIA MONTNEY RESOURCE EVALUATION

The Montney formation in NE BC has been identified as a world-class
unconventional resource play with the potential for significant volumes of
recoverable resources. The area includes dry gas, liquids-rich gas and light
oil development opportunities, with Crew having access to all three hydrocarbon
windows. It is one of the largest and lowest cost liquids-rich natural gas
resource plays in North America and Crew’s land base comprises 300,000 net
acres, ideally situated in some of the most prospective parts of the play, with
good access to infrastructure and multiple egress options.

Sproule was engaged to conduct an updated independent Montney resource
evaluation of Crew’s principal lands in the NE BC Montney region including
Septimus, West Septimus, Groundbirch/Monias, Attachie, Tower and other minor NE
BC Montney lands (the “Evaluated Areas”) effective as of December 31, 2016, and
based on Sproule’s forecast price deck as at December 31, 2016 (the “Resource
Evaluation”). The Resource Evaluation highlights the development potential on
the Company’s undeveloped land base providing Crew with significant
opportunities to progress conversion of Resource to ECR and ultimately to
increased reserve bookings over time. Further, the diversity of Crew’s NE BC
Montney assets with exposure to liquids-rich gas, crude oil and dry natural gas
allows us to effectively navigate through commodity price cycles.

TPIIP for the natural gas-bearing lands in the Evaluated Areas remains
unchanged relative to year end 2015 at 64.3 Tcf. Natural gas ECR was evaluated
on an unrisked and risked basis in the Resource Evaluation and was subdivided
into the Maturity Subclasses of ‘development pending’ and ‘development on
hold’. The risked ‘development pending’ natural gas ECR totaled 7.3 Tcf and the
risked ‘development on hold’ ECR totaled 0.43 Tcf, which includes 104 bcf of
‘development pending’ natural gas and 26 bcf of ‘development on hold’ natural
gas on Crew’s oil-bearing lands.

The ECR of our ngl was also evaluated on an unrisked and risked basis in the
Resource Evaluation and was subdivided into the Maturity Subclasses of
‘development pending’ and ‘development on hold’. The risked ‘development
pending’ ngl ECR totaled 211 MMbbl and risked ‘development on hold’ ngl ECR
totaled 16 MMbbl which includes 3 mmbbls of ‘development pending’ ngl and 1
mmbbls of ‘development on hold’ ngl on Crew’s oil-bearing lands.

On the oil-bearing Montney lands, TPIIP increased 1% to 7,979 MMbbl and DPIIP
increased 2% to 1,647 MMbbl. Oil ECR was evaluated on an unrisked and risked
basis in the Resource Evaluation and was subdivided into the Maturity
Subclasses of ‘development pending’ and ‘development on hold’. The risked
‘development pending’ oil ECR totaled 17 MMbbl and risked ‘development on hold’
oil ECR totaled 4 MMbbl.

Risking of the contingent resources included a quantitative assessment of the
contingencies applicable to the project including evaluation drilling,
corporate commitment and timing of production and development. Risking of the
prospective resources included a quantitative assessment of these same factors,
as well as a quantitative assessment of the chance of discovery.

The following tables summarize the results of the Resource Evaluation along
with comparatives to the December 31, 2015 evaluation using the resource
categories set out in the COGE Handbook on a “best estimate” case.

/T/

—————————————————————————-

Dec. 31, Dec. 31, %
2016 2015 Change
—————————————————————————-
Conventional Natural Gas Resource
Categories (1)(2)(3)(4)(5)(6) Tcf Tcf
Total Petroleum Initially In Place
(TPIIP) 64.3 64.3 0
Discovered Petroleum Initially In Place
(DPIIP) 35.2 35.2 0
Undiscovered Petroleum Initially In
Place (UPIIP) 29.1 29.1 0
—————————————————————————-
Notes:
(1) TPIIP, DPIIP and UPIIP have been estimated using a one percent
porosity cut-off in the Resource Evaluation, which means that
essentially all gas bearing rock has been incorporated into the
calculations.
(2) All volumes in table are Company gross and raw gas volumes.
(3) Sproule’s analysis identified four intervals in the Montney consisting
of one interval in the Upper Montney and three intervals in the Lower
Montney.
(4) Crew’s acreage was divided into five (5) areas in the “gas window”.
(5) There is uncertainty that it will be commercially viable to produce
any portion of the resources.
(6) There is no certainty that any portion of the resources will be
discovered. If discovered, there is no certainty that it will be
commercially viable to produce any portion of the resources.

—————————————————————————-

Dec. 31, Dec. 31, %
2016 2015 Change
—————————————————————————-
Light & Medium Crude Oil Resource
Categories (1)(2)(3)(4)(5)(6)(7) Mmbbls Mmbbls
Total Petroleum Initially In Place 1
(TPIIP) 7,979 7,895
Discovered Petroleum Initially In Place 2
(DPIIP) 1,647 1,613
Undiscovered Petroleum Initially In 1
Place (UPIIP) 6,332 6,282
—————————————————————————-
Notes:
(1) TPIIP, DPIIP and UPIIP have been estimated using a one percent
porosity cut-off in the Resource Evaluation, which means that
essentially all oil bearing rock has been incorporated into the
calculations.
(2) All volumes in table are Company gross.
(3) The oil volumes are quoted as Stock Tank Barrels (“STB”).
(4) Sproule’s analysis identified four intervals in the Montney consisting
of one interval in the Upper Montney and three intervals in the Lower
Montney.
(5) Crew’s acreage was divided into five (5) areas in the “oil window”.
(6) There is uncertainty that it will be commercially viable to produce
any portion of the resources.
(7) There is no certainty that any portion of the resources will be
discovered. If discovered, there is no certainty that it will be
commercially viable to produce any portion of the resources.

—————————————————————————-

Best Best
2016 Reserves and Risked and Unrisked Chance of Estimate Estimate
ECR(1)(2)(3)(6)(7)(8) Development Unrisked Risked
—————————————————————————-

Conventional Natural gas (Bcf)

Reserves (3) 100% 1,426 1,426
Development Pending ECR 87% 8,388 7,298
Development on Hold ECR 85% 500 425

NGL (Mmbbls) (4)(5)

Reserves (3) 100% 59 59
Development Pending ECR 88% 240 211
Development on Hold ECR 84% 19 16

Light & Medium Crude Oil (Mmbbls)

Reserves (3) 100% 12 12
Development Pending ECR 89% 19 17
Development on Hold ECR 80% 5 4
—————————————————————————-
Notes:
(1) All DPIIP other than cumulative production, reserves, and ECR has been
categorized as unrecoverable at this time. A portion of the
Unrecoverable DPIIP may in the future be determined to be recoverable
and reclassified as contingent resources or reserves as additional
technical studies are performed, commercial circumstances change or
technological developments occur; the remaining portion may never be
recovered due to the physical/chemical constraints represented by
subsurface interaction of fluids and reservoir rocks.
(2) All volumes in table are company gross and sales volumes. Reserves and
development pending volumes include economic cutoff.
(3) For reserves, the volumes are proved plus probable reserves as at
December 31, 2016.
(4) The liquid yields are based on average yield over the producing life
of the property.
(5) Liquid yields are unique to each area. They are estimated based on gas
composition of gas samples in the area and expected plant recoveries.
(6) There is no certainty that it will be commercially viable to produce
any of the resources.
(7) All ECR are risked for the chance of development. For ECR, the chance
of development is defined as the probability of a project being
commercially viable. In quantifying the chance of development,
contingencies that were assessed quantitatively to be less than one in
the risking calculation included evaluation drilling, corporate
commitment and timing of production and development. The chance of
development is multiplied by the unrisked resource volume estimate,
which yields the risked volume estimate. As many of these factors have
a wide range of uncertainty and are difficult to quantify, the chance
of development is an uncertain value that should be used with caution.
(8) The economic status of the ‘development not viable’ project maturity
subclass is deemed to be undetermined and is therefore not included in
the ECR reported, representing, on a risked basis, 125 bcf of
conventional natural gas, 2 mmbbls of ngl and 3 mmbbls of light and
medium crude oil.

/T/

An estimate of risked Net Present Value (“NPV”) of future net revenue of the
development pending contingent resources subclass only is preliminary in nature
and is provided to assist the reader in reaching an opinion on the merit and
likelihood of Crew proceeding with the required investment. It includes
contingent resources that are considered too uncertain with respect to chance
of development and cannot be classified as reserves until the contingencies are
lifted. There is uncertainty that the risked NPV of future net revenue will be
realized. The other subclasses of resources are not included in this NPV and
therefore this is not reflective of the value of the resource base.

/T/

—————————————————————————-
Before-Tax NPV(1) 2016 Risked ECR Development Pending(2) ($ millions)
—————————————————————————-
Undiscounted 26,539
Discounted at 5% 6,447
Discounted at 10% 1,997
Discounted at 15% 693
Discounted at 20% 217
—————————————————————————-
Notes
(1) Based on the Resource Evaluation and Sproule’s forecast pricing at
December 31, 2016 which is set forth in Crew’s press release dated
February 9, 2017.
(2) Risk in the above table is the chance of development. ECR are
discovered resources by definition.
(3) There is uncertainty that it will be commercially viable to produce
any portion of the resources.

/T/

The estimated cost to fully develop and bring on commercial production of the
‘development pending’ contingent resources for all three product types is
approximately $11.2 billion (or approximately $3.0 billion discounted at 10%).
The forecasted timeline to bring these resources onto production is between two
and 17 years utilizing the same technology in horizontal drilling and
multi-stage fracturing that Crew has already proven to be effective in the
Montney formation in NE BC.

/T/

—————————————————————————-

Best Best
Prospective Resources Chance of Estimate Estimate
(1)(2)(3)(4)(5)(6)(7) Commerciality Unrisked Risked
—————————————————————————-
Conventional Natural Gas (Tcf) 66% 10,311 6,774
NGL (MMbbl) 66% 327 215
Light & Medium Crude Oil (MMbbl) 66% 149 98
—————————————————————————-
Notes:
(1) All UPIIP other than prospective resources has been categorized as
unrecoverable at this time.
(2) All volumes in table are company gross and sales volumes.
(3) The liquid yields are based on average yield over the producing life
of the property.
(4) Liquid yields are unique to each area. They are estimated based on gas
composition of gas samples in the area and expected plant recoveries.
(5) There is no certainty that any portion of the resources will be
discovered. If discovered there is no certainty that it will be
commercially viable to produce any of the resources.
(6) Prospective resources are risked for the chance of discovery and the
chance of development. For prospective resources, the chance of
development multiplied by the chance of discovery is defined as the
probability of a project being commercially viable. In quantifying the
chance of commerciality, factors that were assessed quantitatively to
be less than one in the risking calculation included evaluation
drilling, corporate commitment and timing of production and
development, along with the overall chance of discovery. The chance of
commerciality is multiplied by the unrisked prospective resource
volume estimate, which yields the risked volume estimate. As many of
these factors have a wide range of uncertainty and are difficult to
quantify, the chance of commerciality is an uncertain value that
should be used with caution.
(7) All prospective resources are subclassified as either the ‘prospect’
or ‘lead’ project maturity subclass.

/T/

GET ENERGYNOW’S DAILY EMAIL FOR FREE


Crew Energy Inc. Announces First Quarter 2017 Financial and Operating Results, Updated Montney Resource Evaluation and Non-Core Asset Disposition – Part 4

Resource volumes are estimated using volumetric calculations of the in-place
quantities, combined with performance from analog reservoirs. The currently
producing assets of Crew and other industry parties in the Montney area of NE
BC are used as performance analogs for ECR within Crew’s areas of operations.
The evaluation of ECR is based on an independent third party evaluation that
assumes all of Crew’s ECR will be recovered using horizontal multi-stage
hydraulic fracturing and multi-well pad drilling, which are established
technologies.

Based upon the foregoing analysis and resource information, coupled with Crew’s
expertise in the NE BC Montney, we anticipate that significant additional
reserves will be developed in the future as we achieve continued drilling
success on that portion of our Montney acreage which is currently undeveloped.
Key positive factors considered in the Resource Evaluation estimates which
support Crew’s view that significant additional resources will be recovered
include completions enhancements; improved economic conditions; historic
drilling success and recoveries on the more fully-developed Montney acreage;
abundant well log and production test data; the presence of analogue wells in
the area; improving average initial productivity trends; and the application of
increased drilling densities. Continuous development through multi-year
exploration and development programs and significant levels of future capital
expenditures are required in order for additional resources to be recovered in
the future.

Our ability to recover additional resources is subject to numerous risks and
the key negative factors include minimal well data from the Montney formation
in certain intervals; a lack of long-term production history in the Montney;
potential for variations in the quality of the Montney formation where minimal
well data currently exists; access to capital that would enable us to continue
development; low commodity prices which could impact economics; the future
performance of wells; regulatory approvals or surface restrictions; lack of
infrastructure in certain areas; access to required services at the appropriate
cost; overall industry cost structures; and the continued efficacy of fracture
stimulation technologies and application. In order for ECR to be converted into
reserves, Crew’s management and technical teams must continue to assess
commercial production rates, devise firm development plans that incorporate
timing, infrastructure and capital commitments. Confirmation of commercial
productivity is generally required before the Company can prepare firm
development plans and commit required capital for the development of the ECR.
With continued development and delineation, some resources currently classified
as ECR are expected to be reclassified as Reserves.

A key contingency that prevents the classification of ECR as Reserves is the
additional drilling, completions and testing required to confirm viable
commercial rates. Sproule assigned ECR beyond those areas which were assigned
Reserves but which were within three miles of existing wells, or production
tests. Further, a lack of infrastructure in the Evaluated Areas which is
required to develop the resources, such as gas gathering, processing and
natural gas liquids separation facilities, further impedes the reclassification
of ECR to Reserves. In addition to these factors, and the general operational
risks facing the oil and gas industry, there are several technical and
non-technical contingencies that need to be overcome in order to reclassify ECR
to Reserves. These include evaluation drilling, corporate commitment and timing
of production and development of the ECR.

There is no certainty that any portion of the prospective resources will be
discovered. There is uncertainty that it will be commercially viable to produce
any portion of the prospective (if discovered) or contingent resources.

Definitions of Oil and Gas Resources and Reserves

Reserves are estimated remaining quantities of oil and natural gas and related
substances anticipated to be recoverable from known accumulations, as of a
given date, based on the analysis of drilling, geological, geophysical and
engineering data; the use of established technology; and specified economic
conditions, which are generally accepted as being reasonable. Reserves are
classified according to the degree of certainty associated with the estimates
as follows:

Proved Reserves are those reserves that can be estimated with a high degree of
certainty to be recoverable. It is likely that the actual remaining quantities
recovered will exceed the estimated proved reserves.

Probable Reserves are those additional reserves that are less certain to be
recovered than proved reserves. It is equally likely that the actual remaining
quantities recovered will be greater or less than the sum of the estimated
proved plus probable reserves.

Cumulative Production is the cumulative quantity of petroleum that has been
recovered at a given date.

Resources encompasses all petroleum quantities that originally existed on or
within the earth’s crust in naturally occurring accumulations, including
Discovered and Undiscovered (recoverable and unrecoverable) plus quantities
already produced. “Total resources” is equivalent to “Total Petroleum
Initially-In-Place”. Resources are classified in the following categories:

Total Petroleum Initially-In-Place (“TPIIP”) is that quantity of petroleum that
is estimated to exist originally in naturally occurring accumulations. It
includes that quantity of petroleum that is estimated, as of a given date, to
be contained in known accumulations, prior to production, plus those estimated
quantities in accumulations yet to be discovered.

Discovered Petroleum Initially-In-Place (“DPIIP”) is that quantity of petroleum
that is estimated, as of a given date, to be contained in known accumulations
prior to production. The recoverable portion of discovered petroleum initially
in place includes production, reserves, and contingent resources; the remainder
is unrecoverable.

Contingent Resources are those quantities of petroleum estimated, as of a given
date, to be potentially recoverable from known accumulations using established
technology or technology under development but which are not currently
considered to be commercially recoverable due to one or more contingencies.

Economic Contingent Resources (“ECR”) are those contingent resources which are
currently economically recoverable.

Project Maturity Subclass Development Pending is defined as a contingent
resource that has been assigned a high chance of development and the resolution
of final conditions for development are being actively pursued.

Project Maturity Subclass Development On Hold is defined as a contingent
resource that has been assigned a reasonable chance of development, but there
are major non-technical contingencies to be resolved that are usually beyond
the control of the operator.

Project Maturity Subclass Development Unclarified is defined as a contingent
resource that requires further appraisal to clarify the potential for
development and has been assigned a lower chance of development until
contingencies can be clearly defined.

Project Maturity Subclass Development not Viable is defined as a contingent
resource where no further data acquisition or evaluation is currently planned
and hence there is a low chance of development.

Undiscovered Petroleum Initially-In-Place (“UPIIP”) is that quantity of
petroleum that is estimated, on a given date, to be contained in accumulations
yet to be discovered. The recoverable portion of undiscovered petroleum
initially in place is referred to as “prospective resources” and the remainder
as “unrecoverable.”

Prospective Resources are those quantities of petroleum estimated, as of a
given date, to be potentially recoverable from undiscovered accumulations by
application of future development projects. Prospective resources have both an
associated chance of discovery and a chance of development.

Unrecoverable is that portion of DPIIP and UPIIP quantities which is estimated,
as of a given date, not to be recoverable by future development projects. A
portion of these quantities may become recoverable in the future as commercial
circumstances change or technological developments occur; the remaining portion
may never be recovered due to the physical/chemical constraints represented by
subsurface interaction of fluids and reservoir rocks.

Uncertainty Ranges are described by the Canadian Oil and Gas Evaluation
Handbook as low, best, and high estimates for reserves and resources. The Best
Estimate is considered to be the best estimate of the quantity that will
actually be recovered. It is equally likely that the actual remaining
quantities recovered will be greater or less than the best estimate. If
probabilistic methods are used, there should be at least a 50 percent
probability (P50) that the quantities actually recovered will equal or exceed
the best estimate.

Information Regarding Disclosure on Oil and Gas Reserves, Resources and
Operational Information

All amounts in this news release are stated in Canadian dollars unless
otherwise specified. Throughout this press release, the terms Boe (barrels of
oil equivalent), Mmboe (millions of barrels of oil equivalent), and Tcfe
(trillion cubic feet of gas equivalent) are used. Such terms when used in
isolation, may be misleading. Where applicable, natural gas has been converted
to barrels of oil equivalent (“BOE”) based on 6 Mcf:1 BOE and oil and liquids
have been converted to natural gas equivalent on the basis of 1 bbl:6 mcfe. The
BOE rate is based on an energy equivalent conversion method primarily
applicable at the burner tip, and given that the value ratio based on the
current price of crude oil as compared to natural gas is significantly
different than the energy equivalency of the 6:1 conversion ratio, utilizing
the 6:1 conversion ratio may be misleading as an indication of value. The BOE
rate is based on an energy equivalent conversion method primarily applicable at
the burner tip and does not represent a value equivalent at the wellhead. In
accordance with Canadian practice, production volumes and revenues are reported
on a company gross basis, before deduction of Crown and other royalties and
without including any royalty interest, unless otherwise stated. Unless
otherwise specified, all reserves volumes in this news release (and all
information derived therefrom) are based on “company gross reserves” using
forecast prices and costs. Our oil and gas reserves statement for the
year-ended December 31, 2016 includes complete disclosure of our oil and gas
reserves and other oil and gas information in accordance with NI 51-101, and is
contained within our Annual Information Form which is available on our SEDAR
profile at www.sedar.com.

This press release contains metrics commonly used in the oil and natural gas
industry, such as “operating netback”. Such terms do not have a standardized
meaning and may not be comparable to similar measures presented by other
companies, and therefore should not be used to make such comparisons. These
metrics do not have standardized meanings and may not be comparable to similar
measures presented by other companies. As such, they should not be used to make
comparisons. Management uses these oil and gas metrics for its own performance
measurements and to provide shareholders with measures to compare Crew’s
performance over time, however, such measures are not reliable indicators of
Crew’s future performance and future performance may not compare to the
performance in previous periods.

This news release contains references to estimates of oil and gas classified as
TPIIP, DPIIP, UPIIP and ECR in the Montney region in NE BC which are not, and
should not be confused with, oil and gas reserves. See “Definitions of Oil and
Gas Resources and Reserves”.

Projects have not been defined to develop the resources in the Evaluated Areas
as at the evaluation date. Such projects, in the case of the Montney resource
development, have historically been developed sequentially over a number of
drilling seasons and are subject to annual budget constraints, Crew’s policy of
orderly development on a staged basis, the timing of the growth of third party
infrastructure, the short and long-term view of Crew on oil and gas prices, the
results of exploration and development activities of Crew and others in the
area and possible infrastructure capacity constraints. As with any resource
estimates, the evaluation will change over time as new information becomes
available.

Crew’s belief that it will establish significant additional reserves over time
with the conversion of DPIIP and prospective resource into contingent resource,
contingent resource into probable reserves and probable reserves into proved
reserves is a forward looking statement and is based on certain assumptions and
is subject to certain risks, as discussed below under the heading “Forward
Looking Information and Statements”.

Cautionary Statements

Forward-Looking Information and Statements

This news release contains certain forward-looking information and statements
within the meaning of applicable securities laws. The use of any of the words
“expect”, “anticipate”, “continue”, “estimate”, “may”, “will”, “project”,
“should”, “believe”, “plans”, “intends” “forecast” and similar expressions are
intended to identify forward-looking information or statements. In particular,
but without limiting the foregoing, this news release contains forward-looking
information and statements pertaining to the following: the volume and product
mix of Crew’s oil and gas production; production estimates including Q2, Q3, Q4
and annual 2017 forecast average production and 2017 exit rate; anticipated
closing of the Goose asset disposition and the timing thereof; the volumes and
estimated value of Crew’s resources and undeveloped land; the recognition of
significant resources under the heading “Crew Northeast British Columbia
Montney Resource Evaluation”; future oil and natural gas prices and Crew’s
commodity risk management programs; future liquidity and financial capacity;
future results from operations and operating metrics; anticipated reductions in
operating costs, well costs and G&A expenditures and potential to improve
ultimate recoveries and initial production rates; future costs, expenses and
royalty rates; future interest costs; the exchange rate between the $US and
$Cdn; future development, exploration, acquisition and development activities
and related capital expenditures and the timing thereof; the number of wells to
be drilled, completed and tied-in and the timing thereof; the potential value
of our undeveloped land base; the amount and timing of capital projects
including facility expansions, commissioning and the timing thereof; the total
future capital associated with development of reserves and resources; methods
of funding our capital program, including possible non-core asset divestitures
and asset swaps; and our intention to apply to the TSX to implement a normal
course issuer bid and the timing thereof.

Forward-looking statements or information are based on a number of material
factors, expectations or assumptions of Crew which have been used to develop
such statements and information but which may prove to be incorrect. Although
Crew believes that the expectations reflected in such forward-looking
statements or information are reasonable, undue reliance should not be placed
on forward-looking statements because Crew can give no assurance that such
expectations will prove to be correct. In addition to other factors and
assumptions which may be identified herein, assumptions have been made
regarding, among other things: the impact of increasing competition; the
general stability of the economic and political environment in which Crew
operates; the timely receipt of any required regulatory approvals; the ability
of Crew to obtain qualified staff, equipment and services in a timely and cost
efficient manner; drilling results; the ability of the operator of the projects
in which Crew has an interest in to operate the field in a safe, efficient and
effective manner; the ability of Crew to obtain financing on acceptable terms
and the adequacy of cash flow to fund its planned expenditures; field
production rates and decline rates; the ability to replace and expand oil and
natural gas reserves through acquisition, development and exploration; the
timing and cost of pipeline, storage and facility construction and expansion
and the ability of Crew to secure adequate product transportation; future
commodity prices; currency, exchange and interest rates; regulatory framework
regarding royalties, taxes and environmental matters in the jurisdictions in
which Crew operates; the ability of Crew to successfully market its oil and
natural gas products. There are a number of assumptions associated with the
potential of resource volumes and development of the Evaluated Areas including
the quality of the Montney reservoir, future drilling programs and the funding
thereof, continued performance from existing wells and performance of new
wells, the growth of infrastructure, well density per section, and recovery
factors and development necessarily involves known and unknown risks and
uncertainties, including those identified in this press release.

GET ENERGYNOW’S DAILY EMAIL FOR FREE


Husky resumes cleanup after major oil spill in Saskatchewan last summer

REGINA — Husky Energy is going to see how much more oil — if any — can be cleaned up from a major spill last July along the North Saskatchewan River.

The company has started more shoreline cleanup and assessment of the leak, which spilled 225,000 litres of heavy oil mixed with diluent onto the bank of the river near Maidstone, Sask., last July. About 40 per cent reached the river and the oil plume flowed hundreds of kilometres downstream.

About 93 per cent of the oil was cleaned up last year.

Wes Kotyk, an assistant deputy minister with the Ministry of Environment, says the intent is to find areas that were missed, possibly because of high water levels.

Kotyk says one spot has already been identified 18.5 kilometres from the source of the spill.

“That’s one area where some oil has been observed and so they will be going to clean that up and they will be looking for any others,” Kotyk said Monday.

He said Husky’s (TSX:HSE) cleanup work will involve 55 people, some on boats, as well as dog handlers moving up and down the shoreline to find possible cleanup spots.

How any remaining oil is dealt with will depend on whether it’s found along the shoreline or at the bottom of the river, he said.

“Anything that is recoverable will be,” Kotyk said.

“A monitoring plan is being developed and sampling to determine if there is any submerged or sunken oil and, if there is, then they would have to come up with a plan for how to deal with that.”

He could not say how long the cleanup will take, but added that Husky could be onsite the rest of the year if necessary.

“It’s hard to say if what’s remaining is going to be done within a month or two months. It’s a matter of they need to do the investigation and find out what’s there first, and then they can determine what time frame that it would take to do that additional cleanup.”

The spill forced the cities of North Battleford, Prince Albert and Melfort to shut their intakes from the river and find other water sources for almost two months.

Environmentalists have called for Husky to be fined for discharging a substance that could hurt the environment.

Saskatchewan’s Justice Ministry is reviewing Husky Energy’s response to alarms before the spill to determine whether charges are warranted.

Government investigators say the leak began July 20, the day before the spill was discovered. Investigators found that the pipeline’s alarms were warning of potential problems and continued until the line was shut down for scheduled maintenance at 7:15 a.m. on July 21.

Husky Energy said last summer that pipeline monitoring indicated pressure anomalies at 8 p.m. on July 20 and the company started a shutdown at 6 a.m.

The company, which has spent more than $107 million on the cleanup, said the pipeline buckled because of ground movement.

Husky has said it accepts full responsibility and is using what it learned to improve systems and operating procedures.

It could face fines of up to $1 million a day under the Environmental Protection Act and $50,000 a day under the Pipelines Act.

Jennifer Graham, The Canadian Press

GET ENERGYNOW’S DAILY EMAIL FOR FREE


Trilogy Energy Corp. Announces Financial and Operating Results for the Quarter-Ended March 31, 2017

FOR: TRILOGY ENERGY CORP.
TSX SYMBOL: TET

Date issue: May 08, 2017
Time in: 5:06 PM e

Attention:

CALGARY, ALBERTA–(Marketwired – May 8, 2017) –

Trilogy Energy Corp. (TSX:TET) (“Trilogy”) is pleased to announce its financial
and operating results for the quarter-ended March 31, 2017.

Financial and Operating Highlights

/T/

— Reported sales volumes for the first quarter of 2017 increased 11

percent to 25,133 Boe/d (38 percent liquids) as compared to 22,565 Boe/d
(32 percent liquids) for the fourth quarter of 2016. The increase was
attributed primarily to new well production coming on stream in the
quarter;

— Average realized pricing, after hedges, increased by 13 percent to

$35.97/Boe in the first quarter of 2017 from $31.92/Boe for the previous
quarter. Year over year, average realized pricing, after hedges, also
increased 48 percent from the first quarter of 2016;

— Funds flow from operations(1) increased 67 percent to $36.4 million for

the first quarter of 2017 as compared to $21.8 million for the previous
quarter. Year over year, funds flow from operations increased by 338
percent from $8.3 million in the first quarter of 2016.

— Trilogy drilled 9.0 net wells in the first quarter. Net capital

expenditures totaled $41.0 million for the first quarter compared to
$29.7 million for the fourth quarter of 2016;

— Net debt(1) decreased to $583.8 million as at March 31, 2017 from $588.6

million as at December 31, 2016;

— During the quarter, Trilogy accelerated the realization and receipt of

natural gas derivative contract gains totaling $3.5 million USD ($4.6
million CDN).

— Subsequent to the quarter, Trilogy:

— Renewed its revolving credit facility agreement with its lenders
whereby commitments under this facility were set at $300 million.
The maturity date was extended to April 30, 2019;

— Announced that it had agreed to sell certain oil and gas properties
in the Grande Prairie area for cash consideration of $50 million
(before customary adjustments). The disposition is expected to close
before the end of May 2017. Proceeds are expected to be used to
repay amounts drawn under Trilogy’s revolving credit facility. Pro-
forma capacity under Trilogy’s revolving credit facility as at March
31, 2017, after giving effect to the disposition, is expected to
approximate $49 million;

— Entered into forward sales contracts for 30,000 MMBTU/d from May
2017 through to December 2017 at an average price of $3.39
USD/MMBTU.

(1) Refer to Non-GAAP measures

/T/

Financial and Operating Highlights Table

(In thousand Canadian dollars except per share amounts and where stated
otherwise)

/T/

Three Months Ended
March 31, December 31,
2017 2016 Change %
—————————————————————————-
FINANCIAL
Petroleum and natural gas sales 76,089 61,834 23
Funds flow
From operations(1) 36,382 21,824 67
Per share – diluted 0.29 0.17 67
Earnings
Income (loss) before tax 10,874 (24,593) (144)
Per share – diluted 0.09 (0.19) (144)
Income (loss) after tax 7,694 (18,116) (142)
Per share – diluted 0.06 (0.14) (143)
Capital expenditures
Exploration, development, land, and
facility 41,658 30,413 37
Acquisitions (dispositions) and
other – net (675) (725) (7)
Net capital expenditures 40,983 29,688 38
Total assets 1,230,978 1,224,714 1
Net debt(1) 583,777 588,618 (1)
Shareholders’ equity 372,525 363,898 2
Total shares outstanding (thousands)
– As at end of period (2) 126,106 126,101 –
—————————————————————————-
OPERATING
Production
Natural gas (MMcf/d) 93 93 –
Oil (Bbl/d) 6,305 5,251 20
Condensate (Boe/d) 2,059 1,200 72
Natural gas liquids (Boe/d) 1,207 682 77
Total production (Boe/d @ 6:1) 25,133 22,565 11
—————————————————————————-
Liquids Composition (percentage) 38 32
—————————————————————————-
Average prices after financial
instruments
Natural gas ($/Mcf) 3.63 3.12 16
Crude Oil ($/Bbl) 62.69 66.24 (5)
Condensate ($/Boe) 63.25 59.84 6
Natural gas liquids ($/Boe) 32.95 17.75 86
—————————————————————————-
Average realized price ($/Boe) 35.97 31.92 13
Drilling activity (gross)
Gas 4 2 100
Oil 6 7 (14)

(1) Funds flow from operations and net debt are non-GAAP terms. Please refer

to the advisory on Non-GAAP measures below.

(2) Excluding shares held in trust for the benefit of Trilogy’s officers and

employees under the Company’s Share Incentive Plan. Includes Common
Shares and Non-voting Shares. Refer to the notes to the Annual Audited
Consolidated Financial Statements for additional information.

/T/

Operations Update for the First Quarter 2017

Trilogy’s first quarter 2017 production was 25,133 Boe/d (38 percent oil and
natural gas liquids), an increase of 11 percent from fourth quarter 2016
production of 22,565 Boe/d (32 percent oil and natural gas liquids). The
increase in first quarter production reflects the impact of new horizontal
Montney and Duvernay wells drilled and completed in the fourth quarter 2016 and
first quarter 2017. Three wells drilled late in the fourth quarter of 2016 were
fracture stimulated in January and on production in February 2017. Trilogy
drilled 6 horizontal Montney oil wells during the first quarter, of which 3
were completed and on production in late March.

Funds flow from operations was $36.4 million and net capital expenditures were
$41.0 million for the first quarter. Second quarter capital spending is
estimated to be between $20-$25 million, depending on weather and ground
conditions during the quarter.

Grande Prairie

Subsequent to the end of the first quarter, Trilogy announced that it has
agreed to sell certain assets located in the Grande Prairie area of Alberta for
cash consideration of $50 Million (before customary adjustments). The
transaction is conditional upon the purchaser’s receipt of the Alberta Energy
Regulator (“AER”) approvals for the transfer of the wells, pipelines and
facilities. The assets being sold consist of approximately 44,427 net acres of
mineral rights (including approximately 11,500 net acres of Montney/Doig
mineral rights) in the Valhalla area along with current net production of
approximately 1,100 Boe/d (16 percent oil and natural gas liquids) net to
Trilogy, estimated Total Proved Developed Producing reserves of approximately
1,800 MBoe and Total Proved plus Probable reserves of approximately 5,500 MBoe,
each as at December 31, 2016, net of Q1 2017 production.

The sale is effective May 1, 2017 and is expected to be completed before the
end of May 2017, provided the purchaser receives the above mentioned AER
approvals. Proceeds from the sale will be applied to reduce Trilogy’s
indebtedness under its revolving credit facility.

Montney Oil Pool

The shift from hydrocarbon-based to water-based fracture stimulations in early
2016 reduced completion costs and allowed the Company to economically increase
proppant volume and decrease stage spacing, thereby better distributing
proppant along the length of the lateral wellbore. Trilogy varied sand volumes
from 10 tonnes per stage in the Company’s original horizontal Montney oil wells
to as much as 20 tonnes per stage in recent wells. At the same time, stage
spacing was reduced from 75 meters per stage in the original wells to 50 to 65
meters in recent wells. In addition, completion pump rates have increased
substantially, resulting in increased fracture complexity. All of these factors
combined have contributed to higher initial well productivity as compared to
the Company’s first generation Montney oil wells.

Trilogy has allocated approximately $60 million towards further development of
its Montney oil pool in 2017. The majority of the capital will be allocated to
drill 15 wells and complete 18 wells in the pool, incorporating the
efficiencies from the Company’s 2016 Montney drilling and completion program.
To date, 6 wells have been drilled in the first quarter with plans to drill at
least 9 additional horizontal wells through the second half of 2017. Trilogy
also intends to allocate capital to a water disposal project, an enhanced
recovery gas reinjection pilot project and to the construction of pad sites and
pipelines intended for future development of the pool.

The following table updates production results to April 30, 2017 for the 9
horizontal Montney oil wells that were drilled, completed and brought on
production in 2016, the 3 wells that were drilled in 2016 and completed in the
first quarter of 2017. The variable results reflect the evolution of completion
techniques described above and the amount of time the wells have been on
production.

/T/

—————————————————————————-

Cum Average Average Average
Cum Gas Oil Rate Gas Rate Prod.
Oil MBbl MMcf Bbl/d MMcf/d Boe/d
—————————————————————————-
5-6-64-18W5 107 293 399 1.1 582
—————————————————————————-
02/12-6-64-18W5 80 270 246 0.8 384
—————————————————————————-
10-31-64-18W5 48 251 253 1.3 473
—————————————————————————-
02/1-1-64-19W5 76 152 473 0.9 630
—————————————————————————-
02/2-1-64-19W5 82 95 541 0.6 646
—————————————————————————-
2-1-64-19W5 45 52 329 0.4 394
—————————————————————————-
02/4-6-64-18W5 70 105 530 0.8 661
—————————————————————————-
02/5-6-64-18W5 95 218 671 1.5 927
—————————————————————————-
03/4-6-64-18W5 69 133 515 1.0 682
—————————————————————————-
14-31-64-18W5 1 1 20 0.02 24
—————————————————————————-
13-31-64-18W5 22 44 374 0.8 502
—————————————————————————-
02/13-31-64-18W5 13 30 209 0.5 287
—————————————————————————-

—————————————————————————-

Sand Lateral Total
Tonnes Number of Length Prod. On Prod.
per stage Stages Meters Days Date
—————————————————————————-
5-6-64-18W5 20 22 1577 267 Mar 18/16
—————————————————————————-
02/12-6-64-18W5 10 22 1566 326 May 12/16
—————————————————————————-
10-31-64-18W5 20 28 2680 190 Sep 23/16
—————————————————————————-
02/1-1-64-19W5 20 21 1498 161 Oct 16/16
—————————————————————————-
02/2-1-64-19W5 20 21 1455 151 Oct 17/16
—————————————————————————-
2-1-64-19W5 20 26 1525 136 Oct 20/16
—————————————————————————-
02/4-6-64-18W5 20 32 1584 133 Nov 11/16
—————————————————————————-
02/5-6-64-18W5 13.5 33 1573 142 Nov 12/16
—————————————————————————-
03/4-6-64-18W5 20 32 1581 133 Nov 14/16
—————————————————————————-
14-31-64-18W5 19.3 33 2787 61 Jan 19/17
—————————————————————————-
13-31-64-18W5 17.4 27 2283 58 Jan 18/17
—————————————————————————-
02/13-31-64-18W5 17.8 36 2938 64 Jan 16/17
—————————————————————————-

/T/

Presley Montney Gas Development

Trilogy’s 2017 budget provided approximately $30 million to develop 6 (6.0 net)
wells in the Presley Montney liquids-rich gas pool. Trilogy drilled 3 (3.0 net)
extended length horizontal wells (each approximately 2 miles in lateral length)
into the pool in the first quarter and is currently drilling a 3-well pad (1
mile laterals) through the second quarter. One of the extended reach lateral
wells was fracture stimulated in April and is expected to be on production in
early May. The remaining 2 wells are expected to be completed in mid-May and on
production in mid-June once break up is over. The 3-well pad currently being
drilled is expected to be completed and tied in during the third quarter.
Trilogy plans to continue to prepare drilling locations and evaluate
infrastructure alternatives for the Montney gas pool as well as operated
Duvernay production in the Presley area, so as to be prepared for full field
development when commodity prices increase.

Duvernay Update

Trilogy did not have any Duvernay spending in the first quarter but is
preparing to build on the success of the Company’s recent wells and will be
monitoring industry drilling, completion and production results adjacent to its
Duvernay acreage. The 2 horizontal Duvernay wells Trilogy drilled in 2016 were
drilled and completed on single well pads at a cost of approximately $10.2
million per well. Trilogy expects to realize significant reduction in costs
relative to previous Duvernay wells once multi-well pad development begins. The
following table summarizes the production up to April 30, 2017 from the 2
Duvernay horizontal wells drilled in 2016.

/T/

—————————————————————————-

Average
Cum Cum Oil/Cond Average Average
Cond Gas Rate Gas Rate Prod.
MBbl MMcf Bbl/d MMcf/d Boe/d
—————————————————————————-
2/16-17-61-19W5 30 427 204 2.9 686
—————————————————————————-
12-21-63-17W5 38 72 334 0.6 439
—————————————————————————-

————————————————————————–

Condensate
Gas Sand Total On
Ratio Conc. Prod. Prod.
Bbl/MMcf t/m Days Date
————————————————————————–
2/16-17-61-19W5 70 2.2 147 Nov 10/16
————————————————————————–
12-21-63-17W5 533 2.2 115 Dec 21/16
————————————————————————–

/T/

Trilogy has allocated approximately $35 million towards Duvernay projects in
the second half of 2017. The decision to execute this portion of the capital
budget will be made later in the year.

Trilogy may consider monetizing a portion of its Duvernay acreage to help fund
the development of the remaining Duvernay acreage. This could potentially
include a joint venture arrangement, external sources of funding to accelerate
the commercial development of some of this acreage or a sale of a portion of
the Company’s Duvernay acreage. Trilogy has processing capacity in place to
produce volumes from its Duvernay development plan for the initial two to three
year development period; however, to produce Trilogy’s longer term Duvernay
development plan, Trilogy will require access to additional operated and
non-operated natural gas processing and NGL handling infrastructure.

Outlook

Trilogy plans to execute a 2017 capital spending budget that is within
anticipated 2017 funds flow from operations based on Trilogy’s 2017 production
expectations and forecasted pricing for the year. The level of capital spending
in the second half of the year will depend on commodity prices and will
primarily impact the Duvernay projects later in 2017.

Given the encouraging production results to date, which is expected to offset
the impact of the aforementioned Grande Prairie disposition, Trilogy continues
to reaffirm its 2017 annual guidance as follows:

/T/

— Average production: 24,000 Boe/d (approx. 35% oil and NGLs)

— Average operating costs: $8.50/Boe

— Capital expenditures: $130 Million

/T/

Additional Information

Trilogy’s financial and operating results for the first quarter of 2017,
including Management’s Discussion and Analysis and the Company’s Unaudited
Interim Consolidated Financial Statements and related Notes as at and for the
quarter-ended March 31, 2017 can be obtained at
http://media3.marketwire.com/docs/Q1-2017REPORT.pdf. These reports will also be
made available through Trilogy’s website at www.trilogyenergy.com and SEDAR at
www.sedar.com.

About Trilogy

Trilogy is a petroleum and natural gas-focused Canadian energy corporation that
actively develops, produces and sells natural gas, crude oil and natural gas
liquids. Trilogy’s geographically concentrated assets are primarily, high
working interest properties that provide abundant low-risk infill drilling
opportunities and good access to infrastructure and processing facilities, many
of which are operated and controlled by Trilogy. Trilogy’s common shares are
listed on the Toronto Stock Exchange under the symbol “TET”.

Non-GAAP Measures

Certain measures used in this document, including “adjusted EBITDA”,
“consolidated debt”, “finding and development costs”, “funds flow from
operations”, “operating income”, “net debt”, “operating netback”, “recycle
ratio” and “senior debt” collectively the “Non GAAP measures” do not have any
standardized meaning as prescribed by IFRS and previous GAAP and, therefore,
are considered Non-GAAP measures. Non-GAAP measures are commonly used in the
oil and gas industry and by Trilogy to provide Shareholders and potential
investors with additional information regarding the Company’s liquidity and its
ability to generate funds to finance its operations. However, given their lack
of standardized meaning, such measurements are unlikely to be comparable to
similar measures presented by other issuers.

“Adjusted EBITDA” refers to “Funds flow from operations” plus cash interest,
tax expenses, certain other items (accrued cash remuneration costs for its
employees – deducted from EBITDA when paid) that do not appear individually in
the line items of the Company’s financial statements, in addition to pro-forma
adjustments for properties acquired or disposed of in the period and the
exclusion of revenues or losses of an extraordinary and non-recurring nature.

“Consolidated debt” generally includes all long-term debt plus any issued and
undrawn letters of credit, less any cash held.

“Finding and development costs” refers to all capital expenditures and costs of
acquisitions, excluding expenditures where the related assets were disposed of
by the end of the year, and including changes in future development capital on
a total proved or total proved plus probable basis. “Finding and development
costs per Barrel of oil equivalent” (“F&D $/Boe”) is calculated by dividing
finding and development costs by the current year’s reserve extensions,
discoveries and revisions on a total proved or total proved plus probable
reserve basis. Management uses finding and development costs as a measure to
assess the performance of the Company’s resources required to locate and
extract new hydrocarbon reservoirs.

“Funds flow from operations” refers to the cash flow from operating activities
before net changes in operating working capital as shown in the consolidated
statements of cash flows. Management utilizes funds flow from operations as a
key measure to assess the ability of the Company to finance dividends,
operating activities, capital expenditures and debt repayments.

“Operating income” is equal to petroleum and natural gas sales before financial
instruments and bad debt expenses minus royalties, operating charges, and
transportation costs. Management uses this metric to measure the discrete
operating results of its oil and gas properties.

“Operating netback” refers to operating income plus realized financial
instrument gains and losses and other income minus actual decommissioning,
restoration, and remediation costs incurred. Operating netback provides
management with a more fulsome metric on its oil and gas properties considering
strategic decisions (for example, hedging programs) and associated full life
cycle charges.

“Net debt” is calculated as current liabilities minus current assets excluding
assets and liabilities held for sale therein plus long-term debt. Management
utilizes net debt as a key measure to assess the liquidity of the Company.

“Recycle ratio” is equal to “Operating netback” on a production barrel of oil
equivalent for the year divided by “F&D $/Boe” (computed on a total proved or
total proved plus probable reserve basis as applicable). Management uses this
metric to measure the profitability of the Company in turning a barrel of
reserves into a barrel of production.

“Senior debt” is generally defined as “Consolidated debt” but excluding any
indebtedness under the Senior Unsecured Notes.

Investors are cautioned that the Non-GAAP measures should not be considered in
isolation or construed as alternatives to their most directly comparable
measure calculated in accordance with IFRS, as set forth above, or other
measures of financial performance calculated in accordance with IFRS.

Forward-Looking Information

Certain statements included in this document (including this MD&A and the
Operations Update) constitute forward-looking statements under applicable
securities legislation. Forward-looking statements or information typically
contain statements with words such as “anticipate”, “believe”, “expect”,
“plan”, “intend”, “estimate”, “propose”, “budget”, “goal”, “objective”,
“possible”, “probable”, “projected”, “scheduled”, or state that certain
actions, events or results “may”, “could”, “should”, “would”, “might” or “will”
be taken, occur or be achieved, or similar words suggesting future outcomes or
statements regarding an outlook. Forward-looking statements or information in
this document include but are not limited to statements regarding:

/T/

— the anticipated closing of the previously announced transaction to sell

certain assets in the Grande Prairie area, the timing thereof, the
intended use of proceeds therefrom and the anticipated impact of the
disposition on the Company’s capacity under its revolving credit
facility as well as its production levels;
— business strategy and objectives for 2017 and beyond;
— drilling, completion and infrastructure plans for the Company’s Kaybob
Montney oil and gas assets and Duvernay play, among others, and the
timing, cost payout and other anticipated benefits thereof;
— forecast 2017 annual production levels and the relative content of
natural gas liquids therein;
— planned 2017 capital expenditures, the allocation and timing thereof and
Trilogy’s intention to execute its capital budget within annual funds
flow from operations;
— operating, finding and development, decommissioning, asset retirement,
restoration and other costs and the anticipated results of Trilogy’s
operational efficiencies and cost cutting measures;
— the capacity under and potential liabilities relating to processing and
natural gas liquids handling arrangements as well as long-term
transportation, fractionation and other marketing, midstream and forward
contracts;
— anticipated funds flow from operations and other measures of profit,
— expectations regarding future commodity prices for crude oil, natural
gas, NGLs and related products and the potential impact to Trilogy of
commodity price fluctuations;
— estimated reserves, the discounted present value of future net revenue
therefrom and the Company’s plans to develop same including the capital
required, the timing thereof and the price forecasts used in calculating
the foregoing;
— plans to accelerate development of some or all of the Company’s Duvernay
shale assets;
— the ability to profitably exploit Trilogy’s assets, grow production and
generate long-term shareholder value;
— projected results of hedging contracts and other financial instruments;
— Management’s current estimate of the financial impact of the recent
Kaybob North Montney pipeline release and third party prior year revenue
adjustment; and
— other expectations, beliefs, plans, goals, objectives, assumptions,
information and statements about possible future events, conditions, and
results of operations or performance.

/T/

Statements regarding “reserves” are forward-looking statements, as they involve
the implied assessment, based on certain estimates and assumptions, that the
reserves described exist in the quantities predicted or estimated, and can be
profitably produced in the future.

Such forward-looking statements or information are based on a number of
assumptions which may prove to be incorrect. In addition to other assumptions
identified in this document, assumptions have been made regarding, among other
things:

/T/

— the likelihood that the previously announced Grande Prairie asset sale

will close as planned;
— future crude oil, natural gas, condensate, NGLs and other commodity
pricing and supply;
— funds flow from operations and cash flow consistent with expectations;
— current reserves estimates;
— credit facility availability and access to sources of funding for
Trilogy’s planned operations and expenditures;
— the ability of Trilogy to service and repay its debt when due;
— current production forecasts and the relative mix of crude oil, natural
gas and NGLs therein;
— geology applicable to Trilogy’s land holdings;
— the extent and development potential of Trilogy’s assets (including,
without limitation, Trilogy’s Kaybob area Montney oil and gas assets and
the Duvernay Shale play, among others);
— the ability of Trilogy and its industry partners to obtain drilling and
operational results, improvements and efficiencies consistent with
expectations (including in respect of anticipated production volumes,
reserves additions and NGL yields);
— well economics;
— decline rates;
— foreign currency, exchange and interest rates;
— royalty rates, taxes and capital, operating, general & administrative
and other costs and expenses;
— assumptions regarding royalties and expenses and the applicability and
continuity of royalty regimes and government incentive programs to
Trilogy’s operations;
— general business, economic, industry and market conditions;
— projected capital investment levels and the successful and timely
implementation of capital projects;
— anticipated timelines and budgets being met in respect of drilling
programs and other operations;
— the ability of Trilogy to obtain equipment, services, supplies and
personnel in a timely manner and at an acceptable cost to carry out its
evaluations and activities;
— the ability of Trilogy to secure adequate product processing,
transportation, fractionation and storage capacity on acceptable terms
or at all and assumptions regarding the timing and costs of run-times,
outages and turnarounds;
— the ability of Trilogy to market its oil, natural gas, condensate, other
NGLs and other products successfully to current and new customers;
— expectation that counterparties will fulfill their obligations under
operating, processing, marketing and midstream agreements;
— the timely receipt of required regulatory approvals;
— the continuation of assumed tax regimes, estimates and projections in
respect of the application of tax laws and estimates of deferred tax
amounts, tax assets and tax pools;
— the extent of Trilogy’s liabilities; and
— assumptions used in calculating the provisions made for the cost of the
Kaybob North Montney pipeline release and the third party prior year
production reallocations.

/T/

Although Trilogy believes that the expectations reflected in such
forward-looking statements or information are reasonable, undue reliance should
not be placed on forward-looking statements because Trilogy can give no
assurance that such expectations will prove to be correct. Forward-looking
statements or information are based on current expectations, estimates and
projections that involve a number of risks and uncertainties which could cause
actual results to differ materially from those anticipated by Trilogy and
described in the forward-looking statements or information. These risks and
uncertainties include but are not limited to:

/T/

— the risk that the purchaser of the Company’s Grande Prairie assets will

not obtain the required approvals from the Alberta Energy Regulator in
order to close the transaction by the end of May or at all;
— fluctuations in crude oil, natural gas, condensate and other natural gas
liquids and commodity prices;
— the ability to generate sufficient funds flow from operations and obtain
financing on acceptable terms to fund planned exploration, development,
construction and operational activities and to meet current and future
obligations ;
— the possibility that Trilogy will not commercially develop its Duvernay
shale assets in the near future or at all;
— uncertainties as to the availability and cost of financing;
— Trilogy’s ability to satisfy maintenance covenants within its credit and
debt arrangements;
— the risk and effect of a downgrade in Trilogy’s credit rating;
— fluctuations in foreign currency, exchange rates and interest rates;
— the risks of the oil and gas industry, such as operational risks in
exploring for, developing and producing crude oil, natural gas,
condensate and other natural gas liquids, and market demand;
— risks and uncertainties involving the geology of oil and gas;
— the uncertainty of reserves estimates reserves life;
— the uncertainty of estimates and projections relating to future
production and NGL yields as well as costs and expenses;
— the ability of Trilogy to add production and reserves through
development and exploration activities and acquisitions;
— Trilogy’s ability to secure adequate product processing, transmission,
transportation, fractionation and storage capacity on acceptable terms
and on a timely basis or at all;
— potential disruptions or unexpected technical difficulties in designing,
developing, or operating new, expanded, or existing pipelines or
facilities (including third party operated pipelines and facilities);
— risks inherent in Trilogy’s marketing operations, including credit and
other financing risks and the risk that Trilogy may not be able to enter
into arrangements for the sale of its sales volumes;
— volatile business, economic and market conditions;
— general risks related to strategic and capital allocation decisions,
including potential delays or changes in plans with respect to
exploration or development projects or capital expenditures and
Trilogy’s ability to react to same;
— availability of equipment, goods, services and personnel in a timely
manner and at an acceptable cost;
— health, safety, security and environmental risks;
— the timing and cost of future abandonment and reclamation obligations
and potential liabilities for environmental damage and contamination;
— risks and costs associated with environmental, regulatory and
compliance, including those potentially associated with hydraulic
fracturing, greenhouse gases and “climate change” and the cost to
Trilogy in order to comply with same;
— weather conditions;
— the possibility that government policies, regulations or laws may
change, including risks related to the imposition of moratoriums;
— the possibility that regulatory approvals may be delayed or withheld;
— risks associated with Trilogy’s ability to enter into and maintain
leases and licenses;
— uncertainty with regard to royalty payments and the applicability of and
changes to royalty regimes and incentive programs including, without
limitation, applicable royalty incentive regimes and the Modernized
Royalty Framework, the Emerging Resources Program and the Enhanced
Hydrocarbon Recovery Program, among others;
— imprecision in estimates of product sales, commodity prices, capital
expenditures, tax pools, tax deductions available to Trilogy, changes to
and the interpretation of tax legislation and regulations;
— uncertainty regarding results of objections to Trilogy’s exploration and
development plans by third party industry participants, aboriginal and
local populations and other stakeholders;
— risks associated with existing and potential lawsuits, regulatory
actions, audits and assessments;
— changes in land values paid by industry;
— risks associated with Trilogy’s mitigation strategies including
insurance and hedging activities;
— risks related to the actions and financial circumstances of Trilogy
agents and contractors, counterparties and joint venture partners,
including renegotiation of contracts;
— risks relating to cybersecurity, vandalism, and terrorism;
— the ability of management to execute its business plan;
— the risk that the assumptions used by Management to estimate the
provision for the costs resulting from the recent Kaybob North Montney
pipeline release and the third party prior year production reallocation
prove to be incorrect; and
— other risks and uncertainties described elsewhere in this document and
in Trilogy’s other filings with Canadian securities authorities,
including its Annual Information Form.

/T/

The foregoing lists are not exhaustive. Additional information on these and
other factors which could affect the Company’s operations or financial results
are included in the Company’s most recent Annual Information Form and in other
documents on file with the Canadian Securities regulatory authorities. The
forward-looking statements or information contained in this document are made
as of the date hereof and Trilogy undertakes no obligation to update publicly
or revise any forward-looking statements or information, whether as a result of
new information, future events or otherwise, unless so required by applicable
securities laws.

Oil and Gas Advisory

This document contains disclosure expressed as “Boe”, “MBoe”, “Boe/d”, “Mcf”,
“Mcf/d”, “MMcf”, “MMcf/d”, “Bcf”, “Bbl”, and “Bbl/d”. All oil and natural gas
equivalency volumes have been derived using the ratio of six thousand cubic
feet of natural gas to one barrel of oil (6:1). Equivalency measures may be
misleading, particularly if used in isolation. A conversion ratio of six
thousand cubic feet of natural gas to one barrel of oil is based on an energy
equivalency conversion method primarily applicable at the burner tip and does
not represent a value equivalency at the well head. For Q1 2017, the ratio
between Trilogy’s average realized oil price and the average realized natural
gas price was approximately 20:1 (“Value Ratio”). The Value Ratio is obtained
using the Q1 2017 average realized oil price of $61.36 (CAD$/Bbl) and the Q1
2017 average realized natural gas price of $3.09 (CAD$/Mcf). This Value Ratio
is significantly different from the energy equivalency ratio of 6:1 and using a
6:1 ratio would be misleading as an indication of value.

– END RELEASE – 08/05/2017

For further information:
J.H.T. (Jim) Riddell, Chief Executive Officer
J.B. (John) Williams, President and Chief Operating Officer
M.G. (Michael) Kohut, Chief Financial Officer
OR
Trilogy Energy Corp.
1400 – 332 – 6th Avenue S.W.
Calgary, Alberta T2P 0B2
(403) 290-2900
(403) 263-8915 (FAX)

COMPANY:
FOR: TRILOGY ENERGY CORP.
TSX SYMBOL: TET

INDUSTRY: Energy and Utilities – Oil and Gas
RELEASE ID: 20170508CC0094

Press Release from Marketwired 1-866-736-3779

All press releases are written by the client and have NO affiliation with the news copy written by The Canadian Press. Any questions that arise due to the content or information provided in the press release should be directed to the company/organization
issuing the release, not to The Canadian Press.

GET ENERGYNOW’S DAILY EMAIL FOR FREE


Gibsons Reports Financial Results for First Quarter 2017 and Pending Retirement of CEO

FOR: GIBSON ENERGY INC.
TSX SYMBOL: GEI

Date issue: May 08, 2017
Time in: 4:42 PM e

Attention:

CALGARY, ALBERTA–(Marketwired – May 8, 2017) – Gibson Energy Inc. (“Gibsons”
or the “Company”), (TSX:GEI), announced today its operating and financial
results for the three months ended March 31, 2017. The Company also announced
the pending retirement of its President and Chief Executive Officer, Stewart
Hanlon.

All financial figures are in Canadian dollars

Highlights:

(Comparisons made between fiscal Q1 2017 and fiscal Q1 2016 results, unless
otherwise noted.)

/T/

— Combined Adjusted EBITDA(1) was $87 million in the first quarter, an

increase of 17%;
— Combined segment profit(2) increased 25% to $100 million, supported by a
12% increase in Infrastructure segment profit to $60 million as a result
of the additional tank capacity and associated fixed fee contracts added
in 2016;
— Wholesale segment profit of $18 million increased materially due to
seasonal market dynamics for NGLs and refined products;
— Distributable cash flow from continuing operations(3) increased by 153%
to $42 million;
— On March 1, 2017, Gibsons granted an option right to Superior Plus LP,
which was exercised immediately, to purchase Gibsons’ Industrial Propane
business in exchange for adjusted cash consideration of $435 million. As
a result, the Company derecognized the Industrial Propane segment
effective March 1, 2017;
— On March 22, 2017, the Company closed the issuance of $350 million
aggregate principal amount of 5.25% senior unsecured notes due July 15,
2024. The net proceeds of the issuance, along with a portion of the net
proceeds from the sale of the Company’s Industrial Propane business,
were utilized to repay $211 million of its 7.00% senior notes due 2020
and U.S.$339 million of its 6.75% senior notes due 2021. The closing of
the notes issuance, in combination with the early repayment of notes,
strengthens the Company’s balance sheet, by reducing its long-term
indebtedness, decreases its annual interest costs and extends its debt
maturity profile; and
— Capital expenditures were $25 million, of which $24 million related to
growth initiatives primarily advancing the expansion of terminal storage
and pipeline connections at the Company’s key Hardisty and Edmonton
facilities.

/T/

“Our continued deployment of capital into the Infrastructure segment helped
lead to increases in volumes at both our Hardisty and Edmonton terminals
benefitting from the newly commissioned tanks that came on-stream in the last
two quarters of 2016,” said Stewart Hanlon, Gibsons’ President and Chief
Executive Officer. “Our cash flow stability continues to improve and the sale
of the Industrial Propane business accelerates the Company’s Infrastructure
focus. Leading into 2017, we will prioritize efficiently constructing the two,
new, fully-contracted 400,000 barrel Edmonton tanks, contracting up to four new
tanks in Hardisty, and continuing to enhance our business to increase the
contracted cash flow available to support and ultimately grow our dividend.”

/T/

1. Combined Adjusted EBITDA is defined in Gibsons’ Management’s Discussion

and Analysis.
2. Segment profit is defined in Gibsons’ Management’s Discussion and
Analysis
3. Distributable cash flow from continuing operations is defined in
Gibsons’ Management’s Discussion and Analysis

/T/

CEO Retirement

The Company formally announced Stewart Hanlon’s intention to retire following
26 years with Gibsons, eight of them as President and CEO. Mr. Hanlon informed
the Board, in mid-2016, about his desire to retire at some point in 2018. At
that time, the Board commenced a search and hopes to be in a position to
announce the new President and CEO in the near term. Mr. Hanlon will continue
in his current role until his successor has joined Gibsons and will stay on
with the Company, in an advisory capacity, for a period of time thereafter to
ensure an orderly transition.

“Under Stewart’s leadership, Gibsons has built a highly valuable and
irreplaceable footprint at its key hubs in Hardisty and Edmonton, Alberta. In
2011, Stewart led the Company’s IPO. Since then, the Company has dramatically
sharpened its business focus, tripling Infrastructure-based cash flows, and
contracting for the sale of its Industrial Propane business, at full value.
Growing the Company’s high-value Infrastructure business will continue to be
the strategy going forward,” said James Estey, Chair of the Board. “I want to
thank Stewart for his contributions. He has built a strong executive team,
enabling the seamless transition to a new President and CEO. He is a respected
leader and has created a company culture with strong values and a focus on
providing customer solutions.”

Management’s Discussion and Analysis and Financial Statements

The first quarter 2017 Management’s Discussion and Analysis and Condensed
Consolidated Financial Statements provide a detailed explanation of Gibsons’
operating results for the quarter ended March 31, 2017, as compared to the
first quarter ended March 31, 2016. These documents are available at
www.gibsons.com and at www.sedar.com.

2017 First Quarter Results Conference Call

A conference call to discuss Gibsons’ first quarter 2017 results will be held
at 7:00 a.m. MT (9:00 a.m. ET) on May 9, 2017, for interested investors,
analysts and media representatives.

The conference call dial-in numbers are:

/T/

— 866-696-5910 from Canada and the US
— 416-340-2217 from Toronto and International
— Participant Pass Code: 5924396#

/T/

Shortly after the call, an audio archive will be posted on the Investor/News
section at http://www.gibsons.com. The call will also be recorded and available
for playback 60 minutes after the meeting end time, until August 1, 2017, using
the following dial in process:

/T/

— 905-694-9451 / 800-408-3053
— Pass code: 8719230#

/T/

About Gibsons

Gibsons is a Canadian-based midstream energy company with operations in most of
the key hydrocarbon-rich basins in North America. For over 60 years, Gibsons
has delivered integrated midstream solutions to customers in the oil and gas
industry. With headquarters in Calgary, Alberta, the Company’s North American
operations include the storage, blending, processing, transportation, marketing
and distribution of crude oil, natural gas liquids and refined products. The
Company also provides oilfield waste and water management services.

Gibson Energy Inc. shares trade under the symbol GEI and are listed on the
Toronto Stock Exchange. For more information, visit www.gibsons.com

Forward-Looking Statements

Certain statements contained in this news release constitute forward-looking
information and statements (collectively, “forward-looking statements”)
including, but not limited to, statements concerning the Company’s growth
capital spending, the timing and completion of construction projects, future
additional construction projects, the sale of the Company’s Industrial Propane
business, the retirement of the current CEO and the appointment of his
successor, the current dividend level and management’s expectation with respect
to the Company’s business and financial prospects and opportunities. These
statements relate to future events or the Company’s future performance. All
statements other than statements of historical fact are forward-looking
statements. The use of any of the words “anticipate”, “plan”, “contemplate”,
“continue”, “estimate”, “expect”, “intend”, “propose”, “might”, “may”, “will”,
“shall”, “project”, “should”, “could”, “would”, “believe”, “predict”,
“forecast”, “pursue”, “potential” and “capable” and similar expressions are
intended to identify forward-looking statements. These statements involve known
and unknown risks, uncertainties and other factors that may cause actual
results or events to differ materially from those anticipated in such
forward-looking statements. No assurance can be given that these expectations
will prove to be correct and such forward-looking statements included in this
news release should not be unduly relied upon. These statements speak only as
of the date of this news release. In addition, this news release may contain
forward-looking statements and forward-looking information attributed to third
party industry sources. The Company does not undertake any obligations to
publicly update or revise any forward looking statements except as required by
securities law. Actual results could differ materially from those anticipated
in these forward-looking statements as a result of numerous risks and
uncertainties including, but not limited to, the risks and uncertainties
described in “Forward-Looking Statements” and “Risk Factors” included in the
Company’s Annual Information Form dated March 7, 2017 as filed on SEDAR.

Non-GAAP Measures

This news release refers to certain financial measures that are not determined
in accordance with International Financial Reporting Standards (“IFRS”).
Adjusted EBITDA and Pro Forma Adjusted EBITDA are not measures recognized under
IFRS and do not have standardized meanings prescribed by IFRS. Management
considers these to be important supplemental measures of the Company’s
performance and believes these measures are frequently used by securities
analysts, investors and other interested parties in the evaluation of companies
in its industries with similar capital structures. See “Summary of Quarterly
Results” in the Company’s MD&A for a reconciliation of EBITDA to net income,
the IFRS measure most directly comparable to EBITDA, and for a reconciliation
of Adjusted EBITDA and Pro Forma Adjusted EBITDA to EBITDA. Distributable cash
flow is used to assess the level of cash flow generated from ongoing operations
and to evaluate the adequacy of internally generated cash flow to fund
dividends. See “Distributable Cash Flow” in the Company’s MD&A for a
reconciliation of distributable cash flow to cash flow from operations, the
IFRS measure most directly comparable to distributable cash flow. Investors are
encouraged to evaluate each adjustment and the reasons the Company considers it
appropriate for supplemental analysis. Investors are cautioned, however, that
these measures should not be construed as an alternative to net income
determined in accordance with IFRS as an indication of the Company’s
performance.

/T/

Selected Financial Information

Three months ended March 31,
——————————-
2017 2016(4)
————— —————

Continuing operations
Revenue $ 1,449,562 $ 906,227
Segment profit 86,766 63,747
Net (loss) income (9,908) 35,575
Basic and diluted (loss) earnings per share (0.07) 0.28
Adjusted EBITDA (2,3) 73,269 57,921
EBITDA (2,3) 34,344 95,486
Distributable cash flow (2,3) 41,780 16,544
Dividends declared 47,057 41,743
Cash flow from operating activities 102,008 59,354
Growth capital expenditures $ 25,165 $ 55,535

Combined operations (1)
Segment profit(1) $ 100,403 $ 80,221
Combined adjusted EBITDA (1, 2, 3) 86,906 74,043
Combined EBITDA (1, 2, 3) 223,345 111,960
Distributable cash flow (2, 3) $ 43,636 $ 31,850

As at March 31,
——————————-
2017 2016(4 )
————— —————
Ratios
Total and senior debt leverage ratio 3.4 3.8
Interest coverage ratio(5) 2.8 4.0

( 1)See discussion on non-GAAP measures on page 34 of the MD&A. Combined

segment profit, Adjusted EBITDA and EBITDA represent the aggregated
results of both continuing and discontinued operations which are
provided separately in this document.
(2) See discussion on non-GAAP measures on pages 18 to 23 and 34 of the
MD&A.
(3) See pages 28 and 18 to 23 of the MD&A for a reconciliation of
distributable cash flow to cash flow from operations and EBITDA to net
income (loss), respectively. Distributable cash flow from combined
operations include results from continuing and discontinued operations.
(4) Comparative period information has been restated to reflect the impact
of discontinued operations In accordance with the requirements of IFRS 5
– Non-current Assets Held for Sale and Discontinued Operations. Unless
otherwise stated, the Industrial Propane segment is referred to as
“Discontinued Operations”, and the remaining operations as “Continuing
Operations”, and the total discontinued and continuing operations as
“Combined Operations”.
(5) The interest coverage ratio as at March 31, 2017 does not reflect the
impact of interest expense savings from the refinancing as discussed in
the MD&A. Any benefits from future interest cost reductions will have a
positive impact on our debt ratios in future periods starting with Q2
2017.

/T/

– END RELEASE – 08/05/2017

For further information:
Tammi Price
Vice President Finance & Corporate Affairs
(403) 206-4212
[email protected]

COMPANY:
FOR: GIBSON ENERGY INC.
TSX SYMBOL: GEI

INDUSTRY: Energy and Utilities – Oil and Gas
RELEASE ID: 20170508CC0089

Press Release from Marketwired 1-866-736-3779

All press releases are written by the client and have NO affiliation with the news copy written by The Canadian Press. Any questions that arise due to the content or information provided in the press release should be directed to the company/organization
issuing the release, not to The Canadian Press.

GET ENERGYNOW’S DAILY EMAIL FOR FREE


Gibsons Declares Dividend

FOR: GIBSON ENERGY INC.
TSX SYMBOL: GEI

Date issue: May 08, 2017
Time in: 4:39 PM e

Attention:

CALGARY, ALBERTA–(Marketwired – May 8, 2017) –

All financial figures are in Canadian dollars

Gibson Energy Inc. (“Gibsons” or the “Company”) (TSX:GEI) announced today that
its Board of Directors has approved a quarterly dividend of $0.33 per common
share payable on July 17, 2017, to shareholders of record at the close of
business on June 30, 2017. This dividend is designated as an eligible dividend
for Canadian income tax purposes. For non-resident shareholders, Gibsons’
dividends are subject to Canadian withholding tax.

About Gibsons

Gibsons is a Canadian-based midstream energy company with operations in most of
the key hydrocarbon-rich basins in North America. For over 60 years, Gibsons
has delivered integrated midstream solutions to customers in the oil and gas
industry. With headquarters in Calgary, Alberta, the Company’s North American
operations include the storage, blending, processing, transportation, marketing
and distribution of crude oil, natural gas liquids and refined products. The
Company also provides oilfield waste and water management services.

Gibsons’ shares trade under the symbol GEI and are listed on the Toronto Stock
Exchange. For more information visit www.gibsons.com.

Forward-Looking Statements
Certain statements contained in this news release constitute forward-looking
information and statements (collectively, “forward-looking statements”)
including, but not limited to, statements concerning the Company’s future
payment of dividends and the amount thereof and management’s expectation with
respect to the Company’s business and financial prospects and opportunities.
These statements relate to future events or the Company’s future performance.
All statements other than statements of historical fact are forward-looking
statements. The use of any of the words “anticipate”, “plan”, “contemplate”,
“continue”, “estimate”, “expect”, “intend”, “propose”, “might”, “may”, “will”,
“shall”, “project”, “should”, “could”, “would”, “believe”, “predict”,
“forecast”, “pursue”, “potential” and “capable” and similar expressions are
intended to identify forward-looking statements. These statements involve known
and unknown risks, uncertainties and other factors that may cause actual
results or events to differ materially from those anticipated in such
forward-looking statements. No assurance can be given that these expectations
will prove to be correct and such forward-looking statements included in this
news release should not be unduly relied upon. These statements speak only as
of the date of this news release. In addition, this news release may contain
forward-looking statements and forward-looking information attributed to third
party industry sources. The Company does not undertake any obligations to
publicly update or revise any forward looking statements except as required by
securities law. Actual results could differ materially from those anticipated
in these forward-looking statements as a result of numerous risks and
uncertainties including, but not limited to, the risks and uncertainties
described in “Forward-Looking Statements” and “Risk Factors” included in the
Company’s Annual Information Form dated March 7, 2017 as filed on SEDAR and
available on the Gibsons website at www.gibsons.com.

– END RELEASE – 08/05/2017

For further information:
Tammi Price
Vice President Finance & Corporate Affairs
(403) 206-4212
[email protected]

COMPANY:
FOR: GIBSON ENERGY INC.
TSX SYMBOL: GEI

INDUSTRY: Energy and Utilities – Oil and Gas
RELEASE ID: 20170508CC0088

Press Release from Marketwired 1-866-736-3779

All press releases are written by the client and have NO affiliation with the news copy written by The Canadian Press. Any questions that arise due to the content or information provided in the press release should be directed to the company/organization
issuing the release, not to The Canadian Press.

GET ENERGYNOW’S DAILY EMAIL FOR FREE


Front Range Announces Montney Test Results at East Pepper, Alberta

FOR: FRONT RANGE RESOURCES LTD.
TSX VENTURE Symbol: FRK

Date issue: May 08, 2017
Time in: 4:11 PM e

Attention:

CALGARY, AB –(Marketwired – May 08, 2017) – Front Range Resources Ltd.
(“Front Range” or the “Company”) (TSX VENTURE: FRK) announces the results of
the second well in its horizontal Montney winter drilling program. Both wells
are located on the Company operated 44-section Pepper, Alberta land block
(100% W.I.) and represent frontier Montney discoveries, some 42 kilometres
from the next nearest producing horizontal Montney wells.

The Company’s first horizontal Montney well at East Pepper, Alberta has been
successfully completed and flow tested in the Basal Montney. The 100% W.I.
06-28-52-22W5 well (the “6-28 Well”) has confirmed the presence of natural gas
and 42 degrees light oil in this horizon. Reservoir quality appears to be
excellent (up to 6 to 9% porosity, 0.1 mD permeability) and open fractures
were noted in samples from the well. The Company believes that this
combination of reservoir quality and fracturing is responsible for the high
observed per frac productivity.

Over the last 24 hours of the 15 day flow test period, the 6-28 Well flowed at
an average rate of approximately 4.36 mmcf/d of natural gas (0.03% H2S) and
1.25 barrels per day of 42 degrees light oil at a flowing casing pressure of
6,187 kPa (897 psi). To date, load fluid volumes representing 47.5% of total
load fluid have been recovered. It is of note that free oil appeared only
after 42.9% of the load fluid was recovered. The reason for the difference in
oil production between the 6-28 Well and the Company’s 3-21 vertical well
drilled in October 2014 is being evaluated.

The 6-28 Well was drilled to a total measured depth of 4,385 metres (3,609
metres TVD) with a 671 metre horizontal leg in the Basal Montney. The 6-28
Well was completed with 10 fracs with an average of 47.8 tonnes of proppant
placed per stage.

Peter Cowling, President of Front Range, stated, “In my experience, it is
remarkable for a well to exhibit this kind of productivity from only a
10-stage completion, particularly this early in the delineation of a play.
These results confirm our view that the Pepper Montney play compares very
favourably with other established fields in terms of reservoir quality,
pressure, and productivity. Despite operational challenges encountered during
drilling that limited our lateral length and completion program, we are seeing
flow rates and pressures that are suggestive of a top-tier Montney resource.
Productivity per frac came in at 436 mcf per day (4,360 mcf divided by 10
stages), which stacks up very favourably against established deep basin
Montney fields with 60 or more wells. Determining per frac productivity and
confirming the presence of oil in the Basal Montney were key deliverables for
us in this well. Productivity per frac is an important metric in that it
indicates how we would expect total well productivity to scale in future wells
with longer laterals and higher stage counts”.

The table(1) below gives a comparison of our East Pepper test to latest
published results from other established Montney fields.

/T/

—————————————————————————-

Montney Field Stage Count IP30 mcfe/day per stage Area Well Count
—————————————————————————-
Pepper, Basal
Montney 10 436(2) 1
—————————————————————————-
Kakwa 38 316(3) 450
—————————————————————————-
Glacier 28 268(4) 108
—————————————————————————-
Bigstone 40 237(5) 86
—————————————————————————-
Simonette 71 118(6) 63
—————————————————————————-

/T/

/T/

1. Above information obtained from publicly available industry data. These

numbers are not necessarily typical of average wells in the areas but
represent the most recent results by the key industry participants in
the respective areas. IP30 mcfe/day per stage is not meant to represent
an economic comparison but is used as a comparison of different fields
per stage deliverability.
2. Final 24 hour average rate after 15 day flow test.
3. Seven Generations Energy Ltd. March 8, 2017 press release indicating
average stage count of 38 stages and average IP30 rate of 2,000 boe/day
on most recent 6 well pad.
4. Advantage Oil & Gas Ltd. May 2017 Corporate Presentation indicates
budget type curve of 7.5 mmcf/day and 28 stage frac for 3 Lower Montney
wells.
5. Delphi Energy Corp. May 2017 Corporate Presentation indicates recent
well drilled 13-15 IP30 rates of 1,579 boe/day with 40 stage completion
6. Cequence Energy Ltd. March 13, 2017 press release indicates 16-33-61-
27W5 well completed with 71 stage frac and 21% liquids. Public data
shows IP30 of 6.6 mmcf/day.

/T/

He added, “I believe that the first wells into a new play are seldom your
cheapest or your best. Accordingly, I have seen well costs drop and
productivity increase as Montney plays mature and I would expect the same
here. The difference in oil gravity and yield between the 6-28 Well and the
vertical 3-21 well suggests that there may be some compartmentalization in the
Basal Montney at this particular location, or it may mean that we just haven’t
recovered enough load fluid yet. We have identified several modest-cost
options that would allow us to further evaluate Montney gas and liquids
compositions in the immediate area. I’d like to thank everyone who has
supported us to this point and I look forward to updating shareholders on our
future plans in due course. Given the scale of the opportunity here, and in
light of the productivity potential identified in this Basal Montney well, we
are now evaluating multiple paths with respect to our next steps at Pepper.”

ADVISORY ON FORWARD-LOOKING STATEMENTS

The Company cautions that flow test results are not necessarily indicative of
long-term performance or of ultimate recovery.

This news release contains certain forward-looking information and statements
(“forward-looking statements”) within the meaning of applicable securities
laws. In particular, but without limiting the foregoing, this news release
contains statements concerning the productivity per frac of the 6-28 Well, the
evaluation of the difference in oil production between the 6-28 Well and the
Company’s 3-21 vertical well, expectations regarding costs and productivity of
future wells as the Montney play matures, further evaluation of the Montney
gas and liquids compositions in the immediate area and the evaluation of
multiple paths with respect to next steps at the Company’s Pepper Montney
play.

Forward-looking statements are based on a number of material factors,
expectations or assumptions of the Company which have been used to develop
such statements and information but which may prove to be incorrect. Although
the Company believes that the expectations reflected in these forward-looking
statements are reasonable, undue reliance should not be placed on them because
the Company can give no assurance that they will prove to be correct. Since
forward-looking statements address future events and conditions, by their very
nature they involve inherent risks and uncertainties, including but not
limited to: whether the Company’s exploration and development activities
respecting its prospects will be successful or that material volumes of
petroleum and natural gas reserves will be encountered, or if encountered can
be produced on a commercial basis; the ultimate size and scope of any
hydrocarbon bearing formations on its lands; that drilling operations on its
lands will be successful such that further development activities in these
areas are warranted; that the Company will continue to conduct its operations
in a manner consistent with past operations; results from drilling and
development activities will be consistent with past operations; the general
stability of the economic and political environment in which the Company
operates; drilling results; field production rates and decline rates; the
general continuance of current industry conditions; the timing and cost of
pipeline, storage and facility construction and expansion and the ability of
the Company to secure adequate product transportation; future commodity
prices; currency, exchange and interest rates; regulatory framework regarding
royalties, taxes and environmental matters in the jurisdictions in which the
Company operates; and the ability of the Company to successfully market its
oil and natural gas products; changes in commodity prices; changes in the
demand for or supply of the Company’s products; unanticipated operating
results or production declines; changes in tax or environmental laws, changes
in development plans of the Company or by third party operators of the
Company’s properties, increased debt levels or debt service requirements;
inaccurate estimation of the Company’s oil and gas reserve and resource
volumes; limited, unfavourable or a lack of access to capital markets;
increased costs; a lack of adequate insurance coverage; the impact of
competitors; and certain other risks detailed from time-to-time in the
Company’s public disclosure documents. Additional information regarding some
of these risks, expectations or assumptions and other factors may be found
under in the Company’s Annual Information Form for the year ended December 31,
2016 and the Company’s Management’s Discussion and Analysis prepared for the
year ended December 31, 2016. The reader is cautioned not to place undue
reliance on these forward-looking statements. The forward-looking statements
contained in this news release are made as of the date hereof and the Company
undertakes no obligations to update publicly or revise any forward-looking
statements, whether as a result of new information, future events or
otherwise, unless so required by applicable securities laws.

In this news release the calculation of barrels of oil equivalent (boe) is
calculated at a conversion rate of six thousand cubic feet (6 mcf) of natural
gas for one barrel (bbl) of oil based on an energy equivalency conversion
method. Boes may be misleading particularly if used in isolation. A boe
conversion ratio of 6 mcf: 1 bbl is based on an energy equivalency conversion
method primarily applicable to the burner tip and does not represent a value
equivalency at the wellhead. Given that the value ratio based on the current
price of crude oil as compared to natural gas is significantly different from
the energy equivalency of 6:1, utilizing a conversion on a 6:1 basis may be
misleading as an indication of value.

NEITHER TSX VENTURE EXCHANGE NOR ITS REGULATION SERVICES PROVIDER (AS THAT
TERM IS DEFINED IN THE POLICIES OF THE TSX VENTURE EXCHANGE) ACCEPTS
RESPONSIBILITY FOR THE ADEQUACY OR ACCURACY OF THIS NEWS RELEASE.

– END RELEASE – 08/05/2017

For further information:

For further information, please contact:

Peter Cowling
President
Tel: 403-262-1700

Gordon Mayr
Chief Operating Officer
Tel: 587-955-8873

Email: [email protected]

SUITE 700, 717 SEVENTH AVENUE SOUTHWEST
CALGARY, ALBERTA, T2P 0Z3
TEL: 403-237-5700
FAX: 403-265-3506

COMPANY:
FOR: FRONT RANGE RESOURCES LTD.
TSX VENTURE Symbol: FRK

INDUSTRY: Energy and Utilities – Oil and Gas
RELEASE ID: 20170508CC016

Press Release from Marketwired 1-866-736-3779

All press releases are written by the client and have NO affiliation with the news copy written by The Canadian Press. Any questions that arise due to the content or information provided in the press release should be directed to the company/organization
issuing the release, not to The Canadian Press.

GET ENERGYNOW’S DAILY EMAIL FOR FREE


Appointments announced to Board of Directors, EPCOR Utilities Inc.

FOR: EPCOR UTILITIES INC.
Date issue: May 08, 2017Time in: 2:00 PM eAttention:
EDMONTON, ALBERTA–(Marketwired – May 8, 2017) – EPCOR Utilities Inc. (EPCOR)
is pleased to announce the appointments of Richard H. Cruickshank, Q.C., and
Janice G. Rennie,…

GET ENERGYNOW’S DAILY EMAIL FOR FREE


Westcoast Energy and Union Gas Declare Dividends

FOR: ENBRIDGE INC.TSX SYMBOL: ENBNYSE SYMBOL: ENBDate issue: May 08, 2017Time in: 11:54 AM eAttention:
CALGARY, ALBERTA–(Marketwired – May 8, 2017) – Enbridge Inc.
(TSX:ENB)(NYSE:ENB) (Enbridge or the Company), announced today that Westcoast
Energy I…

GET ENERGYNOW’S DAILY EMAIL FOR FREE


Pennine appoints Global Oil Management Group’s Harry Sargeant IV to Board of Directors

FOR: PENNINE PETROLEUM CORPORATION
TSX VENTURE SYMBOL: PNN

Date issue: May 08, 2017
Time in: 7:01 AM e

Attention:

CALGARY, ALBERTA–(Marketwired – May 8, 2017) – Pennine Petroleum Corporation
(TSX VENTURE:PNN) (“Pennine” or the “Corporation”) is pleased to announce the
appointment of Mr. Harry Sargeant IV to its Board of Directors. Mr. Sargeant
will be instrumental in the continuing development of the Velca Block in
Albania.

Mr. Sargeant is Vice President of Global Oil Management Group Ltd. (“GOMG”), a
Boca Raton, Florida-based international oil corporation.

GOMG, through its subsidiary Ionian Refining & Trading Company Ltd. (“IRTC”),
is a leading independent energy firm with operations in Albania, as well as
Texas and Alabama.

GOMG and IRTC have recently adopted a strategy to reconsolidate and upgrade
Albania’s oil refinery system. GOMG is affiliated with the Ballsh and Fier
refineries in southern Albania.

Mr. Sargeant is a graduate of Florida State University and obtained his Masters
of Business Administration (Marketing) from American University Cairo.

The Corporation also announces the granting of 500,000 stock options with an
exercise price of $0.06 for a period of five years.

This appointment and the stock option grant are subject to TSX Venture Exchange
approval.

About Pennine Petroleum Corporation: Pennine Petroleum Corporation is an
emerging oil and gas exploration and development company (www.penninecorp.com)
currently active in Albania, and the Canadian provinces of Alberta and
Saskatchewan.

Neither TSX Venture Exchange nor its Regulation Services Provider (as that term
is defined in the policies of the TSX Venture Exchange) accepts responsibility
for the adequacy or accuracy of this release.

– END RELEASE – 08/05/2017

For further information:
Pennine Petroleum Corporation
N. Desmond Smith
403.277.4421
403.277.4439 (FAX)
[email protected]
OR
Dean Stuart
403.617.7609
[email protected]

COMPANY:
FOR: PENNINE PETROLEUM CORPORATION
TSX VENTURE SYMBOL: PNN

INDUSTRY: Energy and Utilities – Oil and Gas
RELEASE ID: 20170508CC0021

Press Release from Marketwired 1-866-736-3779

All press releases are written by the client and have NO affiliation with the news copy written by The Canadian Press. Any questions that arise due to the content or information provided in the press release should be directed to the company/organization
issuing the release, not to The Canadian Press.

GET ENERGYNOW’S DAILY EMAIL FOR FREE


Trican and Canyon Announce Transaction Update

FOR: TRICAN WELL SERVICE LTD.TSX SYMBOL: TCWAND CANYON SERVICES GROUP INC.TSX SYMBOL: FRCDate issue: May 08, 2017Time in: 7:00 AM eAttention:
CALGARY, ALBERTA–(Marketwired – May 8, 2017) – Trican Well Service Ltd.
(“Trican”) (TSX:TCW) and Canyon Serv…

GET ENERGYNOW’S DAILY EMAIL FOR FREE


Canadian Overseas Petroleum Reports Q1 2017 Results

FOR: CANADIAN OVERSEAS PETROLEUM LTD
TSX VENTURE SYMBOL: XOP
LSE SYMBOL: COPL

Date issue: May 08, 2017
Time in: 2:00 AM e

Attention:

CALGARY, AB–(Marketwired – May 07, 2017) – Canadian Overseas Petroleum
Limited (TSX VENTURE: XOP) (LSE: COPL)

(TSX-V: XOP)

Canadian Overseas Petroleum
Reports Q1 2017 Results

Calgary, Canada, May 5, 2017 – Canadian Overseas Petroleum Limited (“COPL” or
the “Company”) (TSX-V: XOP; LSE: COPL), an international oil and gas
exploration and development company focused on offshore West Africa, announces
its results for the first quarter ended March 31, 2017.

The Company continues to interpret the data collected from the Mesurado-1 well
drilled at LB-13, in December 2016. Meanwhile, through COPL’s partnership with
Shoreline Energy, the Company continues to source funds for the first drill at
OPL 226, offshore Nigeria. To this end the Company has engaged COFARCO SAS of
Paris France and Zeus Capital of London United Kingdom to source the required
funds. COPL remains confident that it will meet the target drilling of an
appraisal well in late 2017.

Click on, or paste the following link into your web browser, to view the
associated PDF document.
http://www.rns-pdf.londonstockexchange.com/rns/4023E_1-2017-5-8.pdf

For further information, please contact:

/T/
Mr. Arthur Millholland, President & CEO
Canadian Overseas Petroleum Limited
Tel: + 1 (403) 262 5441

Cathy Hume
CHF Investor Relations
Tel: +1 (416) 868 1079 ext. 231
Email: [email protected]

Harriet Jackson/Charles Goodwin
Yellow Jersey PR Limited
Tel: +44 (0) 75 4427 5882
Email: [email protected]

Broker: London Stock Exchange
Shore Capital Stockbrokers Limited
Edward Mansfield
Phone: T: +44 20 7468 7906
/T/

This information is provided by RNS
The company news service from the London Stock Exchange

END

– END RELEASE – 08/05/2017

For further information:
RNS
Customer Services
0044-207797-4400
[email protected]
http://www.rns.com

COMPANY:
FOR: CANADIAN OVERSEAS PETROLEUM LTD
TSX VENTURE SYMBOL: XOP
LSE SYMBOL: COPL

INDUSTRY: Energy and Utilities – Oil and Gas
RELEASE ID: 20170508CC0005

Press Release from Marketwired 1-866-736-3779

All press releases are written by the client and have NO affiliation with the news copy written by The Canadian Press. Any questions that arise due to the content or information provided in the press release should be directed to the company/organization
issuing the release, not to The Canadian Press.

GET ENERGYNOW’S DAILY EMAIL FOR FREE


Enerflex Announces Election of Board of Directors

FOR: ENERFLEX LTD.
TSX SYMBOL: EFX

Date issue: May 05, 2017
Time in: 8:17 PM e

Attention:

CALGARY, ALBERTA–(Marketwired – May 5, 2017) – Enerflex Ltd. (TSX:EFX)
(“Enerflex” or the “Company”), is pleased to announce that all of the nominees
listed in its management information circular dated March 6, 2017 were elected
as directors of Enerflex Ltd. until the next annual meeting of shareholders.
The detailed results of the vote held earlier today are set out below.

Election of Directors

On a vote by ballot, each of the following seven nominees proposed by
management was elected as a director of Enerflex.

/T/

—————————————————————————-

Votes
Nominee Votes For % For Withheld % Withheld
—————————————————————————-
Robert S. Boswell 64,881,156 98.85 757,908 1.15
—————————————————————————-
W. Byron Dunn 65,008,618 99.04 630,446 0.96
—————————————————————————-
J. Blair Goertzen 65,626,800 99.98 12,264 0.02
—————————————————————————-
H. Stanley Marshall 65,011,768 99.04 627,296 0.96
—————————————————————————-
Stephen J. Savidant 65,575,968 99.90 63,096 0.10
—————————————————————————-
Michael A. Weill 65,098,718 99.18 540,346 0.82
—————————————————————————-
Helen J. Wesley 65,618,290 99.97 20,774 0.03
—————————————————————————-

/T/

About Enerflex

Enerflex Ltd. is a single source supplier of natural gas compression, oil and
gas processing, refrigeration systems, and electric power generation equipment
– plus related engineering and mechanical service expertise. The Company’s
broad in-house resources provide the capability to engineer, design,
manufacture, construct, commission, and service hydrocarbon handling systems.
Enerflex’s expertise encompasses field production facilities, compression and
natural gas processing plants, refrigeration systems, and electric power
equipment servicing the natural gas production industry.

Headquartered in Calgary, Canada, Enerflex has approximately 1,800 employees
worldwide. Enerflex, its subsidiaries, interests in associates and
joint-ventures operate in Canada, the United States, Argentina, Bolivia,
Brazil, Colombia, Mexico, Peru, Australia, the United Kingdom, the United Arab
Emirates, Oman, Bahrain, Indonesia, Malaysia, and Thailand. Enerflex’s shares
trade on the Toronto Stock Exchange under the symbol “EFX”. For more
information about Enerflex, go to www.enerflex.com.

– END RELEASE – 05/05/2017

For further information:
Enerflex Ltd.
J. Blair Goertzen
President & Chief Executive Officer
403.236.6852
OR
Enerflex Ltd.
D. James Harbilas
Executive Vice President & Chief Financial Officer
403.236.6857
www.enerflex.com

COMPANY:
FOR: ENERFLEX LTD.
TSX SYMBOL: EFX

INDUSTRY: Energy and Utilities – Equipment, Energy and Utilities –
Oil and Gas
RELEASE ID: 20170505CC0079

Press Release from Marketwired 1-866-736-3779

All press releases are written by the client and have NO affiliation with the news copy written by The Canadian Press. Any questions that arise due to the content or information provided in the press release should be directed to the company/organization
issuing the release, not to The Canadian Press.

GET ENERGYNOW’S DAILY EMAIL FOR FREE


Exito Energy II Inc. and Good Life Networks Inc. Announce That Each Will Mail Addendum to Meeting Materials to Correct Typographic Error

FOR: EXITO ENERGY II INC.TSX VENTURE SYMBOL: EXI.PDate issue: May 05, 2017Time in: 6:41 PM eAttention:
CALGARY, ALBERTA–(Marketwired – May 5, 2017) –
NOT FOR DISSEMINATION IN THE UNITED STATES OR FOR DISTRIBUTION TO U.S. WIRE
SERVICES
Exito Energy II…

GET ENERGYNOW’S DAILY EMAIL FOR FREE


TransCanada Announces 2017 Annual Meeting Board of Director Election Results

FOR: TRANSCANADA
TSX SYMBOL: TRP
NYSE SYMBOL: TRP

Date issue: May 05, 2017
Time in: 6:27 PM e

Attention:

CALGARY, ALBERTA–(Marketwired – May 5, 2017) – TransCanada Corporation
(TSX:TRP) (NYSE:TRP) (TransCanada) today announced approval by its shareholders
of the appointment of the 12 nominees as directors of TransCanada. At its 2017
annual meeting of shareholders held earlier today, each of the following 12
nominees were elected as directors of TransCanada on a vote by ballot to serve
until the next annual meeting of shareholders of TransCanada, or until their
successors are elected or earlier appointed:

/T/

# Votes % Votes
Nominee # Votes For % Votes For Withheld Withheld
Kevin E. Benson 490,849,677 99.70 1,490,399 0.30
Derek H. Burney 490,454,317 99.62 1,879,641 0.38
Stephan Cretier 491,105,654 99.75 1,235,741 0.25
Russell K. Girling 491,216,793 99.77 1,125,652 0.23
S. Barry Jackson 488,982,397 99.32 3,357,679 0.68
John E. Lowe 491,289,678 99.79 1,044,280 0.21
Paula Rosput
Reynolds 488,695,671 99.26 3,646,771 0.74
Mary Pat Salomone 490,611,527 99.65 1,730,918 0.35
Indira Samarasekera 491,121,319 99.75 1,218,760 0.25
D. Michael G.
Stewart 490,975,180 99.72 1,358,778 0.28
Siim A. Vanaselja 460,603,007 93.55 31,739,438 6.45
Richard E. Waugh 490,705,701 99.67 1,636,741 0.33

/T/

Final voting results on all matters voted on at the meeting will be filed on
SEDAR (www.sedar.com) and EDGAR (www.sec.gov) and posted to the Investor Centre
section of the company website at www.transcanada.com by no later than Tuesday,
May 9, 2017.

With more than 65 years’ experience, TransCanada is a leader in the responsible
development and reliable operation of North American energy infrastructure
including natural gas and liquids pipelines, power generation and gas storage
facilities. TransCanada operates a network of natural gas pipelines that
extends more than 91,500 kilometres (56,900 miles), tapping into virtually all
major gas supply basins in North America. TransCanada is the continent’s
leading provider of gas storage and related services with 653 billion cubic
feet of storage capacity. A large independent power producer, TransCanada
currently owns or has interests in over 10,100 megawatts of power generation in
Canada and the United States. TransCanada is also the developer and operator of
one of North America’s leading liquids pipeline systems that extends over 4,300
kilometres (2,700 miles), connecting growing continental oil supplies to key
markets and refineries. TransCanada’s common shares trade on the Toronto and
New York stock exchanges under the symbol TRP. Visit TransCanada.com and our
blog to learn more, or connect with us on social media and 3BL Media.

FORWARD LOOKING INFORMATION

This publication contains certain information that is forward-looking and is
subject to important risks and uncertainties (such statements are usually
accompanied by words such as “anticipate”, “expect”, “believe”, “may”, “will”,
“should”, “estimate”, “intend” or other similar words). Forward-looking
statements in this document are intended to provide TransCanada security
holders and potential investors with information regarding TransCanada and its
subsidiaries, including management’s assessment of TransCanada’s and its
subsidiaries’ future plans and financial outlook. All forward-looking
statements reflect TransCanada’s beliefs and assumptions based on information
available at the time the statements were made and as such are not guarantees
of future performance. Readers are cautioned not to place undue reliance on
this forward-looking information, which is given as of the date it is expressed
in this news release, and not to use future-oriented information or financial
outlooks for anything other than their intended purpose. TransCanada undertakes
no obligation to update or revise any forward-looking information except as
required by law. For additional information on the assumptions made, and the
risks and uncertainties which could cause actual results to differ from the
anticipated results, refer to the Quarterly Report to Shareholders dated May 4,
2017 and 2016 Annual Report filed under TransCanada’s profile on SEDAR at
www.sedar.com and with the U.S. Securities and Exchange Commission at
www.sec.gov.

– END RELEASE – 05/05/2017

For further information:
TransCanada Media Enquiries:
Mark Cooper / James Millar
403.920.7859 or 800.608.7859
OR
TransCanada Investor & Analyst Enquiries:
David Moneta / Stuart Kampel
403.920.7911 or 800.361.6522

COMPANY:
FOR: TRANSCANADA
TSX SYMBOL: TRP
NYSE SYMBOL: TRP

INDUSTRY: Energy and Utilities – Oil and Gas
RELEASE ID: 20170505CC0074

Press Release from Marketwired 1-866-736-3779

All press releases are written by the client and have NO affiliation with the news copy written by The Canadian Press. Any questions that arise due to the content or information provided in the press release should be directed to the company/organization
issuing the release, not to The Canadian Press.

GET ENERGYNOW’S DAILY EMAIL FOR FREE


Trilogy Energy Corp. Announces Date for Release of First Quarter 2017 Financials and Operating Results, and Annual Meeting of Shareholders to be Webcast

FOR: TRILOGY ENERGY CORP.TSX SYMBOL: TETDate issue: May 05, 2017Time in: 6:08 PM eAttention:
CALGARY, ALBERTA–(Marketwired – May 5, 2017) – Trilogy Energy Corp.
(“Trilogy”) (TSX:TET) is pleased to announce the date for release of its
financial and op…

GET ENERGYNOW’S DAILY EMAIL FOR FREE


Vopak and AltaGas to jointly invest in Propane Export Terminal in Canada

FOR: ALTAGAS LTD.TSX SYMBOL: ALAAND ROYAL VOPAK
Date issue: May 05, 2017Time in: 5:35 PM eAttention:
CALGARY, ALBERTA–(Marketwired – May 5, 2017) – Royal Vopak and AltaGas Ltd.
(AltaGas) (TSX:ALA) announced today that they have entered into a joint v…

GET ENERGYNOW’S DAILY EMAIL FOR FREE


Husky Energy Reports Voting Results from 2017 Annual Meeting of Shareholders

FOR: HUSKY ENERGY INC.
TSX Symbol: HSE

Date issue: May 05, 2017
Time in: 4:44 PM e

Attention:

CALGARY, AB –(Marketwired – May 05, 2017) – Husky Energy Inc. (TSX: HSE)
announced at its Annual Meeting of Shareholders, held on May 5, 2017, the
election of 16 nominees proposed for its Board of Directors and the
appointment of the Corporation’s auditors as listed in the Management
Information Circular dated March 13, 2017.

Following a resolution by ballot, KPMG LLP was appointed as auditors of the
Corporation until the 2018 Annual Meeting of Shareholders.

/T/

Votes For Votes Withheld

Nominee Number Percent(%) Number Percent(%)
—————— ———– ———- ———– ———-
Victor T.K Li 808,792,125 90.76 82,320,536 9.24
Canning K.N. Fok 800,695,264 89.85 90,417,397 10.15
William Shurniak 882,226,602 99.00 8,886,059 1.00
Robert J. Peabody 884,258,330 99.23 6,854,331 0.77
Stephen E. Bradley 887,428,578 99.59 3,684,083 0.41
Asim Ghosh 881,918,101 98.97 9,194,560 1.03
Martin J.G. Glynn 878,504,175 98.59 12,608,486 1.41
Poh Chan Koh 883,613,699 99.16 7,498,962 0.84
Eva L. Kwok 881,069,455 98.87 10,043,206 1.13
Stanley T.L. Kwok 882,971,227 99.09 8,141,434 0.91
Frederick S.H. Ma 888,107,118 99.66 3,005,543 0.34
George C. Magnus 887,395,336 99.58 3,717,325 0.42
Neil D. McGee 884,129,460 99.22 6,983,201 0.78
Colin S. Russel 853,971,483 95.83 37,141,178 4.17
Wayne E. Shaw 881,333,516 98.90 9,779,145 1.10
Frank J. Sixt 837,701,158 94.01 53,411,503 5.99

Number Percent(%) Number Percent(%)
———– ———- ———– ———-
Appointment of
KPMG LLP as
auditors 882,956,146 99.08 8,156,515 0.92

/T/

Husky Energy is a Canadian-based integrated energy company. It is
headquartered in Calgary, Alberta, Canada and its shares are publicly traded
on the Toronto Stock Exchange under the symbols HSE, HSE.PR.A, HSE.PR.B,
HSE.PR.C, HSE.PR.E and HSE.PR.G. More information is available at
www.huskyenergy.com

– END RELEASE – 05/05/2017

For further information:

For further information, please contact:

Investor Inquiries:

Rob Knowles
Manager, Investor Relations
Husky Energy Inc.
587-747-2116

Media Inquiries:

Mel Duvall
Manager, Media & Issues
Husky Energy Inc.
403-513-7602

COMPANY:
FOR: HUSKY ENERGY INC.
TSX Symbol: HSE

INDUSTRY: Energy and Utilities – Oil and Gas
RELEASE ID: 20170505CC013

Press Release from Marketwired 1-866-736-3779

All press releases are written by the client and have NO affiliation with the news copy written by The Canadian Press. Any questions that arise due to the content or information provided in the press release should be directed to the company/organization
issuing the release, not to The Canadian Press.

GET ENERGYNOW’S DAILY EMAIL FOR FREE


Husky reports $71M Q1 profit, cites market uncertainty in dividend restart delay

CALGARY — Husky Energy says the company will continue to delay reinstating its dividend because of uncertainty in the oil markets and recently slumping world crude prices.

Some analysts had predicted the Calgary-based energy company would use the release of its first-quarter results Friday to reinstate the dividend it cancelled in late 2015 because of low oil prices.

However chief executive Rob Peabody said while Husky (TSX:HSE) has its net debt under control and is generating enough free cash flow, it’s unclear whether commodity prices going forward will support a sustainable dividend.

“There’s uncertainty around whether an extension of the OPEC (Organization of Petroleum Exporting Countries) cuts, if in fact they are extended, will be enough to offset the impact of growing U.S. shale production,” Peabody said.

“In short, the market’s not yet stable or in balance.”

Peabody said he’s also concerned about whether President Donald Trump’s administration will erect trade barriers to Canadian oil exports to the U.S.

Benchmark West Texas Intermediate oil prices have fallen from just under US$55 per barrel to just over US$46 dollars in the past month.

In a report earlier this week, GMP FirstEnergy commodity analyst Martin King said oil prices “continue to trend sideways” as traders are confused over whether oil inventories in the U.S. and around the world will tighten and lead to higher oil prices.

Husky said Friday it earned $71 million or six cents per share in the first quarter on higher commodity prices and improved refining margins, versus a loss of $458 million or 47 cents per share a year ago.

Gross revenue totalled $4.58 billion, up from $2.68 billion a year ago.

Production in the quarter averaged 334,000 oil-equivalent barrels per day.


Follow @HealingSlowly on Twitter.

Dan Healing, The Canadian Press

GET ENERGYNOW’S DAILY EMAIL FOR FREE


TransCanada CEO says no firm timeline yet for Keystone XL, Energy East

CALGARY — TransCanada Corp. (TSX:TRP) is still not prepared to offer a firm timeline for the completion of the Keystone XL pipeline, its top executive said on Friday, even after U.S. President Donald Trump granted the project a permit in March.

TransCanada CEO Russ Girling said that both the proposed Keystone XL and Energy East projects, which are fiercely opposed by many environmentalists, sit in the company’s longer-term bucket because of the difficulty of getting them done.

“We’ve been at them for a long time, so it’s hard to say with any credibility that we’re going to get it done by a date,” he told the company’s annual general meeting.

Girling said TransCanada will instead look to its multitude of projects in the $500 million to $1 billion dollar range – which he said are are much easier to permit – to help deliver its projected eight to 10 per cent dividend growth through the rest of the decade.

“What’s driving our growth and the focus of the company is the $23 billion of things that we’ve got under construction, and the organic growth that’s naturally going to come from that activity,” he said.

The cautious approach comes even as Keystone XL looks more possible than it has in years given Trump’s support. Trump’s predecessor, Barack Obama, rejected the project in 2015 after environmentalists argued it would spur the development of Alberta’s oil sands and worsen climate change.

The pipeline still faces a regulatory challenge in Nebraska, where there has been significant landowner opposition, in part because of concerns about the risk of contamination of a major aquifer.

TransCanada expects hearings in the state to begin in August, with a final decision in November, while it also continues to work on some federal permits and updating shipping contracts on the line.

Energy East is further behind, still waiting for Canada’s National Energy Board to set new hearing dates for the review.

Girling said the company would increase its public relations outreach as it works to push the projects forward, including increased industry co-ordination and a new website designed to be more accessible to a younger demographic.

The industry “hasn’t done a great job itself of telling its story,” he said.

The efforts on oil pipelines come as TransCanada’s other segments showed strong returns in the last quarter, with the company’s US$13-billion acquisition of natural gas transporter Columbia Pipeline Group helping to more than double profits from a year ago.

The company reported net income of $643 million, or 74 cents per share, for the quarter ended March 31, up from $252 million, or 36 cents per share, a year ago.

Revenue was $3.39 billion, up from $2.5 billion in the first quarter of 2016 and about $200 million above analyst estimates, as both its U.S. and Mexico-based natural gas segments performed well.

After adjustments, TransCanada’s comparable earnings were 81 cents per share for its most recent quarter.

Analysts had expected 74 cents per share, according to Thomson Reuters data.

Ian Bickis, The Canadian Press

GET ENERGYNOW’S DAILY EMAIL FOR FREE


Major Pipeline Projects Inject Some Much Needed Hope in the Oilpatch – MNP LLP

Major pipeline project announcements in Canada and the U.S. have injected some much-needed relief into the oil and gas industry. Three major projects; the Enbridge Line 3, Keystone XL and Trans Mountain expansion, could open more markets for Canadian crude and construction opportunities. “There’s a general cautious optimism,” says Rob Beamish, executive director of the Canadian Energy Pipeline Association … Read more

GET ENERGYNOW’S DAILY EMAIL FOR FREE


Marketing for Energy Service Providers (B2B) & Consumer Marketing is Not the Same: Here’s Why

Marketing doesn’t work. Probably not the introduction you expected for an energy services marketing article. However, it’s a statement we hear from energy companies on a regular basis. Many small to medium sized energy businesses are hesitant to invest in marketing efforts simply because they fail to see any measurable return on investment. In many … Read more

GET ENERGYNOW’S DAILY EMAIL FOR FREE


TransCanada Declares Quarterly Dividends

FOR: TRANSCANADA
TSX SYMBOL: TRP
NYSE SYMBOL: TRP

Date issue: May 05, 2017
Time in: 7:31 AM e

Attention:

CALGARY, ALBERTA–(Marketwired – May 5, 2017) – News Release – TransCanada
Corporation (TSX:TRP)(NYSE:TRP) (TransCanada or the Company) today announced
that the Board of Directors (Board) of TransCanada declared a quarterly
dividend of $0.625 per common share for the quarter ending June 30, 2017, on
the Company’s outstanding common shares. The common share dividend is payable
on July 31, 2017 to shareholders of record at the close of business on June 30,
2017.

The Board also declared quarterly dividends on the outstanding Cumulative First
Preferred Shares as follows:

/T/

— For the period up to but excluding June 30, 2017, payable on June 30,

2017, to shareholders of record at the close of business on May 31,
2017:
— Series 1 – $0.204125 per share
— Series 2 – $0.14958904 per share
— Series 3 – $0.1345 per share
— Series 4 – $0.10969863 per share

— For the period up to but excluding July 30, 2017, payable on July 31,

2017, to shareholders of record at the close of business on June 30,
2017:
— Series 5 – $0.14143750 per share
— Series 6 – $0.12796096 per share
— Series 7 – $0.25 per share
— Series 9 – $0.265625 per share

— For the period up to but excluding May 31, 2017, payable on May 31,

2017, to shareholders of record at the close of business on May 16,
2017:
— Series 11 – $0.2375 per share
— Series 13 – $0.34375 per share
— Series 15 – $0.30625 per share

/T/

These dividends are designated by TransCanada to be eligible dividends for
purposes of the Income Tax Act (Canada) and any similar provincial or
territorial legislation. An enhanced dividend tax credit applies to eligible
dividends paid to Canadian residents.

The Board also approved the issuance of common shares from treasury at a two
per cent discount under TransCanada’s Dividend Reinvestment Plan (DRP). Under
the DRP, investors holding TransCanada common or preferred shares can receive
common shares instead of cash dividend payments. For further details, including
how to enroll in the program, please refer to
http://www.transcanada.com/drip.html.

With more than 65 years’ experience, TransCanada is a leader in the responsible
development and reliable operation of North American energy infrastructure
including natural gas and liquids pipelines, power generation and gas storage
facilities. TransCanada operates a network of natural gas pipelines that
extends more than 91,500 kilometres (56,900 miles), tapping into virtually all
major gas supply basins in North America. TransCanada is the continent’s
leading provider of gas storage and related services with 653 billion cubic
feet of storage capacity. A large independent power producer, TransCanada
currently owns or has interests in over 10,100 megawatts of power generation in
Canada and the United States. TransCanada is also the developer and operator of
one of North America’s leading liquids pipeline systems that extends over 4,300
kilometres (2,700 miles), connecting growing continental oil supplies to key
markets and refineries. TransCanada’s common shares trade on the Toronto and
New York stock exchanges under the symbol TRP. Visit TransCanada.com and our
blog to learn more, or connect with us on social media and 3BL Media.

FORWARD LOOKING INFORMATION

This publication contains certain information that is forward-looking and is
subject to important risks and uncertainties (such statements are usually
accompanied by words such as “anticipate”, “expect”, “believe”, “may”, “will”,
“should”, “estimate”, “intend” or other similar words). Forward-looking
statements in this document are intended to provide TransCanada security
holders and potential investors with information regarding TransCanada and its
subsidiaries, including management’s assessment of TransCanada’s and its
subsidiaries’ future plans and financial outlook. All forward-looking
statements reflect TransCanada’s beliefs and assumptions based on information
available at the time the statements were made and as such are not guarantees
of future performance. Readers are cautioned not to place undue reliance on
this forward-looking information, which is given as of the date it is expressed
in this news release, and not to use future-oriented information or financial
outlooks for anything other than their intended purpose. TransCanada undertakes
no obligation to update or revise any forward-looking information except as
required by law. For additional information on the assumptions made, and the
risks and uncertainties which could cause actual results to differ from the
anticipated results, refer to the Quarterly Report to Shareholders dated May 4,
2017 and 2016 Annual Report filed under TransCanada’s profile on SEDAR at
www.sedar.com and with the U.S. Securities and Exchange Commission at
www.sec.gov.

– END RELEASE – 05/05/2017

For further information:
TransCanada Media Enquiries:
Mark Cooper / James Millar
403.920.7859 or 800.608.7859
OR
TransCanada Investor & Analyst Enquiries:
David Moneta / Stuart Kampel
403.920.7911 or 800.361.6522

COMPANY:
FOR: TRANSCANADA
TSX SYMBOL: TRP
NYSE SYMBOL: TRP

INDUSTRY: Energy and Utilities – Oil and Gas
RELEASE ID: 20170505CC0008

Press Release from Marketwired 1-866-736-3779

All press releases are written by the client and have NO affiliation with the news copy written by The Canadian Press. Any questions that arise due to the content or information provided in the press release should be directed to the company/organization
issuing the release, not to The Canadian Press.

GET ENERGYNOW’S DAILY EMAIL FOR FREE


TransCanada Reports First Quarter 2017 Financial Results; Strong Results Build Upon Transformational 2016 – Part 2

Non-GAAP Measures

This news release contains references to non-GAAP measures, including
comparable earnings, comparable EBITDA, comparable distributable cash flow,
comparable funds generated from operations, comparable earnings per share and
comparable distributable cash flow per share, that do not have any standardized
meaning as prescribed by U.S. GAAP and therefore are unlikely to be comparable
to similar measures presented by other companies. These non-GAAP measures are
calculated on a consistent basis from period to period and are adjusted for
specific items in each period, as applicable. For more information on non-GAAP
measures, refer to TransCanada’s Quarterly Report to Shareholders dated May 4,
2017.

/T/

First quarter 2017 financial highlights

—————————————————————————-
—————————————————————————-

three months ended March 31
——————————
(unaudited – millions of $, except per share
amounts) 2017 2016
—————————————————————————-
—————————————————————————-

Income
Revenues 3,391 2,503
Net income attributable to common shares 643 252
per common share – basic and diluted $0.74 $0.36
Comparable EBITDA(1) 1,977 1,502
Comparable earnings(1) 698 494
per common share(1) $0.81 $0.70

Cash flows
Net cash provided by operations 1,302 1,081
Comparable funds generated from operations(1) 1,508 1,249
Comparable distributable cash flow(1) 1,222 974
per common share(1) $1.41 $1.39
Capital spending
– capital expenditures 1,560 836
– projects in development 42 67
Contributions to equity investments 192 170
Acquisitions, net of cash acquired – 995
Proceeds from sale of assets, net of
transaction costs – 6

Dividends declared
Per common share $0.625 $0.565
Basic common shares outstanding (millions)
Average for the period 866 702
End of period 867 702
—————————————————————————-
—————————————————————————-
(1) Comparable EBITDA, comparable earnings, comparable earnings per common
share, comparable funds generated from operations, comparable
distributable cash flow and comparable distributable cash flow per
common share are all non-GAAP measures. See the non-GAAP measures
section for more information.

/T/

Management’s discussion and analysis

May 4, 2017

This management’s discussion and analysis (MD&A) contains information to help
the reader make investment decisions about TransCanada Corporation. It
discusses our business, operations, financial position, risks and other factors
for the three months ended March 31, 2017, and should be read with the
accompanying unaudited condensed consolidated financial statements for the
three months ended March 31, 2017 which have been prepared in accordance with
U.S. GAAP.

This MD&A should also be read in conjunction with our December 31, 2016 audited
consolidated financial statements and notes and the MD&A in our 2016 Annual
Report.

FORWARD-LOOKING INFORMATION

We disclose forward-looking information to help current and potential investors
understand management’s assessment of our future plans and financial outlook,
and our future prospects overall.

Statements that are forward-looking are based on certain assumptions and on
what we know and expect today and generally include words like anticipate,
expect, believe, may, will, should, estimate or other similar words.

Forward-looking statements in this MD&A include information about the
following, among other things:

/T/

— planned changes in our business including the divestiture of certain

assets
— our financial and operational performance, including the performance of
our subsidiaries
— expectations or projections about strategies and goals for growth and
expansion
— expected cash flows and future financing options available to us
— expected dividend growth
— expected costs for planned projects, including projects under
construction, permitting and in development
— expected schedules for planned projects (including anticipated
construction and completion dates)
— expected regulatory processes and outcomes
— expected impact of regulatory outcomes
— expected outcomes with respect to legal proceedings, including
arbitration and insurance claims
— expected capital expenditures and contractual obligations
— expected operating and financial results
— expected impact of future accounting changes, commitments and contingent
liabilities
— expected industry, market and economic conditions.

/T/

Forward-looking statements do not guarantee future performance. Actual events
and results could be significantly different because of assumptions, risks or
uncertainties related to our business or events that happen after the date of
this MD&A.

Our forward-looking information is based on the following key assumptions, and
subject to the following risks and uncertainties:

Assumptions

/T/

— planned monetization of our U.S. Northeast power business
— inflation rates, commodity prices and capacity prices
— nature and scope of hedging
— regulatory decisions and outcomes
— the Canadian dollar to U.S. dollar exchange rate remains at or near

current levels
— interest rates
— tax rates
— planned and unplanned outages and the use of our pipeline and energy
assets
— integrity and reliability of our assets
— access to capital markets
— anticipated construction costs, schedules and completion dates.

/T/

Risks and uncertainties

/T/

— our ability to realize the anticipated benefits from the acquisition of

Columbia
— timing and execution of our planned asset sales
— our ability to successfully implement our strategic initiatives
— whether our strategic initiatives will yield the expected benefits
— the operating performance of our pipeline and energy assets
— amount of capacity sold and rates achieved in our pipeline businesses
— the availability and price of energy commodities
— the amount of capacity payments and revenues we receive from our energy
business
— regulatory decisions and outcomes
— outcomes of legal proceedings, including arbitration and insurance
claims
— performance and credit risk of our counterparties
— changes in market commodity prices
— changes in the political environment
— changes in environmental and other laws and regulations
— competitive factors in the pipeline and energy sectors
— construction and completion of capital projects
— costs for labour, equipment and materials
— access to capital markets
— interest, tax and foreign exchange rates
— weather
— cyber security
— technological developments
— economic conditions in North America as well as globally.

/T/

You can read more about these factors and others in reports we have filed with
Canadian securities regulators and the SEC, including the MD&A in our 2016
Annual Report.

As actual results could vary significantly from the forward-looking
information, you should not put undue reliance on forward-looking information
and should not use future-oriented information or financial outlooks for
anything other than their intended purpose. We do not update our
forward-looking statements due to new information or future events, unless we
are required to by law.

FOR MORE INFORMATION

You can find more information about TransCanada in our annual information form
and other disclosure documents, which are available on SEDAR (www.sedar.com).

NON-GAAP MEASURES

This MD&A references the following non-GAAP measures:

/T/

— comparable earnings
— comparable earnings per common share
— comparable EBITDA
— comparable EBIT
— funds generated from operations
— comparable funds generated from operations
— comparable distributable cash flow
— comparable distributable cash flow per common share.

/T/

These measures do not have any standardized meaning as prescribed by U.S. GAAP
and therefore may not be similar to measures presented by other entities.

Comparable measures

We calculate comparable measures by adjusting certain GAAP and non-GAAP
measures for specific items we believe are significant but not reflective of
our underlying operations in the period. These comparable measures are
calculated on a consistent basis from period to period and are adjusted for
specific items in each period, as applicable.

Our decision not to adjust for a specific item is subjective and made after
careful consideration. Specific items may include:

/T/

— certain fair value adjustments relating to risk management activities
— income tax refunds and adjustments and changes to enacted tax rates
— gains or losses on sales of assets or assets held for sale
— legal, contractual and bankruptcy settlements
— impact of regulatory or arbitration decisions relating to prior year

earnings
— restructuring costs
— impairment of goodwill, investments and other assets including certain
ongoing maintenance and liquidation costs
— acquisition costs.

/T/

We exclude the unrealized gains and losses from changes in the fair value of
derivatives used to reduce our exposure to certain financial and commodity
price risks. These derivatives generally provide effective economic hedges, but
do not meet the criteria for hedge accounting. As a result, the changes in fair
value are recorded in net income. As these amounts do not accurately reflect
the gains and losses that will be realized at settlement, we do not consider
them reflective of our underlying operations.

The following table identifies our non-GAAP measures against their equivalent
GAAP measures.

/T/

—————————————————————————-
—————————————————————————-
Comparable measure Original measure
—————————————————————————-
—————————————————————————-

comparable earnings net income attributable to common
shares
comparable earnings per common share net income per common share
comparable EBITDA segmented earnings
comparable EBIT segmented earnings
comparable funds generated from net cash provided by operations
operations
comparable distributable cash flow net cash provided by operations
—————————————————————————-
—————————————————————————-

/T/

Comparable earnings

Comparable earnings represent earnings or loss attributable to common
shareholders on a consolidated basis adjusted for specific items. Comparable
earnings is comprised of segmented earnings, interest expense, AFUDC, interest
income and other, income taxes and non-controlling interests adjusted for the
specific items. See the Consolidated results section for a reconciliation to
net income attributable to common shares.

Comparable EBIT and comparable EBITDA

Comparable EBIT represents segmented earnings adjusted for the specific items
described above. We use comparable EBIT as a measure of our earnings from
ongoing operations as it is a useful measure of our performance and an
effective tool for evaluating trends in each segment. Comparable EBITDA is
calculated the same way as comparable EBIT but excludes the non-cash charges
for depreciation and amortization. See the Reconciliation of non-GAAP measures
section for a reconciliation to segmented earnings.

Funds generated from operations and comparable funds generated from operations

Funds generated from operations reflects net cash provided by operations before
changes in operating working capital. We believe it is a useful measure of our
consolidated operating cash flow because it does not include fluctuations from
working capital balances, which do not necessarily reflect underlying
operations in the same period, and is used to provide a consistent measure of
the cash generating performance of our assets. Comparable funds generated from
operations is adjusted for the cash impact of specific items noted above. See
the Financial condition section for a reconciliation to net cash provided by
operations.

Comparable distributable cash flow

We believe comparable distributable cash flow is a useful supplemental measure
of performance that defines cash available to common shareholders before
capital allocation. Comparable distributable cash flow is defined as comparable
funds generated from operations less preferred share dividends, distributions
to non-controlling interests and maintenance capital expenditures. Maintenance
capital expenditures are expenditures incurred to maintain our operating
capacity, asset integrity and reliability, and include amounts attributable to
our proportionate share of maintenance capital expenditures on our equity
investments. Although we deduct maintenance capital expenditures in determining
comparable distributable cash flow, in certain of our rate-regulated
businesses, maintenance capital expenditures are included in their respective
rate bases, on which we earn a regulated return and recover depreciation
through future tolls. See the Financial condition section for a reconciliation
to net cash provided by operations.

Consolidated results – first quarter 2017

Certain costs previously reported in our Corporate segment are now being
reported within the business segments to better align with how we measure our
financial performance. 2016 results have been adjusted to reflect this change.

/T/

—————————————————————————-
—————————————————————————-

three months ended March 31
——————————
(unaudited – millions of $, except per share
amounts) 2017 2016
—————————————————————————-
—————————————————————————-
Canadian Natural Gas Pipelines 282 272
U.S. Natural Gas Pipelines 561 267
Mexico Natural Gas Pipelines 118 45
Liquids Pipelines 227 212
Energy 198 (126)
Corporate (33) (27)
—————————————————————————-
Total segmented earnings 1,353 643
Interest expense (500) (420)
Allowance for funds used during construction 101 101
Interest income and other 20 100
—————————————————————————-
Income before income taxes 974 424
Income tax expense (200) (70)
—————————————————————————-
Net income 774 354
Net income attributable to non-controlling
interests (90) (80)
—————————————————————————-
Net income attributable to controlling
interests 684 274
Preferred share dividends (41) (22)
—————————————————————————-
Net income attributable to common shares 643 252
—————————————————————————-
Net income per common share – basic and
diluted $0.74 $0.36
—————————————————————————-
—————————————————————————-

/T/

GET ENERGYNOW’S DAILY EMAIL FOR FREE


TransCanada Reports First Quarter 2017 Financial Results; Strong Results Build Upon Transformational 2016 – Part 16

Offsetting of derivative instruments
The Company enters into derivative contracts with the right to offset in the
normal course of business as well as in the event of default. TransCanada has
no master netting agreements, however, similar contracts ar…

GET ENERGYNOW’S DAILY EMAIL FOR FREE


TransCanada Reports First Quarter 2017 Financial Results; Strong Results Build Upon Transformational 2016 – Part 4

The following is a reconciliation of comparable EBITDA and comparable EBIT (our
non-GAAP measures) to segmented earnings (the equivalent GAAP measure). Certain
costs previously reported in our Corporate segment are now being reported
within the business segments to better align with how we measure our financial
performance. 2016 results have been adjusted to reflect this change.

/T/

—————————————————————————-
—————————————————————————-

three months ended March 31
——————————
(unaudited – millions of $) 2017 2016
—————————————————————————-
—————————————————————————-
NGTL System 230 226
Canadian Mainline 247 231
Other Canadian pipelines(1) 28 32
Business development (1) (1)
—————————————————————————-
Comparable EBITDA 504 488
Depreciation and amortization (222) (216)
—————————————————————————-
Comparable EBIT and segmented earnings 282 272
—————————————————————————-
—————————————————————————-
(1) Includes results from Foothills, Ventures LP and our share of equity
income from our investment in TQM.

/T/

Canadian Natural Gas Pipelines segmented earnings increased by $10 million for
the three months ended March 31, 2017 compared to the same period in 2016 and
are equivalent to comparable EBIT.

Net income and comparable EBITDA for our rate-regulated Canadian Natural Gas
Pipelines are generally affected by our approved ROE, our investment base, our
level of deemed common equity and incentive earnings or losses. Changes in
depreciation, financial charges and income taxes also impact comparable EBITDA
but do not have a significant impact on net income as they are almost entirely
recovered in revenues on a flow-through basis.

/T/

NET INCOME – NGTL SYSTEM AND CANADIAN MAINLINE

—————————————————————————-
—————————————————————————-

three months ended March 31
——————————
(unaudited – millions of $) 2017 2016
—————————————————————————-
—————————————————————————-
NGTL System 82 73
Canadian Mainline 52 50
—————————————————————————-
—————————————————————————-

/T/

Net income for the NGTL System increased by $9 million for the three months
ended March 31, 2017 compared to the same period in 2016 mainly due to a higher
average investment base and OM&A incentive earnings recorded in 2017. The NGTL
System is operating under the two-year 2016-2017 Revenue Requirement Settlement
which includes an ROE of 10.1 per cent on 40 per cent deemed equity and a
mechanism for sharing variances above and below a fixed annual OM&A amount with
flow-through treatment of all other costs.

Net income for the Canadian Mainline increased by $2 million for the three
months ended March 31, 2017 compared to the same period in 2016 primarily due
to higher incentive earnings, partially offset by a lower average investment
base. The Canadian Mainline is operating under the NEB 2014 Decision which
includes an approved ROE of 10.1 per cent on a 40 per cent deemed equity with a
possible range of achieved outcomes between 8.7 per cent and 11.5 per cent. The
decision also includes an incentive mechanism that has both upside and downside
risk and a $20 million annual after-tax contribution from us.

DEPRECIATION AND AMORTIZATION

Depreciation and amortization increased by $6 million for the three months
ended March 31, 2017 compared to the same period in 2016 mainly due to the NGTL
System facilities that were placed in service.

OPERATING STATISTICS – NGTL SYSTEM AND CANADIAN MAINLINE

/T/

—————————————————————————-
—————————————————————————-
three months ended March 31 NGTL System(1) Canadian Mainline(2)
——————– ——————–
(unaudited) 2017 2016 2017 2016
—————————————————————————-
—————————————————————————-
Average investment base (millions
of $) 7,853 7,257 4,103 4,384
Delivery volumes (Bcf):
Total 1,090 1,063 521 481
Average per day 12.1 11.7 5.8 5.3
—————————————————————————-
—————————————————————————-
(1) Field receipt volumes for the NGTL System for the three months ended
March 31, 2017 were 1,037 Bcf (2016 – 1,074 Bcf). Average per day was
11.5 Bcf (2016 – 11.8 Bcf).
(2) Canadian Mainline’s throughput volumes represent physical deliveries to
domestic and export markets. Physical receipts originating at the
Alberta border and in Saskatchewan for the three months ended March 31,
2017 were 235 Bcf (2016 – 274 Bcf). Average per day was 2.6 Bcf (2016 –
3.0 Bcf).

/T/

U.S. Natural Gas Pipelines

The following is a reconciliation of comparable EBITDA and comparable EBIT (our
non-GAAP measures) to segmented earnings (the equivalent GAAP measure). Certain
costs previously reported in our Corporate segment are now being reported
within the business segments to better align with how we measure our financial
performance. 2016 results have been adjusted to reflect this change.

/T/

—————————————————————————-
—————————————————————————-

three months ended March 31
——————————
(unaudited – millions of US$, unless otherwise
noted) 2017 2016
—————————————————————————-
—————————————————————————-
Columbia Gas(1) 185 –
ANR 122 87
TC PipeLines, LP(2,3) 32 31
Great Lakes(3,4) 27 25
Midstream(1) 23 –
Columbia Gulf(1) 18 –
Other U.S. pipelines(1,2,3,5) 29 14
Non-controlling interests(6) 108 95
Business development (1) (1)
—————————————————————————-
Comparable EBITDA 543 251
Depreciation and amortization (112) (51)
—————————————————————————-
Comparable EBIT 431 200
Foreign exchange impact 140 71
—————————————————————————-
Comparable EBIT (Cdn$) 571 271
Specific items:
Acquisition related costs – Columbia (10) –
TC Offshore loss on sale – (4)
—————————————————————————-
Segmented earnings (Cdn$) 561 267
—————————————————————————-
—————————————————————————-
(1) We completed the acquisition of Columbia on July 1, 2016 and the
remaining publicly held units of Columbia Pipeline Partners LP (CPPL) on
February 17, 2017.
(2) Results from Northern Border and Iroquois reflect our share of equity
income from these investments. We acquired additional interests in
Iroquois of 0.65 per cent on May 1, 2016 and 4.87 per cent on March 31,
2016.
(3) TC PipeLines, LP periodically conducts at-the-market equity issuances
which decrease our ownership in TC PipeLines, LP. The following shows
our ownership interest in TC PipeLines, LP and our effective ownership
interest of GTN, Great Lakes and PNGTS through our ownership interest in
TC PipeLines, LP for the periods presented.

————————————————————————
————————————————————————
Effective ownership percentage
as of
——————————
March 31, 2017 March 31, 2016
————————————————————————
————————————————————————
TC PipeLines, LP 26.4 27.9
Effective ownership through TC PipeLines,
LP:
Great Lakes 12.3 13.0
PNGTS 13.2 13.9
————————————————————————
————————————————————————
(4) Represents our 53.6 per cent direct interest in Great Lakes. The
remaining 46.4 per cent is held by TC PipeLines, LP.
(5) Includes our direct ownership in Iroquois and PNGTS and our effective
ownership in Millennium and Hardy Storage.
(6) Comparable EBITDA for the portions of TC PipeLines, LP, PNGTS and CPPL
that we do not own. Effective February 17, 2017, we acquired the
remaining publicly held units of CPPL.

/T/

U.S. Natural Gas Pipelines segmented earnings increased by $294 million for the
three months ended March 31, 2017 compared to the same period in 2016 primarily
due to the acquisition of Columbia and included a $10 million pre-tax charge,
primarily due to integration-related costs associated with the Columbia
acquisition. Segmented earnings for the three months ended March 31, 2016
included a $4 million pre-tax loss provision ($3 million after tax) as a result
of a December 2015 agreement to sell TC Offshore which closed in early 2016.
These amounts have been excluded from our calculation of comparable EBIT.

Earnings for our U.S. Natural Gas Pipelines operations, which include Columbia
effective July 1, 2016, are generally affected by contracted volume levels,
volumes delivered and the rates charged as well as by the cost of providing
services. Columbia and ANR results are also affected by the contracting and
pricing of their storage capacity and commodity sales. Transmission and storage
revenues are generally higher in winter months due to increased seasonal demand
for our services.

Comparable EBITDA for U.S. Natural Gas Pipelines increased by US$292 million
for the three months ended March 31, 2017 compared to the same period in 2016
and was the net effect of:

/T/

— US$250 million of earnings as a result of the acquisition of Columbia on

July 1, 2016 and the remaining publicly held common units of CPPL on
February 17, 2017
— higher ANR transportation revenue resulting from a FERC-approved rate
settlement, effective August 1, 2016, and higher storage results.

/T/

DEPRECIATION AND AMORTIZATION

Depreciation and amortization increased by US$61 million for the three months
ended March 31, 2017 compared to the same period in 2016 mainly due to the
acquisition of Columbia.

US$5 million of depreciation related to Columbia information system assets
retired as part of the Columbia integration process has been excluded from
comparable EBIT and included as part of integration-related costs to arrive at
segmented earnings.

Mexico Natural Gas Pipelines

The following is a reconciliation of comparable EBITDA and comparable EBIT (our
non-GAAP measures) to segmented earnings (the equivalent GAAP measure). Certain
costs previously reported in our Corporate segment are now being reported
within the business segments to better align with how we measure our financial
performance. 2016 results have been adjusted to reflect this change.

/T/

—————————————————————————-
—————————————————————————-

three months ended March 31
——————————
(unaudited – millions of US$, unless otherwise
noted) 2017 2016
—————————————————————————-
—————————————————————————-
Topolobampo 40 (1)
Tamazunchale 29 27
Guadalajara 17 17
Mazatlan 16 –
Sur de Texas(1) 4 –
Other – (1)
Business development – (3)
—————————————————————————-
Comparable EBITDA 106 39
Depreciation and amortization (17) (6)
—————————————————————————-
Comparable EBIT 89 33
Foreign exchange impact 29 12
—————————————————————————-
Comparable EBITand segmented earnings (Cdn$) 118 45
—————————————————————————-
—————————————————————————-
(1) Represents our 60 per cent equity interest in a joint venture with
IEnova to build, own and operate the Sur de Texas pipeline.

/T/

Mexico Natural Gas Pipelines segmented earnings increased by $73 million for
the three months ended March 31, 2017 compared to the same period in 2016 and
are equivalent to comparable EBIT.

Earnings from our Mexico operations are underpinned by long-term, stable,
primarily U.S. dollar-denominated revenue contracts, and are affected by the
cost of providing service.

Comparable EBITDA for Mexico Natural Gas Pipelines increased by US$67 million
for the three months ended March 31, 2017 compared to the same period in 2016
and was the net effect of:

/T/

— US$41 million of incremental earnings from Topolobampo. The Topolobampo

project has experienced a delay in construction which, under the terms
of our Transportation Service Agreement (TSA) with the CFE, constitutes
a force majeure event with provisions allowing for the collection and
recognition of revenue as per the original TSA service commencement date
of July 2016
— US$16 million of incremental earnings from Mazatlan. Construction is
complete and the collection and recognition of revenue began per the
terms of the TSA in December 2016
— US$4 million of equity earnings from our investment in the Sur de Texas
pipeline which records AFUDC during construction.

/T/

GET ENERGYNOW’S DAILY EMAIL FOR FREE


TransCanada Reports First Quarter 2017 Financial Results; Strong Results Build Upon Transformational 2016 – Part 5

DEPRECIATION AND AMORTIZATION
Depreciation and amortization increased by US$11 million for the three months
ended March 31, 2017 compared to the same period in 2016 primarily due to the
commencement of depreciation on Topolobampo and Mazatlan.
Liquids…

GET ENERGYNOW’S DAILY EMAIL FOR FREE


TransCanada Reports First Quarter 2017 Financial Results; Strong Results Build Upon Transformational 2016 – Part 6

Comparable EBITDA from Bruce Power decreased by $23 million for the three
months ended March 31, 2017 compared to the same period in 2016 mainly due to
lower gains from contracting activities and higher interest expense, partially
offset by higher vol…

GET ENERGYNOW’S DAILY EMAIL FOR FREE


TransCanada Reports First Quarter 2017 Financial Results; Strong Results Build Upon Transformational 2016 – Part 7

Net income attributable to non-controlling interests increased by $10 million
for the three months ended March 31, 2017 compared to the same period in 2016
primarily due to the acquisition of Columbia which included a non-controlling
interest in CPPL. On February 17, 2017, we acquired all outstanding publicly
held common units of CPPL.

/T/

Preferred share dividends
—————————————————————————-
—————————————————————————-

three months ended March 31
——————————
(unaudited – millions of $) 2017 2016
—————————————————————————-
—————————————————————————-

Preferred share dividends (41) (22)
—————————————————————————-
—————————————————————————-

/T/

Preferred share dividends increased by $19 million for the three months ended
March 31, 2017 compared to the same period in 2016 primarily due to the
issuance of Series 13 and Series 15 preferred shares in April 2016 and November
2016, respectively.

Recent developments

CANADIAN NATURAL GAS PIPELINES

NGTL System

The NGTL System currently has a $5.1 billion near-term capital program for
completion to 2020. This includes the recently filed application to amend
approvals for the North Montney project, with a revised $1.4 billion capital
cost estimate, and the recently approved Towerbirch Expansion project.

North Montney

On March 20, 2017, we filed an application with the NEB for a variance to the
existing approvals for North Montney to remove the condition that the project
could only proceed once a positive FID is made for the Pacific Northwest LNG
project. North Montney is now underpinned by restructured, 20-year commercial
contracts with shippers and is not dependent on, but still accommodates, the
LNG project proceeding. On April 19, 2017, the NEB granted an interim extension
of the sunset clause that was due to expire June 10, 2017 to March 31, 2018.
In-service dates are planned for April 2019 and April 2020, subject to
regulatory approval.

Towerbirch Expansion

On March 10, 2017, the Government of Canada approved the $0.4 billion
Towerbirch Expansion project. The project consists of 55 km (34 miles) of
36-inch loop to the Groundbirch Mainline plus 32 km (20 miles) of new 30-inch
pipe and four new meter stations. In February 2017, the B.C. Government
approved the environmental assessment with conditions that have since been met.

Canadian Mainline Tolling Option Open Season

On March 13, 2017, we announced the successful conclusion of the long-term
fixed-price open season on the Canadian Mainline for service from the Empress
receipt point in Alberta to the Dawn hub in Southern Ontario. The open season
resulted in binding, long-term contracts from WCSB gas producers to transport
1.5 PJ/d of natural gas at a simplified toll of $0.77/GJ. The term of each
contract is 10 years and includes early termination rights that can be
exercised following the initial five years of service and upon payment of an
increased toll for the final two years of the contract. The application to the
NEB for approval of the service was filed on April 26, 2017 and included the
request to implement the service starting November 1, 2017.

U.S. NATURAL GAS PIPELINES

Sale of Iroquois and PNGTS to TC PipeLines, LP

On May 4, 2017, we announced agreements to sell a 49.3 per cent interest in
Iroquois Gas Transmission System, LP (Iroquois), together with our remaining
11.8 per cent interest in Portland Natural Gas Transmission System (PNGTS), to
our master limited partnership, TC PipeLines, LP for US$765 million. The
transaction is comprised of US$597 million in cash and the assumption of US$168
million in proportionate debt at Iroquois and PNGTS. The transaction is
expected to close mid-2017.

Leach XPress and Rayne XPress

FERC approvals and Notices to Proceed were received in first quarter 2017 for
both the Leach XPress and Rayne XPress projects allowing construction
activities to begin. The US$1.4 billion Leach XPress project and the US$0.4
billion Rayne XPress project are expected to be in service in November 2017.

WB XPress

We received our Environmental Assessment on March 24, 2017 for the WB XPress
project and expect to receive our FERC order later this summer after additional
FERC Commissioners are appointed and a quorum is re-established. The US$0.8
billion project remains on schedule with Phase I expected to be in-service in
June 2018 and Phase II in November 2018.

Great Lakes Rate Case

Great Lakes is required to file a new section 4 rate case with rates effective
no later than January 1, 2018 as part of the settlement agreement with shippers
approved November 2013. On March 31, 2017, Great Lakes submitted a General
Section 4 Rate Filing and Tariff Changes with the FERC. The rates proposed in
the filing will be effective on October 1, 2017, subject to refund, if
alternate resolution to the proceeding is not reached prior to that date. Great
Lakes has initiated customer discussions regarding the details of the filing
and will seek to achieve a mutually beneficial resolution through settlement
with its customers.

Columbia Pipeline Partners LP

On February 17, 2017, we completed the acquisition, for cash, of all
outstanding publicly held common units of CPPL at a price of US$17.00 and a
stub period distribution payment of US$0.10 per common unit for an aggregate
transaction value of US$921 million.

LIQUIDS PIPELINES

Energy East Pipeline

In January 2017, the NEB appointed three new panel members to undertake the
review of the Energy East and Eastern Mainline projects. The new NEB panel
members voided all decisions made by the previous hearing panel and will decide
how to move forward with the hearing. We are not required to refile the
application and parties will not be required to reapply for intervener status,
however, all other proceedings and associated deadlines are no longer
applicable. If the new panel members determine that the project application is
complete, the 21-month NEB review period will commence.

On March 29, 2017, the NEB issued its decision to hear the Energy East and
Eastern Mainline projects together, however, a hearing date has not yet been
announced by the NEB.

Keystone XL

In February 2017, we filed an application with the Nebraska Public Service
Commission (PSC) seeking approval for the Keystone XL pipeline route through
that state. A hearing on the application is scheduled in August 2017 and a
final decision on the proposed route is expected by the end of November 2017.

In March 2017, the U.S. Department of State issued a U.S. Presidential Permit
authorizing construction of the U.S./Canada border crossing facilities of the
Keystone XL pipeline. We discontinued our claim under Chapter 11 of the North
American Free Trade Agreement and have also withdrawn the U.S. Constitutional
challenge. With the receipt of the U.S. Presidential Permit, we will continue
to work through the Nebraska PSC process.

Given the passage of time since the Keystone XL Presidential Permit application
was previously denied in November 2015, we are updating the shipping contracts
and anticipate the core contract shipper group will be modified with the
introduction of new shippers and reductions in volume commitments by other
shippers. We expect this transition to be complete within a few months and
would anticipate commercial support for the project to be substantially similar
to that which existed when we first applied for Keystone XL.

ENERGY

U.S. Power

Ravenswood

In late March 2017, the 972 MW Unit 30 at the Ravenswood Generating Station
experienced an unplanned outage as a result of a problem on the generator
associated with the low pressure turbine. Repairs to the unit are underway and
the unit is expected to be returned to service in second quarter 2017. The
incident is not expected to materially affect the sale process for Ravenswood.

Monetization of U.S. Northeast power business

The sale of TC Hydro to Great River Hydro, LLC closed on April 19, 2017 for
proceeds of US$1.065 billion resulting in a gain of approximately $710 million
($440 million after tax) before post-closing adjustments which will be recorded
in second quarter 2017. The proceeds received were used to reduce the Columbia
acquisition bridge credit facility.

The sale of Ravenswood, Ironwood, Ocean State Power and Kibby to Helix
Generation, LLC is expected to close in second quarter 2017.

Financial condition

We strive to maintain strong financial capacity and flexibility in all parts of
the economic cycle. We rely on our operating cash flow to sustain our business,
pay dividends and fund a portion of our growth. In addition, we access capital
markets to meet our financing needs, manage our capital structure and to
preserve our credit ratings.

We believe we have the financial capacity to fund our existing capital program
through our predictable and growing cash flow from operations, access to
capital markets (including through the establishment of an at-the-market equity
issuance program, if applicable), our DRP, portfolio management including
proceeds from the anticipated drop down of natural gas pipeline assets to TC
PipeLines, LP, cash on hand and substantial committed credit facilities.

At March 31, 2017, our current assets were $8.0 billion and current liabilities
were $9.1 billion, leaving us with a working capital deficit of $1.1 billion
compared to a surplus of $0.4 billion at December 31, 2016. Our working capital
deficiency is considered to be in the normal course of business and is managed
through:

/T/

— our ability to generate cash flow from operations
— our access to capital markets
— approximately $9.1 billion of unutilized, unsecured committed credit

facilities.

CASH PROVIDED BY OPERATING ACTIVITIES

—————————————————————————-
—————————————————————————-

three months ended March 31
——————————
(unaudited – millions of $, except per share
amounts) 2017 2016
—————————————————————————-
—————————————————————————-
Net cash provided by operations 1,302 1,081
Increase in operating working capital 155 132
—————————————————————————-
Funds generated from operations(1) 1,457 1,213
Specific items:
Acquisition related costs – Columbia 32 26
Keystone XL asset costs 8 10
U.S. Northeast power monetization 11 –
—————————————————————————-
Comparable funds generated from operations(1) 1,508 1,249
Dividends on preferred shares (39) (23)
Distributions paid to non-controlling
interests (80) (62)
Maintenance capital expenditures including
equity investments (167) (190)
—————————————————————————-
Comparable distributable cash flow(1) 1,222 974
—————————————————————————-
Comparable distributable cash flow per common
share $1.41 $1.39
—————————————————————————-
—————————————————————————-
(1) See the non-GAAP measures section in this MD&A for further discussion of
funds generated from operations, comparable funds generated from
operations and comparable distributable cash flow.

/T/

COMPARABLE FUNDS GENERATED FROM OPERATIONS

Comparable funds generated from operations increased $259 million for the three
months ended March 31, 2017 compared to the same period in 2016 primarily due
to the increase in comparable earnings.

COMPARABLE DISTRIBUTABLE CASH FLOW

Comparable distributable cash flow, a non-GAAP measure, helps us assess the
cash available to common shareholders before capital allocation. The increase
from first quarter 2016 to 2017 was driven by an increase in comparable funds
generated from operations and lower maintenance capital expenditures, primarily
at Bruce Power, partially offset by higher dividends on preferred shares and
distributions paid to non-controlling interests. Comparable distributable cash
flow per share in 2017 included the dilutive effect of issuing 161 million
common shares in 2016.

Although we deduct maintenance capital expenditures in determining comparable
distributable cash flow, in certain of our rate-regulated businesses
maintenance capital expenditures are included in their respective rate bases on
which we earn a regulated return and recover depreciation through future tolls.

The following provides a breakdown of maintenance capital expenditures:

/T/

—————————————————————————-
—————————————————————————-

three months ended March 31
——————————
(unaudited – millions of $) 2017 2016
—————————————————————————-
—————————————————————————-
Canadian Natural Gas Pipelines 49 55
U.S. Natural Gas Pipelines 70 71
Other 48 64
—————————————————————————-
Maintenance capital expenditures including
equity investments 167 190
—————————————————————————-
—————————————————————————-

CASH USED IN INVESTING ACTIVITIES
—————————————————————————-
—————————————————————————-

three months ended March 31
——————————
(unaudited – millions of $) 2017 2016
—————————————————————————-
—————————————————————————-
Capital spending
Capital expenditures (1,560) (836)
Capital projects in development (42) (67)
—————————————————————————-
(1,602) (903)
Contributions to equity investments (192) (170)
Acquisitions, net of cash acquired – (995)
Proceeds from sale of assets, net of
transaction costs – 6
Other distributions from equity investments 363 –
Deferred amounts and other (85) 52
—————————————————————————-
Net cash used in investing activities (1,516) (2,010)
—————————————————————————-
—————————————————————————-

/T/

Capital expenditures in 2017 were primarily related to:

/T/

— expansion of Columbia pipelines
— expansion of the NGTL System
— construction of Mexico pipelines
— expansion of the Canadian Mainline
— expansion of the ANR pipeline
— construction of the Napanee power generating facility.

/T/

GET ENERGYNOW’S DAILY EMAIL FOR FREE


TransCanada Reports First Quarter 2017 Financial Results; Strong Results Build Upon Transformational 2016 – Part 8

Costs incurred on capital projects under development primarily relate to the
Energy East and LNG pipeline projects.
Contributions to equity investments have increased in 2017 compared to 2016
primarily due to our investments in Sur de Texas and Bruce …

GET ENERGYNOW’S DAILY EMAIL FOR FREE


TransCanada Reports First Quarter 2017 Financial Results; Strong Results Build Upon Transformational 2016 – Part 9

At May 4, 2017, our operated affiliates had an additional $0.7 billion of
undrawn capacity on committed credit facilities.

See Financial risks and financial instruments for more information about
liquidity, market and other risks.

CONTRACTUAL OBLIGATIONS

Our capital commitments have decreased by approximately $0.5 billion since
December 31, 2016 primarily as a result of decreased commitments for the NGTL
System and Sur de Texas natural gas pipelines due to the progression of
construction. Transportation by others commitments have increased by
approximately $0.7 billion since December 31, 2016, primarily related to
Canadian Mainline contracts.

Our commitments at March 31, 2017 include operating leases and other purchase
obligations related to our U.S. Northeast power business. At the close of the
sale of Ravenswood, Ironwood, Kibby Wind and Ocean State Power, our commitments
are expected to decrease by $42 million in 2017, $97 million in 2018, $79
million in 2019, $29 million in 2020, $23 million in 2021 and $259 million in
2022 and beyond.

There were no other material changes to our contractual obligations in first
quarter 2017 or to payments due in the next five years or after. See the MD&A
in our 2016 Annual Report for more information about our contractual
obligations.

Financial risks and financial instruments

We are exposed to liquidity risk, counterparty credit risk and market risk, and
have strategies, policies and limits in place to mitigate their impact on our
earnings, cash flow and, ultimately, shareholder value. These are designed to
ensure our risks and related exposures are in line with our business objectives
and risk tolerance.

See our 2016 Annual Report for more information about the risks we face in our
business. Our risks have not changed substantially since December 31, 2016.

LIQUIDITY RISK

We manage our liquidity risk by continuously forecasting our cash flow for a 12
month period to ensure we have adequate cash balances, cash flow from
operations, committed and demand credit facilities and access to capital
markets to meet our operating, financing and capital expenditure obligations
under both normal and stressed economic conditions.

COUNTERPARTY CREDIT RISK

We have exposure to counterparty credit risk in the following areas:

/T/

— accounts receivable
— the fair value of derivative assets
— cash and cash equivalents
— notes receivable.

/T/

We review our accounts receivable regularly and record allowances for doubtful
accounts using the specific identification method. At March 31, 2017, we had no
significant credit losses, no significant credit risk concentration and no
significant amounts past due or impaired.

We have significant credit and performance exposure to financial institutions
because they hold cash deposits and provide committed credit lines and letters
of credit that help manage our exposure to counterparties and provide liquidity
in commodity, foreign exchange and interest rate derivative markets.

FOREIGN EXCHANGE AND INTEREST RATE RISK

We generate revenues and incur expenses that are denominated in currencies
other than Canadian dollars. As a result, our earnings and cash flows are
exposed to currency fluctuations.

A portion of our businesses generate earnings in U.S. dollars, but since we
report our financial results in Canadian dollars, changes in the value of the
U.S. dollar against the Canadian dollar can affect our net income. As our U.S.
dollar-denominated operations continue to grow, this exposure increases. The
majority of this risk is offset by interest expense on U.S. dollar-denominated
debt and by using foreign exchange derivatives.

We have floating interest rate debt which subjects us to interest rate cash
flow risk. We manage this using a combination of interest rate swaps and
options.

/T/

Average exchange rate – U.S. to Canadian dollars

——————————————————————
——————————————————————
three months ended March 31, 2017 1.32
three months ended March 31, 2016 1.35
——————————————————————
——————————————————————

/T/

The impact of changes in the value of the U.S. dollar on our U.S. operations is
significantly offset by interest on U.S. dollar-denominated long-term debt, as
set out in the table below. Comparable EBIT is a non-GAAP measure. See our
Reconciliation of non-GAAP measures section for more information.

/T/

Significant U.S. dollar-denominated amounts

—————————————————————————-
—————————————————————————-

three months ended March 31
——————————
(unaudited – millions of US$) 2017 2016
—————————————————————————-
—————————————————————————-
U.S. Natural Gas Pipelines comparable EBIT 431 200
Mexico Natural Gas Pipelines comparable EBIT 89 33
U.S. Liquids Pipelines comparable EBIT 135 127
U.S. Power comparable EBIT 54 44
AFUDC on U.S. dollar-denominated projects 38 45
Interest on U.S. dollar-denominated long-term
debt (317) (246)
Capitalized interest on U.S. dollar-
denominated capital expenditures – 7
U.S. dollar non-controlling interests (68) (60)
—————————————————————————-
362 150
—————————————————————————-
—————————————————————————-

/T/

Derivatives designated as a net investment hedge

We hedge our net investment in foreign operations (on an after-tax basis) with
U.S. dollar-denominated debt, cross-currency interest rate swaps, foreign
exchange forward contracts and foreign exchange options.

The fair values and notional or principal amounts for the derivatives
designated as a net investment hedge were as follows:

/T/

—————————————————————————-
—————————————————————————-

March 31, 2017 December 31, 2016
———————- ———————-
(unaudited – millions of Notional or Notional or
Canadian $, unless noted Fair principal Fair principal
otherwise) value(1) amount value(1) amount
—————————————————————————-
—————————————————————————-
U.S. dollar cross-currency
interest rate swaps (maturing
2017 to 2019)(2) (337) US 2,000 (425) US 2,350
U.S. dollar foreign exchange
forward contracts – – (7) US 150
—————————————————————————-
(337) US 2,000 (432) US 2,500
—————————————————————————-
—————————————————————————-
(1) Fair values equal carrying values.
(2) In the three months ended March 31, 2017, net realized gains of $1
million (2016 – gains of $2 million) related to the interest component
of cross-currency swaps settlements are included in interest expense.

U.S. dollar-denominated debt designated as a net investment hedge

—————————————————————————-
—————————————————————————-
(unaudited – millions of Canadian $,
unless noted otherwise) March 31, 2017 December 31, 2016
—————————————————————————-
—————————————————————————-
Notional amount 28,400 (US 21,400) 26,600 (US 19,800)
Fair value 31,500 (US 23,600) 29,400 (US 21,900)
—————————————————————————-
—————————————————————————-

/T/

FINANCIAL INSTRUMENTS

All financial instruments, including both derivative and non-derivative
instruments, are recorded on the balance sheet at fair value unless they were
entered into and continue to be held for the purpose of receipt or delivery in
accordance with our normal purchase and sales exemptions and are documented as
such. In addition, fair value accounting is not required for other financial
instruments that qualify for certain accounting exemptions.

Derivative instruments

We use derivative instruments to reduce volatility associated with fluctuations
in commodity prices, interest rates and foreign exchange rates. We apply hedge
accounting to derivative instruments that qualify and are designated for hedge
accounting treatment.

The majority of derivative instruments that are not designated or do not
qualify for hedge accounting treatment have been entered into as economic
hedges to manage our exposure to market risk (held for trading). Changes in the
fair value of held for trading derivative instruments are recorded in net
income in the period of change. This may expose us to increased variability in
reported operating results since the fair value of the held for trading
derivative instruments can fluctuate significantly fr om period to period.

Balance sheet presentation of derivative instruments

The balance sheet classification of the fair value of derivative instruments is
as follows:

/T/

—————————————————————————-
—————————————————————————-
(unaudited – millions of $) March 31, 2017 December 31, 2016
—————————————————————————-
—————————————————————————-
Other current assets 413 376
Intangible and other assets 153 133
Accounts payable and other (607) (607)
Other long-term liabilities (334) (330)
—————————————————————————-
(375) (428)
—————————————————————————-
—————————————————————————-

/T/

Unrealized and realized (losses)/gains of derivative instruments

The following summary does not include hedges of our net investment in foreign
operations.

/T/

—————————————————————————-
—————————————————————————-

three months ended March 31
——————————
(unaudited – millions of $, pre-tax) 2017 2016
—————————————————————————-
—————————————————————————-
Derivative instruments held for trading(1)
Amount of unrealized (losses)/gains in the
period
Commodities(2) (56) (67)
Foreign exchange 15 27
Interest rate 1 –
Amount of realized (losses)/gains in the
period
Commodities (48) (95)
Foreign exchange (4) 44
Derivative instruments in hedging
relationships
Amount of realized gains/(losses) in the
period
Commodities 6 (73)
Foreign exchange 5 (63)
Interest rate 1 2
—————————————————————————-
—————————————————————————-
(1) Realized and unrealized gains and losses on held for trading derivative
instruments used to purchase and sell commodities are included net in
revenues. Realized and unrealized gains and losses on interest rate and
foreign exchange held for trading derivative instruments are included
net in interest expense and interest income and other, respectively.
(2) Following the March 17, 2016 announcement of our intention to sell the
U.S. Northeast power business, a loss of $49 million and a gain of $7
million were recorded in net income in the three months ended March 31,
2016 relating to discontinued cash flow hedges where it was probable
that the anticipated underlying transaction would not occur as a result
of a future sale.

/T/

Derivatives in cash flow hedging relationships

The components of the condensed consolidated statement of OCI related to
derivatives in cash flow hedging relationships including the portion
attributable to non-controlling interests is as follows:

/T/

—————————————————————————-
—————————————————————————-

three months ended March 31
——————————
(unaudited – millions of $, pre-tax) 2017 2016
—————————————————————————-
—————————————————————————-
Change in fair value of derivative instruments
recognized in OCI (effective portion)(1)
Commodities 5 (16)
Foreign exchange – (35)
Interest rate 1 (3)
—————————————————————————-
6 (54)
—————————————————————————-
Reclassification of (losses)/gains on
derivative instruments from AOCI to net
income (effective portion)(1)
Commodities(2) (4) 82
Foreign exchange(3) – 34
Interest rate(4) 4 4
—————————————————————————-
– 120
—————————————————————————-
Losses on derivative instruments recognized in
net income (ineffective portion)
Commodities(2) – (58)
—————————————————————————-
– (58)
—————————————————————————-
—————————————————————————-
(1) No amounts have been excluded from the assessment of hedge
effectiveness. Amounts in parentheses indicate losses recorded to OCI.
(2) Reported within revenues on the condensed consolidated statement of
income.
(3) Reported within interest income and other on the condensed consolidated
statement of income.
(3) Reported within interest expense on the condensed consolidated statement
of income.

/T/

GET ENERGYNOW’S DAILY EMAIL FOR FREE


TransCanada Reports First Quarter 2017 Financial Results; Strong Results Build Upon Transformational 2016 – Part 11

FACTORS AFFECTING QUARTERLY FINANCIAL INFORMATION BY BUSINESS SEGMENT
Quarter-over-quarter revenues and net income sometimes fluctuate, the causes of
which vary across our business segments.
In our Canadian Natural Gas Pipelines, U.S. Natural Gas Pipe…

GET ENERGYNOW’S DAILY EMAIL FOR FREE


TransCanada Reports First Quarter 2017 Financial Results; Strong Results Build Upon Transformational 2016 – Part 12

Notes to condensed consolidated financial statements
(unaudited)
1. Basis of presentation
These condensed consolidated financial statements of TransCanada Corporation
(TransCanada or the Company) have been prepared by management in accordance
with U.S…

GET ENERGYNOW’S DAILY EMAIL FOR FREE


TransCanada Reports First Quarter 2017 Financial Results; Strong Results Build Upon Transformational 2016 – Part 13

4. Assets held for sale
U.S. Northeast Power Assets
The Company’s planned monetization of its U.S. Northeast power business, for
the purpose of permanently financing a portion of the Columbia acquisition,
includes the sale of Ravenswood, Ironwood, Kib…

GET ENERGYNOW’S DAILY EMAIL FOR FREE


TransCanada Reports First Quarter 2017 Financial Results; Strong Results Build Upon Transformational 2016 – Part 14

Details about reclassifications out of AOCI into the consolidated statement of
income are as follows:
/T/
—————————————————————————-
——————————————————————–…

GET ENERGYNOW’S DAILY EMAIL FOR FREE


TransCanada Reports First Quarter 2017 Financial Results; Strong Results Build Upon Transformational 2016 – Part 1

FOR: TRANSCANADA
TSX SYMBOL: TRP
NYSE SYMBOL: TRP

Date issue: May 05, 2017
Time in: 7:30 AM e

Attention:

CALGARY, ALBERTA–(Marketwired – May 5, 2017) – TransCanada Corporation
(TSX:TRP) (NYSE:TRP) (TransCanada) today announced net income attributable to
common shares for first quarter 2017 of $643 million or $0.74 per share
compared to net income of $252 million or $0.36 per share for the same period
in 2016. Comparable earnings for first quarter 2017 were $698 million or $0.81
per share compared to $494 million or $0.70 per share for the same period in
2016. TransCanada’s Board of Directors also declared a quarterly dividend of
$0.625 per common share for the quarter ending June 30, 2017, equivalent to
$2.50 per common share on an annualized basis.

“We generated record first quarter financial results, excluding specific
items,” said Russ Girling, TransCanada’s president and chief executive officer.
“Comparable earnings per share increased 16 per cent compared to first quarter
2016 primarily due to strong performance across our Natural Gas Pipelines
business, including Columbia which was acquired in mid-2016, while net cash
provided by operations reached $1.3 billion.”

“Today we are advancing a $23 billion near-term capital program that is
expected to generate significant growth in earnings and cash flow and support
an expected annual dividend growth rate at the upper end of an eight to 10 per
cent range through 2020,” added Girling. “To date we have invested $7.5 billion
in these projects and are well positioned to both execute and fund the
remainder of the program over the next few years. In addition, we concluded the
purchase of Columbia Pipeline Partners LP which results in 100 per cent
ownership in the core Columbia assets and further simplifies our corporate
structure.”

“We also continue to progress a number of additional medium to longer-term
organic growth opportunities in our three core businesses of natural gas
pipelines, liquids pipelines and energy in Canada, the United States and
Mexico. Those include Keystone XL and the Bruce Power life extension agreement.
During the first quarter, we were very pleased to receive a U.S. Presidential
Permit for Keystone XL and are now in the process of seeking regulatory
approval in Nebraska while progressing commercial discussions with our
customers. Success in advancing these or other growth initiatives could augment
or extend the Company’s dividend growth outlook through 2020 and beyond,”
concluded Girling.

Highlights

(All financial figures are unaudited and in Canadian dollars unless noted
otherwise)

/T/

— First quarter 2017 financial results

— Net income attributable to common shares of $643 million or $0.74
per share
— Comparable earnings of $698 million or $0.81 per share
— Comparable earnings before interest, taxes, depreciation and
amortization (EBITDA) of $2.0 billion
— Net cash provided by operations of $1.3 billion
— Comparable funds generated from operations of $1.5 billion
— Comparable distributable cash flow of $1.2 billion or $1.41 per
common share
— Declared a quarterly dividend of $0.625 per common share for the quarter
ending June 30, 2017
— Acquired all outstanding publicly held units of Columbia Pipeline
Partners LP (CPPL) for a total of US$921 million
— Filed a variance application with the National Energy Board (NEB) for
the $1.4 billion North Montney project to remove the condition requiring
a positive Final Investment Decision (FID) for the Pacific Northwest LNG
project. The amended project is supported by 20-year contracts with 11
shippers
— Successfully concluded an open season on the Canadian Mainline for 1.5
petajoules per day (PJ/d) of 10 year transportation service from
Empress, Alberta to the Dawn hub in Southern Ontario
— Received Federal Energy Regulatory Commission (FERC) approvals and began
construction on the Leach XPress and Rayne XPress projects. Also
received an Environmental Assessment on WB XPress
— Received a U.S. Presidential Permit authorizing construction of the
U.S./Canada border crossing facilities of the Keystone XL pipeline. We
also filed an application with the Nebraska Public Service Commission
seeking approval for the Keystone XL pipeline route through that state
— Raised US$1.5 billion in gross proceeds through an offering of Junior
Subordinated Notes maturing in 2077
— In April, closed the sale of a portion of our U.S. Northeast power
business for US$1.065 billion; the proceeds were used to repay a portion
of the acquisition bridge facilities which partially financed the
Columbia acquisition
— In May, announced agreements to sell a 49.3 per cent interest in
Iroquois Gas Transmission System, LP (Iroquois), together with our
remaining 11.8 per cent interest in Portland Natural Gas Transmission
System (PNGTS), to our master limited partnership, TC PipeLines, LP for
a total of US$765 million

/T/

Net income attributable to common shares increased by $391 million to $643
million or $0.74 per share for the three months ended March 31, 2017 compared
to the same period last year. Net income per common share in 2017 includes the
dilutive effect of issuing 161 million common shares in 2016. First quarter
2017 included a charge of $24 million after-tax for integration-related costs
associated with the acquisition of Columbia, a $10 million after-tax charge for
costs related to the monetization of our U.S. Northeast power business, a $7
million after-tax charge related to the maintenance of Keystone XL assets and a
$7 million income tax recovery related to the realized loss on a third party
sale of Keystone XL project assets. First quarter 2016 results included a $176
million after-tax impairment charge on the carrying value of our Alberta PPAs,
a $26 million after-tax charge relating to costs associated with the
acquisition of Columbia, a $6 million after-tax charge related to Keystone XL
costs for the maintenance and liquidation of project assets and a $3 million
after-tax loss on the sale of TC Offshore which closed in March 2016. All of
these specific items plus risk management activities are excluded from
comparable earnings.

Comparable earnings for first quarter 2017 were $698 million or $0.81 per share
compared to $494 million or $0.70 per share for the same period in 2016, an
increase of $204 million or $0.11 per share and includes the dilutive effect of
issuing 161 million common shares in 2016. The 2017 increase in comparable
earnings was primarily due to the net effect of higher contributions from U.S.
Natural Gas Pipelines primarily due to incremental earnings from Columbia
following the July 1, 2016 acquisition and higher ANR transportation revenues
resulting from higher rates effective August 1, 2016, a higher contribution
from Mexican Natural Gas Pipelines due to incremental earnings from the
Mazatlan and Topolobampo pipelines, higher earnings primarily from U.S. Power
due to depreciation no longer being recorded effective November 1, 2016 on
these assets along with higher realized power prices and higher earnings from
Western Power following the termination of the Alberta PPAs in 2016. These
increases were partially offset by higher interest expense as a result of debt
assumed in the Columbia acquisition and long-term debt issuances and lower
earnings from Bruce Power mainly due to lower gains from contracting activities
and higher interest expense partially offset by higher volumes resulting from
fewer outage days.

Notable recent developments include:

Natural Gas Pipelines:

/T/

— NGTL System: NGTL currently has a $5.1 billion near-term capital program

targeted for completion by 2020. This includes the recently filed
application to amend approvals for the North Montney project with a
revised $1.4 billion capital cost estimate and the recently approved
Towerbirch Expansion project.
— North Montney: On March 20, 2017, we filed an application with the NEB
for a variance to the existing approvals for North Montney, to remove
the condition it can only proceed once a positive FID is made for the
Pacific Northwest LNG project. North Montney is now underpinned by
restructured, 20-year commercial contracts with a group of shippers and
is not dependent on, but still accommodates, the LNG project proceeding.
In-service dates are planned for April 2019 and April 2020, subject to
regulatory approval.
— Towerbirch Expansion: On March 10, 2017, the Government of Canada
approved the $0.4 billion Towerbirch Expansion project. In February
2017, the B.C. Government approved the environmental assessment with
conditions that have since been met.
— Canadian Mainline Tolling Option Open Season: On March 13, 2017, we
announced the successful conclusion of the long-term fixed-price open
season on the Canadian Mainline for service from Empress, Alberta to the
Dawn hub in Southern Ontario. The open season resulted in binding, long-
term contracts to transport 1.5 PJ/d of natural gas at a toll of
$0.77/GJ. The 10 year contracts have early termination rights that can
be exercised following the initial five years of service and upon
payment of an increased toll for the final two years of the contract.
The application to the NEB for approval of the service was filed on
April 26, 2017 and included the request to implement the service
starting November 1, 2017.
— Sale of Iroquois and PNGTS to TC PipeLines, LP: On May 4, 2017, we
announced agreements to sell a 49.3 per cent interest in Iroquois,
together with our remaining 11.8 per cent interest in PNGTS, to our
master limited partnership, TC PipeLines, LP for US$765 million. The
transaction is expected to close mid-2017.
— Columbia Projects: Leach XPress and Rayne XPress both received FERC
approvals and Notices to Proceed in the first quarter of 2017.
Construction is now underway. The US$1.4 billion Leach XPress project
and the US$0.4 billion Rayne XPress project are expected to be in-
service in November 2017. WB XPress received an Environmental Assessment
on March 24, 2017 and expects to receive its FERC order later this
summer. The US$0.8 billion project remains on schedule with Phase I
expected to be in-service in June 2018 and Phase II in November 2018.
— Columbia Pipeline Partners LP: On February 17, 2017, we acquired, for
cash, all of the outstanding publicly held common units of CPPL for an
aggregate transaction value of US$921 million.
— Great Lakes Rate Filing: Consistent with its 2013 settlement, on March
31, 2017, Great Lakes submitted a General Section 4 Rate Filing and
Tariff Changes with the FERC. The rates proposed in the filing will
become effective on October 1, 2017, subject to refund, if alternate
resolution to the proceeding is not reached prior to that date. We have
initiated customer discussions and will seek to achieve a mutually
beneficial settlement resolution.

/T/

Liquids Pipelines:

/T/

— Keystone XL: In March 2017, the U.S. Department of State issued a U.S.

Presidential Permit authorizing construction of the U.S./Canada border
crossing facilities of the Keystone XL pipeline. We have discontinued
our claim under Chapter 11 of the North American Free Trade Agreement
and have withdrawn the U.S. Constitutional challenge. In February 2017,
we filed an application with the Nebraska Public Service Commission
seeking approval for the Keystone XL pipeline route through that state.
A hearing on the application is scheduled in August 2017 and a final
decision is expected by the end of November 2017. Given the passage of
time since the Keystone XL Presidential Permit application was
previously denied in November 2015, we are updating the shipping
contracts and anticipate the core contract shipper group will be
modified with the introduction of new shippers and reductions in volume
commitments by other shippers. We expect this transition to be complete
within a few months and would anticipate commercial support for the
project to be substantially similar to that which existed when we first
applied for Keystone XL.

/T/

Energy:

/T/

— Monetization of U.S. Northeast power business: On April 19, 2017, we

announced the closing of the previously announced sale of TC Hydro to
Great River Hydro, LLC, an affiliate of ArcLight Capital Partners, LLC,
for US$1.065 billion. In second quarter 2017 we expect to book an
approximate $440 million after-tax gain on the sale of the hydro assets.
The proceeds received were used to reduce the acquisition bridge
facilities which partially financed the Columbia acquisition. The
previously announced sale of Ravenswood, Ironwood, Ocean State Power and
Kibby to Helix Generation, LLC is expected to close in second quarter
2017.

/T/

Corporate:

/T/

— Common Share Dividend: Our Board of Directors declared a quarterly

dividend of $0.625 per share for the quarter ending June 30, 2017 on
TransCanada’s outstanding common shares. The quarterly amount is
equivalent to $2.50 per common share on an annualized basis.
— Junior Subordinated Debt Issuance: In March 2017, TransCanada Trust
issued US$1.5 billion of 60-year Junior Subordinated Notes to third
party investors with a fixed interest rate of 5.30 per cent for the
first ten years converting to a floating rate thereafter. The notes are
callable at par beginning ten years following their issuance. All of the
proceeds of the issuance by the Trust were loaned to TCPL in US$1.5
billion of subordinated notes at a rate of 5.55 per cent which includes
a 0.25 per cent administration charge.
— Dividend Reinvestment Plan: Currently, approximately 40 per cent of the
common and preferred share dividends declared are being reinvested in
TransCanada common shares through our Dividend Reinvestment Plan (DRP).
— Management Changes: Alex Pourbaix, Chief Operating Officer announced his
retirement from the company, effective May 31, 2017. There is no current
intention to replace this role. Effective April 28, 2017, Stan Chapman,
previously Senior Vice-President of U.S. Natural Gas Pipelines, was
promoted to Executive Vice-President and President, U.S. Natural Gas
Pipelines. On April 21, 2017, Bill Taylor, Executive Vice-President and
President, Energy left the company to pursue other opportunities and
Karl Johannson will take over the responsibility of the Energy business
unit along with his revised role as President of Canada and Mexico
Natural Gas Pipelines.

— Teleconference and Webcast:

/T/

We will hold a teleconference and webcast on Friday, May 5, 2017 to discuss our
first quarter 2017 financial results. Russ Girling, TransCanada President and
Chief Executive Officer, and Don Marchand, Executive Vice-President and Chief
Financial Officer, along with other members of the TransCanada executive
leadership team, will discuss the financial results and Company developments at
12:30 p.m. (MT) / 2:30 p.m. (ET).

Members of the investment community and other interested parties are invited to
participate by calling 800.408.3053 or 905.694.9451 (Toronto area). Please dial
in 10 minutes prior to the start of the call. No pass code is required. A live
webcast of the teleconference will be available at www.transcanada.com.

A replay of the teleconference will be available two hours after the conclusion
of the call until midnight (ET) on May 12, 2017. Please call 800.408.3053 or
905.694.9451 (Toronto area) and enter pass code 8663009.

The unaudited interim condensed Consolidated Financial Statements and
Management’s Discussion and Analysis (MD&A) are available under TransCanada’s
profile on SEDAR at www.sedar.com, with the U.S. Securities and Exchange
Commission on EDGAR at www.sec.gov/info/edgar.shtml and on the TransCanada
website at www.transcanada.com.

With more than 65 years’ experience, TransCanada is a leader in the responsible
development and reliable operation of North American energy infrastructure
including natural gas and liquids pipelines, power generation and gas storage
facilities. TransCanada operates a network of natural gas pipelines that
extends more than 91,500 kilometres (56,900 miles), tapping into virtually all
major gas supply basins in North America. TransCanada is the continent’s
largest provider of gas storage and related services with 653 billion cubic
feet of storage capacity. A large independent power producer, TransCanada owns
or has interests in over 10,100 megawatts of power generation in Canada and the
United States. TransCanada is also the developer and operator of one of North
America’s leading liquids pipeline systems that extends over 4,300 kilometres
(2,700 miles) connecting growing continental oil supplies to key markets and
refineries. TransCanada’s common shares trade on the Toronto and New York stock
exchanges under the symbol TRP. Visit TransCanada.com and our blog to learn
more, or connect with us on social media and 3BL Media.

Forward Looking Information

This release contains certain information that is forward-looking and is
subject to important risks and uncertainties (such statements are usually
accompanied by words such as “anticipate”, “expect”, “believe”, “may”, “will”,
“should”, “estimate”, “intend” or other similar words). Forward-looking
statements in this document are intended to provide TransCanada security
holders and potential investors with information regarding TransCanada and its
subsidiaries, including management’s assessment of TransCanada’s and its
subsidiaries’ future plans and financial outlook. All forward-looking
statements reflect TransCanada’s beliefs and assumptions based on information
available at the time the statements were made and as such are not guarantees
of future performance. Readers are cautioned not to place undue reliance on
this forward-looking information, which is given as of the date it is expressed
in this news release, and not to use future-oriented information or financial
outlooks for anything other than their intended purpose. TransCanada undertakes
no obligation to update or revise any forward-looking information except as
required by law. For additional information on the assumptions made, and the
risks and uncertainties which could cause actual results to differ from the
anticipated results, refer to the Quarterly Report to Shareholders dated May 4,
2017 and 2016 Annual Report filed under TransCanada’s profile on SEDAR at
www.sedar.com and with the U.S. Securities and Exchange Commission at
www.sec.gov.

GET ENERGYNOW’S DAILY EMAIL FOR FREE


TransCanada Reports First Quarter 2017 Financial Results; Strong Results Build Upon Transformational 2016 – Part 3

Net income attributable to common shares increased by $391 million or $0.38 per
share for the three months ended March 31, 2017 compared to the same period in
2016. Net income per common share in 2017 included the dilutive effect of
issuing 161 millio…

GET ENERGYNOW’S DAILY EMAIL FOR FREE


Husky Energy Announces Second Quarter 2017 Preferred Shares Dividend Payments

FOR: HUSKY ENERGY INC.
TSX Symbol: HSE

Date issue: May 05, 2017
Time in: 6:01 AM e

Attention:

CALGARY, AB –(Marketwired – May 05, 2017) – Husky Energy’s (TSX: HSE)
regular dividend payments on each of the Cumulative Redeemable Preferred
Shares – Series 1, Series 2, Series 3, Series 5 and Series 7 – will be paid
for the three-month period ended June 30, 2017. The dividends will be payable
on June 30, 2017 to holders of record at the close of business on June 12,
2017.

/T/

Share Series Dividend Type Rate (%) Dividend Paid ($/share)

Series 1 Regular 2.404 $0.15025
Series 2 Regular 2.210 $0.13775
Series 3 Regular 4.50 $0.28125
Series 5 Regular 4.50 $0.28125
Series 7 Regular 4.60 $0.28750

/T/

Husky Energy is a Canadian-based integrated energy company. It is
headquartered in Calgary, Alberta, Canada and its shares are publicly traded
on the Toronto Stock Exchange under the symbols HSE, HSE.PR.A, HSE.PR.B,
HSE.PR.C, HSE.PR.E and HSE.PR.G. More information is available at
www.huskyenergy.com

– END RELEASE – 05/05/2017

For further information:

For further information, please contact:

Investor Inquiries:

Rob Knowles
Manager, Investor Relations
Husky Energy Inc.
587-747-2116

Media Inquiries:

Mel Duvall
Manager, Media & Issues
Husky Energy Inc.
403-513-7602

COMPANY:
FOR: HUSKY ENERGY INC.
TSX Symbol: HSE

INDUSTRY: Energy and Utilities – Oil and Gas
RELEASE ID: 20170505CC015

Press Release from Marketwired 1-866-736-3779

All press releases are written by the client and have NO affiliation with the news copy written by The Canadian Press. Any questions that arise due to the content or information provided in the press release should be directed to the company/organization
issuing the release, not to The Canadian Press.

GET ENERGYNOW’S DAILY EMAIL FOR FREE


Husky Energy Reports 2017 First Quarter Results

FOR: HUSKY ENERGY INC.
TSX Symbol: HSE

Date issue: May 05, 2017
Time in: 6:00 AM e

Attention:

CALGARY, AB –(Marketwired – May 05, 2017) – Husky Energy Inc. (TSX: HSE) —
Good operational performance in the first quarter delivered funds from
operations of $709 million, a 63 percent increase compared to a year ago, and
free cash flow of $325 million.

“Our consistently improving performance over recent quarters has delivered
increased free cash flow, demonstrating that the structural transformation of
our business has reached critical mass,” said CEO Rob Peabody.

“This moves us closer to our objective of returning cash to shareholders as
the market stabilizes, while continuing to invest in a deep portfolio of
projects.”

First quarter highlights included:

/T/

— Funds from operations were $709 million and free cash flow was $325

million.
— Net earnings were $71 million, an increase of $529 million compared to
the same period in 2016.
— Total net bitumen production from thermal projects averaged 121,000
barrels per day (bbls/day), up 47 percent over Q1 2016. This represented
36 percent of total production.
— The three most recent Lloyd thermal projects were delivered with capital
efficiencies of about $25,000 per flowing barrel and had average
operating costs of $8.23 per barrel in the quarter.
— The Sunrise Energy Project is now producing 40,000 bbls/day gross
(20,000 bbls/day net to Husky), with production from 55 well pairs
averaging 730 bbls/day.
— To date, the Company has signed agreements for the sale of about 3,300
barrels of oil equivalent per day (boe/day) in Western Canada for $88
million in gross proceeds.
— Canadian Downstream ran at 97 percent capacity and took advantage of
wider differentials to generate EBIT of $86 million.
— Increased production at the Liwan Gas Project contributed to an
operating netback of $64.43/boe and generated $184 million of EBITDA in
the Asia Pacific business.

/T/

2017 FIRST QUARTER RESULTS

Overall average Upstream production was 334,000 boe/day, up from 327,000
boe/day in the prior quarter. That compares to 341,000 boe/day in the first
quarter of 2016. Production reflected the disposition in 2016 of approximately
32,000 boe/day of production in Western Canada, largely offset by growing
thermal production and increased volumes from the Liwan Gas Project.

Total upgrading and refining throughputs averaged 367,000 bbls/day, compared
to 314,000 bbls/day in the same quarter last year.

WTI prices averaged $51.91 US per barrel compared to $33.45 US per barrel in
the first quarter of 2016.

Average realized pricing for total Upstream production was $41.58 per boe,
compared to $25.02 per boe in the same quarter the year before. This includes
average realized gas pricing of $13.31 per thousand cubic feet (mcf) for sales
gas at Liwan.

The Chicago 3:2:1 crack spread averaged $11.22 US per barrel compared to $9.23
US per barrel in the first quarter of 2016. Average realized U.S. refining
margins were $8.33 US per barrel compared to $3.76 US per barrel a year ago.

Overall average Upstream operating costs were $13.75 per barrel.

Funds from operations were $709 million, compared to $434 million in the first
quarter of 2016.

Capital expenditures were $384 million. Free cash flow was $325 million.

Net earnings were $71 million, compared to a loss of $458 million a year ago,
reflecting higher commodity prices, increased production from thermal projects
and Liwan, and higher throughputs and realized refining margins in both the
Canadian and U.S. downstream operations.

/T/

Three Months Ended
Mar. 31 Dec. 31 Mar. 31
2017 2016 2016
1) Daily Production, before royalties
Total Equivalent Production (mboe/day) 334 327 341
Crude Oil and NGLs (mbbls/day) 244 235 238
Natural Gas (mmcf/day) 543 555 619
2) Upstream Operating Netback ($/boe)(1)(2) 24.17 22.32 9.68
3) Refinery and Upgrader Throughput (mbbls/day) 367 351 314
4) Funds from Operations(2) ($ millions) 709 670 434
Per Common Share – Basic ($/share) 0.71 0.67 0.43
Per Common Share – Diluted ($/share) 0.71 0.67 0.43
5) Net Earnings (loss) ($ millions) 71 186 (458)
Per Common Share – Basic ($/share) 0.06 0.19 (0.47)
Per Common Share – Diluted ($/share) 0.06 0.19 (0.47)
6) Adjusted Net Earnings (loss)(2) ($ millions) 71 (6) (458)
7) Capital Investment, including acquisitions ($ 384 391 410
millions)
8) Net Debt(2)($ billions) 3.8 4.0 7.0

/T/

(1) Operating netback includes results from Upstream Exploration and
Production and excludes Upstream Infrastructure and Marketing.
(2) Refer to the “Non-GAAP Measures” advisory in this news release.

FIRST QUARTER OPERATIONS SUMMARY

Thermal Projects

Strong performance from the Edam East, Vawn and Edam West Lloyd thermal
projects contributed to overall average net thermal bitumen production of
121,000 bbls/day, including the Tucker Thermal Project and Sunrise. Overall
thermal operating costs were $11.83 per barrel in the quarter.

The Edam East, Vawn and Edam West developments, which came on production in
2016, are producing at 20 percent above design capacity, averaging 30,000
bbls/day. Average operating costs for the three projects were $8.23 per barrel
in the quarter.

Construction continued to advance at the 10,000 bbls/day Rush Lake 2 Lloyd
thermal project, with first oil expected in the first half of 2019. Open
houses were held for the sanctioned 10,000 bbls/day Lloyd thermal projects at
Dee Valley, Spruce Lake North and Spruce Lake Central, advancing the projects
toward regulatory approval.

At the Tucker Thermal Project, first production from a new eight-well pad
began in the quarter and drilling continued on an additional 15-well pad.
Production from Tucker is anticipated to ramp up through 2017 and 2018 towards
30,000 bbls/day.

Gross production at Sunrise averaged 35,800 bbls/day (17,900 bbls/day net to
Husky) in the quarter, up about six percent from the fourth quarter. Current
production has reached 40,000 bbls/day (20,000 bbls/day net to Husky), with
average per well pair production of about 730 bbls/day. Work is progressing to
tie in 14 new well pairs, and steaming is expected to commence later this
year.

Western Canada Resource Plays

To date, the Company has signed purchase and sales agreements for the sale of
about 3,300 boe/day of production in Western Canada for $88 million in gross
proceeds.

The Western Canada business is moving ahead with increased capital efficiency.
The repositioned portfolio is now more than 70 percent gas-weighted, providing
a natural hedge for the Company’s energy requirements at its thermal projects
and refineries.

A 16-well program targeting the Wilrich formation in the Ansell and Kakwa
areas is underway. A drilling program targeting the oil and liquids-rich
Montney formation in the Wembley and Karr areas has commenced.

Downstream

Engineering work continued on the proposed asphalt refinery, which would
double Husky’s asphalt production capacity. An open house on the project was
held in March as part of the regulatory process.

Upgrading and refining throughputs averaged 367,000 bbls/day, contributing to
overall capacity utilization of 95.5 percent.

Asia Pacific

Indonesia

At the liquids-rich BD Project offshore Indonesia, preparations are being
finalized for first production, including plans to commission the floating
production, storage and offloading (FPSO) vessel. The project is expected to
ramp up to its full sales gas rate in the second half of 2017, with a gross
sales production target of 100 million cubic feet per day (mmcf/day) of gas
(40 mmcf/day net to Husky) and 6,000 bbls/day of liquids (2,400 bbls/day net
to Husky).

At the MDA-MBH fields, platform construction is more than 40 percent complete.
A contract for the floating production unit is awaiting final government
approval. First gas is expected in the 2018-2019 timeframe, with an additional
shallow water field at MDK expected to be tied in during the same period.

Total gross sales gas volumes from BD, MDA-MBH and MDK are expected to be
approximately 250 mmcf/day of gas (100 mmcf/day net to Husky) and 6,000
bbls/day of associated liquids (2,400 bbls/day net to Husky) once production
is fully ramped up.

China

At the Liwan Gas Project, gross sales gas volumes averaged 272 mmcf/day, with
associated liquids production averaging 12,500 bbls/day. The Company realized
pricing of $13.31 per mcf for its sales gas production.

In April, Husky signed a production sharing contract for Block 16/25, located
in the Pearl River Mouth Basin. The Company expects to drill two exploration
wells on the shallow water block during the 2018 timeframe, in conjunction
with two planned exploration wells at the nearby Block 15/33.

Negotiations are progressing on a fixed-price gas sales agreement for the
Liuhua 29-1 field. Project sanction is anticipated in the second half of 2017,
subject to a final price agreement.

Atlantic

A new infill well at North Amethyst began production in the quarter, with peak
production of 8,600 bbls/day net to Husky. A second well is planned in 2017 at
White Rose, with the combined net peak production expected to be about 15,000
bbls/day. Both wells will be tied back to the SeaRose FPSO, providing for
improved capital efficiencies.

Two exploration wells are scheduled to be drilled in the Flemish Pass Basin
beginning in mid-2017.

A final investment decision on the West White Rose Project will be considered
this year.

Near and Mid-Term Project Status

/T/

Thermal Developments

Tucker Thermal Project Additional eight-well pad on
production
Tucker Thermal Project Additional 15-well pad; first oil in
first half of 2018
Sunrise Energy Project 14 new well pairs; first oil around
year end 2017
10,000 bbls/day Rush Lake 2 Lloyd First oil in first half of 2019
Thermal Project
10,000 bbls/day Dee Valley Lloyd First oil in 2020
Thermal Project
10,000 bbls/day Spruce Lake North First oil in 2020
Lloyd Thermal Project
10,000 bbls/day Spruce Lake Central First oil in 2020
Lloyd Thermal Project

Western Canada Resource Plays

16-well drilling program Under way
Exploratory Montney drilling program Under way

Downstream

Lima Refinery 40,000 bbls/day Crude 10,000 bbls/day online, completion in
Oil Flexibility Project 2018
Lloydminster Asphalt Project Sanction consideration

Asia Pacific

Liquids-rich BD Project offshore Startup in Q2 2017
Indonesia
MDA-MBH and MDK gas fields offshore Startup in 2018-2019
Indonesia
MAC gas field offshore Indonesia Plan of development approved
Liuhua 29-1 gas field offshore China Sales gas contract negotiations in
progress

Atlantic

Two White Rose infill wells On production and Q4 2017
West White Rose Project Final investment decision
consideration in 2017

/T/

2017 PLANNED MAINTENANCE AND TURNAROUNDS

Upstream

/T/

— A three-week turnaround is planned at the SeaRose FPSO in the third

quarter.
— A three-week turnaround at the partner-operated Terra Nova FPSO is
scheduled in the third quarter.

/T/

Downstream

/T/

— A four-week turnaround at the Lloydminster asphalt refinery is underway

and expected to be completed the week of May 8.
— The Lloydminster Upgrader will undergo a seven-week turnaround beginning
in the second quarter.
— A five-week partial turnaround is scheduled at the Lima Refinery in the
fourth quarter.

/T/

CORPORATE DEVELOPMENTS

Regular dividend payments on each of the Cumulative Redeemable Preferred
Shares — Series 1, Series 2, Series 3, Series 5 and Series 7 — will be paid
for the three-month period ended June 30, 2017. The dividends will be payable
on June 30, 2017 to holders of record at the close of business on June 12,
2017.

/T/

Share Series Dividend Type Rate (%) Dividend Paid ($/share)
Series 1 Regular 2.404 $0.15025
Series 2 Regular 2.210 $0.13775
Series 3 Regular 4.50 $0.28125
Series 5 Regular 4.50 $0.28125
Series 7 Regular 4.60 $0.28750

/T/

CONFERENCE CALL

A conference call will take place on Friday, May 5 at 8 a.m. Mountain Time (10
a.m. Eastern Time) to discuss the Company’s first quarter results. CEO Rob
Peabody, CFO Jon McKenzie and COO Rob Symonds will participate in the call.

/T/

To listen live: To listen to a recording (after 10 a.m.
Canada and U.S. Toll Free: 1-800- on May 5)
319-4610 Canada and U.S. Toll Free: 1-800-319-
Outside Canada and U.S.: 1-604-638- 6413
5340 Outside Canada and U.S.: 1-604-638-9010
Passcode: 1316
Duration: Available until June 5, 2017
Audio webcast: Available for 90 days at
www.huskyenergy.com/InvestorRelations

/T/

Following the conference call, the Company will hold its Annual Meeting of
Shareholders at 10:30 a.m. (Mountain Time) in the Palomino Room at the BMO
Centre, 20 Roundup Way S.E., Calgary, Alberta.

A live webcast of the meeting will be available at www.huskyenergy.com under
Investor Relations. The archived webcasts of the conference call and the
meeting will be available for approximately 90 days.

Husky Energy is a Canadian-based integrated energy company. It is
headquartered in Calgary, Alberta, Canada and its shares are publicly traded
on the Toronto Stock Exchange under the symbols HSE, HSE.PR.A, HSE.PR.B,
HSE.PR.C, HSE.PR.E and HSE.PR.G. More information is available at
www.huskyenergy.com

FORWARD-LOOKING STATEMENTS

Certain statements in this news release are forward-looking statements and
information (collectively, “forward-looking statements”), within the meaning
of the applicable Canadian securities legislation, Section 21E of the United
States Securities Exchange Act of 1934, as amended, and Section 27A of the
United States Securities Act of 1933, as amended. The forward-looking
statements contained in this news release are forward-looking and not
historical facts.

Some of the forward-looking statements may be identified by statements that
express, or involve discussions as to, expectations, beliefs, plans,
objectives, assumptions or future events or performance (often, but not
always, through the use of words or phrases such as “will likely result”, “are
expected to”, “will continue”, “is anticipated”, “is targeting”, “is
estimated”, “intend”, “plan”, “projection”, “could”, “aim”, “vision”, “goals”,
“objective”, “target”, “schedules” and “outlook”). In particular,
forward-looking statements in this news release include, but are not limited
to, references to:

/T/

— with respect to the business, operations and results of the Company

generally, the Company’s general strategic plans and growth strategies;

/T/

/T/

— with respect to the Company’s Thermal Developments: production

expectations for the Tucker Thermal Project for 2017 and 2018; the
anticipated timing of first oil from and design capacities of the Tucker
15-well pad, Rush Lake 2, Dee Valley, Spruce Lake North and Spruce Lake
Central thermal projects; the work to tie in 14 new well pairs at
Sunrise; and the expected timing of first oil and commencement of
steaming at the new well pairs at Sunrise;

/T/

/T/

— with respect to the Company’s Asia Pacific region: the expected timing

of ramp-up to full gas sales rate at the BD field; the expected timing
of first gas at the MDA-MBH fields; the expected timing of the tie-in of
an additional shallow water field at the MDK field; anticipated combined
gross volumes from the BD, MDA-MBH and MDK fields once production is
fully ramped up; drilling plans at Block 15/33 and Block 16/25; and the
expected timing of project sanction for the Liuhua 29-1 field;

/T/

/T/

— with respect to the Company’s Atlantic region: drilling plans at White

Rose for 2017; anticipated combined net peak production of the new
infill well at North Amethyst and the planned well at White Rose;
drilling plans in the Flemish Pass for 2017; and the timing to consider
the sanction of the West White Rose project.

/T/

/T/

— with respect to the Company’s Western Canada Resource Plays: expected

proceeds of sale of production; and drilling plans;

/T/

/T/

— with respect to the Company’s Upstream operating segment, the

anticipated timing and duration of turnarounds at the SeaRose FPSO and
the Terra Nova FPSO; and

/T/

/T/

— with respect to the Company’s Downstream operating segment: the

anticipated timing for completion of the crude oil flexibility project
at the Lima Refinery; and the anticipated timing and duration of
turnarounds at the Lloydminster asphalt refinery, the Lloydminster
Upgrader and the Lima Refinery.

/T/

There are numerous uncertainties inherent in projecting future rates of
production and the timing of development expenditures. The total amount or
timing of actual future production may vary from production estimates.

Although the Company believes that the expectations reflected by the
forward-looking statements presented in this news release are reasonable, the
Company’s forward-looking statements have been based on assumptions and
factors concerning future events that may prove to be inaccurate. Those
assumptions and factors are based on information currently available to the
Company about itself and the businesses in which it operates. Information used
in developing forward-looking statements has been acquired from various
sources, including third party consultants, suppliers and regulators, among
others.

Because actual results or outcomes could differ materially from those
expressed in any forward-looking statements, investors should not place undue
reliance on any such forward-looking statements. By their nature,
forward-looking statements involve numerous assumptions, inherent risks and
uncertainties, both general and specific, which contribute to the possibility
that the predicted outcomes will not occur. Some of these risks, uncertainties
and other factors are similar to those faced by other oil and gas companies
and some are unique to the Company.

The Company’s Annual Information Form for the year ended December 31, 2016 and
other documents filed with securities regulatory authorities (accessible
through the SEDAR website www.sedar.com and the EDGAR website www.sec.gov)
describe risks, material assumptions and other factors that could influence
actual results and are incorporated herein by reference.

New factors emerge from time to time and it is not possible for management to
predict all of such factors and to assess in advance the impact of each such
factor on the Company’s business or the extent to which any factor, or
combination of factors, may cause actual results to differ materially from
those contained in any forward-looking statement. The impact of any one factor
on a particular forward-looking statement is not determinable with certainty
as such factors are dependent upon other factors, and the Company’s course of
action would depend upon management’s assessment of the future considering all
information available to it at the relevant time. Any forward-looking
statement speaks only as of the date on which such statement is made and,
except as required by applicable securities laws, the Company undertakes no
obligation to update any forward-looking statement to reflect events or
circumstances after the date on which such statement is made or to reflect the
occurrence of unanticipated events.

Non-GAAP Measures

This news release contains references to the terms “funds from operations”,
“free cash flow” and “adjusted net earnings (loss)”, which do not have
standardized meanings prescribed by International Financial Reporting
Standards (“IFRS”). Refer to “Non-GAAP Measures” in section 11 of the
Company’s Management’s Discussion and Analysis for the year ended December 31,
2016.

This news release also contains references to “operating netback” and “net
debt”, which do not have standardized meanings prescribed by IFRS and are
therefore unlikely to be comparable to similar measures presented by other
issuers.

Operating netback is a common non-GAAP measure used in the oil and gas
industry. This measure assists management and investors to evaluate the
specific operating performance by product at the oil and gas lease level.
Operating netback is calculated as gross revenue less royalties, production
and operating and transportation costs on a per unit basis.

Net debt is a non-GAAP measure that equals total debt less cash and cash
equivalents. Total debt is calculated as long-term debt, long-term debt due
within one year and short-term debt. Net debt is considered to be a useful
measure in assisting management and investors to evaluate the Company’s
financial strength.

The following table shows the reconciliation of total debt to net debt as at
March 31, 2017 and December 31, 2016:

/T/

($ millions) March 31, 2017 December 31, 2016
———————————————————- —————–
Short-term debt 200 200
Long-term debt due within one year 400 403
Long-term debt 5,453 4,736
———————————————————- —————–
Total debt 6,053 5,339
———————————————————- —————–
Cash and cash equivalents (2,245) (1,319)
———————————————————- —————–
Net Debt 3,808 4,020
———————————————————- —————–

/T/

Disclosure of Oil and Gas Information

The Company uses the term “barrels of oil equivalent” (or “boe”), which is
consistent with other oil and gas companies’ disclosures, and is calculated on
an energy equivalence basis applicable at the burner tip whereby one barrel of
crude oil is equivalent to six thousand cubic feet of natural gas. The term
boe is used to express the sum of the total company products in one unit that
can be used for comparisons. Readers are cautioned that the term boe may be
misleading, particularly if used in isolation. This measure is used for
consistency with other oil and gas companies and does not represent value
equivalency at the wellhead.

Unless otherwise noted, projected and historical production volumes are
presented on a net to Husky before royalties basis.

All currency is expressed in Canadian dollars unless otherwise indicated.

– END RELEASE – 05/05/2017

For further information:

For further information, please contact:

Investor Inquiries:

Rob Knowles
Manager, Investor Relations
Husky Energy Inc.
587-747-2116

Media Inquiries:

Mel Duvall
Manager, Media & Issues
Husky Energy Inc.
403-513-7602

COMPANY:
FOR: HUSKY ENERGY INC.
TSX Symbol: HSE

INDUSTRY: Energy and Utilities – Oil and Gas
RELEASE ID: 20170505CC019

Press Release from Marketwired 1-866-736-3779

All press releases are written by the client and have NO affiliation with the news copy written by The Canadian Press. Any questions that arise due to the content or information provided in the press release should be directed to the company/organization
issuing the release, not to The Canadian Press.

GET ENERGYNOW’S DAILY EMAIL FOR FREE


Seven Generations Reports Voting Results of Election of Directors

FOR: SEVEN GENERATIONS ENERGY LTD.TSX SYMBOL: VIIDate issue: May 04, 2017Time in: 10:30 PM eAttention:
CALGARY, ALBERTA–(Marketwired – May 4, 2017) – Seven Generations Energy Ltd.
(“Seven Generations” or “7G”) (TSX:VII) reports director election resu…

GET ENERGYNOW’S DAILY EMAIL FOR FREE


Bonavista Energy Corporation Reports on Voting From Shareholders Meeting

FOR: BONAVISTA ENERGY CORPORATION
TSX SYMBOL: BNP

Date issue: May 04, 2017
Time in: 9:05 PM e

Attention:

CALGARY, ALBERTA–(Marketwired – May 4, 2017) – Bonavista Energy Corporation
(TSX:BNP) (“Bonavista”) announces that all matters presented for approval at
the annual meeting of shareholders held today have been fully authorized and
approved. A total of 151,127,539 votes, representing 59.3% of total votes
entitled to vote at the meeting, were voted in connection with the matters
considered at the meeting.

At the meeting, all of the nominees proposed as directors were duly elected as
directors of Bonavista with a majority of votes cast by the shareholders
present or represented at the meeting as follows:

/T/

Percent Votes Percent
Name of Nominee Votes For (%) Withheld (%)
———————— ———— ———— ———— ————
Keith A. MacPhail 146,677,485 97.65 3,526,160 2.35
Ian S. Brown 147,776,194 98.38 2,427,451 1.62
Michael M. Kanovsky 145,795,930 97.07 4,407,715 2.93
Sue Lee 148,073,879 98.58 2,129,766 1.42
Margaret A. McKenzie 148,205,450 98.67 1,998,195 1.33
Robert G. Phillips 148,118,833 98.61 2,084,812 1.39
Ronald J. Poelzer 139,946,740 93.17 10,256,905 6.83
Jason E. Skehar 148,637,449 98.96 1,566,196 1.04
Christopher P. Slubicki 141,663,982 94.31 8,539,663 5.69

/T/

Bonavista is focused on creating premium shareholder value through the
efficient development of high quality oil and natural gas assets.

– END RELEASE – 04/05/2017

For further information:
Jason E. Skehar
President & CEO
OR
Dean M. Kobelka
Vice President, Finance & CFO
OR
Berk Sumen
Investor Relations Lead
OR
Bonavista Energy Corporation
1500, 525 – 8th Avenue SW
Calgary, AB T2P 1G1
Phone: (403) 213-4300
Website: www.bonavistaenergy.com

COMPANY:
FOR: BONAVISTA ENERGY CORPORATION
TSX SYMBOL: BNP

INDUSTRY: Energy and Utilities – Oil and Gas
RELEASE ID: 20170504CC0143

Press Release from Marketwired 1-866-736-3779

All press releases are written by the client and have NO affiliation with the news copy written by The Canadian Press. Any questions that arise due to the content or information provided in the press release should be directed to the company/organization
issuing the release, not to The Canadian Press.

GET ENERGYNOW’S DAILY EMAIL FOR FREE


Alignment of Goals Sets the Stage for Successful Routine Maintenance – T.A. Cook

Mike Asquini, CRMP Senior Consultant, T.A. Cook Consultants, Inc.     In order for an organization to be successful, it must be aligned as to how and why it will accomplish its goals. Without target alignment, a company is likely to have different expectations and beliefs, especially surrounding the performance of routine maintenance. This affects … Read more

GET ENERGYNOW’S DAILY EMAIL FOR FREE


Canadian Utilities Limited Reports on Voting Results From the 2017 Annual Meeting of Share Owners

FOR: CANADIAN UTILITIES LIMITED
TSX SYMBOL: CU
TSX SYMBOL: CU.X

Date issue: May 04, 2017
Time in: 7:57 PM e

Attention:

CALGARY, ALBERTA–(Marketwired – May 4, 2017) – Canadian Utilities Limited
(TSX:CU)(TSX:CU.X)

The following matter was voted upon at the Annual Meeting of Share Owners of
Canadian Utilities Limited (the “Corporation”) held on May 3, 2017 in Edmonton,
Alberta. This matter is described in greater detail in the 2017 Notice of
Annual Meeting of Share Owners and Management Proxy Circular dated March 7,
2017.

By a resolution passed by ballot, each of the following 10 nominees proposed by
management was elected as a Director of the Corporation to hold office until
the next annual meeting of share owners of the Corporation or until his/her
successor is elected or appointed:

/T/

—————————————————————————-

%
NOMINEES VOTES FOR IN FAVOUR
—————————————————————————-

—————————————————————————-
Matthias F. Bichsel 68,523,764 99.9
—————————————————————————-
Loraine M. Charlton 68,523,930 99.9
—————————————————————————-
Robert B. Francis 68,525,532 99.9
—————————————————————————-
Robert J. Normand 68,525,532 99.9
—————————————————————————-
Hector A. Rangel 68,519,764 99.9
—————————————————————————-
Laura A. Reed 68,524,414 99.9
—————————————————————————-
James W. Simpson 68,516,180 99.9
—————————————————————————-
Nancy C. Southern 68,523,030 99.9
—————————————————————————-
Linda A. Southern-Heathcott 68,518,160 99.9
—————————————————————————-
Charles W. Wilson 68,516,688 99.9
—————————————————————————-

/T/

With approximately 5,400 employees and assets of $19 billion, Canadian
Utilities Limited is an ATCO company. ATCO is a diversified global corporation
delivering service excellence and innovative business solutions in Structures &
Logistics (workforce housing, innovative modular facilities, construction, site
support services, and logistics and operations management); Electricity
(electricity generation, transmission, and distribution); Pipelines & Liquids
(natural gas transmission, distribution and infrastructure development, energy
storage, and industrial water solutions); and Retail Energy (electricity and
natural gas retail sales). More information can be found at
www.canadianutilities.com.

Forward-Looking Information:

Certain statements contained in this news release may constitute
forward-looking information. Forward-looking information is often, but not
always, identified by the use of words such as “anticipate”, “plan”,
“estimate”, “expect”, “may”, “will”, “intend”, “should”, and similar
expressions.

Forward-looking information involves known and unknown risks, uncertainties and
other factors that may cause actual results or events to differ materially from
those anticipated in such forward-looking information.

The Company’s actual results could differ materially from those anticipated in
this forward-looking information as a result of regulatory decisions,
competitive factors in the industries in which the Company operates, prevailing
economic conditions, and other factors, many of which are beyond the control of
the Company.

The Company believes that the expectations reflected in the forward-looking
information are reasonable, but no assurance can be given that these
expectations will prove to be correct and such forward-looking information
should not be unduly relied upon.

Any forward-looking information contained in this news release represents the
Company’s expectations as of the date hereof, and is subject to change after
such date. The Company disclaims any intention or obligation to update or
revise any forward-looking information whether as a result of new information,
future events or otherwise, except as required by applicable securities
legislation.

– END RELEASE – 04/05/2017

For further information:
Media & Investor Inquiries:
B.R. (Brian) Bale
Senior Vice President & Chief Financial Officer
403-292-7502

COMPANY:
FOR: CANADIAN UTILITIES LIMITED
TSX SYMBOL: CU
TSX SYMBOL: CU.X

INDUSTRY: Energy and Utilities – Utilities, Energy and Utilities –
Pipelines
RELEASE ID: 20170504CC0140

Press Release from Marketwired 1-866-736-3779

All press releases are written by the client and have NO affiliation with the news copy written by The Canadian Press. Any questions that arise due to the content or information provided in the press release should be directed to the company/organization
issuing the release, not to The Canadian Press.

GET ENERGYNOW’S DAILY EMAIL FOR FREE


Cardinal Energy Ltd. Announces First Quarter 2017 Results

FOR: CARDINAL ENERGY LTD.TSX SYMBOL: CJDate issue: May 04, 2017Time in: 7:06 PM eAttention:
CALGARY, ALBERTA–(Marketwired – May 4, 2017) – Cardinal Energy Ltd.
(“Cardinal” or the “Company”) (TSX:CJ) is pleased to announce its operating and
financial …

GET ENERGYNOW’S DAILY EMAIL FOR FREE


Voting Results of BlackPearl Annual and Special Meeting

FOR: BLACKPEARL RESOURCES INC.TSX SYMBOL: PXXOMX SYMBOL: PXXSDate issue: May 04, 2017Time in: 7:00 PM eAttention:
CALGARY, ALBERTA–(Marketwired – May 4, 2017) – BlackPearl Resources Inc.
(“BlackPearl” or the “Company”) (TSX:PXX)(OMX:PXXS) announces t…

GET ENERGYNOW’S DAILY EMAIL FOR FREE


Just Energy to Announce Fourth Quarter Fiscal 2017 Results

FOR: JUST ENERGY GROUP INC.
NYSE SYMBOL: JE
TSX SYMBOL: JE

Date issue: May 04, 2017
Time in: 6:19 PM e

Attention:

TORONTO, ONTARIO–(Marketwired – May 4, 2017) – Just Energy Group, Inc.
(TSX:JE)(NYSE:JE), a leading retail energy provider specializing in electricity
and natural gas commodities, energy efficiency solutions, and renewable energy
options, today announced that it will release operating results for fourth
quarter fiscal 2017 after market close on May 17th, 2017. The Company will host
a conference call and live webcast to review the fiscal fourth quarter results
beginning at 10:00 a.m. Eastern Standard Time on May 18th, 2017 followed by a
question and answer period. Rebecca MacDonald, Executive Chair, President &
Co-Chief Executive Officers James Lewis and Deborah Merril, and Chief Financial
Officer Patrick McCullough will participate on the call.

Just Energy Conference Call and Webcast

/T/

— Thursday, May 18th, 2017
— 10:00 a.m. EST

/T/

Those who wish to participate in the conference call may do so by dialing
1-888-465-5079 and entering pass code 7009356#. The call will also be webcast
live over the internet at the following link:

http://event.onlineseminarsolutions.com/wcc/r/1357730-1/5FF4034F544B855A5723B091
5E568910

An audio tape rebroadcast will be available starting at 12:30 p.m. EST May
18th, 2017 until June 17th, 2017 at 11:59 p.m. EST. To access the rebroadcast
please dial 1-888-843-7419 and enter the participant code 7009356#.

About Just Energy Group Inc.

Established in 1997, Just Energy (NYSE:JE)(TSX:JE) is a leading retail energy
provider specializing in electricity and natural gas commodities, energy
efficiency solutions, and renewable energy options. With offices located across
the United States, Canada, the United Kingdom and Germany, Just Energy serves
approximately two million residential and commercial customers providing homes
and businesses with a broad range of energy solutions that deliver comfort,
convenience and control. Just Energy Group Inc. is the parent company of Amigo
Energy, Green Star Energy, Hudson Energy, Just Energy Solar, Tara Energy and
TerraPass.

– END RELEASE – 04/05/2017

For further information:
Patrick McCullough
Chief Financial Officer
Just Energy
713-933-0895
[email protected]
OR
Michael Cummings
Investor Relations
Alpha IR
617-461-1101
[email protected]

COMPANY:
FOR: JUST ENERGY GROUP INC.
NYSE SYMBOL: JE
TSX SYMBOL: JE

INDUSTRY: Energy and Utilities – Oil and Gas , Financial Services –
Personal Finance
RELEASE ID: 20170504CC0132

Press Release from Marketwired 1-866-736-3779

All press releases are written by the client and have NO affiliation with the news copy written by The Canadian Press. Any questions that arise due to the content or information provided in the press release should be directed to the company/organization
issuing the release, not to The Canadian Press.

GET ENERGYNOW’S DAILY EMAIL FOR FREE


Bengal Energy Announces Exploration and Operational Update

FOR: BENGAL ENERGY LTD.
TSX SYMBOL: BNG

Date issue: May 04, 2017
Time in: 6:05 PM e

Attention:

CALGARY, ALBERTA–(Marketwired – May 4, 2017) – Bengal Energy Ltd. (TSX:BNG)
(“Bengal” or the “Company”) today announces its exploration and operational
update.

EXPLORATION UPDATE:

Natural Gas Demand

In Australia, the significant increase in demand associated with newly
commissioned liquefied natural gas (“LNG”) export projects suggests that the
Eastern Australia gas market will need significant new supply of natural gas in
the medium term.
The strong natural gas demand environment has continued to develop in Eastern
Australia irrespective of crude pricing, which has begun to impact the
exploration industry as a whole. This looming natural gas shortage is evidenced
by recent spikes seen in the Australian East Coast spot gas markets to greater
than AUS $20 per gigajoule.

ATP 934 Background

Bengal holds a 71.43 percent working interest and operatorship in the ATP 934
permit. The permit is now in Year 2 having met the Year 1 permit commitment
with the reprocessing of the existing 580 line kms of 2D data. Planning for the
Year 2 commitment program, a 260 sq. km 3D seismic acquisition program is well
underway with favourable acquisition contractor bids in hand.

The permit is located near and bordered by successful wells drilled in new gas
plays. ATP 934 is also surrounded by gas fields on all sides, five of which
have produced a cumulative 93 Bcf of natural gas and associated liquids to June
2016 and continue to produce at an average rate of approximately 18 MMcfd (June
2016). No wells have been drilled on ATP 934.
Tenements lying to the north and west of the permit have been actively drilled
over the past 24 months with 100% success. The 3D seismic covering these
adjacent tenements is now available in the public domain.

Bengal’s view of the potential for significant gas discoveries on the ATP 934
permit is strongly supported by both 2D and 3D seismic data, which
significantly improves prospect imaging and provides greater detail of the
reservoir geology and structural controls. To date, Bengal has identified and
mapped a total of five individual drilling prospects with targeted drill depths
between 2,700 and 2,900 metres on the permit. An additional tight gas resource
potential has also been identified by Bengal on the block. The five high-graded
‘conventional’ prospect areas total over 107 sq. kms.

Bengal believes that the permit has the potential to become a substantial new
gas supply and to provide a valuable contribution to the East Coast gas market.

ATP 732 Tookoonooka Block

The Company continues to plan further activity on this block and as of March
31, 2017 has relinquished 33.33% of the land block pursuant to the mandatory
relinquishment requirement for the permit under the Queensland legislation. The
relinquished area was drilled unsuccessfully by previous operators and was not
core to the high-graded prospect areas on the retained acreage. While there are
no outstanding commitments on this permit, Bengal is currently studying the
Permian gas potential along the northern flank of the permit as well as the
largely unexplored oil potential in the southern part of the permit closer to
the producing Jackson/Jackson South Field which has produced over 49 million
barrels of oil to date.

OPERATIONAL UPDATE:

ATP 752 Barta Block Cuisinier

During calendar Q1 2017, the Company completed, pipeline connected and equipped
to pump four wells from its 2016 drilling program (Cuisinier 22, Cuisinier 24,
Cuisinier 25 and Shefu 1). These four wells are expected to be on-stream during
May and early June 2017 with initial production rates expected to be in line
with those from previous Bengal drilling programs. In addition, successful
results from the fracture stimulation programs on the five wells carried out
during 2015/2016 are expected to lead to further targeted stimulation activity
during 2017.

The near-field exploration well Shefu-1 confirms a westerly extension of the
Cuisinier pool within PL303. The Murta oil pay zone at Shefu 1 is structurally
lower than previously encountered during appraisal drilling at Cuisinier,
therefore lowering the “lowest known oil” for the area. Bengal’s internal
estimates suggest that this Shefu-1 result has the potential to materially
increase the areal extent of the Cuisinier oil field and its oil in place and
reserves, given that the Murta reservoir in the Shefu-1 area is well outside of
Bengal’s 1P, 2P and 3P reserves areas booked pursuant to Bengal’s independent
reserves evaluation dated March 31, 2016.

The Barta Joint Venture has now finalized its plans for the acquisition of the
Barta West 3D seismic program which is expected to commence in June 2017. This
seismic program is designed to further define potential drilling locations and
will cover an estimated 250 sq. kms, which could result in further pool
expansion to the west and south of current boundaries. Bengal views the Barta
West area as a continuing natural extension from the de-risked Cuisinier pool
area and has mapped numerous prospects on existing 2D seismic covering in
excess of 110 sq. kms.

Bengal will be releasing its annual independent reserves evaluation information
along with its year-end financial information before the June 29, 2017 filing
deadline.

About Bengal

Bengal Energy Ltd. is an international junior oil and gas exploration and
production company with assets in Australia. The Company is committed to
growing shareholder value through international exploration, production and
acquisitions. Bengal’s common shares trade on the TSX under the symbol “BNG”.
Additional information is available at www.bengalenergy.ca

Forward-Looking Statements

This news release contains certain forward-looking statements or information
(“forward-looking statements”) as defined by applicable securities laws that
involve substantial known and unknown risks and uncertainties, many of which
are beyond Bengal’s control. These statements relate to future events or our
future performance. All statements other than statements of historical fact may
be forward-looking statements. The use of any of the words “plan”, “expect”,
“prospective”, “project”, “intend”, “believe”, “should”, “anticipate”,
“estimate”, or other similar words or statements that certain events “may” or
“will” occur are intended to identify forward-looking statements. The
projections, estimates and beliefs contained in such forward-looking statements
are based on management’s estimates, opinions, and assumptions at the time the
statements were made, including assumptions relating to: the impact of economic
conditions in North America and Australia and globally; industry conditions;
changes in laws and regulations including, without limitation, the adoption of
new environmental laws and regulations and changes in how they are interpreted
and enforced; increased competition; the availability of qualified operating or
management personnel; fluctuations in commodity prices, foreign exchange or
interest rates; stock market volatility and fluctuations in market valuations
of companies with respect to announced transactions and the final valuations
thereof; results of exploration and testing activities; and the ability to
obtain required approvals and extensions from regulatory authorities. We
believe the expectations reflected in those forward-looking statements are
reasonable but, no assurances can be given that any of the events anticipated
by the forward-looking statements will transpire or occur, or if any of them do
so, what benefits that Bengal will derive from them.
As such, undue reliance should not be placed on forward-looking statements.
Forward-looking statements contained herein include, but are not limited to,
statements regarding: the potential for significant gas discoveries and new gas
supply on ATP 934; the timing and plans of further activity on ATP 732; the
timing and results of the four wells at Cuisinier coming onstream; the timing
of further stimulation activity at Cuisinier; the potential for Shefu 1 results
to increase the areal extent of the Cuisinier oil field and its oil in place
and reserves and the timing of the Barta West 3D seismic program. The
forward-looking statements contained herein are subject to numerous known and
unknown risks and uncertainties that may cause Bengal’s actual financial
results, performance or achievement in future periods to differ materially from
those expressed in, or implied by, these forward-looking statements, including
but not limited to, risks associated with: the failure to obtain required
regulatory approvals or extensions; failure to satisfy the conditions under
farm-in and joint venture agreements; failure to secure required equipment and
personnel; changes in general global economic conditions including, without
limitations, the economic conditions in North America and Australia; increased
competition; the availability of qualified operating or management personnel;
fluctuations in commodity prices, foreign exchange or interest rates; changes
in laws and regulations including, without limitation, the adoption of new
environmental and tax laws and regulations and changes in how they are
interpreted and enforced; the results of exploration and development drilling
and related activities; the ability to access sufficient capital from internal
and external sources; and stock market volatility. Readers are encouraged to
review the material risks discussed in Bengal’s Annual Information Form for the
year ended March 31, 2016 under the heading “Risk Factors” and in Bengal’s
annual MD&A under the heading “Risk Factors”. The Company cautions that the
foregoing list of assumptions, risks and uncertainties is not exhaustive. The
forward-looking statements contained in this news release speak only as of the
date hereof and Bengal does not assume any obligation to publicly update or
revise them to reflect new events or circumstances, except as may be require
pursuant to applicable securities laws.

Analogous Information

Certain information provided in this news release may constitute “analogous
information” under applicable securities legislation, such as reserve and
resource estimates or the reserves and resources present on the Company’s
lands, and nearby lands, total production and production-rates from wells
drilled by the Company or other industry participants located in geographical
proximity to lands held by the Company. This information is derived from
publicly available information sources (as at the date of this news release)
that the Company believes are predominantly independent in nature. The Company
believes this information is relevant as it helps to define the reservoir
characteristics in which the Company may have an interest. The Company is
unable to confirm that the analogous information was prepared by a qualified
reserves evaluator or auditor or in accordance with the Canadian Oil and Gas
Evaluation Handbook and therefore, the reader is cautioned that the data relied
upon by the Company may be in error, may not be analogous to the Company’s land
holdings and/or may not be representative of actual results of wells
anticipated to be drilled or completed by the Company in the future

Certain Defined Terms

/T/

Bcf – billion cubic feet
MMcfd – million cubic feet per day

/T/

– END RELEASE – 04/05/2017

For further information:
Bengal Energy Ltd.
Chayan Chakrabarty
President & Chief Executive Officer
(403) 205-2526
[email protected]
www.bengalenergy.ca
OR
Bengal Energy Ltd.
Jerrad Blanchard
Chief Financial Officer
(403) 205-2526
[email protected]
www.bengalenergy.ca

COMPANY:
FOR: BENGAL ENERGY LTD.
TSX SYMBOL: BNG

INDUSTRY: Energy and Utilities – Oil and Gas
RELEASE ID: 20170504CC0131

Press Release from Marketwired 1-866-736-3779

All press releases are written by the client and have NO affiliation with the news copy written by The Canadian Press. Any questions that arise due to the content or information provided in the press release should be directed to the company/organization
issuing the release, not to The Canadian Press.

GET ENERGYNOW’S DAILY EMAIL FOR FREE


Canadian Natural Resources approves another expansion of Horizon oilsands project

CALGARY — Canadian Natural Resources says it has approved another expansion of its Horizon oilsands mine but must revisit the scope of the project because of unexpectedly robust production from two previous expansions.

Horizon, which currently has a maximum design capacity of 182,000 barrels per day, is churning out 205,000 bpd of upgraded bitumen, the Calgary-based oil and natural gas producer (TSX:CNQ) said Thursday.

Engineering work is taking place to determine how much more the plant can handle, CEO Steve Laut said on a conference call with analysts.

“Just to be clear though, this is a good problem to have,” said Laut.

The expansion, expected to take place this summer during a maintenance shutdown, is intended to ease the bottleneck. The company has said the project could cost about $70 million and add between 5,000 and 15,000 bpd of capacity.

Output from that expansion is anticipated to begin in the fall, the same time as new production would come from a separate $1-billion, 80,000-bpd expansion at Horizon.

Earlier Thursday, Canadian Natural said it had total oil and natural gas liquids production of almost 600,000 bpd in the first quarter ended March 31, slightly better than the 547,000 bpd in the same period a year ago.

Net income was $245 million, an improvement from a net loss of $105 million a year ago.

Revenue after royalty payments was $3.64 billion, up from $2.18 billion in the first quarter of 2016, as average realized oil prices more than doubled.


Follow @HealingSlowly on Twitter.

Dan Healing, The Canadian Press

Note to readers: This is a corrected story. A previous version said in headlines that CNRL approved a third expansion. There have been multiple expansions of the Horizon oilsands mine.


GET ENERGYNOW’S DAILY EMAIL FOR FREE


Enerflex Reports First Quarter 2017 Financial Results and Quarterly Dividend

FOR: ENERFLEX LTD.
TSX SYMBOL: EFX

Date issue: May 04, 2017
Time in: 5:17 PM e

Attention:

CALGARY, ALBERTA–(Marketwired – May 4, 2017) – Enerflex Ltd. (TSX:EFX)
(“Enerflex” or “the Company” or “we” or “our”), a leading supplier of products
and services to the global energy industry, today reported its financial and
operating results for the three months ended March 31, 2017.

Summary Table of First Quarter of 2017 Financial and Operating Results

/T/

(unaudited)
($ Canadian millions, except per
share amounts, horsepower, and Three months ended
percentages) March 31,

2017 2016 Change
—————————————————————————-
Revenue $ 354.8 $ 271.7 $ 83.1
Gross margin 73.3 46.4 26.9
EBIT (loss) (1) 33.1 (91.1) 124.2
Adjusted EBIT (2) 30.2 7.2 23.0
EBITDA (1) 52.9 (68.5) 121.4
Adjusted EBITDA (2) 50.0 29.8 20.2
Net earnings (loss) – continuing
operations $ 24.5 $ (93.5) $ 118.0
Earnings (loss) per share –
continuing operations 0.28 (1.18) 1.46
Recurring revenue % (3) 38.2% 35.9%
Bookings (4) $ 318.7 $ 65.0 $ 253.7
Backlog (4) 692.2 334.9 357.3
Rental horsepower 480,022 498,193 (18,171)

(1) Earnings before Interest (Finance Costs), Taxes, Depreciation and
Amortization (“EBITDA”) and Earnings before Interest (Finance Costs) and
Taxes (“EBIT”) are considered non-GAAP and additional GAAP measures, which
may not be comparable with similar non-GAAP or additional GAAP measures used
by other entities.
(2) Adjusted EBITDA and Adjusted EBIT are non-GAAP measures. These measures
provide a better representation of the Company’s ongoing operations. Please
refer to the full reconciliation of these items in the Adjusted EBIT and
Adjusted EBITDA section.
(3) Determined by taking the trailing 12-month period.
(4) Bookings and backlog are considered non-GAAP measures that do not have
standardized meanings as prescribed by GAAP, and are therefore unlikely to
be comparable to similar measures used by other entities.

/T/

“Enerflex’s first quarter financial results continue to demonstrate the
momentum that we experienced over the last half of 2016. Customers remain
somewhat cautious with their capital expenditures; however, we are seeing
evidence that capital budgets are improving in all of our operating regions,”
said J. Blair Goertzen, Enerflex’s President and Chief Executive Officer. “With
the relative stability in commodity prices, Enerflex experienced another
quarter of strong customer enquiries and bookings in North America. On the
strength of these bookings, Company backlog – a leading indicator of future
revenue – was 11.4% higher than at the end of 2016. Enerflex remains committed
to operating with caution and controlling costs, protecting the Company’s
balance sheet, and generating strong free cash flow.”

Quarterly Overview

/T/

— Recorded bookings of $318.7 million, a significant increase of 390%

compared to the $65.0 million recorded in the first quarter of 2016.
Bookings in the first quarter of 2017 marked the fourth consecutive
quarter where the bookings increased over the same quarter from the
comparative period.
— Engineered Systems backlog at March 31, 2017 was $692.2 million, an
11.4% increase compared to the December 31, 2016 backlog of $621.4
million.
— Reported an EBIT of $33.1 million for the three months ended March 31,
2017, compared to EBIT loss of $91.1 million in the first quarter of
2016. The EBIT loss for the three months ended March 31, 2016 includes
goodwill impairment losses of $92.1 million. Adjusted EBIT was $30.2
million for the three months ended March 31, 2017, compared to $7.2
million for the same period in 2016, after excluding severance and
restructuring costs in Canada, Asia and Australia; the impairment of
assets and goodwill associated with Canada; and, the gain on the
disposal of PP&E.
— The Company continues to see a strong bookings trend after the end of
the quarter with approximately $250 million of bookings recorded already
during the second quarter, including approximately $160 million of
bookings in the Rest of World segment.
— Subsequent to quarter end, declared a quarterly dividend of $0.085 per
share payable July 6, 2017 to shareholders on record on May 18, 2017.

/T/

First Quarter Results Summary
Net earnings for the first quarter of 2017 was higher compared to the same
period of 2016 primarily as a result of higher revenues, improved gross margin,
and lower SG&A expenses. The increase in revenues was primarily driven by
improved Engineered Systems revenues in the Canada and USA segments. Service
revenues decreased slightly over the same period last year, but the declines
were partially offset by higher parts sales in Canada. Rental revenues also
declined over the prior year due to lower utilization and rental rates, largely
in the Rest of World segment. The consolidated gross margin percentage of 20.7%
for the quarter, was higher than the 17.1% margin realized in the prior year.
The margin increased due to improved project profitability, improved overhead
absorption, lower inventory reserves, and lower asset impairments. SG&A
expenses decreased $4.7 million during the three months ended March 31, 2017
primarily as a result of the effects of restructuring activities undertaken in
prior periods, partially offset by higher stock-based compensation costs driven
by higher share prices. The first quarter 2017 results also reflect an $2.9
million gain on the sale of fixed assets.

The Company’s geographic and product line diversification contributed to
keeping margins relatively stable in a continuingly competitive and constrained
economic environment caused by low commodity prices.

Adjusted EBIT and Adjusted EBITDA
The Company recorded a number of items in its results that are not expected to
recur in the normal course of business. The exclusion of these items presents a
view of the results that should be more representative of the Company’s normal
operations. The presentation of adjusted EBIT and adjusted EBITDA should not be
considered in isolation from EBIT or EBITDA as determined under IFRS. The
adjusted EBIT and adjusted EBITDA may not be comparable to similar measures
presented by other companies and should not be considered in isolation or as a
replacement for measures prepared as determined under IFRS.

The items that have been adjusted for presentation purposes relate generally to
two categories: 1) impairment or gains on assets; and, 2) restructuring
activities. Exclusion of these items should allow for a better understanding of
on-going, normal operations of the Company.

/T/

($ Canadian millions)
Three months ended March 31,
2017 Total Canada USA ROW
—————————————————————————-
Reported EBIT $ 33.1 $ 1.3 $ 22.6 $ 9.2
Restructuring costs in COGS and
SG&A – – – –
Write-down of equipment in COGS – – – –
(Gain) loss on disposal of PP&E (2.9) (2.9) 0.0 (0.0)
Goodwill impairment – – – –
—————————————————————————-
Adjusted EBIT $ 30.2 $ (1.6) $ 22.6 $ 9.2
Depreciation and amortization 19.8 3.5 2.9 13.4
—————————————————————————-
Adjusted EBITDA $ 50.0 $ 1.9 $ 25.5 $ 22.6
——————————————–
——————————————–

($ Canadian millions)
Three months ended March 31,
2016 Total Canada USA ROW
—————————————————————————-
Reported EBIT (loss) $ (91.1) $ (101.2) $ 8.0 $ 2.1
Restructuring costs in COGS and
SG&A 6.2 5.4 0.5 0.3
Write-down of equipment in COGS – – – –
(Gain) loss on disposal of PP&E (0.0) (0.0) 0.0 0.0
Goodwill impairment 92.1 92.1 – –
—————————————————————————-
Adjusted EBIT $ 7.2 $ (3.7) $ 8.5 $ 2.4
Depreciation and amortization 22.6 4.0 3.9 14.7
—————————————————————————-
Adjusted EBITDA $ 29.8 $ 0.3 $ 12.4 $ 17.1
——————————————–
——————————————–

/T/

Segmented Results

Canada
Canada segment revenue in the first quarter of 2017 was $76.3 million, an
increase of $15.2 million or 24.8% from $61.2 million recorded in the same
period of 2016. Engineered Systems revenue is reflective of the increased level
of bookings from the back half of 2016. The Service product line revenue
increased largely due to higher parts sales.

Operating loss for the first quarter of 2017 was $1.5 million compared to an
operating loss of $11.4 million in the comparable quarter last year. This
improvement resulted from higher revenues, improved gross margin and lower SG&A
costs during the quarter. The increase in gross margin was the result of
increased overhead absorption and lower inventory reserves. The reduction in
SG&A expense was attributable to lower compensation expense on lower headcount.
EBIT for the first quarter of 2017 was $1.3 million compared to an EBIT loss of
$101.2 million in the first quarter of 2016. The first quarter of 2017 includes
a $2.4 million gain on sale of a building. The 2016 results are unfavourably
impacted by a $92.1 million goodwill impairment and $5.4 million of
restructuring costs.

USA
USA segment revenue in the first quarter of 2017 was $193.2 million, an
increase of $83.4 million or 75.9% from $109.8 million a year earlier. The
increase is due to higher Engineered Systems revenue, partially offset by lower
Service and Rental revenue. Engineered Systems revenue increased due to the
realization of the increased bookings in the back half of 2016 as compared to
the back half of 2015. Service revenue was lower as a result of deferred
maintenance, while Rental revenue was lower due to weaker utilization and
rental rates.

Operating income increased by $14.6 million during the first quarter of 2017
due to higher revenue, higher gross margins, and decreased SG&A expenses. Gross
margin increases were driven by project margin improvements and improved
overhead absorption. SG&A expenses decreased primarily due to lower
compensation expense on lower headcount.

Rest of World
Rest of World segment revenue in the first quarter of 2017 was $85.3 million,
which decreased by $15.5 million or 15.3% from 2016 due to decreases in
Engineered Systems, Service and Rental revenue. Engineered Systems revenue
declined due to the completion of some larger projects in 2016, largely in the
Middle East and Argentina. Service revenue remained under pressure with lower
service activity in Latin America and Australia, and reduced parts sales in
Australia and Asia, partially offset by higher activity in the Middle East /
Africa (“MEA”) region. Rental revenues have also decreased due to lower
utilization and rental rates in Mexico, and slower economic conditions in some
of the markets this segment services.

Stabilization of commodity prices in the second half of 2016 and first quarter
of 2017 led to increased enquiries and continued strength in bookings in the
first quarter, particularly in the Canada and USA segments. The Company is
cautiously optimistic that further stability or improvement in commodity prices
may cause customers to further increase investment, which should translate to
further demand for the Company’s products and services. The start of 2017 has
been positive with bookings of $318.7 million, predominantly in North America.
The Rest of World segment continues to experience strong enquiry levels and
after the quarter, the Company recorded approximately $160 million of new
customer bookings in the Middle East and Colombia. Enerflex also signed a
rental contract renewal that runs for five years for 14,000 horsepower,
consistent with our strategy of increasing our recurring revenue stream.

Dividend
Subsequent to the end of the first quarter of 2017, Enerflex declared a
quarterly dividend of $0.085 per share, payable on July 6, 2017, to
shareholders of record on May 18, 2017.

Enerflex’s Board of Directors
As previously outlined in Enerflex’s 2017 Information Circular, Wayne S. Hill
has decided not to stand for re-election to Enerflex’s Board of Directors. Over
the past six years, Wayne has been a vital part of Enerflex’s Board, including
serving as Chair of the Audit Committee and as a member of the Nominating and
Corporate Governance Committee. “On behalf of the Board of Directors,
Management, and Enerflex Shareholders, we would like to thank Wayne for his
tremendous work and contributions and wish him well in his future endeavors,”
said Stephen J. Savidant, Enerflex’s Chairman of the Board. The Director search
has been ongoing since March 2017 and Enerflex anticipates making an
announcement regarding the results of the interview process and director search
in the coming weeks.

Quarterly Results Material
This press release should be read in conjunction with Enerflex’s Interim
Condensed Financial Statements as at and for the three months ended March 31,
2017, and the accompanying Management’s Discussion and Analysis, both of which
will be available on the Enerflex website at www.enerflex.com under the
Investors section and on SEDAR at www.sedar.com.

Conference Call and Webcast Details
Enerflex will host a conference call for analysts, investors, members of the
media, and other interested parties on Friday, May 5, 2017 at 8:00 a.m. MST
(10:00 a.m. EST) to discuss the first quarter 2017 financial results and
operating highlights. The call will be hosted by Mr. J. Blair Goertzen,
President and Chief Executive Officer and Mr. D. James Harbilas, Executive Vice
President and Chief Financial Officer of Enerflex.

If you wish to participate in this conference call, please call 1.844.231.9067
or 1.703.639.1277. Please dial in 10 minutes prior to the start of the call. No
passcode is required. The live audio webcast of the conference call will be
available on the Enerflex website at www.enerflex.com under the Investors
section on May 5, 2017 at 8:00 a.m. MST (10:00 a.m. EST). Approximately one
hour after the call, a recording of the event will be available on the
Company’s website. A replay of the teleconference will be available one hour
after the conclusion of the call until 11:00 p.m. MST on May 12, 2017. Please
call 1.855.859.2056 or 1.404.537.3406 and enter conference ID 8198110.

About Enerflex
Enerflex Ltd. is a single source supplier of natural gas compression, oil and
gas processing, refrigeration systems, and electric power generation equipment
– plus related engineering and mechanical service expertise. The Company’s
broad in-house resources provide the capability to engineer, design,
manufacture, construct, commission, and service hydrocarbon handling systems.
Enerflex’s expertise encompasses field production facilities, compression and
natural gas processing plants, refrigeration systems, and electric power
equipment servicing the natural gas production industry.

Headquartered in Calgary, Canada, Enerflex has approximately 1,800 employees
worldwide. Enerflex, its subsidiaries, interests in associates and
joint-ventures operate in Canada, the United States, Argentina, Bolivia,
Brazil, Colombia, Mexico, Peru, Australia, the United Kingdom, the United Arab
Emirates, Oman, Bahrain, Indonesia, Malaysia, and Thailand. Enerflex’s shares
trade on the Toronto Stock Exchange under the symbol “EFX”. For more
information about Enerflex, go to www.enerflex.com.

Advisory Regarding Forward-Looking Statements
To provide Enerflex shareholders and potential investors with information
regarding Enerflex, including management’s assessment of future plans, Enerflex
has included in this news release certain statements and information that are
forward-looking statements or information within the meaning of applicable
securities legislation, and which are collectively referred to in this advisory
as “forward-looking statements”. Information included in this news release that
is not a statement of historical fact may be forward-looking information. When
used in this document, words such as “plans”, “expects”, “will”, “may” and
similar expressions are intended to identify statements containing
forward-looking information. Forward-looking statements and information
contained in this press release include, but are not limited to: (i) the
anticipated duration of weak natural gas prices and the effect thereof in
Canada and USA markets; (ii) expected bookings; and (iii) the nature and scope
of challenges and opportunities in the Rest of World segment. In developing the
forward-looking information in this news release, the Company has made certain
assumptions with respect to general economic and industry growth rates,
commodity prices, currency exchange and interest rates, competitive intensity
and regulatory approvals. Readers are cautioned not to place undue reliance on
forward-looking statements, as there can be no assurance that the future
circumstances, outcomes or results anticipated in or implied by such
forward-looking statements will occur or that plans, intentions or expectations
upon which the forward-looking statements are based will occur.

Forward-looking information involves known and unknown risks and uncertainties
and other factors, which may cause or contribute to Enerflex achieving actual
results that are materially different from any future results, performance or
achievements expressed or implied by such forward-looking information. Such
risks and uncertainties include, among other things, the impact of general
economic conditions; industry conditions, including the adoption of new
environmental, taxation and other laws and regulations and changes in how they
are interpreted and enforced; volatility of oil and gas prices; oil and gas
product supply and demand; risks inherent in the ability to generate sufficient
cash flow from operations to meet current and future obligations, including
future dividends to shareholders of the Company; increased competition; the
lack of availability of qualified personnel or management; labour unrest;
political unrest; fluctuations in foreign exchange or interest rates; stock
market volatility; opportunities available to, or pursued by, the Company;
obtaining financing; and other factors, many of which are beyond its control.
The foregoing list of factors and risks is not exhaustive. For an augmented
discussion of the risk factors and uncertainties that affect or may affect
Enerflex, the reader is directed to the section entitled “Risk Factors” in
Enerflex’s most recently filed Annual Information Form, as well as Enerflex’s
other publicly filed disclosure documents, available on www.sedar.com. The
reader is cautioned that these factors and risks are difficult to predict and
that the assumptions used in the preparation of such information, although
considered reasonably accurate at the time of preparation, may prove to be
incorrect. Readers are cautioned that the actual results achieved will vary
from the information provided in this press release and that such variation may
be material. Consequently, Enerflex does not represent that actual results
achieved will be the same in whole, or in part, as those set out in the
forward-looking information. Furthermore, the statements containing
forward-looking information that are included in this news release are made as
of the date of this news release, and Enerflex does not undertake any
obligation, except as required by applicable securities legislation, to update
publicly or to revise any of the included forward-looking information, whether
as a result of new information, future events or otherwise. The forward-looking
information contained in this news release is expressly qualified by this
cautionary statement.

– END RELEASE – 04/05/2017

For further information:
For investor and media inquiries, please contact:
J. Blair Goertzen
President & Chief Executive Officer
403.236.6852
OR
D. James Harbilas
Executive Vice President & Chief Financial Officer
403.236.6857

COMPANY:
FOR: ENERFLEX LTD.
TSX SYMBOL: EFX

INDUSTRY: Energy and Utilities – Equipment, Energy and Utilities –
Oil and Gas
RELEASE ID: 20170504CC0118

Press Release from Marketwired 1-866-736-3779

All press releases are written by the client and have NO affiliation with the news copy written by The Canadian Press. Any questions that arise due to the content or information provided in the press release should be directed to the company/organization
issuing the release, not to The Canadian Press.

GET ENERGYNOW’S DAILY EMAIL FOR FREE


Enbridge Inc. Announces Additional Quarterly Dividend Increase

FOR: ENBRIDGE INC.TSX SYMBOL: ENBNYSE SYMBOL: ENBDate issue: May 04, 2017Time in: 5:15 PM eAttention:
CALGARY, ALBERTA–(Marketwired – May 4, 2017) – Enbridge Inc.
(TSX:ENB)(NYSE:ENB) (Enbridge or the Company) announced today that its Board of
Directo…

GET ENERGYNOW’S DAILY EMAIL FOR FREE


EPCOR Announces Quarterly Results – Part 2

Energy Services’ operating income, excluding change in the fair value of
contracts-for-differences, decreased by $3 million for the three months ended
March 31, 2017, compared with the corresponding period in 2016, primarily due
to lower Energy Price …

GET ENERGYNOW’S DAILY EMAIL FOR FREE


Mullen Group Ltd. Announces Election of Directors

FOR: MULLEN GROUP LTD.TSX SYMBOL: MTLDate issue: May 04, 2017Time in: 4:48 PM eAttention:
OKOTOKS, ALBERTA–(Marketwired – May 4, 2017) – Mullen Group Ltd. (TSX:MTL)
(“Mullen Group”, “We”, “Our” and/or the “Corporation”) announced today that the
nomin…

GET ENERGYNOW’S DAILY EMAIL FOR FREE


Bonavista Energy Corporation Announces 2017 First Quarter Results

FOR: BONAVISTA ENERGY CORPORATION
TSX SYMBOL: BNP

Date issue: May 04, 2017
Time in: 4:32 PM e

Attention:

CALGARY, ALBERTA–(Marketwired – May 4, 2017) – Bonavista Energy Corporation
(“Bonavista”) (TSX:BNP) is pleased to report to shareholders its financial and
operating results for the three months ended March 31, 2017. Results for the
first quarter of 2017 are highlighted by a 19% increase in funds from
operations and a 5% decrease in cash costs when compared to the first quarter
of 2016. Cash costs of $8.98 per boe are the lowest achieved in the past decade
showcasing our continued emphasis on cost reductions and efficiency
improvements. The unaudited financial statements and notes, as well as
management’s discussion and analysis, are available on the System for
Electronic Document Analysis and Retrieval (“SEDAR”) at www.sedar.com and on
Bonavista’s website at www.bonavistaenergy.com.

/T/

—————————————————————————-
—————————————————————————-
Highlights
—————————————————————————-
—————————————————————————-

Three months ended March 31,
2017 2016 % Change
—————————————————————————-
—————————————————————————-
Financial
($ thousands, except per share)
Production revenues 143,182 104,478 37%
Funds from operations(1) 70,851 59,330 19%
Per share(1) (2) 0.28 0.27 4%
Dividends declared 2,503 6,421 (61)%
Per share 0.01 0.03 (67)%
Net income 88,428 46,421 90%
Per share(3) 0.35 0.21 67%
Adjusted net income(4) 11,431 23,429 (51)%
Per share(3) 0.04 0.11 (64)%
Total assets 3,242,319 3,513,479 (8)%
Long-term debt, net of working capital 906,746 1,173,430 (23)%
Long-term debt, net of adjusted working
capital(5) 891,737 1,248,800 (29)%
Shareholders’ equity 1,652,722 1,591,043 4%
Capital expenditures:
Exploration and development 92,274 40,622 127%
Dispositions, net of acquisitions (7,540) 5,038 250%
Weighted average outstanding equivalent
shares: (thousands)(3)
Basic 254,586 218,660 16%
Diluted 262,519 223,723 17%
—————————————————————————-
—————————————————————————-
Operating
(boe conversion – 6:1 basis)
Production:
Natural gas (mmcf/day) 293 301 (3)%
Natural gas liquids (bbls/day) 18,888 18,438 2%
Oil (bbls/day)(6) 2,560 4,567 (44)%
Total oil equivalent (boe/day) 70,281 73,180 (4)%
Product prices:(7)
Natural gas ($/mcf) 3.12 2.98 5%
Natural gas liquids ($/bbl) 26.52 16.07 65%
Oil ($/bbl)(6) 58.50 53.69 9%
Total oil equivalent ($/boe) 22.27 19.67 13%
Operating expenses ($/boe) 5.47 5.75 (5)%
General and administrative expenses
($/boe) 0.99 1.03 (4)%
Cash costs ($/boe)(8) 8.98 9.45 (5)%
Operating netback ($/boe)(9) 13.75 11.74 17%
—————————————————————————-
—————————————————————————-
NOTES:
(1) Management uses funds from operations to analyze operating performance,
dividend coverage and leverage. Funds from operations as presented do
not have any standardized meaning prescribed by IFRS and therefore it
may not be comparable with the calculations of similar measures for
other entities. Funds from operations as presented is not intended to
represent operating cash flow or operating profits for the period nor
should it be viewed as an alternative to cash flow from operating
activities, net income or other measures of financial performance
calculated in accordance with IFRS. All references to funds from
operations throughout this report are based on cash flow from operating
activities before changes in non-cash working capital, decommissioning
expenditures and interest expense. Funds from operations per share is
calculated based on the weighted average number of shares outstanding
consistent with the calculation of net income per share.
(2) Basic funds from operations per share calculations include exchangeable
shares which are convertible into common shares on certain terms and
conditions.
(3) Per share calculations include exchangeable shares which are
convertible into common shares on certain terms and conditions.
(4) Amounts have been adjusted to exclude unrealized gains and losses on
financial instrument commodity contracts, net of tax.
(5) Amounts have been adjusted to exclude associated current assets or
liabilities from financial instrument commodity contracts and
decommissioning liabilities. Also referenced as total net debt.
(6) Oil includes light, medium and heavy oil.
(7) Product prices include realized gains and losses on financial
instrument commodity contracts.
(8) Cash costs equal the total of operating, transportation, general and
administrative, and financing expenses.
(9) Operating netback as presented does not have any standardized meaning
prescribed by IFRS and therefore it may not be comparable with the
calculations of similar measures for other entities. Operating netback
is calculated using production revenues including realized gains and
losses on financial instrument commodity contracts less royalties,
operating and transportation expenses calculated on a per boe basis.

—————————————————————————-

Three months ended
March 31, December 31, September 30, June 30,
Share Trading Statistics 2017 2016 2016 2016
—————————————————————————-
($ per share, except
volume)
High 5.22 5.58 4.60 3.77
Low 3.05 3.95 3.15 2.23
Close 3.46 4.81 4.22 3.30
Average Daily Volume –
Shares 819,104 877,141 1,135,181 1,492,555
—————————————————————————-
—————————————————————————-

/T/

MESSAGE TO SHAREHOLDERS

Continued capital and operating cost improvements, combined with enhanced well
performance year-to-date has set the stage for profitable per share growth in
2017. With a drilling inventory that is growing in quality, infrastructure and
egress solutions in place, and a dependable hedge portfolio, we remain firmly
on track to create significant value for our shareholders in 2017 and beyond.

Specific to the quarter, we spent $84.7 million, net of acquisitions and
divestitures (“A&D”), drilling 21 wells and growing production from 69,000 boe
per day in December 2016 to 74,000 boe per day currently, with approximately
4,000 boe per day waiting to come on-stream. This strong production performance
has been driven by our development results in our Spirit River plays which have
exceeded our expectations. Our first quarter results in both of our core areas
in the Spirit River represent a significant improvement in production and
economic performance.

Improved product pricing, specifically natural gas liquids (“NGL”), has been
the primary driver to a 26% increase in funds from operations per boe in the
first quarter relative to the same period a year ago. A two percent increase in
NGL production combined with a 65% increase in realized pricing has led to a
67% increase in revenue (including hedging). As Bonavista has one of the
highest NGL compositions relative to total production in our industry, our
funds from operations will continue to benefit from the improvement in overall
NGL pricing.

Our pragmatic and disciplined approach to managing our cash costs remains key
to our success. Operating costs decreased five percent to $5.47 per boe
deriving total cash costs of $8.98 per boe, a five percent improvement over the
prior year period and the lowest in over a decade. Commodity price support,
coupled with an improvement in costs has resulted in an operating netback of
$13.75 per boe, a 17% improvement from the prior year period.

Operational and financial accomplishments for the first quarter of 2017 include:

/T/

— Production averaged 70,281 boe per day, precisely aligned with our

budget and representing a 68% increase over the first quarter of last
year on a debt and dividend adjusted per share basis. Current production
is 74,000 boe per day;

— Drilled 21 wells spending $84.7 million including A&D which represents a

13% reduction relative to the budget;

— Generated funds from operations of $70.9 million ($0.28 per share),

equivalent to $11.20 per boe representing a 19% increase in funds from
operations and a 26% increase on a per boe basis when compared to the
prior year period;

— Reduced first quarter operating costs to $5.47 per boe and cash costs to

$8.98 per boe, representing reductions of five percent each over the
same period in 2016;

— Protected funds from operations through a commodity hedge portfolio

resulting in:
— 74% of our forecasted 2017 natural gas production hedged at an AECO
price of $3.30 per mcf and 144 mmcf per day hedged at an AECO price
of $3.13 per mcf for 2018;

— 74% of our forecasted 2017 oil and condensate volumes hedged at
CDN$67.69 per bbl WTI and 4,500 bbl per day hedged at CDN$68.85 per
bbl for 2018; and

— 56% of our forecasted 2017 propane volumes hedged at CDN$29.06 per
bbl and 3,000 bbl per day hedged at CDN$30.59 per barrel for 2018.

/T/

2017 YEAR-TO-DATE CORE AREA HIGHLIGHTS

DEEP BASIN CORE AREA

With 70% of our first quarter exploration and development (“E&D”) capital
program allocated to the Deep Basin, this core area is on course to grow
meaningfully as we pursue numerous drilling opportunities in this prolific
area. Our Deep Basin is characterized by stacked, resource-rich natural gas
reservoirs with low cost and high margin operations. Furthermore, egress has
been secured on the Nova Gas Transmission Ltd. (“NGTL”) system for 113% of our
budgeted natural gas production for the remainder of 2017 and between 10% to
20% excess transportation secured for 2018.

We support our production base and development plans with access to 266 mmcf
per day of operated processing capacity. This control of infrastructure has
enabled us to operate at a low cost of $4.21 per boe and an operating margin of
69% in the first quarter leading to competitive development economics in this
price environment. First quarter 2017 operating netbacks of $15.39 per boe were
51% greater than the prior year period.

During the first quarter, we spent $64.4 million on E&D activities drilling 12
(10.5 net) horizontal wells supporting average production of 25,518 boe per
day, a 29% increase over the same period in 2016. For the remainder of the
year, we forecast E&D spending of $90.3 million to drill 19 (16.3 net) wells in
the Deep Basin.

Spirit River (Wilrich, Falher, Notikewin) Natural Gas

We drilled 10 (9.8 net) horizontal wells during the first quarter, seven (7.0
net) at Ansell and three (2.8 net) at Marlboro. Well test rates with our
extended reach horizontal (“ERH”) wells completed in the first quarter at
Ansell have been on average 80% higher than our 2016 ERH test results.
Notwithstanding restricted production rates, the average initial 30-day raw
natural gas rate of 7.8 mmcf per day is 45% greater than the average initial
30-day rate for our 2016 wells. We are excited about this step change in
performance and attribute it to a greater understanding of the quality of the
reservoir, in addition to innovative drilling and completion techniques
including orientation, lateral length, fluid design and stage density.

Drill and complete costs have increased nine percent to $4.4 million in the
quarter largely due to inflationary service cost pressures. However, when
combined with the forecasted 12-month production performance increase, capital
efficiencies improve approximately 20% to $8,400 per boe per day.

Sales production at our Ansell facility has doubled since the start of our
winter drilling program in November 2016. Specifically, we are currently
selling approximately 85 mmcf per day as a result of the facility expansion
completed in March of this year.

For the remainder of the year, we forecast E&D spending of $40.4 million to
drill 10 (10.0 net) Ansell Wilrich wells and two (1.5 net) Notikewin wells, all
of which will be ERH wells.

WEST CENTRAL CORE AREA

Our West Central core area has a predictable production base that is forecast
to generate significant excess funds from operations for many years to come.
With approximately 740,000 net acres and a drilling inventory of over 770 key
play horizontal locations, this area draws its strength from a relatively low
decline rate of 22%, low cost structure, extensive infrastructure and
consistent well results. Development economics have strengthened in the first
quarter with a 48% improvement in realized NGL prices over the same period last
year. This has led to a 77% improvement in the first quarter operating netback
of $14.09 per boe.

During the first quarter, we spent $26.1 million on E&D activities, which
included drilling nine (8.5 net) horizontal wells, supporting production rates
averaging 40,852 boe per day or 58% of corporate production. For the remainder
of the year, we plan to drill 24 (23.0 net) wells, with E&D spending of $110.8
million inclusive of incremental infrastructure spending. Our development is
focused in Morningside, Willesden Green and Strachan, where we are enhancing
economic performance with longer horizontal wells. This capital program will
slightly increase production to between 43,000 and 44,000 boe per day while
consuming only 59% of net operating income generated by this core area.

Glauconite Natural Gas

We drilled three (3.0 net) Glauconite horizontal wells, including one (1.0 net)
ERH well at Strachan in the first quarter of 2017. We have increased the
quality of our Glauconite inventory through on-going A&D initiatives, as
evidenced by strong performance of a first quarter well drilled on the swap
assets acquired during the fourth quarter of 2016 which outperformed our type
curve by approximately 70%.

Low capital costs and an efficient operating cost structure remain key
characteristics of our Glauconite play. The average cost per lateral length has
also improved while drilling longer length horizontal wells. The average
lateral length in the first quarter was 2,155 meters at a cost of $831 per
meter, eight percent less than our 2016 costs per lateral meter.

We have over 380 locations identified to drill in this predictable and reliable
resource. This robust inventory will continue to serve as a dependable source
to our net operating income for many years into the future. For the remainder
of 2017, we plan to drill 10 (9.6 net) horizontal wells at Hoadley and three
(3.0) horizontal wells at Strachan.

Spirit River Falher Natural Gas

We drilled five (5.0 net) Falher wells in the first quarter including our first
ERH well in this play. We have accessed twice as much reservoir with this ERH
well in less than 48 hours of incremental drilling time resulting in a material
improvement in capital efficiency. We have been able to duplicate the reduced
drill time and costs for our second ERH well drilled subsequent to the first
quarter. Our Falher inventory in this area currently contains 35% ERH wells.

Our first ERH well tested at over 2,500 boe per day and has been on production
for 20 days at a restricted rate of 1,200 boe per day, 35% above our initial
projections. With a modest capital cost of $2.6 million to drill and complete
this well, payout will occur in approximately 10 months at current strip
pricing. The other three wells drilled in the first quarter were completed in
the second quarter and came on production in late April.

First quarter production averaged 3,500 boe per day while current production is
approximately 5,000 boe per day. We expect to grow average daily production in
excess of 7,000 boe per day during the fourth quarter, representing growth of
119% from the fourth quarter of 2016. To accommodate this production growth, we
expect to invest $9 million to expand both compression and pipeline
infrastructure.

Strong production rates along with high NGL content have significantly improved
Morningside ERH economics with payouts of less than a year at current strip
pricing. The Morningside Falher play is a top tier development play in western
Canada and is a key growth component of our portfolio.

STRENGTHS OF BONAVISTA ENERGY CORPORATION

Throughout our twenty year history, from an initial restructuring in 1997 to
create a high growth junior exploration company, through the energy trust phase
between July 2003 and December 2010, to a dividend paying corporation,
Bonavista has remained committed to the same operating philosophies despite the
endless commodity price volatility and uncertainty inherent in the energy
sector. We have consistently maintained a high level of profitable investment
activity on our asset base. This activity stems from the expertise of our
people and their entrepreneurial approach to design profitable development
projects with resilience to an unpredictable commodity price environment. Our
experienced technical teams have a thorough understanding of our assets and the
reservoirs within the Western Canadian Sedimentary Basin as they exercise the
discipline and commitment required to deliver long-term value to our
shareholders. The core operating and financial principles that guide our people
have been with our organization from the beginning and remain solidly intact
today.

Our production and development activity is largely concentrated in two core
areas in Alberta which together represent approximately 99% of forecasted 2017
net operating income. We create opportunities through undeveloped land
purchases, asset swaps, asset acquisitions and farm-in opportunities in these
areas. Specifically over the past five years, advanced technology coupled with
North American natural gas supply/demand fundamentals has led to numerous
opportunities to reposition the asset portfolio and drastically improve the
quality and economics of our development projects. These activities have led to
low cost reserve additions and a reliable production base. Today, the
predictable production performance and optimized cost structure of our asset
base ensures operating netbacks that compete favorably in most operating
environments. Furthermore, our assets are predominantly operated by us,
providing control over the pace of operations and a direct influence over our
operating and capital cost efficiencies.

Our team brings a successful track record of executing reliable development
programs with consistency and precision. We continually strive for balance
sheet flexibility and remain focused on prudent financial management. Our Board
of Directors and management team possess extensive experience in the oil and
natural gas business. They have successfully guided our organization through
many different economic cycles utilizing a proven strategy underpinned with a
set of consistent and reliable operating and financial principles. Directors,
management and employees also own approximately nine percent of the equity of
Bonavista, aligning our interests with those of external shareholders.

OUTLOOK

Our industry is currently picking up the pieces from one of the most drastic
downturns on record. As demand and supply fundamentals hunt for equilibrium,
energy prices will remain volatile.

Tepid North American natural gas consumption this past winter has left natural
gas storage levels 15% above the five-year average but 14% lower than 2016.
Cooling demand this summer remains a key catalyst and will dictate short-term
price fluctuations. Longer term, the demand sentiment in North America has
become more constructive, supported by increased exports to Mexico and
liquefied natural gas exports to Asia and Europe. Furthermore, local demand
will continue to strengthen with the increasing use of natural gas in the
development of oilsands and the significant quantities of natural gas required
in the conversion of coal to natural gas power generation.

Global oil markets have stabilized, with prices recovering from the historic
lows of a year ago. OPEC production curtailments and elevated U.S. drilling
activity will be the most significant influences to near-term crude oil prices.
Like natural gas, NGL pricing in North America has been influenced by a
significant increase in export demand, specifically propane, a product which is
abundant in our production and reserve portfolio.

Over the past two years, we have developed a high degree of resilience to the
inherent pricing volatility in our industry given our disciplined approach to
our commodity hedge portfolio and with our success at improving capital and
operating efficiencies. Accordingly, Bonavista is well positioned for value
creation through this recovery period. Our 2017 growth plans remain intact
drilling between 55 and 65 net wells spending between $280 and $300 million.
This investment represents approximately 90% of forecast funds from operations
and will generate annual production between 73,500 and 75,500 boe per day. This
will translate into annual production growth of seven to 10% and funds from
operations growth in excess of 20% at current strip prices. In the unlikely
event that AECO natural gas strip prices were to erode by as much as 30% for
the balance of the year, our solid hedge portfolio would support funds from
operations growth of 15%.

As always, we thank the hard work and dedication of our employees and our
shareholders for their continued support. We are pleased with our start to 2017
and look forward to delivering profitable growth in 2017 while further
strengthening our financial position.

FORWARD LOOKING INFORMATION

This document should be read in conjunction with the Management’s discussion
and analysis (“MD&A”) and the unaudited condensed consolidated interim
financial statements (the “financial statements”) for the three months ended
March 31, 2017, together with notes related thereto, as well as in conjunction
with the audited consolidated financial statements for the year ended December
31, 2016, together with the notes thereto, for a full understanding of the
financial position and results of operations of Bonavista Energy Corporation
(“Bonavista” or the “Corporation”). Additional information relating to
Bonavista, including the audited consolidated financial statements for the year
ended December 31, 2016, are available through SEDAR at www.sedar.com or can be
obtained from Bonavista’s website at www.bonavistaenergy.com.

Non-GAAP Measures – Throughout this document, the Corporation uses terms that
are commonly used in the oil and natural gas industry, but do not have any
standardized meaning as prescribed by IFRS and therefore may not be comparable
with the calculations of similar measures for other entities. Management
believes that the presentation of these Non-GAAP measures provide useful
information to investors and shareholders as the measures provide increased
transparency and the ability to better analyze performance against prior
periods on a comparable basis.

Management uses the following terms to analyze operating performance on a
comparable basis with prior periods. “Operating netbacks” is equal to
production revenues and realized gains and losses on financial instrument
commodity contracts, less royalties, operating and transportation expenses
calculated on a per boe basis. “Operating margin” is equal to production
revenues and realized gains and losses on financial instrument commodity
contracts less royalties, operating costs and transportation costs; divided by
production revenues and realized gains and losses on financial instrument
commodity contracts. Realized gains and losses on financial instrument
commodity contracts represent the portion of Bonavista’s financial instrument
commodity contracts that have settled in cash during the period and disclosing
this impact provides transparency on how Bonavista’s risk management program
impacts the netback and operating margin metrics. “Cash costs” is equal to the
total of operating, transportation, general and administrative, and financing
expenses calculated on a per boe basis. “Total boe equivalent” is calculated by
multiplying the daily production by the number of days in the period. “Basic
funds from operations per share” is equal to funds from operations (as
described below ), based on the weighted average number of common shares
outstanding and includes the weighted average number of exchangeable shares
which are convertible into common shares on certain terms and conditions.

Management uses the following terms to analyze operating performance on a
comparable basis with prior periods and to analyze the liquidity of the
Corporation. “Funds from operations” is not intended to represent operating
cash flow or operating profits for the period nor should it be viewed as an
alternative to cash flow from operating activities, net income or other
measures of financial performance calculated in accordance with IFRS. All
references to funds from operations are based on cash flow from operating
activities before changes in non-cash working capital, decommissioning
expenditures and interest expense. “Total net debt” is equal to the long-term
portion of Bonavista’s bank debt and senior unsecured notes, net of adjusted
working capital. “Adjusted working capital” excludes the current assets and
liabilities from financial instrument commodity contracts and decommissioning
liabilities. “Debt and dividend adjusted per share basis” is equal to total net
debt less interest expense and dividends payable divided by the period end
average share price. These converted shares are then added to the weighted
average outstanding equivalent shares outstanding.

Oil and Gas Advisories – To provide a single unit of production for analytical
purposes, natural gas production and reserves volumes are converted
mathematically to equivalent barrels of oil (boe). We use the industry-accepted
standard conversion of six thousand cubic feet of natural gas to one barrel of
oil (6 Mcf = 1 bbl). The 6:1 boe ratio is based on an energy equivalency
conversion method primarily applicable at the burner tip. It does not represent
a value equivalency at the wellhead and is not based on either energy content
or current prices. While the boe ratio is useful for comparative measures and
observing trends, it does not accurately reflect individual product values and
might be misleading, particularly if used in isolation. As well, given that the
value ratio, based on the current price of crude oil to natural gas, is
significantly different from the 6:1 energy equivalency ratio, using a 6:1
conversion ratio may be misleading as an indication of value.

Forward-Looking Statements – This document contains certain forward-looking
information and statements within the meaning of applicable securities laws.
The use of any of the words “anticipate”, “except”, “project”, “plan”,
“estimate”, “budget”, “will”, “strategy”, “ongoing”, “potential”, “believe”,
“continue” and similar expressions are intended to identify forward-looking
information. Any “financial outlook” or “future orientated financial
information” in the interim report, as defined by applicable securities laws,
has been approved by the management of Bonavista. Such financial outlook or
future orientated financial information is provided for the purpose of
providing information about management’s current expectations and plans
relating to the future. Readers are cautioned that reliance on such information
may not be appropriate for other purposes.

In particular, but without limiting the foregoing, this document contains
forward-looking information pertaining to the following:

/T/

— Forecasted capital expenditures for 2017 including drilling, exploration

and development plans, acquisition and disposition activities and
expected future drilling locations;
— Expected development economics for certain properties in 2017;
— Expected 2017 total and current average production volumes and
anticipated product mix;
— Expected 2017 oil, natural gas and natural gas liquids production
volumes;
— Expected realized oil, natural gas and natural gas liquids prices and
the differentials resulting from our financial risk management program
in 2017;
— The benefits of Bonavista’s hedging portfolio;
— Expected 2017 funds from operations;
— Anticipated rate of return and future payout; and
— The objective to manage net debt to funds from operations to be well
positioned to create shareholder value and organic growth.

/T/

References to 2017 drilling locations and future drilling locations do not
provide certainty that Bonavista will drill all unbooked drilling locations and
if drilled there is no certainty that such locations will result in additional
oil and gas reserves or production. The drilling locations on which Bonavista
drills wells will ultimately depend upon the availability of capital,
regulatory approvals, seasonal restrictions, oil and natural gas prices, costs,
actual drilling results, additional reservoir information that is obtained and
other factors. While a certain number of the unbooked drilling locations have
been derisked by drilling existing wells in relative close proximity to such
unbooked drilling locations, some of our other unbooked drilling locations are
farther away from existing wells where management has less information about
the characteristics of the reservoir and therefore there is more uncertainty
whether wells will be drilled in such locations and if drilled there is more
uncertainty that such wells will result in additional oil and natural gas
reserves or production. In addition, references made to initial production
rates, and other short-term production rates are useful in confirming the
presence of hydrocarbons, however such rates are not determinative of the rates
at which such wells will commence production and decline thereafter and are not
indicative of long term performance or of ultimate recovery. Additionally, such
rates may also include recovered “load oil” fluids used in well completion
stimulation. While encouraging, readers are cautioned not to place reliance on
such rates in calculating the aggregate production for Bonavista. A pressure
transient analysis or well-test interpretation has not been carried out in
respect of all wells. Accordingly, Bonavista cautions that the test results
should be considered to be preliminary.

By their nature, forward-looking statements are subject to numerous risks and
uncertainties; some of which are beyond Bonavista’s control, including the
impact of general economic assumptions and conditions, industry assumptions and
conditions, volatility of commodity prices, currency fluctuations, imprecision
of reserve estimates, environmental risks, changes in environmental tax and
royalty legislation, competition from other industry participants, the lack of
availability of qualified personnel or management, stock market volatility and
ability to access sufficient capital from internal and external sources.
Readers are cautioned that the assumptions used in the preparation of such
information, although considered reasonable at the time of preparation, may
prove to be imprecise and, as such, undue reliance should not be placed on
forward-looking statements. Bonavista’s actual results, performance or
achievement could differ materially from those expressed in, or implied by,
these forward-looking statements or if any of them do so, what benefits that
Bonavista will derive there from. Bonavista disclaims any intention or
obligation to update or revise any forward-looking statements, whether as a
result of new information, future events or otherwise, except as required by
law.

Bonavista is focused on creating premium shareholder value through the
efficient development of high quality oil and natural gas assets.

– END RELEASE – 04/05/2017

For further information:
Keith A. MacPhail
Executive Chairman
OR
Jason E. Skehar
President & CEO
OR
Dean M. Kobelka
Vice President, Finance & CFO
OR
Bonavista Energy Corporation
1500, 525 – 8th Avenue SW
Calgary, AB T2P 1G1
(403) 213-4300
www.bonavistaenergy.com

COMPANY:
FOR: BONAVISTA ENERGY CORPORATION
TSX SYMBOL: BNP

INDUSTRY: Energy and Utilities – Oil and Gas
RELEASE ID: 20170504CC0104

Press Release from Marketwired 1-866-736-3779

All press releases are written by the client and have NO affiliation with the news copy written by The Canadian Press. Any questions that arise due to the content or information provided in the press release should be directed to the company/organization
issuing the release, not to The Canadian Press.

GET ENERGYNOW’S DAILY EMAIL FOR FREE


MCW Energy Group Announces Consolidation, Name Change and Trading Symbol Change

FOR: MCW ENERGY GROUP LIMITEDTSX VENTURE SYMBOL: MCWOTCQX SYMBOL: MCWEFDate issue: May 04, 2017Time in: 4:30 PM eAttention:
TORONTO, ONTARIO–(Marketwired – May 4, 2017) – MCW Energy Group Limited (“MCW”
or the “Corporation”) (TSX VENTURE:MCW) (OTCQX:…

GET ENERGYNOW’S DAILY EMAIL FOR FREE


Gran Tierra Energy Announces Final Voting Results of its Annual Meeting of Stockholders

FOR: GRAN TIERRA ENERGY INC.NYSE MKT SYMBOL: GTETSX SYMBOL: GTEDate issue: May 04, 2017Time in: 4:30 PM eAttention:
CALGARY, ALBERTA–(Marketwired – May 4, 2017) – Gran Tierra Energy Inc. (“Gran
Tierra” or the “Company”) (NYSE MKT:GTE)(TSX:GTE) today …

GET ENERGYNOW’S DAILY EMAIL FOR FREE


ConocoPhillips cutting 300 jobs in Calgary following Cenovus deal

CALGARY — ConocoPhillips says it’s cutting about 300 jobs following a deal to sell most of its Canadian oil and gas holdings to Cenovus Energy (TSX:CVE).

Spokesman Rob Evans said the layoffs are needed to adjust to the smaller size of the company following the $17.7 billion deal announced in late March.

He said the cuts will be mainly in Calgary, and employees will know by mid May if they’ve lost their job.

The layoffs come as Calgary’s overall unemployment rate has been slowly dropping, as the energy industry adjusts to stabilized oil prices of around US$50 a barrel.

The city’s unemployment rate was at 9.3 per cent in March, down from a peak of 10.2 per cent last November, but still the highest of any major city in Canada.  

The Canadian Press

GET ENERGYNOW’S DAILY EMAIL FOR FREE


BC Utilities Commission to Host Unique Annual Conference in Vancouver Next Week

FOR: BRITISH COLUMBIA UTILITIES COMMISSION
Date issue: May 04, 2017Time in: 2:16 PM eAttention:
VANCOUVER, BC –(Marketwired – May 04, 2017) – The BC Utilities Commission
will be hosting hundreds of regulators and stakeholders, including consumers
an…

GET ENERGYNOW’S DAILY EMAIL FOR FREE


Trinidad Drilling Announces "FOR" Recommendation from Institutional Shareholder Services (ISS) Respecting Stock Option Plan

FOR: TRINIDAD DRILLING LTD.
TSX SYMBOL: TDG

Date issue: May 04, 2017
Time in: 1:38 PM e

Attention:

CALGARY, ALBERTA–(Marketwired – May 4, 2017) –

NOT FOR DISTRIBUTION TO UNITED STATES NEWSWIRE SERVICES OR FOR DISSEMINATION IN
THE UNITED STATES

Trinidad Drilling Ltd. (TSX:TDG) (Trinidad) announces that, further to its
press release of May 1, 2017, Institutional Shareholder Services (“ISS”) has
issued a proxy alert (update) on the ISS proxy analysis for Trinidad’s upcoming
annual meeting of its shareholders to be held on May 10, 2017 (the “Meeting”).
All ISS vote recommendations are now “FOR” the resolutions to be presented at
the Meeting, including with respect to the approval of the unallocated options
(the “Option Plan Re-Approval”) under Trinidad’s Stock Option Plan (the “Option
Plan”).

On May 1, 2017, Trinidad’s Board of Directors approved minor amendments to the
Option Plan to align the Option Plan with recommendations raised by ISS in the
course of its review of the matters to be voted on at the Meeting. As the
Option Plan already complied with the rules and policies of the Toronto Stock
Exchange (“TSX”), the Board approved those changes with the goal of bringing
the Option Plan in line with current corporate governance best practices.

The amendments to the Option Plan will reduce the number of common shares of
Trinidad subject to the Option Plan to a rolling 4% of the issued and
outstanding shares, provide for double trigger acceleration of vesting of
options upon a change of control, and provide that all grants of options made
pursuant to the Option Plan shall be subject to a new incentive compensation
clawback policy adopted by Trinidad. TSX will have to approve the amended and
restated Option Plan and Trinidad has made application for the same.

The Option Plan Re-Approval will be proposed to the shareholders for
ratification at the Meeting. A copy of the amended and restated Option Plan can
be found on Trinidad’s SEDAR profile at www.sedar.com.

FORWARD-LOOKING INFORMATION

This news release contains forward-looking statements and forward-looking
information (collectively, “forward-looking information”) within the meaning of
applicable Canadian securities laws. The use of any of the words “expect”,
“anticipate”, “will”, “future” and similar expressions are intended to identify
forward-looking information. In particular, this news release contains
forward-looking information pertaining to ratification of the Option Plan
Re-Approval at the Meeting and TSX’s approval of the amended and restated
Option Plan.

The forward-looking information included in this news release is not a
guarantee of future performance and should not be unduly relied upon.
Forward-looking information is based on current expectations, estimates and
projections that involve a number of risks and uncertainties, which could cause
actual results to differ materially from those anticipated and described in the
forward-looking information including, without limitation, that the Option Plan
Re-Approval will be ratified at the Meeting and that TSX will approve the
amended and restated Option Plan. The forward-looking information contained in
this news release speaks only as of the date of this news release and Trinidad
assumes no obligation to publicly update or revise such forward-looking
information to reflect new events or circumstances, except as may be required
pursuant to applicable securities laws.

This news release shall not constitute an offer to sell or the solicitation of
an offer to buy the shares in any jurisdiction. The shares offered will not be
and have not been registered under the United States Securities Act of 1933 and
may not be offered or sold in the United States or to a United States person,
absent registration, or an applicable exemption therefrom.

Trinidad is a corporation focused on sustainable growth that trades on the
Toronto Stock Exchange under the symbol TDG. Trinidad’s divisions currently
operate in the drilling sector of the oil and natural gas industry, with
operations in Canada, the United States and internationally. In addition,
through joint venture arrangements, Trinidad operates drilling rigs in Saudi
Arabia and Mexico, and is currently assessing operations in other international
markets. Trinidad is focused on providing modern, reliable, expertly designed
equipment operated by well-trained and experienced personnel. Trinidad’s
drilling fleet is one of the most adaptable, technologically advanced and
competitive in the industry.

– END RELEASE – 04/05/2017

For further information:
Brent Conway
President & Chief Executive Officer
403.265.6525
OR
Lesley Bolster
Chief Financial Officer
403.265.6525
OR
Lisa Ottmann
Vice President, Investor Relations
403.294.4401
Email: [email protected]

COMPANY:
FOR: TRINIDAD DRILLING LTD.
TSX SYMBOL: TDG

INDUSTRY: Energy and Utilities – Oil and Gas
RELEASE ID: 20170504CC0079

Press Release from Marketwired 1-866-736-3779

All press releases are written by the client and have NO affiliation with the news copy written by The Canadian Press. Any questions that arise due to the content or information provided in the press release should be directed to the company/organization
issuing the release, not to The Canadian Press.

GET ENERGYNOW’S DAILY EMAIL FOR FREE


B.C. NDP vows to fight Trans Mountain pipeline, but won’t say how

VANCOUVER — The British Columbia New Democrat platform promises to use “every tool in the toolbox” to stop Kinder Morgan’s Trans Mountain pipeline expansion from going ahead.

But what are those tools? NDP Leader John Horgan isn’t saying.

“I’m going to be discussing those with the prime minister the day after the election,” he said on a campaign stop this week in Kamloops.

Standing on the bank of the South Thompson River, Horgan wasn’t far from where former NDP leader Adrian Dix proclaimed his opposition to Trans Mountain in 2013. Some pundits have declared the moment to be Dix’s fatal mistake in the election that saw Liberal Leader Christy Clark elected premier.

But Horgan faces entirely different circumstances ahead of Tuesday’s election. The federal government has already approved the $7.4-billion project, which would triple the bitumen-carrying capacity of the existing line from the Edmonton area to Burnaby, B.C. So despite his insistence he will fight the pipeline, some observers question whether it’s within his power.

“It’s natural to wonder whether this isn’t just a rhetorical posture,” said Richard Johnston, a political scientist at the University of British Columbia.

Despite its inclusion in the NDP platform, Trans Mountain hasn’t drawn much attention during B.C.’s four-week campaign. When asked about it in Kamloops, Horgan was quick to change the subject, saying there’s a range of issues he wants to raise with Prime Minister Justin Trudeau.

Asked again to clarify what tools he had to stop the project, Horgan pointed out that the Squamish Nation and the Tsleil-Waututh Nation in southwest B.C. have filed legal challenges against the federal government.

“There’s a whole host of other legal remedies available to us and we’ll be laying that out,” he said.

But while many voters in the Lower Mainland may oppose the project, workers and First Nations in rural B.C. tend to support it and the jobs it would bring. Speaking in North Vancouver on Wednesday, Horgan said he wasn’t worried that his position would lose him votes in the Interior.

“Not at all. I have a plan to create 96,000 construction jobs in British Columbia,” he said, referring to the NDP promise to create these jobs through building schools, hospitals, roads, housing and public transit.

If Horgan is elected on Tuesday, it will put Alberta and B.C. in the unprecedented position of having neighbouring NDP governments that fundamentally disagree on a major multibillion dollar project.

Alberta Premier Rachel Notley declined to endorse Horgan ahead of the B.C. election and warned her staff not to campaign for him because of his opposition to the pipeline, which is seen as crucial to the revitalization of Alberta’s oilsands and to Notley’s political future.

Horgan downplayed the rift when asked about it in Merritt this week.

“Rachel and I had dinner last fall and agreed to disagree. We agree on so many other issues. But on this fundamental question for the people of Alberta, she has her responsibilities as the leader of a government. 

“I have my responsibilities and I believe a seven-fold increase in tanker traffic in our pristine marine environment is a risk too great.”

Johnston said Horgan could attempt to leverage B.C.’s co-operation on federal initiatives, such as the Canada Pension Plan or the carbon tax, to sway Trudeau’s government on Trans Mountain. But that would be a high-stakes game, risking not only relationships with the federal government but with Alberta and other provinces.

“That’s pretty toxic politics,” he said.

Horgan could revoke B.C.’s environmental permit for the project, but interprovincial pipelines fall under federal jurisdiction so the Canadian government’s permit is paramount, said Johnston.

He said it doesn’t seem that Trans Mountain is as much of a ballot box issue as it was in 2013. But the NDP appears focused on swing ridings in the Lower Mainland and must appeal to the environmental faction of its party while fending off challenges from the Greens, he said.

Johnston said he’s unsure if Horgan’s stand will clash with Clark’s emphasis on jobs in the same way that it did when Dix was running for the job. 

“Because … so what if John Horgan opposes it? The deal is done.”

— Follow @ellekane on Twitter.

Laura Kane, The Canadian Press

GET ENERGYNOW’S DAILY EMAIL FOR FREE


Newfoundland Power declares dividends on Series A, B, D and G First Preference Shares

FOR: NEWFOUNDLAND POWER INC.

Date issue: May 04, 2017
Time in: 11:42 AM e

Attention:

ST. JOHN’S, NEWFOUNDLAND AND LABRADOR–(Marketwired – May 4, 2017) –
Newfoundland Power Inc. has declared regular quarterly dividends on its Series
A, B, D and G First Preference Shares as follows:

/T/

1. a dividend of $0.1375 per share on the issued and outstanding 5 1/2%

Cumulative Redeemable First Preference Share Series A of the Company for
the quarter ending July 31st, 2017, be and is hereby declared payable
August 1st, 2017 to the Series A First Preference Shareholders of record
at the close of business July 14th, 2017;
2. a dividend of $0.13125 per share on the issued and outstanding 5 1/4%
Cumulative Redeemable First Preference Share Series B of the Company for
the quarter ending July 31st, 2017, be and is hereby declared payable
August 1st, 2017 to the Series B First Preference Shareholders of record
at the close of business July 14th, 2017;
3. a dividend of $0.18125 per share on the issued and outstanding 7 1/4%
Cumulative Redeemable First Preference Share Series D of the Company for
the quarter ending August 31st, 2017, be and is hereby declared payable
September 1st, 2017 to the Series D First Preference Shareholders of
record at the close of business August 18th, 2017;
4. a dividend of $0.19 per share on the issued and outstanding 7.60%
Cumulative Redeemable First Preference Share Series G of the Company for
the quarter ending June 30th, 2017, be and is hereby declared payable
July 4th, 2017 to the Series G First Preference Shareholders of record
at the close of business June 16th, 2017; and,
5. the dividends hereby declared payable be and are hereby designated as
eligible dividends within the meaning of s.89(1) of the Income Tax Act
(Canada).

/T/

All the common shares of Newfoundland Power Inc. are owned by Fortis Inc.
(TSX/NYSE:FTS), a leader in the North American regulated electric and gas
utility industry with total assets of approximately $48 billion. The
Corporation’s 8,400 employees serve utility customers in five Canadian
provinces, nine U.S. states and three Caribbean countries. Fortis shares are
listed on the TSX and NYSE and trade under the symbol FTS.

Newfoundland Power is the primary distributer of electricity on the island
portion of Newfoundland and Labrador, and purchases 93% of its energy needs
from Newfoundland and Labrador Hydro. With a customer base of approximately
264,000 accounts, Newfoundland Power is committed to safety, dedicated to the
highest level of customer service and delivers reliable electricity at the
lowest possible cost. For more information on Newfoundland Power’s programs,
services and community partnerships, please visit newfoundlandpower.com

– END RELEASE – 04/05/2017

For further information:
Ms. Paige London
Vice President, Finance & Chief Financial Officer
Newfoundland Power Inc.
(709) 737-5409
(709) 737-5300 (FAX)
www.newfoundlandpower.com

COMPANY:
FOR: NEWFOUNDLAND POWER INC.

INDUSTRY: Energy and Utilities – Oil and Gas , Energy and Utilities
– Utilities
RELEASE ID: 20170504CC0071

Press Release from Marketwired 1-866-736-3779

All press releases are written by the client and have NO affiliation with the news copy written by The Canadian Press. Any questions that arise due to the content or information provided in the press release should be directed to the company/organization
issuing the release, not to The Canadian Press.

GET ENERGYNOW’S DAILY EMAIL FOR FREE


Cortex Extends the Value of its Network by Offering Supplier Funding Options via New Partnership with FundThrough

FOR: CORTEX BUSINESS SOLUTIONS INC.
TSX VENTURE SYMBOL: CBX
OTC PINK SYMBOL: CTPNF

Date issue: May 04, 2017
Time in: 11:36 AM e

Attention:

CALGARY, ALBERTA–(Marketwired – May 4, 2017) – Cortex Business Solutions Inc.
(TSX VENTURE:CBX), the leading network-as-a-service e-invoicing solutions
provider, is pleased to announce its newest partnership with FundThrough, a
Toronto, ON, based provider of online funding service offers for small
business.

“Cortex sought out this partnership as a means of solving a key issue facing
customers who are ready to capitalize on the industry’s turnaround and simply
needed a way to get their invoices paid, ensuring they have the funds they need
to grow their business” said Elena Dumitrascu, VP, Strategic Partnerships for
Cortex. “The service FundThrough provides is a natural extension of our core
e-invoicing solutions, as it helps speed up the time to pay on invoices,
through a platform our customers know, trust and use every day.”

Through this unique partnership, customers on the Cortex Network will be able
to request funding on approved invoices directly from their Cortex Workbench
account. Customers will be able to fund only the invoices they want to, and
receive payment within 24 hours with FundThrough. This immediate access to
funds ensures Suppliers on the Network are in control of the payment process
like never before, and have the ability to grow their funding limit at a rate
that matches their company’s needs.

“Access to funds is critical for both new and small businesses to be able to
grow. The oil and gas sector, especially, is finally seeing a period of
recovery and regrowth. With FundThrough’s invoice funding platform these
businesses can access their working capital immediately from unpaid invoices.
Companies can pay the bills and make the purchases they need to run their
business” said Deepak Ramachandran, Co-Founder & CTO of FundThrough. “This
partnership with Cortex is a natural fit, and one that we are extremely excited
to be a part of as it will give more than 9,000 companies currently using the
Cortex Network access to funds they need to grow.”

About FundThrough

FundThrough is a technology-driven online lending platform that provides small
businesses with quick, convenient and transparent financing. FundThrough has
developed a simple and secure platform that offers qualified businesses the
ability to unlock their accounts receivables to invest in and accelerate the
growth of their business. Today, FundThrough funds millions in invoices each
month for hundreds of SMEs. Key investors include ScaleUP Ventures and Real
Ventures.

Find out more at https://fundthrough.com

About Cortex Business Solutions

Cortex Business Solutions Inc. (TSX VENTURE:CBX) is a business-to-business
network that enables electronic invoicing for buying and supplying
organizations. The Cortex network offers flexible connection methods to reduce
the time required to process invoices and tools that leverage existing customer
technologies and processes. Access to the Cortex Network enhances the exchange
of documents allowing companies to connect and interact with each other to grow
their businesses.

For more information, please visit www.cortex.net

– END RELEASE – 04/05/2017

For further information:
Investor Relations Contacts:
Joel Leetzow
President and CEO
[email protected]
403-219-2838
OR
Sandra Fawcett
CFO
[email protected]
403-219-2838
OR
Andrew Stewart
Director, Marketing & Investor Relations
[email protected]
403-219-2838

COMPANY:
FOR: CORTEX BUSINESS SOLUTIONS INC.
TSX VENTURE SYMBOL: CBX
OTC PINK SYMBOL: CTPNF

INDUSTRY: Computers and Software – Networking, Computers and
Software – Software, Professional Services – Other Professional
Services, Professional Services – Purchasing
RELEASE ID: 20170504CC0070

Press Release from Marketwired 1-866-736-3779

All press releases are written by the client and have NO affiliation with the news copy written by The Canadian Press. Any questions that arise due to the content or information provided in the press release should be directed to the company/organization
issuing the release, not to The Canadian Press.

GET ENERGYNOW’S DAILY EMAIL FOR FREE


MEG Energy holds conference call to discuss first quarter 2017 financial results

FOR: MEG ENERGY CORP.TSX Symbol: MEGDate issue: May 04, 2017Time in: 10:30 AM eAttention:
CALGARY, AB –(Marketwired – May 04, 2017) – MEG Energy Corp. (TSX: MEG)
announces that it intends to release its financial results for the first
quarter ended …

GET ENERGYNOW’S DAILY EMAIL FOR FREE


Condor Provides an Operations Update

FOR: CONDOR PETROLEUM INC.TSX Symbol: CPIDate issue: May 04, 2017Time in: 8:30 AM eAttention:
CALGARY, AB –(Marketwired – May 04, 2017) – Condor Petroleum Inc. (“Condor”
or the “Company”) (TSX: CPI), a Canadian based oil and gas company focused on
e…

GET ENERGYNOW’S DAILY EMAIL FOR FREE


Jericho Oil Reports December 31, 2016 Reserves

FOR: JERICHO OIL CORPORATION
TSX VENTURE Symbol: JCO
OTC PINK Symbol: JROOF

Date issue: May 04, 2017
Time in: 8:00 AM e

Attention:

Company Increases 2P Reserves by 147%

VANCOUVER, BC and TULSA, OK –(Marketwired – May 04, 2017) – Jericho Oil
Corporation (“Jericho”) (TSX VENTURE: JCO) (OTC PINK: JROOF), announces the
results of its 2016 year-end reserves evaluation of its Kansas and Oklahoma
properties as prepared by Cawley, Gillespie & Associates, Inc. (“CGA”), the
Company’s independent reserves evaluator. The evaluation was prepared in
accordance with the standards contained in the Canadian Oil and Gas Evaluation
Handbook (“COGE Handbook”) and National Instrument 51-101 Standards of
Disclosure for Oil and Gas Activities (“NI 51-101”).

Highlights of the Reserve Report (all dollar amounts in $USD):

Jericho for the year ending December 31, 2016 achieved significant reserve
value growth (all dollar amounts are the Present Value of future cash flows
discounted at 10% before tax derived from YE2016 Independent Reserve Report
using forecast pricing, $USD):

/T/

— Proved plus Probable (2P) reserves total $41.9mm or 4.2mm barrels of oil

equivalent, 147% increase y-o-y
— Proved (1P) reserves total $27.9mm or 2.3mm barrels of oil equivalent,
77% increase y-o-y
— Proved Developed (PDP + PDNP) reserves totaled 1.6mm barrels of oil
equivalent, 72% increase y-o-y
— Jericho replaced(1) its 2016 production by 144% with the increase in PDP
reserves and 1,289% with the increase in 1P reserves mostly through a
successful acquisition and the deployment of incremental capital to
field-level initiatives
— The Company’s 2016 average finding, development and acquisition (“FD&A”)
costs are $4.34/boe(2) for Proved Developed reserves
— In comparing the cost of getting that Proved Developed boe out of the
ground with the cash earned per boe, the Company generated a 1.78x
recycle ratio(3), based on a full-year 2016 operating netback of
$7.74/boe despite a challenging oil price environment
— Proved Developed reserves accounted for 78% of the Total Proved reserves
value
— Approximately 75% of Proved reserves were crude oil (boe basis)
— The net asset value on a 2P NPV10% valuation is approximately $40.7mm or
USD$0.52 per common share outstanding, excluding any value for
undeveloped land and assuming net debt(4) of $(1.27mm) and 78,840,404
common shares outstanding.

/T/

(1) Replacement ratio, a non-IFRS financial measure, is an indicator of a
company’s ability to replace its production and grow reserves, calculated as
the sum of the reserve additions from defined sources divided by production
for the corresponding period.
(2) Recycle ratio, a non-IFRS financial measure, represents the cash earned
per boe produced (the numerator) versus the cost of getting that boe out of
the ground (the denominator). It serves as a proxy for a company’s return on
capital over a defined period of time.
(3) The Company deployed approximately $3.03mm on exploration costs plus
Proved Property Acquisition Costs plus Development Costs which yielded an
increase in year-over-year Proved Develop reserves of approximately 699k
barrels of oil equivalent.
(4) Net debt as defined by the Company’s credit agreement as of 12.31.16;
Total debt of approximately $2.48mm less cash on hand of approximately $3.75mm

Note: Barrels of oil equivalent (“boe”) amounts have been calculated using a
conversion ratio of six thousand cubic feet (6 mcf) of natural gas to one
barrel (1 bbl) of crude oil. The boe conversion ratio of 6 mcf to 1 bbl is
based on an energy equivalency conversion method primarily applicable at the
burner tip and does not represent a value equivalency at the wellhead.

Allen Wilson, CEO of Jericho Oil, stated, “We continued to execute on
Jericho’s growth strategy throughout the prolonged oil price downturn
resulting in increased production and reserves, the main drivers of our
Company’s intrinsic value. We increased Total Proved reserves NPV-10 by over
75%. Our current asset base is producing strong field-level cash margins at
current oil prices and have significant development optionality.”

Below, please find the charts outlining the Present Value and Per Barrel
Reserves summary of Jericho’s asset base in addition to its net asset value
and operating netback calculations:

/T/

Net Present Value ($M, USD)
Discounted at:
Reserve Category Net BOE 0% 5% 10% 15% 20%
——————————- ——————————————–
Proved Producing 853,767 28,055 18,292 13,423 10,554 8,679
Proved Non-Producing 812,600 24,630 13,593 8,389 5,490 3,685
Proved Undeveloped 662,533 17,629 10,293 6,169 3,614 1,924
——————————- ——————————————–
Total Proved 2,328,900 70,314 42,178 27,981 19,658 14,288
=============================== ============================================
Total Probable 1,878,267 43,266 24,684 13,965 7,432 3,301
——————————- ——————————————–
Proved plus Probable 4,207,167 113,580 66,862 41,946 27,090 17,589
=============================== ============================================

/T/

/T/

Net Asset Value NPV10 ($mm) $ / Share
—————————————————-
Total Proved 27,981 $ 0.36
====================================================
Total Probable 13,965 $ 0.18
—————————————————-
Proved plus Probable 41,946 $ 0.53
====================================================
Net Debt (1,269) $ (0.02)
—————————————————-
Net Asset value 40,677 $ 0.52
====================================================

/T/

/T/

Operating Netback ($/boe)
—————————————
Avg. Realized Sales Price
(net of royalties) $ 30.62
Operating Expenses $ 20.85
O&G Production Taxes $ 2.03
—————————————
Operating Netback $ 7.74
—————————————

/T/

About Jericho Oil Corporation

Jericho is a growth-oriented oil and gas company engaged in the acquisition,
exploration, development and production of overlooked and undervalued oil
properties in the Mid-Continent. For more information, please visit
www.jerichooil.com.

Cautionary Note Regarding Forward-Looking Statements: This news release
includes certain “forward-looking statements” within the meaning of the United
States Private Securities Litigation Reform Act of 1995 and Canadian
securities laws. There can be no assurance that such statements will prove to
be accurate and actual results and future events could differ materially from
those anticipated in such statements. Important factors that could cause
actual events and results to differ materially from Jericho’s expectations
include risks related to the exploration stage of Jericho’s project; market
fluctuations in prices for securities of exploration stage companies; and
uncertainties about the availability of additional financing.

Neither the TSX Venture Exchange nor its Regulation Services Provider (as that
term is defined in the policies of the TSX Venture Exchange) accepts
responsibility for the adequacy or accuracy of this release.

– END RELEASE – 04/05/2017

For further information:

CONTACTS:

Tony Blancato,
Director, Investor Relations
P: 918.986.7616

or

Adam Rabiner,
Director, Corporate Communications
P: 1.800.750.3520
[email protected]

COMPANY:
FOR: JERICHO OIL CORPORATION
TSX VENTURE Symbol: JCO
OTC PINK Symbol: JROOF

INDUSTRY: Energy and Utilities – Oil and Gas
RELEASE ID: 20170504CC011

Press Release from Marketwired 1-866-736-3779

All press releases are written by the client and have NO affiliation with the news copy written by The Canadian Press. Any questions that arise due to the content or information provided in the press release should be directed to the company/organization
issuing the release, not to The Canadian Press.

GET ENERGYNOW’S DAILY EMAIL FOR FREE


Midwest Energy Emissions Corp. to Host First Quarter 2017 Financial Results Conference Call on May 16, at 11:30 a.m. ET

FOR: MIDWEST ENERGY EMISSIONS CORP.OTCQB Symbol: MEECDate issue: May 04, 2017Time in: 8:00 AM eAttention:
LEWIS CENTER, OH –(Marketwired – May 04, 2017) – Midwest Energy Emissions
Corp. (OTCQB: MEEC) (“ME2C” or the “Company”), a leader in mercury em…

GET ENERGYNOW’S DAILY EMAIL FOR FREE


Enercare Home and Commercial Services Receives Accreditation by the Better Business Bureau

FOR: ENERCARE INC.
TSX Symbol: ECI

Date issue: May 04, 2017
Time in: 8:00 AM e

Attention:

TORONTO, ON –(Marketwired – May 04, 2017) – Enercare Inc. (“Enercare”) (TSX:
ECI), one of North America’s leading providers of essential home and
commercial services and energy solutions, is pleased to announce that Enercare
Home and Commercial Services has been accredited by the Better Business Bureau
(BBB) serving Central Ontario and holds a BBB rating of A.

“We are very pleased to be recognized by the Better Business Bureau serving
Central Ontario. Our accreditation reinforces the commitment of Enercare Home
and Commercial Services to providing customers with the highest level of
service, professionalism and expertise in the industry,” said John Macdonald,
President and Chief Executive Officer of Enercare. “Our A rating is a formal
recognition of all the hard work Enercare employees put in every day to serve
our valued customers.”

Being accredited means Enercare Home and Commercial Services accepts BBB
standards and affirms its commitment to(1):

/T/

— Build Trust – Establish and maintain a positive track record in the

marketplace
— Advertise – Adhere to established standards of advertising and selling
— Tell the Truth – Honestly represent products and services including
clear and adequate disclosures of all material items
— Be Transparent – Openly identify the nature, location, and ownership of
the business, and clearly disclose all policies, guarantees and
procedures that bear on a customer’s decision to buy
— Honor Promises – Abide by all written agreements and verbal
representations
— Be Responsive – Address marketplace disputes quickly, professionally,
and in good faith
— Safeguard Privacy – Protect data collected against mishandling and
fraud, collect personal information only as needed, and respect the
preference of customers regarding the use of their information
— Approach all business dealings, marketplace transactions and commitments
with integrity

/T/

About Enercare Inc.

Enercare is headquartered in Toronto, Ontario, Canada and is publicly traded
on the Toronto Stock Exchange (TSX: ECI). As one of North America’s largest
home and commercial services and energy solutions companies with approximately
4,500 employees under its Enercare and Service Experts brands, Enercare is a
leading provider of water heaters, water treatment, furnaces, air conditioners
and other HVAC rental products, plumbing services, protection plans and
related services. With operations in Canada and the United States, Enercare
serves approximately 1.6 million customers annually. Enercare is also the
largest non-utility sub-meter provider, with electricity, water, thermal and
gas metering contracts for condominium and apartment suites in Canada and
through its Triacta brand, a premier designer and manufacturer of advanced
sub-meters and sub-metering solutions.

For more information on Enercare visit www.enercare.ca. Additional information
regarding Enercare is available on SEDAR at www.sedar.com.

Source: Enercare Inc.

(1) http://www.bbb.org/kitchener/for-businesses/bbb-code-of-business-practices
-bbb-accreditation-standards/

– END RELEASE – 04/05/2017

For further information:

For further information, please contact:

Investors & Analysts:
Evelyn Sutherland
Chief Financial Officer
1.416.649.1860
[email protected]

Media Inquiries:
Perry Schwartz
Senior Manager, Public Relations and Social Media
1.905.943.6260
[email protected]

COMPANY:
FOR: ENERCARE INC.
TSX Symbol: ECI

INDUSTRY: Energy and Utilities – Alternative Energy, Energy and Utilities –
Coal, Energy and Utilities – Equipment, Energy and Utilities –
Nuclear, Energy and Utilities – Oil and Gas, Energy and Utilities –
Pipelines, Energy and Utilities – Utilities, Energy and Utilities –
Clean Technology, Financial Services – Personal Finance

RELEASE ID: 20170504CC014

Press Release from Marketwired 1-866-736-3779

All press releases are written by the client and have NO affiliation with the news copy written by The Canadian Press. Any questions that arise due to the content or information provided in the press release should be directed to the company/organization
issuing the release, not to The Canadian Press.

GET ENERGYNOW’S DAILY EMAIL FOR FREE


TransCanada Announces Agreements to Sell Interests in Iroquois and PNGTS to TC PipeLines, LP

FOR: TRANSCANADA
TSX SYMBOL: TRP
NYSE SYMBOL: TRP

Date issue: May 04, 2017
Time in: 7:31 AM e

Attention:

CALGARY, ALBERTA–(Marketwired – May 4, 2017) – News Release – TransCanada
Corporation (TSX:TRP)(NYSE:TRP) (TransCanada) today announced it has entered
into agreements to sell a 49.3 per cent interest in Iroquois Gas Transmission
System, LP (Iroquois), together with its remaining 11.8 per cent interest in
Portland Natural Gas Transmission System (PNGTS), to its master limited
partnership, TC PipeLines, LP (NYSE:TCP) (the Partnership).

The US$765 million transaction, comprised of US$597 million in cash and the
assumption of US$168 million in proportionate debt at Iroquois and PNGTS, is
expected to close mid-2017, subject to customary conditions precedent.

“This agreement demonstrates the meaningful role that our MLP can play in
funding a portion of our $23 billion near-term growth portfolio,” said Russ
Girling, TransCanada’s president and chief executive officer. “Successfully
executing our capital program through the end of the decade positions
TransCanada to deliver significant sustainable growth in earnings, cash flow
and dividends.”

The Iroquois pipeline transports natural gas under long-term contracts and
extends from the TransCanada Mainline system at the U.S. border near
Waddington, New York to markets in the U.S. northeast, including New York City,
Long Island and Connecticut. Iroquois is currently jointly owned by affiliates
of TransCanada and Dominion Resources, Inc. through a joint venture. The
pipeline is operated by a stand-alone company that is also jointly owned and
based in Connecticut.

PNGTS is an interstate natural gas pipeline which began serving New England’s
energy needs in March 1999. The pipeline connects with the Trans Quebec &
Maritimes Pipeline at the Canadian border and shares facilities with the
Maritimes and Northeast Pipeline from Westbrook, Maine to a connection with the
Tennessee Gas Pipeline System near Boston, Massachusetts. In January 2016,
TransCanada sold a 49.9 per cent interest in PNGTS to the Partnership.

TransCanada, through its subsidiaries, currently holds an approximate 26 per
cent interest in TC PipeLines, LP, a United States master limited partnership,
which was formed to acquire, own and actively participate in the management of
U.S. natural gas pipelines and related assets.

With more than 65 years’ experience, TransCanada is a leader in the responsible
development and reliable operation of North American energy infrastructure
including natural gas and liquids pipelines, power generation and gas storage
facilities. TransCanada operates a network of natural gas pipelines that
extends more than 91,500 kilometres (56,900 miles), tapping into virtually all
major gas supply basins in North America. TransCanada is the continent’s
leading provider of gas storage and related services with 653 billion cubic
feet of storage capacity. A large independent power producer, TransCanada
currently owns or has interests in over 10,100 megawatts of power generation in
Canada and the United States. TransCanada is also the developer and operator of
one of North America’s leading liquids pipeline systems that extends over 4,300
kilometres (2,700 miles), connecting growing continental oil supplies to key
markets and refineries. TransCanada’s common shares trade on the Toronto and
New York stock exchanges under the symbol TRP. Visit TransCanada.com and our
blog to learn more, or connect with us on social media and 3BL Media.

FORWARD LOOKING INFORMATION

This publication contains certain information that is forward-looking and is
subject to important risks and uncertainties (such statements are usually
accompanied by words such as “anticipate”, “expect”, “believe”, “may”, “will”,
“should”, “estimate”, “intend” or other similar words). Forward-looking
statements in this document are intended to provide TransCanada security
holders and potential investors with information regarding TransCanada and its
subsidiaries, including management’s assessment of TransCanada’s and its
subsidiaries’ future plans and financial outlook. All forward-looking
statements reflect TransCanada’s beliefs and assumptions based on information
available at the time the statements were made and as such are not guarantees
of future performance. Readers are cautioned not to place undue reliance on
this forward-looking information, which is given as of the date it is expressed
in this news release, and not to use future-oriented information or financial
outlooks for anything other than their intended purpose. TransCanada undertakes
no obligation to update or revise any forward-looking information except as
required by law. For additional information on the assumptions made, and the
risks and uncertainties which could cause actual results to differ from the
anticipated results, refer to the Quarterly Report to Shareholders dated
February 16, 2017 and 2016 Annual Report filed under TransCanada’s profile on
SEDAR at www.sedar.com and with the U.S. Securities and Exchange Commission at
www.sec.gov.

– END RELEASE – 04/05/2017

For further information:
Media Enquiries:
Mark Cooper / James Millar
403.920.7859 or 800.608.7859
OR
TransCanada Investor & Analyst Enquiries:
David Moneta / Stuart Kampel
403.920.7911 or 800.361.6522

COMPANY:
FOR: TRANSCANADA
TSX SYMBOL: TRP
NYSE SYMBOL: TRP

INDUSTRY: Energy and Utilities – Oil and Gas
RELEASE ID: 20170504CC0029

Press Release from Marketwired 1-866-736-3779

All press releases are written by the client and have NO affiliation with the news copy written by The Canadian Press. Any questions that arise due to the content or information provided in the press release should be directed to the company/organization
issuing the release, not to The Canadian Press.

GET ENERGYNOW’S DAILY EMAIL FOR FREE


Vantage Drilling International Reports First Quarter Results for 2017

FOR: VANTAGE DRILLING INTERNATIONAL

Date issue: May 04, 2017
Time in: 7:00 AM e

Attention:

HOUSTON, TX–(Marketwired – May 04, 2017) – Vantage Drilling International
(“Vantage” or the “Company”) reported a net loss of approximately $36.5 million
or $7.30 per share for the three months ended March 31, 2017 as compared to a
net loss of $29.0 million or $5.81 per share for the Successor period from
February 10, 2016 through March 31, 2016 and a net loss of $471.0 million for
the period from January 1, 2016 to February 10, 2016 for the Predecessor
Company. The weighted-average shares outstanding for the three months ended
March 31, 2017 and for the period from February 10, 2016 through March 31, 2016
was 5,000,053. As a wholly-owned subsidiary, the Predecessor did not have a
comparable outstanding ordinary shares.

Upon emergence from the Company’s Chapter 11 restructuring on February 10,
2016, Vantage adopted fresh-start accounting, which resulted in the Company
becoming a new entity for financial reporting purposes. References to
“Successor” relate to the financial position and results of operations of the
reorganized Vantage as of and subsequent to February 10, 2016. References to
“Predecessor” refer to the financial position of Vantage as of and prior to
February 10, 2016 and the results of operations prior to February 10, 2016. As
a result of the application of fresh-start accounting and the effects of the
implementation of our Plan of Reorganization, the financial statements on or
after February 10, 2016 are not comparable with the financial statements prior
to that date.

As of March 31, 2017, Vantage had approximately $227.6 million of available
cash as compared to $231.7 million as of December 31, 2016. Additionally,
Vantage had $22.6 million available for issuance of letters of credit under its
revolving letter of credit facility at the end of the quarter. Vantage also
delivered operational rig uptime of 99% together with revenue efficiency of
101%. Ihab Toma, CEO, commented, “We are happy to report another successful
quarter of superior operational performance combined with further reducing
costs while maintaining our committed sharp focus on safety. Additionally, with
the completion of the Vantage 260 acquisition in early April, the extension of
the Aquamarine Driller contract, and the reactivation of both the Topaz Driller
and Sapphire Driller set for May, we continue to build backlog and benefit from
positive economies of scale, whilst preserving our strong balance sheet.”

Vantage Drilling International, a Cayman Islands exempted company, is an
offshore drilling contractor, with a fleet of three ultra-deepwater drillships,
four premium jackup drilling rigs and one standard jack-up drilling rig.
Vantage’s primary business is to contract drilling units, related equipment and
work crews primarily on a dayrate basis to drill oil and natural gas wells
globally for major, national and large independent oil and natural gas
companies. Vantage also provides construction supervision services and
preservation management services for, and will operate and manage, drilling
units owned by others.

The information above includes forward-looking statements within the meaning of
the Securities Act of 1933 and the Securities Exchange Act of 1934. These
forward-looking statements are subject to certain risks, uncertainties and
assumptions identified above or as disclosed from time to time in the company’s
filings with the Securities and Exchange Commission. As a result of these
factors, actual results may differ materially from those indicated or implied
by such forward-looking statements. Vantage disclaims any intention or
obligation to update publicly or revise such statements, whether as a result of
new information, future events or otherwise.

/T/

Vantage Drilling International
Consolidated Statement of Operations
(In thousands, except per share data)
(Unaudited)
Successor Predecessor
————————– ————-
Period from Period from
February 10, January 1,
Three Months 2016 to 2016 to
Ended March March 31, February 10,
31, 2017 2016 2016
———— ———— ————-
Revenue
Contract drilling services $ 38,056 $ 24,059 $ 20,891
Management fees 401 959 752
Reimbursables 3,592 4,768 1,897
———— ———— ————-
Total revenue 42,049 29,786 23,540
———— ———— ————-
Operating costs and expenses
Operating costs 28,998 27,439 25,213
General and administrative 11,479 9,168 2,558
Depreciation 18,439 12,076 10,696
———— ———— ————-
Total operating costs and
expenses 58,916 48,683 38,467
———— ———— ————-
Loss from operations (16,867) (18,897) (14,927)
Other income (expense)
Interest income 141 6 3
Interest expense and other
financing charges (contractual
interest of $23,219 for the
period from January 1, 2016 to
February 10, 2016) (18,899) (10,650) (1,728)
Other, net 552 1,834 (69)
Reorganization items – (154) (452,919)
———— ———— ————-
Total other expense (18,206) (8,964) (454,713)
———— ———— ————-
Loss before income taxes (35,073) (27,861) (469,640)
Income tax provision 1,426 1,167 2,371
———— ———— ————-
Net loss (36,499) (29,028) (472,011)
Net loss attributable to
noncontrolling interests – – (969)
———— ———— ————-
Net loss attributable to VDI $ (36,499) $ (29,028) $ (471,042)
============ ============ =============
Net loss per share, basic and
diluted $ (7.30) $ (5.81) N/A
Weighted average successor
ordinary shares outstanding,
basic and diluted 5,000 5,000 N/A

Vantage Drilling International
Supplemental Operating Data
(Unaudited, in thousands, except percentages)
Successor Predecessor
————————– ————-
Period from Period from
February 10, January 1,
Three Months 2016 to 2016 to
Ended March March 31, February 10,
31, 2017 2016 2016
———— ———— ————-
Operating costs and expenses
Jackups $ 12,862 $ 8,278 $ 5,975
Deepwater 11,056 13,146 15,550
Operations support 2,969 2,215 2,219
Reimbursables 2,111 3,800 1,469
———— ———— ————-
$ 28,998 $ 27,439 $ 25,213
———— ———— ————-

Utilization
Jackups 50.0% 60.0% 53.6%
Deepwater 33.3% 33.3% 33.3%

Vantage Drilling International

Consolidated Balance Sheet
(In thousands, except share and par value information)
(Unaudited)

March 31, December 31,
2017 2016
———— ————
ASSETS
Current assets
Cash and cash equivalents $ 227,592 $ 231,727
Trade receivables 19,643 20,850
Inventory 44,913 45,206
Prepaid expenses and other current assets 13,375 12,423
———— ————
Total current assets 305,523 310,206
———— ————
Property and equipment
Property and equipment 904,397 902,241
Accumulated depreciation (86,152) (67,713)
———— ————
Property and equipment, net 818,245 834,528
Other assets 15,599 15,694
———— ————
Total assets $ 1,139,367 $ 1,160,428
============ ============

LIABILITIES AND SHAREHOLDERS’ EQUITY
Current liabilities
Accounts payable $ 36,951 $ 35,283
Accrued liabilities 22,896 18,448
Current maturities of long-term debt 4,430 1,430
———— ————
Total current liabilities 64,277 55,161
———— ————
Long-term debt, net of discount and financing
costs of $93,260 and $105,568 876,322 867,372
Other long-term liabilities 8,707 11,335
Commitments and contingencies
Shareholders’ equity
Ordinary shares, $0.001 par value, 50 million
shares authorized; 5,000,053 shares issued
and outstanding 5 5
Additional paid-in capital 373,972 373,972
Accumulated deficit (183,916) (147,417)
———— ————
Total shareholders’ equity 190,061 226,560
———— ————
Total liabilities and shareholders’ equity $ 1,139,367 $ 1,160,428
============ ============

Vantage Drilling International
Consolidated Statement of Cash Flows
(In thousands)
(Unaudited)

Successor Predecessor
————————– ————-
Period from Period from
February 10, January 1,
Three Months 2016 to 2016 to
Ended March March 31, February 10,
31, 2017 2016 2016
———— ———— ————-
CASH FLOWS FROM OPERATING
ACTIVITIES
Net loss $ (36,499) $ (29,028) $ (472,011)
Adjustments to reconcile net loss
to net cash provided by (used
in) operating activities:
Depreciation expense 18,439 12,076 10,696
Amortization of debt financing
costs 117 76 –
Amortization of debt discount 12,191 6,847 –
PIK interest on the Convertible
Notes 1,890 1,684 –
Reorganization items – – 430,210
Share-based compensation
expense 780 – –
Deferred income tax benefit (1,789) (606) –
Loss on disposal of assets – 144 –
Changes in operating assets and
liabilities:
Restricted cash – – (1,000)
Trade receivables 1,207 22,629 (3,575)
Inventory 293 (221) 223
Prepaid expenses and other
current assets (951) (4,954) 6,893
Other assets 1,434 368 941
Accounts payable 1,668 6,708 (14,890)
Accrued liabilities and other
long-term liabilities (401) (7,485) 21,148
———— ———— ————-
Net cash provided by (used
in) operating activities (1,621) 8,238 (21,365)
———— ———— ————-
CASH FLOWS FROM INVESTING
ACTIVITIES
Additions to property and
equipment (2,156) (7,674) 116
———— ———— ————-
Net cash provided by (used
in) investing activities (2,156) (7,674) 116
———— ———— ————-
CASH FLOWS FROM FINANCING
ACTIVITIES
Repayment of long-term debt (358) (358) (7,000)
Proceeds from issuance of 10%
Second Lien Notes – – 75,000
Debt issuance costs – (51) (1,125)
———— ———— ————-
Net cash provided by (used
in) financing activities (358) (409) 66,875
———— ———— ————-
Net increase (decrease) in
cash and cash equivalents (4,135) 155 45,626
Cash and cash equivalents –
beginning of period 231,727 249,046 203,420
———— ———— ————-
Cash and cash equivalents – end
of period $ 227,592 $ 249,201 $ 249,046
============ ============ =============

/T/

– END RELEASE – 04/05/2017

For further information:
Public & Investor Relations Contact:
Thomas J. Cimino
Chief Financial Officer
Vantage Drilling International
(281) 404-4700

COMPANY:
FOR: VANTAGE DRILLING INTERNATIONAL

INDUSTRY: Energy and Utilities – Oil and Gas , Energy and Utilities
– Pipelines
RELEASE ID: 20170504CC0020

Press Release from Marketwired 1-866-736-3779

All press releases are written by the client and have NO affiliation with the news copy written by The Canadian Press. Any questions that arise due to the content or information provided in the press release should be directed to the company/organization
issuing the release, not to The Canadian Press.

GET ENERGYNOW’S DAILY EMAIL FOR FREE


Seven Generations’ Q1 production reaches 153,100 boe/d

FOR: SEVEN GENERATIONS ENERGY LTD.
TSX SYMBOL: VII

Date issue: May 04, 2017
Time in: 7:00 AM e

Attention:

Year-over-year quarterly production up 73%, funds from operations up 146% to
$272 million

Rising production rates on track to average 180,000 – 190,000 boe/d in 2017

CALGARY, ALBERTA–(Marketwired – May 4, 2017) – Seven Generations Energy Ltd.’s
(TSX:VII) first quarter production averaged 153,100 barrels of oil equivalent
per day (boe/d), up 73 percent from the same period last year. With record
quarterly production and stronger commodity prices, first quarter funds from
operations also set a record at $272.3 million or 75 cents per share, an
increase of 146 and 88 percent, respectively, compared to the first quarter of
2016.

“Production in the first quarter was 16 percent higher than the fourth quarter
of 2016 and consistent with our budget. We remain on track to deliver full-year
production in line with our 2017 guidance of 180,000 to 190,000 boe/d. Our
continued focus on operating efficiencies and innovation is yielding strong
financial and operating results. We had a robust start to the year, running 13
drilling rigs and two pressure pumping spreads for most of the first quarter,
and had 78 Nest wells in various stages of development at the end of March,”
said Marty Proctor, 7G’s President & Chief Operating Officer.

Processing plant expansion completed and on stream

“We have ample processing and transportation capacity in place to continue our
high rate of production growth. We have access to the recently expanded
capacity at Pembina’s Kakwa River natural gas processing plant, where
condensate processing capacity is up about 50 percent to approximately 25,000
barrels per day (bbls/d), which enables significant production growth from our
recently acquired lands,” Proctor said.

Deliberate and focused innovation continues to improve well performance

“In the time since our initial public offering in November 2014, we have
continued to drive both operating efficiency and innovation in pursuit of
optimal well and economic performance. Our most recent wells are 30 percent
longer, have 45 percent more sand injected and twice as many fracture stages
than our 2014 type curve wells. Initial results from these new wells
demonstrate the higher productivity and enhanced economics associated with
higher intensity completions,” said Pat Carlson, 7G’s Chief Executive Officer.

Experimental 60-stage completions herald promising production rates

7G completed eight wells in the first quarter on a pad located on the boundary
between Nest 1 and Nest 2 type curve areas. These wells had an average lateral
length of approximately 2,600 metres and six were completed with 40 fracture
stages. On two of the wells, 7G experimented with a higher intensity completion
design with 60 fracture stages.

“Although only early-time data are available, we are encouraged by the wells’
performance. The condensate production from this pad is outperforming 7G’s 2016
Nest 2 condensate type curve. In the first 30 days, condensate production from
the 40-stage wells is about 25 percent higher, while the 60-stage well
production is up about 50 percent when compared to our 2016 Nest 2 condensate
type curve. These results further demonstrate our focus on value enhancement
through the ongoing application of technology,” said Glen Nevokshonoff, 7G’s
Senior Vice President, Operations.

“Given our success in reducing drilling costs since the IPO, and the view that
the technology has yet to mature, we are encouraged to continue our focus on
both improved efficiency and innovation – two tools that we expect will allow
us to remain among North America’s lowest cost producers as we pursue increased
value from the development of our project,” Carlson said.

Operating netbacks before hedging up 79 percent year-over-year to $24.09 per
boe

First quarter realized natural gas and liquids prices were $35.52 per boe, up
52 percent compared to a year earlier. Prices for condensate, 7G’s biggest
revenue contributor, increased 61 percent in the first quarter to average
$64.07 per bbl. Operating netbacks prior to hedging were up 79 percent to
$24.09 compared to the first quarter of 2016.

“Our operating income of $75 million in the first quarter highlights the fact
that we continue to drive towards full-cycle returns for our shareholders, as
indicated by our growing operating income per share of 21 cents, which was a 62
percent increase from the fourth quarter of 2016. If the economic environment
remains similar to what we have now, we expect per-share growth and
profitability metrics will continue to stand out compared to our peer group and
produce industry-leading results,” said Chris Law, 7G’s Chief Financial Officer.

HIGHLIGHTS FOR THE QUARTER ENDED MARCH 31, 2017

/T/

— Achieved record production in line with company expectations, averaging

153,100 boe/d (58 percent liquids), up 73 percent from the first quarter
of 2016. Production per share grew 33 percent over the same period.
— Funds from operations also set a record at $272.3 million or 75 cents
per share, an increase of 146 and 88 percent, respectively, compared to
the first quarter of 2016.
— Operating income grew to $74.8 million or 21 cents per share, an
increase of 704 and 600 percent, respectively, compared to the same
quarter last year.
— Operating netback prior to hedging of $24.09 per boe was up 79 percent
compared to the first quarter of 2016.
— First quarter capital investment was $362.3 million, consistent with
planned 2017 capital investments of between $1.5 billion and $1.6
billion.
— Tested 40- and 60-stage completions along the boundary between Nest 1
and 2. Condensate production in the first 30 days was 25 and 50 percent
higher, respectively, compared to 7G’s 2016 Nest 2 condensate type
curve.

/T/

2017 FIRST QUARTER FINANCIAL AND OPERATING RESULTS

/T/

Three months ended
March 31,
%
2017 2016 Change
—————————————————————————-
Operational Highlights
($ millions, except per share and volume data)
Production
Condensate (mbbls/d) 46.8 28.4 65
NGLs (mbbls/d) 42.2 22.6 87
Natural gas (MMcf/d) 384 225 71
—————————————————————————-
Total (mboe/d) 153.1 88.5 73
Liquids % 58% 58% –
—————————————————————————-

Realized prices
Condensate and oil ($/bbl) 64.07 39.92 60
NGLs ($/bbl) 18.03 8.96 101
Natural gas ($/Mcf) 4.36 3.24 35
—————————————————————————-
Total ($/boe) 35.52 23.34 52
—————————————————————————-

OPERATING NETBACK(1)($/boe)
Liquids and natural gas revenues 35.52 23.34 52
Royalties (1.22) (1.61) (24)
Operating expenses (4.99) (3.85) 30
Transportation, processing and other (2) (5.22) (4.43) 18
—————————————————————————-
Netback prior to hedging 24.09 13.45 79
Realized hedging (loss) gain (0.52) 4.50 (112)
—————————————————————————-
Operating netback after hedging 23.57 17.95 31
—————————————————————————-
General and administrative expenses per boe 0.79 1.00 (21)
—————————————————————————-

Selected financial information
($ millions, except per share and share data)
Liquids and natural gas revenue 489.4 188.0 160
Operating income (1) 74.8 9.3 704
Per share – diluted 0.21 0.03 600
Net income for the period 215.6 138.4 56
Per share – diluted 0.59 0.50 18
Funds from operations (1) 272.3 110.6 146
Per share – diluted 0.75 0.40 88
Cash provided by operating activities 335.7 144.5 132
Capital investments (3) 362.3 267.1 36
Adjusted working capital (1) 500.5 447.4 12
Available funding (1) 1,540.9 1,260.4 22
Net debt (1) 1,594.1 1,013.6 57
Debt outstanding 2,092.1 1,451.6 44
Weighted average shares – basic 350.6 263.2 33
Weighted average shares – diluted 363.1 278.9 30
—————————————————————————-
—————————————————————————-
(1) Operating netback, funds from operations, operating income, available
funding, adjusted working capital and net debt are not defined under
IFRS. See “Non-IFRS Financial Measures” in Management’s Discussion and
Analysis dated May 3, 2017 for the three months ended March 31, 2017.
(2) Certain comparative figures have been reclassified to conform to current
period presentation.
(3) Excluding acquisitions and equity investments.

/T/

OPERATIONS

Drilling days reduced by 13 percent in the Nest

Seven Generations drilled 23 Nest wells in the first quarter at an average rate
that was 13 percent faster than the first quarter of 2016 due to a series of
innovations such as underbalanced drilling, batch drilling, improved drill bit
design, downhole directional motor enhancements and running a 24-hour real-time
operating centre to guide directional drilling. Nest wells averaged 2,649
metres on the horizontal leg, took 34 days to drill and had an average cost of
$3.8 million. 7G operated up to 13 drilling rigs targeting the Montney
Formation across its Kakwa River Project during the quarter.

“At the time of the IPO in November 2014, wells with a similar horizontal
length took 55 days to drill and cost $6.6 million each. With first quarter
wells being drilled in 34 days at $3.8 million each, 7G has institutionalized
enduring savings, not just lower costs due to the reduced activity in the
supply and service sector,” Nevokshonoff said.

Although the entire industry, including 7G, endured cost pressures due to
heightened activity in the Montney, 7G’s average drilling cost per lateral
metre fell by 10 percent compared to the first quarter of 2016. The company
shaved five days off the time it takes to drill a Montney pad well, bringing it
down to an average of 34 days.

Completions stage count up 44 percent, cost per tonne of sand pumped down 10
percent

“In Nest completions, we averaged 39 stages per well compared to 27 stages in
the same quarter of 2016 while adding 37 percent more sand per well at a 10
percent lower cost per tonne of sand,” Nevokshonoff said.

7G’s first quarter completions cost were consistent with historical unit costs.
Higher intensity completions, delineation wells to the south and west of
existing Nest pads and one acquired pad that was not setup with 7G’s typical
high-efficiency batch-process resulted in an increase in average well costs.

Operating and transportation costs aligned with 2017 expectations

First quarter operating and transportation costs of $10.21 per boe were in line
with 2017 expectations despite being impacted by using temporary production
equipment at delineation drilling sites and drilling wells on new pads within
the Nest where permanent processing facilities were under construction. The
increased application of lower-cost slickwater fractures also resulted in
higher water trucking volumes.

“We remain confident that our innovation and efficiencies will continue to
drive down unit costs over the course of 2017 as our development program
reverts to a higher proportion of completions on 7G-designed pads, as we focus
on reducing cycle times from well spud to production, as we use more modules in
production facility construction and as our production growth increases
throughput efficiencies in processing facilities,” Nevokshonoff said.

Continual improvement in operations

The company continued to ramp up production with batch drilling and higher
intensity completions, which employ more fracture stages and more proppant sand
per well in pursuit of increased well productivity. 7G ran two hydraulic
fracture spreads through most of the first quarter, ended the quarter with
three spreads, and now has four operating. This high level of activity reflects
7G’s ability to capture the economics of operating year round on its permanent,
all-season roads and pads. 7G continued to optimize the use of slickwater
fractures in its completions to maximize condensate recovery and the net
present value of its wells.

DRILLING AND COMPLETIONS

The table below illustrates the drilling and completions activity for wells
drilled in the Nest for the periods indicated.

/T/

—————————————————————————-
—————————————————————————-

Q1 2017 Q1 2016 % Change
—————————————————————————-
—————————————————————————-
Drilling
—————————————————————————-
Horizontal wells rig released 23.0 15.0 53
Average measured depth (m) 5,875 5,936 (1)
Average horizontal length (m) 2,649 2,694 (2)
Average drilling days per well 34 39 (13)
Average drilling cost per lateral metre ($) 1,441 1,597 (10)
Average well cost ($mm) 3.8 4.3 (12)
—————————————————————————-
Completions
—————————————————————————-
Wells completed 14.0 18.0 (22)
Average number of stages per well 39 27 44
Average tonnes pumped per stage 167 176 (5)
Average tonnes pumped per well 6,546 4,770 37
Average cost per tonne ($) 1,093 1,214 (10)
Average well cost ($mm) 7.2 5.8 24
—————————————————————————-
—————————————————————————-
Total drilling and completions cost per well
($mm) 11.0 10.1 9
—————————————————————————-
—————————————————————————-

/T/

Construction of new Super Pads on track, enabling significant growth

Super Pads are scalable, minimize the company’s footprint, reduce operational
risks and maximize efficiency by having the capacity to process a portion of
raw gas and condensate on site. In the first quarter, 7G advanced construction
on three new Super Pads that are expected to start operating in the second half
of 2017, taking the company’s Super Pad count to 12.

“7G’s application of Super Pad production systems remains key to our ability to
handle the increased water production associated with the application of lower
cost and better performing slickwater completions,” Nevokshonoff said.

MARKETING

7G continues to pursue a variety of expanded market opportunities, such as
supplying natural gas to power generation in Alberta, supplying natural gas and
natural gas liquids to petrochemical facilities and exporting liquefied natural
gas and propane off Canada’s West Coast to serve Asia consumers.

Advancing market access options to Central Canada, capturing stronger prices

“We recently contracted 77 MMcf/d of firm transportation service on
TransCanada’s mainline natural gas pipeline from the Alberta border to the
natural gas trading hub at Dawn, Ontario starting in November 2017, subject to
regulatory approval. This is another step in our diversified natural gas
marketing strategy, providing increased access to central Canadian markets.
This transportation commitment represents about 10 percent of our 2018
contracted transportation volumes, which rise to 870 MMcf/d in the third
quarter of 2018,” said Proctor.

“Our production remains on a steep growth curve, and our take-away capacity and
market access optionality is keeping pace with our total natural gas processing
capacity,” Proctor added.

FINANCIAL

Disciplined financial strength, capital investment on track in 2017

Seven Generations maintained its strong financial position with $500 million of
adjusted working capital and $640 million of cash and cash equivalents at March
31, 2017. 7G has available funding of approximately $1.5 billion and net debt
of approximately $1.6 billion. The company invested capital of $362 million in
the first quarter, which is in line with its expected 2017 capital investment
of between $1.5 billion and $1.6 billion.

Managing market risk

Hedging remains an integral component of 7G’s financial strategy. Seven
Generations’ consistent and balanced approach ensures coverage of debt
servicing costs and non-discretionary capital costs while protecting a portion
of returns on capital investment. 7G’s risk management program operates within
the guidelines set out by its Board of Directors and its credit agreement.
Hedging is part of the company’s broader risk management focus and is
considered alongside other important risk mitigation policies such as
insurance. The program allows for partial participation in upside commodity
price movements while guaranteeing a minimum cash flow stream to underpin the
company’s multi-year commitments such as transportation and processing
agreements, term debt, office space contracts and investments in human capital.
Having revenue assurance on a portion of production is critical in the process
of planning future capital allocations.

HEDGING

The company had the following risk management contracts in place at March 31,
2017:

/T/

————————————————————-
Natural
Crude Oil Gas
————————————————————-
Chicago
Citygate
WTI Collars WTI 3 Way Collars Swaps
————————————————————-
Period bbl/d C$/bbl bbl/d C$/bbl MMbtu/d
—————————————————————————-
2017 remainder 15,000 $63.98 – $78.10 9,000 $41.11/$56.67/$76.83 166,667
2018 14,250 $61.81 – $78.40 12,000 $40.83/$56.25/$75.54 135,000
2019 8,500 $60.00 – $79.75 6,000 $41.25/$56.67/$77.15 50,000
2020 500 $60.00 – $79.95 – – –
—————————————————————————-

————————————————————–
Foreign
Natural Gas Exchange
————————————————————–
Chicago Citygate
Swaps AECO 7A Collars C$/US$ Swaps
————————————————————–
US$/ US$
Period MMbtu GJ/d C$/GJ $MM US$/C$
—————————————————————————-
2017 remainder $3.03 53,333 $2.50 – $3.03 138.7 1.3039
2018 $2.91 50,000 $2.50 – $2.99 143.0 1.3262
2019 $2.95 50,000 $2.50 – $2.99 53.6 1.3111
2020 – – – – –
—————————————————————————-

/T/

OUTLOOK

Disciplined long-term growth

Seven Generations intends to complete a $1.5 billion to $1.6 billion capital
investment program in 2017, with the majority of funds being directed to
drilling, completions and facilities development. Through innovatively applying
technology and the continuous pursuit of operating efficiencies, 7G aims to
deliver maximum shareholder value over the long term, delivering resources
safely and responsibly. 7G’s 2017 production guidance is 180,000 to 190,000
boe/d, 55 to 60 percent of which is expected to be comprised of liquids.

“The first quarter of 2017 was punctuated by several milestones for Seven
Generations’ stakeholders and shareholders: record production, record funds
flow, and the company’s 250th Montney well, 181 of which were completed by 7G
through evolving drilling, completions and production practices. Over the
nearly two-and-one-half-year period since our IPO, we have applied our growing
expertise to drill some of the best performing wells to date in the prolific
Montney Formation. This has helped us improve the economics for our developing
core resource area and has given us comfort in acquiring more land in the
region. Our significant production growth was rounded out with continued
conservative financial management and disciplined execution of our capital
program. All of this has given us confidence to add to our market commitments,
enabling continued growth in this period of over-supply,” said Pat Carlson,
7G’s Chief Executive Officer.

CORPORATE

Seven Generations’ annual and special meeting of shareholders today

Seven Generations is holding its annual and special meeting of shareholders
today, Thursday, May 4, 2017 at 2 p.m. in Calgary’s Telus Convention Centre,
Room: Glen 206, 120 – 9th Avenue S.E., Calgary, Alberta.

7G Science Expo today

Following the meeting, Seven Generations will host a Science Expo from 3 p.m.
to 5 p.m. at Calgary’s Telus Convention Centre, 120 – 9th Avenue S.E., rooms
Glen 201-204. The 7G Expo will feature a variety of booths showcasing
operational, technical, strategic, environmental and community initiatives.
7G’s employee hosts welcome the opportunity to discuss, inform and engage with
the company’s shareholders and stakeholders.

Generations 2017 stakeholder report posted on 7genergy.com

“Together with last year’s first edition, our 2017 stakeholder report entitled
Generations tells the stories of a variety of our stakeholders, and thus
describes how we endeavour to serve their needs. We invite you to read through
stories about a sampling of stakeholders, who have been vital contributors to
our company’s success,” said Susan Targett, Senior Vice President.

“Our Code of Conduct says, in part, ‘We recognize that rights, sufficient to
build and operate an energy project, can be granted and taken away by society.
Over the longer term, companies can only expect to thrive if they serve the
legitimate needs of the society in which they exist. To thrive, companies must
differentiate, rise above the pack, standout as being among the best with all
of their stakeholders. We support an open and competitive business environment,
recognizing in the competitive world that we envision, only those who best
serve their stakeholders can expect the support required to survive for the
longer term,'” Targett said.

Conference Call

7G management will hold a conference call to discuss results and address
investor questions today, Thursday, May 4, 2017 at 9 a.m. MT (11 a.m. ET).

/T/

Participant Dial-In Numbers:

Operator Assisted Toll-Free (877) 390-7644
Local or International (647) 252-4486
Conference Call ID: 3694861

Encore Dial In: (855) 859-2056 or (800) 585-8367
Replay code: 3694861
Available: May 4 – May 11, 2017

/T/

Seven Generations Energy

Seven Generations is a low-supply-cost, high-growth Canadian natural gas
developer generating long-life value from its liquids-rich Kakwa River Project,
located about 100 kilometres south of its operations headquarters in Grande
Prairie, Alberta. 7G’s corporate headquarters are in Calgary and its shares
trade on the TSX under the symbol VII.

Further information on Seven Generations is available on the company’s website:
www.7genergy.com.

Non-IFRS Financial Measures and Other Measures

This news release includes certain terms or performance measures commonly used
in the oil and natural gas industry that are not defined under IFRS, including
“funds from operations”, “operating income”, “operating netback”, “available
funding”, “net debt” and “adjusted working capital”. Operating netback has been
calculated on a per boe basis and is determined by deducting royalties,
operating and transportation, processing and other expenses from oil and
natural gas revenue and, except where otherwise indicated, after adjusting for
realized hedging gains or losses. Operating netback is utilized by the company
and others to better analyze the operating performance of its oil and natural
gas assets. The data presented are intended to provide additional information
and should not be considered in isolation or as a substitute for measures of
performance prepared in accordance with IFRS. These non-IFRS measures should be
read in conjunction with the company’s financial statements and accompanying
notes. Readers are cautioned that the non-IFRS measures do not have any
standardized meaning and should not be used to make comparisons between the
company and other companies without also taking into account any differences in
the way the calculations were prepared.

For more information regarding “funds from operations”, “operating income”,
“operating netback”, “available funding”, “net debt” and “adjusted working
capital”, see “Non-IFRS Financial Measures” in the company’s Management’s
Discussion and Analysis dated May 3, 2017, for the three months ended March 31,
2017.

Per share amounts are presented on a diluted basis.

Reader Advisory

This news release contains certain forward-looking information and statements
that involve various risks, uncertainties and other factors. The use of any of
the words “anticipate”, “continue”, “estimate”, “expect”, “may”, “will”,
“should”, “believe”, “plans”, and similar expressions are intended to identify
forward-looking information or statements. In particular, but without limiting
the foregoing, this news release contains forward-looking information and
statements pertaining to the following: anticipated 2017 production; expected
production growth, including the significant production growth expected from
recently acquired lands; anticipated transportation and processing capacity;
enhanced economics expected in connection with higher intensity completions;
planned 2017 capital investment and the expected allocation of capital;
anticipated sources of funding; ability to remain among North America’s lowest
cost producers through improved efficiency and innovation; expectation that per
share growth and profitability metrics will continue to stand out compared to
7G’s peers and produce industry leading results if the economic environment
remains similar to the current economic environment; the net present value
forecasted in respect of 7G’s wells; expected per share growth and
profitability; the planned completion of the three new Super Pads in the second
half of 2017; the enduring nature of operational savings expected; expectation
that innovation and efficiency will continue to drive down unit costs in
2017;expectation that the agreement with TransCanada Pipelines Limited for
additional transportation capacity will provide market access to the Dawn
market in Ontario starting in November 2017, subject to regulatory approval;
increased throughput efficiencies expected from production facilities with
production growth; anticipated liquids yields; the company’s goal of delivering
maximum shareholder value over the longer term in a manner that is safe and
responsible; and the ability to generate long life value from the Kakwa River
Project.

With respect to forward-looking information contained in this news release,
assumptions have been made regarding, among other things: future oil, NGLs and
natural gas prices being consistent with current commodity price forecasts
after factoring in quality adjustments at the company’s points of sale; the
company’s continued ability to obtain qualified staff and equipment in a timely
and cost-efficient manner; infrastructure and facility design concepts that
have been applied by the company in its Kakwa River Project may be successfully
applied elsewhere in the Kakwa River Project; the consistency of the regulatory
regime and framework governing royalties, taxes and environmental matters in
the jurisdictions in which the company conducts its business and any other
jurisdictions in which the company may conduct its business in the future; the
company’s ability to market production of oil, NGLs and natural gas
successfully to customers; the company’s future production levels and amount of
future capital investment will be consistent with the company’s current
development plans and budget; the applicability of new technologies for
recovery and production of the company’s reserves and resources may improve
capital and operational efficiencies in the future; the recoverability of the
company’s reserves and resources; sustained future capital investment by the
company; future cash flows from production; the future sources of funding for
the company’s capital program; the company’s future debt levels; geological and
engineering estimates in respect of the company’s reserves and resources; the
geography of the areas in which the company is conducting exploration and
development activities, and the access, economic, regulatory and physical
limitations to which the company may be subject from time to time; the impact
of competition on the company; and the company’s ability to obtain financing on
acceptable terms.

Actual results could differ materially from those anticipated in the
forward-looking information that is contained herein as a result of the risks
and risk factors that are set forth in the company’s Annual Information Form
for the year ended December 31, 2016, dated March 7, 2017 (the “AIF”), which is
available on SEDAR at www.sedar.com, including, but not limited to:
volatility in market prices and demand for oil, NGLs and natural gas and
hedging activities related thereto; general economic, business and industry
conditions; variance of the company’s actual capital costs, operating costs and
economic returns from those anticipated; the ability to find, develop or
acquire additional reserves and the availability of the capital or financing
necessary to do so on satisfactory terms; risks related to the exploration,
development and production of oil and natural gas reserves and resources;
negative public perception of oil sands development, oil and natural gas
development and transportation, hydraulic fracturing and fossil fuels; actions
by governmental authorities, including changes in government regulation,
royalties and taxation; potential legislative and regulatory changes; the
rescission, or amendment to the conditions, of groundwater licenses of the
company; management of the company’s growth; the ability to successfully
identify and make attractive acquisitions, joint ventures or investments, or
successfully integrate future acquisitions or businesses; the availability,
cost or shortage of rigs, equipment, raw materials, supplies or qualified
personnel; adoption or modification of climate change legislation by
governments; the absence or loss of key employees; uncertainty associated with
estimates of oil, NGLs and natural gas reserves and resources and the variance
of such estimates from actual future production; dependence upon compressors,
gathering lines, pipelines and other facilities, certain of which the company
does not control; the ability to satisfy obligations under the company’s firm
commitment transportation arrangements; the uncertainties related to the
company’s identified drilling locations; the high-risk nature of successfully
stimulating well productivity and drilling for and producing oil, NGLs and
natural gas; operating hazards and uninsured risks; the possibility that the
company’s drilling activities may encounter sour gas; execution risks
associated with the company’s business plan; failure to acquire or develop
replacement reserves; the concentration of the company’s assets in the Kakwa
River Project area; unforeseen title defects; aboriginal claims; failure to
accurately estimate abandonment and reclamation costs; development and
exploratory drilling efforts and well operations may not be profitable or
achieve the targeted return;
horizontal drilling and completion technique risks and failure of drilling
results to meet expectations for reserves or production; limited intellectual
property protection for operating practices and dependence on employees and
contractors; third-party claims regarding the company’s right to use technology
and equipment; expiry of certain leases for the undeveloped leasehold acreage
in the near future; failure to realize the anticipated benefits of acquisitions
or dispositions; failure of properties acquired now or in the future to produce
as projected and inability to determine reserve and resource potential,
identify liabilities associated with acquired properties or obtain protection
from sellers against such liabilities; changes in the application,
interpretation and enforcement of applicable laws and regulations; restrictions
on drilling intended to protect certain species of wildlife; potential
conflicts of interests; actual results differing materially from management
estimates and assumptions; seasonality of the company’s activities and the
Canadian oil and gas industry; alternatives to and changing demand for
petroleum products; extensive competition in the company’s industry; changes in
the company’s credit ratings; third party credit risk; dependence upon a
limited number of customers; lower oil, NGLs and natural gas prices and higher
costs; failure of 2D and 3D seismic data used by the company to accurately
identify the presence of oil and natural gas; risks relating to commodity price
hedging instruments; terrorist attacks or armed conflict; cyber-security risks,
loss of information and computer systems; inability to dispose of non-strategic
assets on attractive terms; security deposits required under provincial
liability management programs; reassessment by taxing authorities of the
company’s prior transactions and filings; variations in foreign exchange rates
and interest rates; third-party credit risk, including risk associated with
counterparties in risk management activities related to commodity prices and
foreign exchange rates; sufficiency of insurance policies; potential
litigation; variation in future calculations of non-IFRS measures; sufficiency
of internal controls; breach of agreements by counterparties and potential
enforceability issues in contracts; impact of expansion into new activities on
risk exposure; inability of the company to respond quickly to competitive
pressures; and the risks related to the Common Shares that are publicly traded
and the company’s senior notes and other indebtedness.

Definitions and Abbreviations

/T/

AECO physical storage and trading hub for natural gas on the
TransCanada Alberta system which is the delivery point for various
benchmark Alberta index prices
bbl barrel
bbls barrels
boe(1) barrels of oil equivalent
C$ Canadian dollars
d day
GJ gigajoule
IFRS International Financial Reporting Standards
IPO initial public offering
m metres
Mcf thousand cubic feet
mboe thousands of barrels of oil equivalent
mbbls thousands of barrels
MM millions
MMBtu million British thermal units
MMcf million cubic feet
Nest 1 means the prospects within the Nest, outside of the Nest 2 area
Nest 2 means the highest return prospects within the Nest
Nest means the primary development block of the Kakwa River Project
NGLs natural gas liquids
Q1 first quarter of the year
Super Pad means the decentralized field conditioning plants that separate
field condensate and natural gas
TSX Toronto Stock Exchange
US$ United States dollars
WTI West Texas Intermediate
$MM millions of dollars

/T/

Seven Generations Energy Ltd. is also referred to as Seven Generations, Seven
Generations Energy, 7G or the company.

/T/

(1) Seven Generations has adopted the standard of 6 Mcf:1 bbl when

converting natural gas to boes. Condensate and other NGLs are converted
to boes at a ratio of 1 bbl:1 bbl. Boes may be misleading, particularly
if used in isolation. A boe conversion ratio of 6 Mcf:1 bbl is based
roughly on an energy equivalency conversion method primarily applicable
at the burner tip and does not represent a value equivalency at the
company’s sales point. Given the value ratio based on the current price
of oil as compared to natural gas is significantly different from the
energy equivalency of 6 Mcf: 1 bbl, utilizing a conversion ratio at 6
Mcf: 1 bbl may be misleading as an indication of value.

/T/

– END RELEASE – 04/05/2017

For further information:
Investor Relations
Chris Law, Chief Financial Officer
Brian Newmarch, Vice President, Capital Markets
403-767-0752
[email protected]
OR
Media Relations
Alan Boras
Director, Communications and Stakeholder Relations
403-767-0772
[email protected]
OR
Seven Generations Energy Ltd.
Suite 4400, 525 – 8th Avenue SW
Calgary, AB T2P 1G1
7genergy.com

COMPANY:
FOR: SEVEN GENERATIONS ENERGY LTD.
TSX SYMBOL: VII

INDUSTRY: Energy and Utilities – Oil and Gas
RELEASE ID: 20170504CC0018

Press Release from Marketwired 1-866-736-3779

All press releases are written by the client and have NO affiliation with the news copy written by The Canadian Press. Any questions that arise due to the content or information provided in the press release should be directed to the company/organization
issuing the release, not to The Canadian Press.

GET ENERGYNOW’S DAILY EMAIL FOR FREE


TransGlobe Energy Corporation Announces Release Date of First Quarter 2017 Results and Conference Call

FOR: TRANSGLOBE ENERGY CORPORATIONTSX SYMBOL: TGLNASDAQ SYMBOL: TGADate issue: May 04, 2017Time in: 6:30 AM eAttention:
CALGARY, ALBERTA–(Marketwired – May 4, 2017) – TransGlobe Energy Corporation
(“TransGlobe”) (TSX:TGL) (NASDAQ:TGA) will announce i…

GET ENERGYNOW’S DAILY EMAIL FOR FREE


Canadian Natural Resources Limited Announces Quarterly Dividend

FOR: CANADIAN NATURAL RESOURCES LIMITEDTSX SYMBOL: CNQNYSE SYMBOL: CNQDate issue: May 04, 2017Time in: 5:05 AM eAttention:
CALGARY, ALBERTA–(Marketwired – May 4, 2017) – Canadian Natural Resources
Limited (TSX:CNQ)(NYSE:CNQ) announces its Board of Di…

GET ENERGYNOW’S DAILY EMAIL FOR FREE


Fraser Institute News Release: Practical realities of carbon taxes and cap-and-trade systems across Canada undermine potential benefits

FOR: THE FRASER INSTITUTE
Date issue: May 04, 2017Time in: 5:00 AM eAttention:
CALGARY, AB –(Marketwired – May 04, 2017) – Governments across Canada fail
to properly implement carbon-pricing schemes, which could, in theory, both
reduce greenhouse ga…

GET ENERGYNOW’S DAILY EMAIL FOR FREE


Athabasca Oil Corporation Announces 2017 First Quarter Results

FOR: ATHABASCA OIL CORPORATION
TSX SYMBOL: ATH

Date issue: May 03, 2017
Time in: 11:26 PM e

Attention:

CALGARY, ALBERTA–(Marketwired – May 3, 2017) – Athabasca Oil Corporation
(TSX:ATH) (“Athabasca” or the “Company”) is pleased to provide its 2017 first
quarter results and an operations update. The first quarter marks the
completion and integration of the transformational Statoil oil sands
acquisition, a successful balance sheet refinancing and operational momentum in
the Light Oil division. The Company is positioned for strong economic growth
through the second half of 2017.

First Quarter and Recent Highlights

/T/

— Q1 2017 highlights

— Production of 26,737 boe/d (95% liquids), representing 72% per share
growth year over year
— Capital expenditures of $78 million ($67 million net Light Oil and
$11 million Thermal Oil)
— Cost discipline drives a 54% year over year G&A reduction to
$2.67/boe
— Successful Placid Montney winter program (70% working interest)
— Current Light Oil production is approximately 7,500 boe/d,
representing 120% growth over Q1 2017
— 20 wells rig released with 11 wells completed and placed on
production before break-up
— Initial production and pressure data from the new wells are
supporting Athabasca’s type curve which is highly economic in the
current pricing environment (52% IRR & 22 month payback at US$50/bbl
WTI). Initial free liquids yields are trending between 300 – 500
bbl/mmcf
— Commissioned the Placid battery and infrastructure project in April
with capacity for 10,000 bbl/d and 36 mmcf/d
— Positioned for strong economic production and cash flow growth
through H2 2017
— $200 million gross Duvernay joint venture program in 2017 (30% working
interest)
— Murphy operated two rigs through the winter and rig released eight
horizontal wells
— Completions operations underway on two pads with ten additional
spuds planned for H2 2017
— Advancing phase window delineation and optimized well design with
longer laterals and larger fracs (up to 3,000 meters and 3,000
lbs/ft)
— Thermal division underpins low corporate decline and free cash flow
generation
— Successful integration of Leismer drives $11 million of free cash
flow through February and March
— $30 million capital reduction in 2017 as a result of continued
strong well pair performance and the prior investment in sustaining
infill wells
— Commodity hedging of 13,000 bbl/d at approx. $53/bbl WCS protects
near-term cash flow
— Solidified the balance sheet and long-term funding position
— Strong liquidity and financial flexibility with $327 million of
cash, a $203 million capital carry balance and $103 million of
available credit facilities at quarter end
— Term debt extended to 2022 through the issuance of US$450 million of
new covenant light notes
— Significant asset value in operated Thermal and Light Oil
infrastructure

/T/

Athabasca’s Strategy

Athabasca is an intermediate oil weighted producer with exposure to several of
the largest resource plays in Western Canada including the Montney, Duvernay
and oil sands. The Company has a fully funded development outlook capable of
delivering growth to 60,000 boe/d by 2020 (40% production per share CAGR) and
is guided by a strategy that includes:

/T/

— Light Oil: Defined and Material Growth

— A scalable operated Montney position at Placid
— Funded Duvernay development through the joint venture with Murphy
Oil
— Production growth to over 10,000 boe/d by year-end 2017 and
approximately 25,000 boe/d over the next five years
— Thermal Oil: Free Cash Flow with Leverage to Oil prices
— A large low decline asset base accelerates free cash flow
— Free cash flow of approximately $350 million over a five year period
at US$55/bbl WTI
— Future low risk expansion options
— Financial Sustainability
— Maturing cash flow profile with strong sustainability metrics and a
low overall corporate production decline of approximately 7.5%
annually
— Diverse asset base provides flexibility in future capital allocation
decisions
— Net debt to cash flow expected to be less than 2.5x at year-end 2018
(US$55/bbl WTI)

/T/

Financial and Operating Highlights

/T/

Three months ended
March 31,
($ Thousands, except per share and boe
amounts) 2017 2016
—————————————————————————-
CONSOLIDATED PRODUCTION
Petroleum and natural gas volumes (boe/d) 26,737 13,348
—————————————————————————-

LIGHT OIL DIVISION

Petroleum and natural gas sales volumes
(boe/d) 3,421 6,319
Light Oil operating income(1) $ 6,863 $ 4,908
Light Oil operating netback ($/boe)(1) $ 22.28 $ 8.53
Capital expenditures $ 77,646 $ 30,658
Recovery of capital-carry through capital
expenditures $ (10,680) $ –
—————————————————————————-

THERMAL OIL DIVISION(2)

Bitumen production (bbl/d) 23,316 7,029
Thermal Oil operating income (loss) (1) $ 12,341 $ (23,074)
Thermal Oil operating netback(1,2) $ 5.89 $ (35.34)
Capital expenditures(3) $ 10,868 $ 916
—————————————————————————-

CASH FLOWS AND FUNDS FLOW

Cash flow from operating activities $ (52,896) $ (38,017)
Cash flow from operating activities per
share (basic & diluted) $ (0.11) $ (0.09)
Funds flow from operations(1) $ (1,649) $ (39,982)
Funds flow from operations per share(1)
(basic & diluted) $ – $ (0.10)
—————————————————————————-

NET LOSS AND COMPREHENSIVE LOSS

Net loss and comprehensive loss $ (29,162) $ (65,129)
Net loss and comprehensive loss per share
(basic & diluted) $ (0.06) $ (0.16)
—————————————————————————-

SHARES OUTSTANDING
Weighted average shares outstanding (basic &
diluted) 472,157,006 404,511,104
—————————————————————————-

ACQUISITIONS AND FINANCINGS

Leismer Corner Acquisition(4) $ (622,076) $ –
Net proceeds from sale of assets $ 90,170 $ 163
Net proceeds from issuance of 2022 Notes $ 542,554 $ –
Repayment of 2017 Notes $ (550,000) $ –
—————————————————————————-

March 31, December 31
As at ($ Thousands) 2017 2016
LIQUIDITY AND INDEBTEDNESS
Cash and cash equivalents $ 212,999 $ 650,301
Restricted Cash $ 113,823 $ 107,012
Capital-carry receivable (current & long term
portion – undiscounted) $ 202,789 $ 213,469
Face value of long-term debt (current and
long-term portion) $ 599,490 $ 550,000
—————————————————————————-

1. Refer to “Advisories and Other Guidance” in the MD&A for additional

information on Non-GAAP Financial Measures.
2. The Leismer Project was acquired on January 31, 2017. From the date of
the acquisition to the end of the first quarter of 2017, the Leismer
Project produced 22,521 bbl/d.
3. Thermal Oil capital expenditures excludes the cost of the Leismer Corner
Acquisition.
4. Consists of cash of $431.3 million, common shares of $166.0 million and
contingent payment obligations of $24.7 million.

/T/

Operations Update

Light Oil

Greater Placid Montney (Athabasca operated, 70% working interest)

At Placid, Athabasca completed an active winter program that included rig
releasing 20 Montney wells, the commissioning of a new battery and the tie-in
of three multi-well pads. Placid is positioned for flexible and scalable
economic growth over the next five years.

Two drilling rigs commenced operations last fall and the Company rig released a
total of 20 horizontal wells from five pads. The program was designed to
accelerate pad drilling operations targeting two Montney cycles. Drilling costs
averaged $3.0 million per well with average lateral lengths of approximately
2,600 meters and the latest eight wells up to 3,000 meters. The Company
maintained its drilling costs year over year as operational efficiencies offset
modest service cost inflation. Drilling performance on the latest wells were
industry pacesetters reaching total depth in approximately 15 days. The Company
is advancing operational readiness for next winter’s drilling program which
will include a combination of low risk infill locations off existing pads and
step-outs from the core development.

A total of three pads, 11 wells, were completed this winter with all wells
placed on production in April through the Company’s owned and operated
infrastructure (surface locations 7-30, 16-30 & 12-19-60-23W5). The Company
modified its completion design to a plug and perf from ball drop with the goal
to improve fracture intensity and ultimately long term rates and recoveries.
Completion costs for the program averaged $4.2 million per well ($124,000 per
stage, 34 average stages per well) with proppant intensity up to 1,000 lbs/ft
(1.8 T/m). The remaining two pads are expected to be completed following
break-up and placed on production in the third quarter (surface locations
3-4-61-23W5 & 7-33-60-23W5).

The Placid battery and infrastructure project was commissioned in April. The
new infrastructure will support Athabasca’s mid-term growth targets and has
capacity of 10,000 bbl/d and 36 mmcf/d (gross). The Company operates all of its
regional infrastructure with liquids pipe connected to the Pembina Peace system
and gas processed through Keyera’s Simonette Gas Plant and marketed through the
Alliance System.

In April, Athabasca’s Light Oil production was impacted by a 16 day unplanned
shutdown of the Keyera Simonette Gas Plant. The Company was able to partially
mitigate the impact by redirecting a portion of its regional Kaybob and Placid
production to the SemCAMS KA plant. During the shutdown approximately 50% of
volumes were restricted with an estimated 250 boe/d impact to annual volumes.

Current Light Oil production is approximately 7,500 boe/d representing 120%
growth over Q1 2017. In the Montney, initial production and pressure data from
the new wells are supporting Athabasca’s type curve which is highly economic in
the current pricing environment (52% IRR and 22 month payback at US$50/bbl
WTI). Regional production is temporarily restricted as a result of spring road
bans limiting the trucking of flowback fluid. Initial free liquids yields have
ranged between 300 – 500 bbl/mmcf and compare favorably to type curve
expectations between 200 – 300 bbl/mmcf during the first 30 days of operation.
The Company anticipates increasing gas rates over time as the wells clean-up.
Extended production rates for the new wells will be provided with the Company’s
Q2 2017 results.

Decisions regarding second half activity levels will be finalized in the summer
and the Company retains flexibility to adapt the program to results and
external market conditions.

Greater Kaybob Duvernay (Murphy operated, 30% working interest)

Joint venture operations commenced in the fall of 2016 with the objective of
driving near-term production and cash flow growth, delineation across all phase
windows, optimizing well design and maximizing land retention.

Murphy operated two drilling rigs through the winter season and rig released
eight wells from four pads. Initial activity has been focused in the condensate
rich gas window at Kaybob West and in the volatile oil window at Kaybob West
North. Drilling performance has been competitive with industry peers and wells
have averaged approximately 24 days spud to rig release (5,000 – 6,000 meters
average measured depth). Activity through the second half will step out through
the volatile oil window at Kaybob East, Two Creeks and Simonette.

A two well pad at surface location 1-18-64-20W5 was spud in late 2016 and
completed and placed on production through the first quarter. Utilizing an
existing pad, Murphy drilled two offsets to the 1-7-64-20W5 well with average
lateral lengths of approximately 1,400 meters. A restricted flow back technique
was employed to evaluate completion design and reservoir production
characteristics over time.

A two well pad at surface location 4-32-64-20W5 was rig released in early March
with average laterals of approximately 2,800 meters. Completions operations are
underway with tie-in expected post break-up.

A single well at surface location 16-18-65-20W5 was rig released in late March
with a 2,900 meter lateral. This well is the longest lateral drilled to date
and the most northern well in the volatile oil window. Completions operations
are planned post break-up.

A three well pad at surface location 11-18-64-20W5 was rig released in April
with average laterals of approximately 2,400 meters. Completions operations are
underway with tie-in expected post break-up.

The 2017 budget includes spudding 16 gross wells which are a mix of pad
development locations and delineation wells throughout the volatile oil window.
Murphy intends to optimize well design with average lateral lengths increasing
to between 2,500 – 3,000 meters and frac intensity between 2,000 – 3,000 lbs/ft
(3 – 5 T/m). Total lateral drilling for the program is approximately 45,000
meters and this compares to Athabasca’s initial 20 well appraisal campaign of
approximately 27,000 meters since 2012.

Results from the Duvernay program are expected to pick up through H2 2017 as
wells are completed and tied-in post break-up with 10 additional spuds planned
for the balance of the year.

Thermal Oil

Leismer

Athabasca assumed operatorship of Leismer following closing of its acquisition
on January 31, 2017. The asset is meeting expectations with an established low
decline production base and averaged 22,521 bbl/d through February and March.
Over the same period the asset generated $17 million of operating income and
$11 million of free cash flow. Leismer is a Tier 1 thermal asset with a strong
free cash flow profile in the current price outlook.

As a result of strong well pair performance and prior investment in sustaining
infill wells the 2017 capital budget at Leismer has been reduced by $30 million
to $54 million (previously $84 million) with no impact to planned production.
Athabasca also sees opportunities for operating cost reductions over the next
year including alternate diluent sourcing which is expected to be operational
in mid-2018.

Near-term operations will focus on production optimization across the field and
the start-up of predrilled infills on Pad L5. Through the mid-term the Company
intends to expand Pad L2 with five new well pairs and evaluate infill
opportunities on Pads L3 and L4.

Hangingstone

Hangingstone averaged 8,552 bbl/d for the quarter and approximately 9,200 bbl/d
for March. As previously guided the Company is anticipating facility
maintenance in April and May that will impact near-term production growth. The
project is expected to reach name plate capacity of approximately 12,000 bbl/d
in 2018 with minimal maintenance capital expected within the first five years
of operations.

Egress Update

In the first quarter Athabasca secured 20,000 bbl/d of blended bitumen capacity
on the Kinder Morgan Trans Mountain Expansion Project. The pipeline project is
federally approved and is expected to be in-service in late 2019. The Company
believes securing term take-away capacity to multiple end markets is essential
to its long-term strategy. The Trans Mountain pipeline will provide Athabasca
exposure to global oil demand growth.

2017 Outlook and Budget

Light Oil Guidance

Athabasca’s 2017 Light Oil capital budget is unchanged at $135 million ($120
million for Placid Montney and $15 million net post capital carry for Duvernay)
with production guidance of 6,500 – 7,500 boe/d and production expected to
reach 10,000 boe/d before year-end. H2 2017 Montney capital will be assessed
mid-year.

Thermal Oil Guidance

Athabasca’s 2017 Thermal Oil budget has been reduced by $30 million to $75
million (approximately a 30% reduction) with unchanged production guidance of
29,000 – 32,500 bbl/d. The capital program now consists of $54 million at
Leismer, $15 million at Hangingstone and an additional $6 million for
maintaining Athabasca’s long dated thermal leases.

2017 Budget & Guidance Details

/T/

Full Year
—————————————————————————-
CORPORATE (net)
Production1 (boe/d) 36,000 – 40,000
Liquids Weighting (%) approx. 90%
Funds Flow from Operations ($MM) approx. $90

LIGHT OIL

Production (boe/d) 6,500 – 7,500
Operating Income ($MM) approx. $75
Capital Expenditures ($MM) $135

THERMAL OIL

Bitumen Production1 (bbl/d) 29,000 – 32,500
Operating Income ($MM) approx. $100
Capital Expenditures ($MM) $75

COMMODITY ASSUMPTIONS

WTI (US$/bbl) $52.00
Edmonton Par (C$/bbl) $65.00
Western Canadian Select (C$/bbl) $50.00
AECO Gas (C$/mcf) $2.75
FX (US$/C$) 0.75

/T/

Notes:

/T/

1. Production guidance reflects a January 31, 2017 closing date for the

Statoil acquisition with Leismer volumes to be reported from February –
December.

/T/

Balance Sheet and Risk Management Update

In the first quarter Athabasca completed a comprehensive balance sheet
refinancing transaction. This included the issuance of US$450 million of
five-year covenant lite second lien notes to replace the Company’s existing
$550 million of second lien notes, and the establishment of a $120 million
reserve based credit facility. Athabasca is well positioned to advance its
strategic objectives with multi-year funding certainty, financial flexibility
and a strong liquidity outlook.

At the end of the first quarter Athabasca had a cash positon of $327 million
(inclusive of restricted cash) and $103 million of available credit facilities.
The Company also has $203 million of remaining capital carry that will drive $1
billion of gross Duvernay investment over four years, as well as significant
asset value in its established and operated Thermal and Light Oil
infrastructure.

Athabasca anticipates an internally funded capital program in 2018 at US$55/bbl
WTI with net debt to cash flow of less than 2.5x and trending lower in
subsequent years.

The Company has recently commenced a commodity risk management program designed
to protect a base level of cash flow and support its capital plans. The Company
intends to hedge a minimum of 20,000 bbl/d for the balance of 2017 with 13,000
bbl/d of Western Canadian Select (“WCS”) hedged at approximately C$53/bbl and
an additional 7,000 bbl/d of WCS differential hedged at approximately
US$14.75/bbl. Going forward, a multi-year hedging program is expected to form a
part of the Company’s risk management strategy.

About Athabasca Oil Corporation

Athabasca Oil Corporation is a Canadian energy company with a focused strategy
on the development of thermal and light oil assets. Situated in Alberta’s
Western Canadian Sedimentary Basin, the Company has amassed a significant land
base of extensive, high quality resources. Athabasca’s common shares trade on
the TSX under the symbol “ATH”. For more information, visit www.atha.com.

Reader Advisory:

This News Release contains forward-looking information that involves various
risks, uncertainties and other factors. All information other than statements
of historical fact is forward-looking information. The use of any of the words
“anticipate”, “plan”, “continue”, “estimate”, “expect”, “may”, “will”,
“project”, “believe”, “contemplate”, “target”, “potential” and similar
expressions are intended to identify forward-looking information. The
forward-looking information is not historical fact, but rather is based on the
Company’s current plans, objectives, goals, strategies, estimates, assumptions
and projections about the Company’s industry, business and future operating and
financial results. This information involves known and unknown risks,
uncertainties and other factors that may cause actual results or events to
differ materially from those anticipated in such forward-looking information.
No assurance can be given that these expectations will prove to be correct and
such forward-looking information included in this News Release should not be
unduly relied upon. This information speaks only as of the date of this News
Release.

In particular, this News Release contains forward-looking information
pertaining to, but not limited to, the following: the Company’s five-year
growth outlook and that such growth outlook is fully funded; the Company’s
expectation of realizing strong economic growth through the second half of
2017; estimates of, and timing of, sustainable free cash flow generation, net
debt to cash flow levels and cash and cash equivalents and liquidity, for
certain future periods; the Company’s 2017 production guidance corporately as
well as for each of its Light Oil and Thermal Oil projects; the Company’s
expected production and economic growth in 2017 and over the next five years;
the Company’s production levels by 2020; that the Placid area assets will
provide flexible and scalable economic growth over the next five years; the
payback timelines expected for the Company’s Montney wells; the Company’s plans
with respect to its 2017/2018 winter drilling program; the Company’s
expectation that it will increase gas rates with well clean-up; the benefits
expected to be realized from the Company’s modified well completion design; the
benefits expected to be realized from the Company’s new Placid battery and
infrastructure; the second half 2017 program for the Company’s interest in the
Murphy-operated assets;
the expectation that the Trans Mountain pipeline will be in service by late
2019; the impact of, and the benefits expected to be realized from, the Statoil
transaction; and future performance and characteristics of the Leismer and
Corner assets including their quality and resilience to lower commodity prices;
the Company’s expectation that its low decline thermal oil asset base will
accelerate its free cash flow generation; the Company’s expectation that it
will be able to maintain stable production from the Leismer assets for the
foreseeable future; the Company’s expectation that its Thermal Oil assets
provide future low risk expansion options; the Company’s Leismer production
optimization plans; the Company’s ability to reduce operating and capital costs
over the next five years; the timing for achievement of name plate capacity at
Hangingstone and expectations regarding maintenance capital within the first
five years of operations; future drilling and completion plans including the
number of wells expected to be drilled and timing of spudding, rig-releasing
and completing such wells; the timing of when such wells will be placed on
production; the total number of lateral meters expected to be drilled in 2017;
expectations with respect to future production hedging levels and the benefit
expected to be realized from such hedging; decline rates; estimates of 2017
funds flow from operations, operating income and capital expenditures; the
capability of the Company’s five-year development outlook to deliver potential
growth in per share production; the benefits expected to be realized by the
Company from its issuance of the US$450 million senior secured second lien
notes and establishment of the $120 million credit facility; and other matters.

Information relating to “reserves” is also deemed to be forward-looking
information, as it involves the implied assessment, based on certain estimates
and assumptions, that the reserves described exist in the quantities predicted
or estimated and that the reserves can be profitably produced in the future.
With respect to forward-looking information contained in this News Release,
assumptions have been made regarding, among other things: commodity prices for
petroleum and natural gas; the regulatory framework governing royalties, taxes
and environmental matters in the jurisdictions in which the Company conducts
and will conduct its business and the effects that such regulatory framework
will have on the Company, including on the Company’s financial condition and
results of operations; the Company’s financial and operational flexibility; the
Company’s financial sustainability, the Company’s ability to accelerate
development when prices recover; Athabasca’s cash-flow break-even commodity
price; geological and engineering estimates in respect of Athabasca’s reserves
and resources; the applicability of technologies for the recovery and
production of the Company’s reserves and resources; the Company’s ability to
demonstrate the quality of its asset base and to build large-scale projects;
future capital expenditures to be made by the Company; future sources of
funding for the Company’s capital programs; the Company’s future debt levels;
the Company’s ability to obtain equipment in a timely and cost-efficient
manner; the geography of the areas in which the Company is conducting
exploration and development activities; that Athabasca and its security holders
will obtain the anticipated benefits from the $US450 senior secured second lien
note and the $120 million credit facility and the Company’s ability to obtain
equipment in a timely and cost-efficient manner.

Actual results could differ materially from those anticipated in this
forward-looking information as a result of the risk factors set forth in the
Company’s Annual Information Form (“AIF”) dated March 9, 2017 that is or will
be available on SEDAR at www.sedar.com, including, but not limited to:
fluctuations in market prices for crude oil, natural gas and bitumen blend;
political and general economic, market and business conditions in Alberta,
Canada, the United States and globally; changes to royalty regimes,
environmental risks and hazards; alternatives to and changing demand for
petroleum products; the potential for management estimates and assumptions to
be inaccurate; dependence on Murphy as the Company’s joint venture participant
in the Company’s Duvernay and Montney assets; the dependence on Murphy as the
operator of the Company’s Duvernay assets; the substantial capital requirements
of Athabasca’s projects and the ability to obtain financing for Athabasca’s
capital requirements; operational and business interruption risks associated
with the Company’s facilities; failure by counterparties to make payments or
perform their operational or other obligations to Athabasca in compliance with
the terms of contractual arrangements between Athabasca and such
counterparties, and the possible consequences thereof; long term reliance on
third parties; aboriginal claims; failure to obtain regulatory approvals or
maintain compliance with regulatory requirements; failure to meet development
schedules and potential cost overruns; variations in foreign exchange and
interest rates; factors affecting potential profitability; risks related to
future acquisition and joint venture activities;
reliance on, competition for, loss of, and failure to attract key personnel;
uncertainties inherent in estimating quantities of reserves and resources;
changes to Athabasca’s status given the current stage of development;
litigation risk; risks and uncertainties inherent in SAGD and other bitumen
recovery processes; risks related to hydraulic fracturing, including those
related to induced seismicity; expiration of leases and permits; risks inherent
in Athabasca’s operations, including those related to exploration, development
and production of petroleum, natural gas and oil sands reserves and resources;
risks related to gathering and processing facilities and pipeline systems;
availability of drilling and related equipment and limitations on access to
Athabasca’s assets; increases in costs could make Athabasca’s projects
uneconomic; the effect of diluent and natural gas supply constraints and
increases in the costs thereof; environmental risks and hazards; failure to
accurately estimate abandonment and reclamation costs; reliance on third party
infrastructure; seasonality; hedging risks; risks associated with maintaining
systems of internal controls; insurance risks; claims made in respect of
Athabasca’s operations, properties or assets; competition for, among other
things, capital, export pipeline capacity and skilled personnel; the failure of
Athabasca or the holder of certain licenses, leases or permits to meet specific
requirements of such licenses, leases or permits; risks related to Athabasca’s
amended credit facilities and senior secured notes; and risks related to
Athabasca’s common shares.

Also included in this press release are estimates of Athabasca’s 2017 capital
expenditures, funds flow from operations, operating netbacks and operating
income levels, which are based on the various assumptions as to production
levels, commodity prices and currency exchange rates and other assumptions
disclosed in this news release. To the extent any such estimate constitutes a
financial outlook, it was approved by management and the Board of Directors of
Athabasca on May 3, 2017, and is included to provide readers with an
understanding of the funding of Athabasca’s capital expenditure program in 2017
and an outlook for the Company’s activities and results and readers are
cautioned that the information may not be appropriate for other purposes.
Management does not have firm commitments for all of the costs, expenditures,
prices or other financial assumptions used to prepare the financial outlook or
assurance that such operating results will be achieved and, accordingly, the
complete financial effects of all of those costs, expenditures, prices and
operating results are not objectively determinable. The actual results of
operations of the Company and the resulting financial results may vary from the
amounts set forth herein, and such variations may be material. The financial
outlook contained in this New Release was made as of the date of this press
release and the Company disclaims any intention or obligations to update or
revise such financial outlook, whether as a result of new information, future
events or otherwise, unless required pursuant to applicable law.

Oil and Gas Information

“BOEs” may be misleading, particularly if used in isolation. A BOE conversion
ratio of six thousand cubic feet of natural gas to one barrel of oil equivalent
(6 Mcf: 1 bbl) is based on an energy equivalency conversion method primarily
applicable at the burner tip and does not represent a value equivalency at the
wellhead. As the value ratio between natural gas and crude oil based on the
current prices of natural gas and crude oil is significantly different from the
energy equivalency of 6:1, utilizing a conversion on a 6:1 basis may be
misleading as an indication of value.

Initial Production Rates

The initial production rates provided in this News Release should be considered
to be preliminary. Initial production rates disclosed herein may not
necessarily be indicative of long term performance or of ultimate recovery.

Non-GAAP Financial Measures

The “Funds Flow from Operations”, “Light Oil Operating Income”, “Light Oil
Operating Netback”, “Thermal Oil Operating Income” and “Thermal Oil Operating
Netback” financial measures contained in this MD&A do not have standardized
meanings which are prescribed by IFRS and they are considered to be non-GAAP
measures. These measures may not be comparable to similar measures presented by
other issuers and should not be considered in isolation with measures that are
prepared in accordance with IFRS.

Funds Flow from Operations is not intended to represent cash flow from
operating activities, net earnings or other measures of financial performance
calculated in accordance with IFRS. The Funds Flow from Operations measure
allows management and others to evaluate the Company’s ability to fund its
capital programs and meet its ongoing financial obligations using cash flow
internally generated from ongoing operating related activities. Funds Flow from
Operations per share (basic and diluted) is calculated as Funds Flow from
Operations divided by the number of weighted average basic and diluted shares
outstanding.

The Light Oil Operating Income and Light Oil Operating Netback measures in this
MD&A are calculated by subtracting royalties and operating and transportation
expenses from petroleum and natural gas sales and midstream revenues received.
The Light Oil Operating Netback measure is presented on a per boe basis. The
Light Oil Operating Income and the Light Oil Operating Netback measures allow
management and others to evaluate the production results from the Company’s
Light Oil assets.

The Operating Income and Operating Netback measures in this MD&A with respect
to the Leismer Project and Hangingstone Project are calculated by subtracting
the cost of diluent blending, royalties, operating expenses and transportation
expenses from blended bitumen sales. The consolidated Thermal Oil Operating
Income and Operating Netback measures also include realized gains on commodity
risk management contracts. The Thermal Oil Operating Netback measure is
presented on a per bbl basis. The Thermal Oil Operating Income and the Thermal
Oil Operating Netback measures allow management and others to evaluate the
production results from the Company’s Thermal Oil assets.

The Net Debt measure is calculated by summing the face value of outstanding
term debt with current liabilities and subtracting current assets adjusted for
the capital carry receivable and risk management contracts. The Net Debt
measure is not intended to represent other measures of financial position on
the Company’s balance sheet that are calculated in accordance with IFRS. The
Net Debt financial measure allows management and others to evaluate the
Company’s funding position and utilization of debt within its capital
structure.

– END RELEASE – 03/05/2017

For further information:
Media and Financial Community
Matthew Taylor
Vice President, Capital Markets and Communications
1-403-817-9104
[email protected]

COMPANY:
FOR: ATHABASCA OIL CORPORATION
TSX SYMBOL: ATH

INDUSTRY: Energy and Utilities – Oil and Gas
RELEASE ID: 20170503CC0132

Press Release from Marketwired 1-866-736-3779

All press releases are written by the client and have NO affiliation with the news copy written by The Canadian Press. Any questions that arise due to the content or information provided in the press release should be directed to the company/organization
issuing the release, not to The Canadian Press.

GET ENERGYNOW’S DAILY EMAIL FOR FREE


Gratitude from Fort McMurray – The progress from Canada’s costliest natural disaster – The United Way Fire Recovery Fund

On the one year anniversary of the evacuation of Fort McMurray, we wanted to share the good news with you that our community is rebuilding and getting stronger every day thanks to your generosity.  In our time of need, friends like you from across Canada and around the world offered to help.  We will be … Read more

GET ENERGYNOW’S DAILY EMAIL FOR FREE


BOOTLEGGIN' BREAKFAST: SECOND HEADLINER ANNOUNCEMENT! Multi-Juno & CCMA Award Winner, ADAM GREGORY Joins GORD BAMFORD: The BOOTLEGGIN’ BREAKFAST – Calgary’s Premier Corporate VIP Experience: Tuesday, July 11th – Full Details and Tickets HERE (ALREADY OVER 60% SOLD OUT!)

SECOND HEADLINER ANNOUNCEMENT!  We are very proud to announce that Multi Juno & CCMA award winner, ADAM GREGORY will be performing at the Bootleggin’ Breakfast. Adam is releasing his new album this summer and Bootleggin’ will be his ONLY appearance during Stampede 2017! His hit songs include “Horseshoes”, “Crazy Days”, “The World Could Use A Cowboy” and so many … Read more

GET ENERGYNOW’S DAILY EMAIL FOR FREE


Xtreme Drilling Corp. Announces First Quarter 2017 Financial and Operating Results

FOR: XTREME DRILLING CORP.TSX SYMBOL: XDCDate issue: May 03, 2017Time in: 9:23 PM eAttention:
CALGARY, ALBERTA–(Marketwired – May 3, 2017) – Xtreme Drilling Corp.
(“Xtreme”, the “Company”) (TSX:XDC) announces its first quarter 2017 financial
and oper…

GET ENERGYNOW’S DAILY EMAIL FOR FREE


Groups sue to keep drilling ban in Arctic, Atlantic waters

ANCHORAGE, Alaska — Less than a week after President Donald Trump took steps to put U.S. Arctic and Atlantic waters back in play for offshore drilling, 10 environmental and Alaska Native groups sued Wednesday to maintain the ban on oil and gas exploration.

The ban was a key part of former President Barack Obama’s environmental legacy, aimed at protecting polar bears, walrus, ice seals and Native villages that depend on them from industrialization and oil spills. Waters of the Atlantic continental shelf also support whales, swordfish, bluefin tuna, sea turtles and businesses heavily dependent on the health of the ocean ecosystem, according to the lawsuit.

In an executive order Friday, Trump ordered Interior Secretary Ryan Zinke to review the withdrawal with the goal of expanded drilling.

The federal lawsuit filed in Anchorage claims Trump exceeded his constitutional authority and violated federal law. No president before Trump has tried to undo or reverse a permanent halt to drilling in outer continental shelf areas, said Kristen Monsell, an attorney for the Center for Biological Diversity.

“With one careless stroke of his pen, Trump ignored the law and put our oceans at new risk of a devastating oil spill,” Monsell said.

The White House did not immediately respond to an email request for comment on the lawsuit. Trump on Friday said the executive order started the process of opening offshore areas to job-creating energy exploration.

“It reverses the previous administration’s Arctic leasing ban and directs Secretary Zinke to allow responsible development of offshore areas that will bring revenue to our treasury and jobs to our workers,” he said.

The lawsuit claims Trump’s order violates the U.S. Constitution and the Outer Continental Shelf Lands Act.

Congress has the power to regulate federal land under the Constitution. Lawmakers have authorized the president to halt drilling in unleased lands of the outer continental shelf but did not allow him to reopen areas, according the lawsuit.

Likewise, the Outer Continental Shelf Lands Act itself does not authorize a president to cancel permanent bans, said Erik Grafe, an attorney for Earthjustice in Anchorage.

“It says nothing about the authority to undo those withdrawals,” Grafe said. “No president has reversed a withdrawal in the past except for ones that have express end dates. President Obama’s withdrawals were permanent.”

Obama halted oil and gas leasing in most of the U.S. waters in the Arctic and key parts of the Atlantic in response to strong national opposition, Monsell said.

“The Arctic Ocean is not a rational place to drill for oil,” Grafe said. “It’s far too risky.”

Dan Joling, The Associated Press

GET ENERGYNOW’S DAILY EMAIL FOR FREE


Perisson Petroleum Corp. Announces Application for Management Cease Trade Order

FOR: PERISSON PETROLEUM CORPORATIONTSX VENTURE SYMBOL: POGDate issue: May 03, 2017Time in: 7:27 PM eAttention:
CALGARY, ALBERTA–(Marketwired – May 3, 2017) – Perisson Petroleum Corp. (the
“Corporation”) (TSX VENTURE:POG) announces that it has made an…

GET ENERGYNOW’S DAILY EMAIL FOR FREE


Board says 2015 California refinery blast was preventable

TORRANCE, Calif. — A federal safety board says a 2015 explosion at a California oil refinery was preventable and it has recommended changes to the facility’s safety procedures.

The U.S. Chemical Safety and Hazard Investigation Board released a report Wednesday about the blast in Torrance.

It identifies technical issues that led to the explosion that slightly injured four workers and threatened to release toxic gas into nearby Los Angeles suburbs.

The board said safeguards designed to prevent an explosion failed and the plant needs to implement strategies for preventing a similar problem.

ExxonMobil — which owned the refinery at the time — said Wednesday it regrets the incident and will work with the board to understand the findings and recommendations

The Associated Press


GET ENERGYNOW’S DAILY EMAIL FOR FREE


Canacol Energy Ltd. Tests 28 MMSCFPD (4,912 BOEPD) from 7th Consecutive Gas Discovery at Canahuate 1

FOR: CANACOL ENERGY LTD.
TSX SYMBOL: CNE
BVC SYMBOL: CNEC
OTCQX SYMBOL: CNNEF

Date issue: May 03, 2017
Time in: 6:15 PM e

Attention:

CALGARY, ALBERTA–(Marketwired – May 3, 2017) – Canacol Energy Ltd. (“Canacol”
or the “Corporation”) (TSX:CNE)(OTCQX:CNNEF)(BVC:CNEC) is pleased to provide
the following update for the Canahuate 1 exploration well, the Corporations
seventh consecutive gas discovery in the Lower Magdalena Basin, and an update
of its remaining gas exploration wells for 2017.

/T/

Canahuate 1 Gas Discovery
Esperanza Exploration and Exploitation (“E&E”) Contract
Geoproduction Oil and Gas Company of Colombia, 100% Operated Working
Interest

/T/

The Canahuate 1 exploration well was spud on March 24, 2017 and reached a total
depth of 8,263 feet measured depth (“ft md”) in 13 days. The well encountered
124 ft md (86 feet true vertical depth) of net gas pay with average porosity of
18% within the primary Cienaga de Oro (“CDO”) reservoir target.

Two different zones were completed and flow tested within the CDO. The first
zone tested within the CDO was perforated between 5,067 to 5,872 ft md and
flowed at a final stabilized rate of 23 million standard cubic feet per day
(“MMscfpd”) of dry gas at a flowing tubing head pressure of 997 psi and 60/64
inch choke with no water over a 23 hour test period. The second zone tested was
perforated between 4,965 to 4,990 ft md and flowed at a final stabilized rate
of 5.4 MMscfpd of dry gas at a flowing tubing head pressure of 1,524 psi and
30/64 inch choke with 8 barrels of water over a 20 hour test period. Based upon
the salinity of the produced water management has concluded that it is brine
related to the drilling and completion of the well. Work is underway to tie the
Canahuate 1 well into the Corporation’s gas processing facility at Jobo
approximately 3 kilometers (“kms”) to the south.

/T/

Toronja 1 Gas Exploration Well
VIM 21 Exploration and Production (“E&P”) Contract
Geoproduction Oil and Gas Company of Colombia, 100% Operated Working
Interest

/T/

The Tuscany 12 drilling rig used to drill and complete Canahuate 1 is being
mobilized to drill the Toronja 1 exploration well located on the VIM21 E&P
contract approximately 6 kms to the southeast of Jobo. The objective of the
Toronja 1 exploration well are the shallow Porquero reservoir sandstones which
were recently proven as a new commercial play type by the Corporation with the
nearby Nelson 6 gas discovery late in 2016. The Toronja prospect displays a
well-developed seismic anomaly indicative of the presence of gas within the
Porquero sandstone reservoirs. The Corporation anticipates spudding the Toronja
1 well in early June, 2017, and it is expected that the well will be drilled
and tested four weeks after spud.

/T/

Pandereta 1 Gas Exploration Well
VIM 5 Exploration and Production Contract
CNE Oil and Gas S.A.S., 100% Operated Working Interest

/T/

Upon completion and testing of the Toronga 1 exploration well the Tuscany 12
rig will be mobilized to drill the Pandereta 1 exploration well located
approximately 10 kms to the east of the Clarinete and Oboe fields on the VIM 5
contract. The objective of the Pandereta 1 exploration well are proven
sandstones of the CDO reservoir. The Pandereta prospect displays a
well-developed seismic anomaly indicative of the presence of gas within the CDO
reservoir sandstones. The well will be spud in late October 2017 and is
expected to be drilled and tested five weeks after spud.

The Corporation shall provide updates on the exploration drilling program as
information becomes available.

Canacol is an exploration and production company with operations focused in
Colombia, Ecuador, and Mexico. The Corporation’s common stock trades on the
Toronto Stock Exchange, the OTCQX in the United States of America, and the
Colombia Stock Exchange under ticker symbol CNE, CNNEF, and CNE.C, respectively.

This press release contains certain forward-looking statements within the
meaning of applicable securities law. Forward-looking statements are frequently
characterized by words such as “plan”, “expect”, “project”, “intend”,
“believe”, “anticipate”, “estimate” and other similar words, or statements that
certain events or conditions “may” or “will” occur, including without
limitation statements relating to estimated production rates from the
Corporation’s properties and intended work programs and associated timelines.
Forward-looking statements are based on the opinions and estimates of
management at the date the statements are made and are subject to a variety of
risks and uncertainties and other factors that could cause actual events or
results to differ materially from those projected in the forward-looking
statements. The Corporation cannot assure that actual results will be
consistent with these forward looking statements. They are made as of the date
hereof and are subject to change and the Corporation assumes no obligation to
revise or update them to reflect new circumstances, except as required by law.
Prospective investors should not place undue reliance on forward looking
statements. These factors include the inherent risks involved in the
exploration for and development of crude oil and natural gas properties, the
uncertainties involved in interpreting drilling results and other geological
and geophysical data, fluctuating energy prices, the possibility of cost
overruns or unanticipated costs or delays and other uncertainties associated
with the oil and gas industry. Other risk factors could include risks
associated with negotiating with foreign governments as well as country risk
associated with conducting international activities, and other factors, many of
which are beyond the control of the Corporation.

This press release contains non-GAAP measures such as EBITDAX, funds from
operations, working capital, operating netback per barrel and realized
contractual gas sales that do not have any standardized meaning under IFRS and
may not be comparable to similar measures presented by other companies.
Management uses these non-GAAP measures for its own performance measurement and
to provide shareholders and investors with additional measurements of the
Corporation’s performance and financial results.

Realized contractual gas sales is defined as gas produced and sold plus gas
revenues received from nominated take or pay contracts.

Boe conversion – The term “boe” is used in this news release. Boe may be
misleading, particularly if used in isolation. A boe conversion ratio of cubic
feet of natural gas to barrels oil equivalent is based on an energy equivalency
conversion method primarily applicable at the burner tip and does not represent
a value equivalency at the wellhead. In this news release, we have expressed
boe using the Colombian conversion standard of 5.7 Mcf: 1 bbl required by the
Ministry of Mines and Energy of Colombia.

– END RELEASE – 03/05/2017

For further information:
Canacol Energy Ltd.
Investor Relations
214-235-4798
[email protected]
canacolenergy.com

COMPANY:
FOR: CANACOL ENERGY LTD.
TSX SYMBOL: CNE
BVC SYMBOL: CNEC
OTCQX SYMBOL: CNNEF

INDUSTRY: Energy and Utilities – Oil and Gas
RELEASE ID: 20170503CC0117

Press Release from Marketwired 1-866-736-3779

All press releases are written by the client and have NO affiliation with the news copy written by The Canadian Press. Any questions that arise due to the content or information provided in the press release should be directed to the company/organization
issuing the release, not to The Canadian Press.

GET ENERGYNOW’S DAILY EMAIL FOR FREE


Greenfields Petroleum Corporation Announces Non-Brokered Private Placement

FOR: GREENFIELDS PETROLEUM CORPORATIONTSX VENTURE SYMBOL: GNFDate issue: May 03, 2017Time in: 6:11 PM eAttention:
HOUSTON, TEXAS–(Marketwired – May 3, 2017) –
NOT FOR DISTRIBUTION TO U.S. NEWSWIRE SERVICES OR FOR DISSEMINATION IN THE
UNITED STATES
Gr…

GET ENERGYNOW’S DAILY EMAIL FOR FREE


ClearStream Announces First Quarter 2017 Financial Results

FOR: CLEARSTREAM ENERGY SERVICES INC.
TSX SYMBOL: CSM
TSX SYMBOL: CSM.DB.A

Date issue: May 03, 2017
Time in: 6:09 PM e

Attention:

CALGARY, ALBERTA–(Marketwired – May 3, 2017) – ClearStream Energy Services
Inc. (“ClearStream”) (TSX:CSM)(TSX:CSM.DB.A) today announced its results for
the three months ended March 31, 2017.

“EBITDAS” and “Adjusted EBITDAS” are not standard measures under IFRS. Please
refer to the “Non-standard measures” section of this release for a description
of these items and limitations of their use.

First Quarter 2017 Highlights

/T/

— Revenue for the first quarter of 2017 increased by $9.0 million or 13%

compared to the first quarter of 2016;
— Adjusted EBITDAS for the first quarter of 2017 increased significantly
by $1.6 million or 389% compared to the same period 2016;
— Fixed costs, which include indirect costs of sales and SG&A, were down
24% compared to the same period in 2016;
— Many of our customers deferred maintenance spending in 2016 in response
to very challenging market conditions, and with commodity price
improvements, our customers have shown a willingness to increase
critical maintenance spending in 2017;
— We began operations in Saskatchewan during the first quarter of 2017 and
added new customers in the fertilizer, utility, and oil and gas
industries;
— Turnaround demand is typically strong during the second quarter and this
is expected to be the case in 2017, which is expected to benefit second
quarter financial results.

/T/

Overview of Financial Results

/T/

—————————————————————————-
($ millions, except per share amounts) Q1 2017 Q1 2016
—————————————————————————-
Revenue 77.7 68.6
—————————————————————————-
Gross profit 6.5 5.3
—————————————————————————-
Selling, general & administrative expenses (4.5) (5.0)
—————————————————————————-
Loss from continuing operations (3.6) (16.1)
—————————————————————————-
EBITDAS 3.8 (7.4)
—————————————————————————-
Adjusted EBITDAS 2.1 0.4
—————————————————————————-
Loss per share from continuing operations, basic and
diluted (0.03) (0.15)
—————————————————————————-

/T/

Revenues for the three months ended March 31, 2017 were $77.7 million compared
to $68.6 million for the same period in 2016, an increase of 13%. Demand for
ClearStream’s services increased for both reportable segments due largely to
higher oil and gas prices and increased revenue from new customers.

Gross profit for the three months ended March 31, 2017 was $6.5 million
compared to $5.3 million for the same period in 2016 and gross margins were
8.4% compared to 7.7% for the same period in 2016. Gross margins improved on a
year-over-year basis as cost cutting initiatives executed in 2016 led to
reductions in fixed indirect costs.

Selling, general and administrative costs for the three months ended March 31,
2017 were $4.5 million compared to $5.0 in 2016. The 9% decrease reflects cost
cutting initiatives that were implemented in 2016.

The loss from continuing operations for the first quarter of 2016 included $8.7
million in goodwill impairment losses. The first quarter of 2017 did not
include such losses.

Segment Review

MAINTENANCE AND CONSTRUCTION SERVICES

/T/

—————————————————————————-
($ millions, except per share amounts) Q1 2017 Q1 2016
—————————————————————————-
Revenue 59.2 54.7
—————————————————————————-
Gross profit 2.4 3.0
—————————————————————————-
Selling, general & administrative expenses (0.3) (0.5)
—————————————————————————-
Income from continuing operations 3.4 1.8
—————————————————————————-

/T/

Revenues for the Maintenance and Construction Services segment were $59.2
million for the three months ended March 31, 2017 compared to $54.6 million in
the prior year quarter, an increase of 8%. The majority of ClearStream’s
maintenance and construction customers operate in the oil and gas sector. The
increase in oil and gas prices led to higher demand for our maintenance and
construction services during the first quarter compared to the same period in
2016. A new contract award in Saskatchewan with a fertilizer company also
contributed to the year-over-year increase.

Gross profit was $2.4 million for the three months ended March 31, 2017
compared with $3.0 million for the same period in the prior year. Gross profit
margin for the period was 4.1% compared to 5.5% a year ago. Gross profit
margins decreased as lower pricing for our services more than offset the impact
of reductions to indirect costs. Indirect costs are more fixed in nature and
have declined due to cost cutting initiatives that were implemented throughout
2016.

Selling, General and Administrative costs for the Maintenance and Construction
segment decreased by $0.2 million or 29% due to cost cutting initiatives that
were implemented throughout 2016 in response to a decline in market conditions.

Income from continuing operations includes a $1.9 million gain on the sale of
property, plant and equipment that relates largely to the sale of two
non-essential properties that occurred during the first quarter of 2017.

WEAR, FABRICATION, AND TRANSPORATION SERVICES

/T/

—————————————————————————-
($ millions, except per share amounts) Q1 2017 Q1 2016
—————————————————————————-
Revenue 18.9 14.7
—————————————————————————-
Gross profit 4.1 2.3
—————————————————————————-
Selling, general & administrative expenses (0.2) (0.2)
—————————————————————————-
Income from continuing operations 3.2 1.2
—————————————————————————-

/T/

Revenues for the Fabrication, Wear Technology and Transportation segment were
$18.9 million for the three months ended March 31, 2017 compared to $14.7
million in the prior year quarter, an increase of 29%. The majority of the
customers within this segment are linked to the Alberta oilsands and, given
improvements to oil prices and a resulting increase in customer activity,
demand from these customers increased during the first quarter of 2017.

Gross profit was $4.1 million for the three months ended March 31, 2017
compared with $2.3 million during the same period of the prior year. Gross
profit margin for the period was 21.7% compared to 15.8% a year ago. Gross
profit margins for the segment increased due to cost cutting reductions that
were implemented in 2016 that led to lower indirect costs. Lower indirect costs
were partially offset by an increase in direct costs as a percentage of sales
caused by pricing reductions. Pricing reductions were deemed necessary to
protect ClearStream’s market share.

Selling, General and Administrative costs for the Maintenance and Construction
segment decreased by 6% due to cost cutting initiatives that were implemented
throughout 2016 in response to a decline in market conditions.

CORPORATE

/T/

—————————————————————————-
($ millions, except per share amounts) Q1 2017 Q1 2016
—————————————————————————-
Selling, general & administrative expenses 4.0 4.3
—————————————————————————-

/T/

Corporate Selling, General and Administrative expenses were $4.0 for the period
ended March 31, 2017 compared to $4.3 for the same period in the prior year.
The 6% decrease in Corporate SG&A is primarily due to reductions in staffing
levels offset partially by higher professional and legal costs largely related
to finalizing the head office transition from Toronto to Calgary.

Outlook

Modest improvements to oil and gas prices led to stronger industry conditions
during the first quarter of 2017. ClearStream expects this trend to continue
with increased maintenance and turnaround demand expected in the second quarter
of 2017 compared to the same period in 2016. Our customers deferred a
significant amount of maintenance spending throughout 2016 given the weak
market conditions combined with the impact of the Fort McMurray fires. As a
result, spending on critical maintenance and turnaround programs is expected to
increase with the improvements in oil and gas prices and overall market
conditions. In addition, turnaround demand is typically strong during the
second quarter and this is expected to be the case in 2017, which is expected
to benefit second quarter financial results.

Although maintenance and turnaround demand is expected to improve in 2017,
customer project activity is not expected to increase significantly compared to
2016. New infrastructure projects within the western Canadian oil and gas
industry are not expected to increase until a substantial increase in commodity
prices occurs.

Given the uncertainty of commodity prices and the competitiveness of the
oilfield service industry, ClearStream management will continue to focus on
cost control, customer retention, process and efficiency improvements, and
diversification of our business into new geographies and markets outside of oil
and gas.

About ClearStream Energy Services Inc.

ClearStream is a fully integrated provider of upstream, midstream and refinery
production services, which includes facility maintenance and turnarounds,
pipeline wear technology, facilities construction, welding and fabrication, and
transportation to the energy and other industries in Western Canada. For more
information about ClearStream, please visit www.ClearStreamEnergy.ca.

Forward-looking information

This report contains certain forward-looking information. Certain information
included in this report may constitute forward-looking information within the
meaning of securities laws. In some cases, forward-looking information can be
identified by terminology such as “may”, “will”, “should”, “expect”, “plan”,
“anticipate”, “believe”, “estimate”, “predict”, “potential”, “continue” or the
negative of these terms or other similar expressions concerning matters that
are not historical facts. Forward-looking information may relate to
management’s future outlook and anticipated events or results and may include
statements or information regarding the future plans or prospects of
ClearStream and reflects management’s expectations and assumptions regarding
the growth, results of operations, performance and business prospects and
opportunities of ClearStream. Without limitation, information regarding the
future operating results and economic performance of ClearStream constitute
forward-looking information. Such forward-looking information reflects
management’s current beliefs and is based on information currently available to
management of ClearStream.
Forward-looking information involves significant risks and uncertainties. A
number of factors could cause actual events or results to differ materially
from the events and results discussed in the forward-looking information
including risks related to investments, conditions of capital markets, economic
conditions, commodity prices, dependence on key personnel, limited customer
bases, interest rates, regulatory change, ability to meet working capital
requirements and capital expenditures needs of the Company, factors relating to
the weather and availability of labour. These factors should not be considered
exhaustive. In addition, in evaluating this information, investors should
specifically consider various factors, including the risks outlined under “Risk
Factors,” in the company’s 2016 Annual Information Form dated March 6, 2017,
which may cause actual events or results to differ materially from any
forward-looking statement. In formulating forward-looking information herein,
management has assumed that business and economic conditions affecting
ClearStream will continue substantially in the ordinary course, including
without limitation with respect to general levels of economic activity,
regulations, taxes and interest rates. Although the forward-looking information
is based on what management of ClearStream considers to be reasonable
assumptions based on information currently available to it, there can be no
assurance that actual events or results will be consistent with this
forward-looking information, and management’s assumptions may prove to be
incorrect. This forward-looking information is made as of the date of this
report, and ClearStream does not assume any obligation to update or revise it
to reflect new events or circumstances except as required by law. Undue
reliance should not be placed on forward-looking information. ClearStream is
providing the forward-looking financial information set out in this report for
the purpose of providing investors with some context for the outlook presented.
Readers are cautioned that this information may not be appropriate for any
other purpose.

Non-standard measures

The terms “EBITDAS” and “Adjusted EBITDAS” (collectively the “Non-standard
measures”) are financial measures used in this report that are not standard
measures under IFRS. ClearStream’s method of calculating Non-standard measures
may differ from the methods used by other issuers. Therefore, ClearStream’s
Non-standard measures, as presented may not be comparable to similar measures
presented by other issuers.

EBITDAS refers to net earnings determined in accordance with IFRS, before
depreciation and amortization, interest expense, income tax expense (recovery)
and stock based compensation. EBITDAS is used by management and the directors
of ClearStream (the “Directors”) as well as many investors to determine the
ability of an issuer to generate cash from operations. Management also uses
EBITDAS to monitor the performance of ClearStream’s reportable segments and
believes that in addition to net income or loss and cash provided by operating
activities, EBITDAS is a useful supplemental measure from which to determine
ClearStream’s ability to generate cash available for debt service, working
capital, capital expenditures and income taxes. ClearStream has provided a
reconciliation of income (loss) from continuing operations to EBITDAS in its
consolidated financial statements and MD&A.

Adjusted EBITDAS refers to EBITDAS excluding income from equity investments,
the gain on sale of assets held for sale, impairment of goodwill and intangible
assets, restructuring costs, and gain on sale of property plant and equipment.
ClearStream has used Adjusted EBITDAS as the basis for the analysis of its past
operating financial performance. Adjusted EBITDAS is used by ClearStream and
management believes it is a useful supplemental measure from which to determine
ClearStream’s ability to generate cash available for debt service, working
capital, capital expenditures, and income taxes. Adjusted EBITDAS is a measure
that management believes facilitates the comparability of the results of
historical periods and the analysis of its operating financial performance
which may be useful to investors. ClearStream has provided a reconciliation of
income (loss) from continuing operations to Adjusted EBITDAS in its MD&A.

Investors are cautioned that the Non-standard Measures are not alternatives to
measures under IFRS and should not, on their own, be construed as an indicator
of performance or cash flows, a measure of liquidity or as a measure of actual
return on the shares. These Non-standard measures should only be used with
reference to ClearStream’s Interim Financial Statements and Annual Financial
Statements available on SEDAR at www.sedar.com or www.clearstreamenergy.ca.

/T/

CLEARSTREAM ENERGY SERVICES INC.
Consolidated Balance Sheets
(In thousands of Canadian dollars)
—————————————————————————-

March 31, December 31,
As at 2017 2016
—————————————————————————-
—————————————————————————-

Cash $ 1,980 $ 11,503
Restricted cash 980 980
Accounts receivable 54,154 46,928
Inventories 3,808 3,000
Prepaid expenses and other 2,573 2,060
Earn-out assets (note 3) 2,566 1,608
—————————————————————————-
Total current assets 66,061 66,079

Property, plant and equipment, net (note 4) 24,302 24,745
Goodwill and intangible assets 37,274 38,088
Earn-out assets (note 3) 3,380 4,056
Long-term investments 616 579
Deferred financing costs (note 5) 1,151 1,295

—————————————————————————-
Total assets $ 132,784 $ 134,842
—————————————————————————-
—————————————————————————-

Accounts payable and accrued liabilities $ 27,027 $ 26,848
Deferred revenue 158 167
Current portion of obligations under finance
leases 3,410 3,902
Provision (note 9) 4,985 4,985
—————————————————————————-
Total current liabilities 35,580 35,902

ABL facility (note 5) 5,750 3,500
Obligations under finance leases 2,529 2,915
Senior secured debentures (note 5) 171,712 171,642
Convertible secured debentures (note 5) 24,514 24,397
—————————————————————————-
Total liabilities 240,085 238,356

Shareholders’ deficit (107,301) (103,514)

—————————————————————————-
Total liabilities and shareholders’ deficit $ 132,784 $ 134,842
—————————————————————————-
—————————————————————————-

/T/

Note references are to the Company’s interim financial statements for the three
months ending March 31, 2017, which are available on SEDAR at www.sedar.com.

/T/

CLEARSTREAM ENERGY SERVICES INC.
Consolidated Statements of Loss and Comprehensive Loss
(In thousands of Canadian dollars, except per share amounts)
—————————————————————————-

March 31, March 31,
Three months ended 2017 2016
—————————————————————————-

—————————————————————————-
—————————————————————————-
Revenue $ 77,689 $ 68,640
Cost of revenue (71,149) (63,324)
—————————————————————————-
Gross profit 6,540 5,316

Selling, general and administrative expenses (note 6) (4,528) (4,952)
Stock based compensation (note 8) (309) –
Amortization of intangible assets (863) (901)
Depreciation (note 4) (1,231) (1,548)
Income (loss) from equity investment 37 (235)
Interest expense (5,032) (6,241)
Gain on sale of assets held for sale 123 1,114
Restructuring costs (277) –
Impairment of goodwill and intangible assets – (8,700)
Gain on sale of property, plant and equipment 1,917 55

—————————————————————————-
Loss from continuing operations (3,623) (16,092)
—————————————————————————-

Loss from discontinued operations (net of income
taxes) (note 2) (370) (4,725)

—————————————————————————-
Net loss and comprehensive loss $ (3,993) $ (20,817)
—————————————————————————-
—————————————————————————-

Loss per share (note 7)
Basic & diluted:

Continuing operations $ (0.03) $ (0.15)
Discontinued operations $ (0.00) $ (0.04)
Net loss $ (0.04) $ (0.19)
—————————————————————————-
—————————————————————————-

/T/

Note references are to the Company’s interim financial statements for the three
months ending March 31, 2017, which are available on SEDAR at www.sedar.com.

/T/

CLEARSTREAM ENERGY SERVICES INC.
Consolidated Statements of Cash Flows
(In thousands of Canadian dollars)
—————————————————————————-

March 31, March 31,
Three months ended 2017 2016
—————————————————————————-
—————————————————————————-

Operating activities:

Net loss for the period $ (3,993) $ (20,817)
Loss from discontinued operations (net of income
tax) 370 4,725
Items not affecting cash:
Stock based compensation (note 8) 206 –
Amortization of intangible assets 863 901
Depreciation (note 4) 1,231 1,548
(Income) loss from equity investments (37) 235
Accretion expense 187 1,917
Amortization of deferred financing costs 144 –
Impairment of goodwill and intangible assets – 8,700
Gain on sale of assets held for sale (123) (1,114)
Gain on sale of property, plant and equipment (1,917) (55)
Changes in non-cash working capital (8,260) 17,000
Advances to discontinued operations – (4,680)
Cash used in discontinued operations – (237)
—————————————————————————-
Total cash (used in) provided by operating activities $ (11,329) $ 8,123
—————————————————————————-
—————————————————————————-
Investing activities:
Purchase of property, plant and equipment (note 4) (1,322) (493)
Net proceeds on disposal of property, plant and
equipment (note 4) 2,578 263
Purchase of intangible assets (49) (25)
Proceeds on the disposition of businesses (note 2) – 8,000
Changes in non-cash working capital (646) –
—————————————————————————-
Total cash provided by investing activities $ 561 $ 7,745
—————————————————————————-
Financing activities:
Decrease in restricted cash – 3,400
Proceeds from the issuance of the senior secured
debentures – 176,228
Proceeds from the issuance of the convertible
secured debentures – 35,000
Repayment of the senior credit facility – (58,735)
Repayment of the 8.00% secured debentures – (176,228)
Refinancing fees (ABL facility, senior and
convertible secured debentures) – (9,925)
Advance on ABL facility 2,250 –
Repayment of obligations under finance leases (1,005) (1,290)
—————————————————————————-
—————————————————————————-
Total cash provided by (used in) financing activities $ 1,245 $ (31,550)
—————————————————————————-
(Decrease) increase in cash (9,523) (15,682)
Cash, beginning of the period 11,503 24,409
—————————————————————————-
Cash, end of period $ 1,980 $ 8,727
—————————————————————————-
—————————————————————————-

Supplemental cash flow information:

Interest paid 9,101 4,212
Supplemental disclosure of non-cash financing and
investing activities:
Acquisition of property, plant and equipment through
finance leases 39 161
—————————————————————————-

/T/

Note references are to the Company’s interim financial statements for the three
months ending March 31, 2017, which are available on SEDAR at www.sedar.com.

/T/

CLEARSTREAM ENERGY SERVICES INC.
Segmented Information
(In thousands of Canadian dollars)
—————————————————————————-

Wear,
Three months ended Maintenance and Fabrication and
March 31, 2017 Construction Transportation Corporate
—————————————————————————-

—————————————————————————-
Revenues 59,208 18,896 –
Cost of revenues (56,770) (14,794) –
—————————————————————————-
Gross profit 2,438 4,102 –

Selling, general
and administrative
expenses (335) (183) (4,010)
Stock based
compensation – – (309)
Amortization of
intangible assets (47) (73) (743)
Depreciation (563) (587) (81)
Income from equity
investment 37 – –
Interest expense (50) (56) (4,926)
Gain from assets
held for sale – – 123
Restructuring costs – – (277)
Gain on sale of
property, plant
and equipment 1,916 1 –
—————————————————————————-
Income (loss) from
continuing
operations 3,396 3,204 (10,223)
—————————————————————————-

———————————————————
Three months ended
March 31, 2017 Eliminations Total
———————————————————

———————————————————
Revenues (415) 77,689
Cost of revenues 415 (71,149)
———————————————————
Gross profit – 6,540

Selling, general
and administrative
expenses – (4,528)
Stock based
compensation – (309)
Amortization of
intangible assets – (863)
Depreciation – (1,231)
Income from equity
investment – 37
Interest expense – (5,032)
Gain from assets
held for sale – 123
Restructuring costs – (277)
Gain on sale of
property, plant
and equipment – 1,917
———————————————————
Income (loss) from
continuing
operations – (3,623)
———————————————————

—————————————————————————-

Wear,
Three months ended Maintenance and Fabrication and
March 31, 2016 Construction Transportation Corporate
—————————————————————————-
—————————————————————————-

—————————————————————————-
—————————————————————————-
Revenues 54,651 14,670 –
Cost of revenues (51,659) (12,346) –
—————————————————————————-
Gross profit 2,992 2,324 –

Selling, general
and administrative
expenses (475) (195) (4,282)
Amortization of
intangible assets (46) (83) (772)
Depreciation (694) (709) (145)
Income from equity
investment 56 – (291)
Interest expense (94) (109) (6,038)
Gain from assets
held for sale – – 1,114
Impairment of
goodwill – – (8,700)
Gain (loss) on sale
of property, plant
and equipment 52 5 (2)
—————————————————————————-
Income (loss) from
continuing
operations 1,791 1,233 (19,116)
—————————————————————————-

———————————————————
Three months ended
March 31, 2016 Eliminations Total
———————————————————
———————————————————

———————————————————
———————————————————
Revenues (681) 68,640
Cost of revenues 681 (63,324)
———————————————————
Gross profit – 5,316

Selling, general
and administrative
expenses – (4,952)
Amortization of
intangible assets – (901)
Depreciation – (1,548)
Income from equity
investment – (235)
Interest expense – (6,241)
Gain from assets
held for sale – 1,114
Impairment of
goodwill – (8,700)
Gain (loss) on sale
of property, plant
and equipment – 55
———————————————————
Income (loss) from
continuing
operations – (16,092)
———————————————————

/T/

– END RELEASE – 03/05/2017

For further information:
ClearStream Energy Services Inc.
Gary Summach
Chief Financial Officer
587-318-1003
[email protected]
OR
ClearStream Energy Services Inc.
John W. Cooper
President and Chief Executive Officer
587-318-1001
[email protected]
www.ClearStreamEnergy.ca

COMPANY:
FOR: CLEARSTREAM ENERGY SERVICES INC.
TSX SYMBOL: CSM
TSX SYMBOL: CSM.DB.A

INDUSTRY: Energy and Utilities – Equipment, Energy and Utilities –
Oil and Gas
RELEASE ID: 20170503CC0114

Press Release from Marketwired 1-866-736-3779

All press releases are written by the client and have NO affiliation with the news copy written by The Canadian Press. Any questions that arise due to the content or information provided in the press release should be directed to the company/organization
issuing the release, not to The Canadian Press.

GET ENERGYNOW’S DAILY EMAIL FOR FREE


Trican Well Service Ltd. Reports First Quarter Results for 2017

FOR: TRICAN WELL SERVICE LTD.
TSX SYMBOL: TCW

Date issue: May 03, 2017
Time in: 6:00 PM e

Attention:

CALGARY, ALBERTA–(Marketwired – May 3, 2017) – Trican Well Service (TSX:TCW)
(“Trican” or the “Company”) is pleased to announce its First Quarter 2017
results. The following press release should be read in conjunction with the
Management’s Discussion and Analysis, the unaudited interim consolidated
financial statements and related notes of Trican for the quarter ended March
31, 2017, as well as the Annual Information Form for the year ended December
31, 2016. All of the above documents are available on Trican’s website at
www.tricanwellservice.com and on SEDAR at www.sedar.com.

Continuing Operations – Financial Review

/T/

————————————
Three months ended

($ millions, except per share amounts; Mar. 31, Mar. 31, Dec. 31,
unaudited) 2017 2016 2016
————————————————————————–
Revenue $ 149.4 $ 99.8 $ 114.8
Gross profit / (loss) 17.8 (31.3) (10.1)
Operating income / (loss) (1) 22.7 (26.4) (7.4)
Adjusted operating income / (loss) (1) 26.0 (16.2) 1.1
Net income / (loss) (48.9) (42.5) 56.9
Per share – basic and diluted $ (0.25) $ (0.29) $ 0.29
————————————————————————–

/T/

Notes:

(1) Trican makes reference to operating income / (loss), adjusted operating
income / (loss), and adjusted general and administrative expenses. These
measures are not recognized under International Financial Reporting Standards
(IFRS) and are considered non-GAAP measures. Management believes that, in
addition to gross profit / (loss) and net income / (loss), operating income /
(loss), adjusted operating income / (loss); and adjusted general and
administrative expenses are useful supplemental measures.

/T/

— Operating income / (loss) provides investors with an indication of

profit / (loss) before depreciation and amortization, foreign exchange
gains and losses, asset impairments, other (income) / loss, finance
costs and income tax expense / (recovery).
— Adjusted operating income / (loss) provides investors with an indication
of operating income before equity-settled share-based compensation,
amortization of debt costs, severance costs and excludes items that are
significant but not in the normal course of operations. It provides
investors with an indication of comparable operating income / (loss)
between periods.
— Adjusted general and administrative expenses provide investors with an
indication of total overhead costs before equity-settled share-based
compensation, amortization of debt costs and severance costs.

/T/

Investors should be cautioned that operating income / (loss) and adjusted
operating income / (loss) should not be construed as alternatives to gross
profit / (loss) or profit / (loss) determined in accordance with IFRS as an
indicator of Trican’s performance. Trican’s method of calculating operating
income / (loss), adjusted operating income / (loss) and adjusted general and
administrative expenses may differ from that of other companies and accordingly
may not be comparable to measures used by other companies. See also “Non-GAAP
Disclosure” section of this report.

Revenue increased 50% compared to Q1 2016 and the adjusted operating margin
improved to 17.4% due to an increase in activity, improved pricing and larger
job sizes combined with control over our costs as activity increased.
Fracturing intensity increased significantly as the Company pumped
approximately 64% more proppant this quarter compared to the same period last
year and 28% more than Q4 2016. Q1 2017 represented the highest volume of
proppant pumped during a quarter since Q3 2014.

Utilization of our active equipment was high throughout the first quarter as
weather conditions remained favorable through to the end of the quarter and
demand remained strong. Our headcount increased as we expanded our fracturing
capacity by 30,000 horsepower and our cementing capacity by six crews since the
fourth quarter. Hiring qualified personnel to activate parked equipment
continues to be the most significant challenge to meeting customer demand.

Strong demand led to increased pricing during the first quarter of 2017, as
average fracturing pricing for our customers increased by approximately 14%
from Q4 2016 levels, and 20% from Q3 2016.

Our first quarter results represent a significant improvement from recent
years. This could not have been achieved without the hard work and dedication
of our staff whether in the field, the lab, or the office. It has been an
extremely challenging period in the oilfield services space and we want to
thank all of our employees for their commitment and perseverance during the
past couple of years.

OUTLOOK

There was a pronounced undersupply of manned equipment in the industry in the
first quarter, which resulted in many customers not completing their work
programs in the first quarter and pushing their programs into the second
quarter. This backlog of work, combined with planned Q2 programs for some of
our anchor clients, will result in second quarter activity levels considerably
higher on a year-over-year basis for fracturing and coiled tubing. The
incremental revenue from the increased workload is expected to cover a
meaningful portion of our fixed cost structure which should allow us to improve
our second quarter financial results and maintain our headcount in anticipation
of activity picking up coming out of spring break-up.

Management’s current expectations are that activity and pricing will continue
building from first quarter levels after spring break-up as many work programs
have been, or are being, repriced for the third and fourth quarters of 2017.
Although pricing improved in the quarter, our average pricing improvement was
reduced by legacy agreements with long term clients that were below leading
edge pricing in the industry. As these agreements roll over, we anticipate a
continued improvement in pricing through the second half of the year.
Approximately 80% of our pricing agreements are negotiated quarterly and we are
currently in discussions with most of our clients regarding second half work
programs and pricing. Pricing improvements will be required to cover cost
increases in our business as well as return our business to sustainable
profitability levels. If demand remains high, we anticipate that we will see
inflationary pressures when we exit spring break-up, particularly on our
proppant and chemicals. In addition, we anticipate wage inflation in the second
half of the year.

With the current commodity price environment, we believe that demand is
sufficient that two more fracturing crews can be added in the third quarter,
with the possibility for a third crew to be activated during the fourth quarter
of 2017 which would represent the activation of approximately 50% of our
currently parked fracturing equipment. If activity levels remain high and
sufficient personnel are recruited, we could potentially have our entire
fracturing fleet activated in the next twelve months. We expect that these
activations would secure work on the leading edge of pricing and would have an
accretive impact on operating margins.

Hiring remains a significant challenge, and we have continued hiring and
training during spring break-up to meet our equipment activation targets for
the third and fourth quarters. We are early in the hiring process, but are
optimistic that we will meet our hiring targets. Hiring efforts are ongoing at
all bases from Estevan to Fort St. John, and for all service lines.

On March 21, 2017, Trican and Canyon Services Group Inc. announced that they
had entered into an arrangement agreement pursuant to which Trican agreed to
acquire all of the issued and outstanding common shares of Canyon. The
transaction is subject to customary approvals, including approval from the
shareholders of each of Trican and Canyon, as well as regulatory approval from
the Competition Bureau. On April 10, 2017, Trican and Canyon made their
respective filings to the Competition Bureau of Canada. If the Competition
Bureau does not issue a supplementary information request in respect of the
transaction, the Bureau will work towards clearing the transaction by the end
of its non-binding service standard period on May 25, 2017. Shareholder votes
will be held on May 31st.

We are excited by our acquisition of Canyon and believe that the combined
company will achieve significant cost and operational synergies, provide
greater service to our customers, offer numerous opportunities for Trican and
Canyon employees, and generate competitive margins. Our companies share a
similar culture, and we look forward to welcoming Canyon employees to the
Trican family.

NON-GAAP DISCLOSURE

Please see the discussion in the non-GAAP Disclosure section of the MD&A for
the reconciliation of non-GAAP items to IFRS measures.

FORWARD-LOOKING STATEMENTS

Certain statements contained in this document constitute forward-looking
information and statements (collectively “forward-looking statements”). These
statements relate to future events or our future performance. All statements
other than statements of historical fact may be forward-looking statements.
Forward-looking statements are often, but not always, identified by the use of
words such as “anticipate”, “achieve”, “estimate”, “expect”, “intend”, “plan”,
“planned”, and other similar terms and phrases. These statements involve known
and unknown risks, uncertainties and other factors that may cause actual
results or events to differ materially from those anticipated in such
forward-looking statements. We believe the expectations reflected in these
forward-looking statements are reasonable but no assurance can be given that
these expectations will prove to be correct and such forward-looking statements
included in this document should not be unduly relied upon. These statements
speak only as of the date of this document.

In particular, this document contains forward-looking statements pertaining to,
but not limited to, the following:

/T/

— the Company’s ability to maintain a strong market position and secure

work;
— anticipated industry activity levels and overall supply and demand in
jurisdictions and service lines where the Company operates, as well as
customer work programs and equipment utilization levels;
— anticipated adjustments to our active equipment fleet, related
adjustments to cost structure, and the ability to control our fixed cost
structure;
— expectations regarding workforce recruitment and retention;
— expectations regarding the Company’s cost structure;
— expectations regarding the Company’s financial results, working capital
levels, liquidity and profits;
— expectations regarding stages per well and quantity of proppant pumped
per well;
— expectations regarding pricing of the Company’s services;
— expectations regarding the completion and timing of the closing of the
Canyon Transaction;
— anticipated benefits and synergies of the Canyon Transaction and risks
associated with completing the Transaction; and
— expectations surrounding weather and seasonal slowdowns.

/T/

Our actual results could differ materially from those anticipated in these
forward-looking statements as a result of the risk factors set forth below and
in the “Risk Factors” section of our Annual Information Form dated March 29,
2017:

/T/

— volatility in market prices for oil and natural gas;
— liabilities inherent in oil and natural gas operations;
— competition from other suppliers of oil and gas services;
— competition for skilled personnel;
— the satisfaction of conditions, including regulatory approvals, to

closing the Canyon Transaction including in a timely manner;
— changes in income tax laws or changes in other laws and incentive
programs relating to the oil and gas industry; and
— changes in political, business, military and economic conditions in key
regions of the world.

/T/

Readers are cautioned that the foregoing lists of factors are not exhaustive.
Forward-looking statements are based on a number of factors and assumptions
which have been used to develop such statements and information but which may
prove to be incorrect. Although management of Trican believes that the
expectations reflected in such forward-looking statements or information are
reasonable, undue reliance should not be placed on forward-looking statements
because Trican can give no assurance that such expectations will prove to be
correct. In addition to other factors and assumptions which may be identified
in this document, assumptions have been made regarding, among other things:
crude oil and natural gas prices; the impact of increasing competition; the
general stability of the economic and political environment; the timely receipt
of any required regulatory approvals; Trican’s, Canyon’s and the combined
company’s ability to continue its operations for the foreseeable future and to
realize its assets and discharge its liabilities and commitments in the normal
course of business; industry activity levels; Trican’s policies with respect to
acquisitions; the ability of Trican to obtain qualified staff, equipment and
services in a timely and cost efficient manner; the ability to operate our
business in a safe, efficient and effective manner; the ability of Trican to
obtain capital resources and adequate sources of liquidity; the performance and
characteristics of various business segments; the regulatory framework; the
timing and effect of pipeline, storage and facility construction and expansion;
and future commodity, currency, exchange and interest rates.

The forward-looking statements contained in this document are expressly
qualified by this cautionary statement. We do not undertake any obligation to
publicly update or revise any forward-looking statements except as required by
applicable law.

Additional information regarding Trican including Trican’s most recent Annual
Information Form is available under Trican’s profile on SEDAR (www.sedar.com).

CONFERENCE CALL AND WEBCAST DETAILS

The Company will host a conference call on Thursday, May 4, 2017 at 9:00 a.m.
MT (11:00 a.m. ET) to discuss the Company’s results for the 2017 First Quarter.

To listen to the webcast of the conference call, please enter:
http://edge.media-server.com/m/p/yf32yhja in your web browser or visit the
Investors section of our website at www.tricanwellservice.com/investors and
click on “Reports”.

To participate in the Q&A session, please call the conference call operator at
1-844-358-9180 (North America) or 478-219-0187 (outside North America) 15
minutes prior to the call’s start time and ask for the “Trican Well Service
Ltd. First Quarter 2017 Earnings Results Conference Call”.

The conference call will be archived on Trican’s website at
www.tricanwellservice.com/investors

Headquartered in Calgary, Alberta, Trican provides a comprehensive array of
specialized products, equipment and services that are used during the
exploration and development of oil and gas reserves.

– END RELEASE – 03/05/2017

For further information:
Trican Well Service Ltd.
Dale Dusterhoft
Chief Executive Officer
(403) 266-0202
(403) 237-7716 (FAX)
[email protected]
OR
Trican Well Service Ltd.
Michael Baldwin
Senior Vice President, Finance & CFO
(403) 266-0202
(403) 237-7716 (FAX)
[email protected]
OR
2900, 645 – 7th Avenue S.W.
Calgary, Alberta T2P 4G8
www.tricanwellservice.com

COMPANY:
FOR: TRICAN WELL SERVICE LTD.
TSX SYMBOL: TCW

INDUSTRY: Energy and Utilities – Equipment, Energy and Utilities –
Oil and Gas
RELEASE ID: 20170503CC0112

Press Release from Marketwired 1-866-736-3779

All press releases are written by the client and have NO affiliation with the news copy written by The Canadian Press. Any questions that arise due to the content or information provided in the press release should be directed to the company/organization
issuing the release, not to The Canadian Press.

GET ENERGYNOW’S DAILY EMAIL FOR FREE


PHX Energy Announces its First Quarter Results, Reporting Increased Revenue and Activity Levels – Part 1

FOR: PHX ENERGY SERVICES CORP.
TSX SYMBOL: PHX

Date issue: May 03, 2017
Time in: 5:54 PM e

Attention:

CALGARY, ALBERTA–(Marketwired – May 3, 2017) –

Financial Results

For the three-month period ended March 31, 2017, PHX Energy (TSX:PHX) generated
consolidated revenue of $61.1 million. This is a positive contrast from the
challenging 2016-year, representing a 51 percent improvement over the $40.4
million generated in the first quarter of 2016 and 31 percent improvement from
the $46.6 million generated in the fourth quarter of 2016. The increase in
consolidated revenue was primarily the result of greater activity levels in all
the Corporation’s operating segments. Consolidated operating days rose by 64
percent to 6,684 days in the first quarter of 2017 versus 4,069 days in the
comparable 2016-quarter and rose 32 percent over the 5,074 days in the final
quarter of the 2016-year.

For the three-month period ended March 31, 2017, adjusted EBITDA (see “Non-GAAP
Measures”) was $4.3 million (7 percent of revenue), a 5 percent increase from
the $4.1 million (10 percent of revenue) reported in the comparable
2016-period. Included in adjusted EBITDA for the first quarter of 2017 is
Stream Services’ (“Stream”) adjusted EBITDA of negative $0.2 million (2016 –
negative $0.4 million).

In the first quarter of 2017, PHX Energy reported a net loss of $7.1 million
compared to a net loss of $7.4 million in the comparable 2016-period. The
Corporation’s continued net losses are mainly due to ongoing pricing pressures
lowering day rates in each of the Corporation’s operating segments, fewer
occurrences of gains on disposition of drilling equipment and lower recoveries
of income taxes.

As at March 31, 2017, PHX Energy had long-term debt of $12.0 million, which is
$17.0 million less than at December 31, 2016, and working capital (see
“Non-GAAP Measures”) of $58.9 million.

Equity Financing

On February 2, 2017, PHX Energy closed a bought deal financing for aggregate
proceeds of $28.8 million. An aggregate of 7,187,500 common shares of the
Corporation were issued at a price of $4.00 per common share. Concurrent with
the closing of the public offering, certain directors, officers, employees and
consultants of PHX Energy purchased a total of 500,000 common shares at a price
of $4.00 per share on a private placement basis. The gross proceeds from the
public offering and concurrent private placement totaled to approximately $30.8
million.

The proceeds from the equity financing were primarily used to reduce the
outstanding loans and borrowings under the Corporation’s credit facility from
$35.0 million as at December 31, 2016 to $14.0 million as at March 31, 2017.

Capital Spending

The Corporation incurred $1.8 million in capital expenditures in the first
quarter of 2017, which is double the $0.9 million spent in the comparable
2016-period. With the proceeds from the equity financing, the Corporation
reduced its outstanding indebtedness under its credit facility, thereby freeing
up borrowing capacity that may be redrawn, as required, to fund the
Corporation’s ongoing capital expenditure program. The Corporation continues to
anticipate spending $25.0 million on capital expenditures in the 2017-year.

As at March 31, 2017, the Corporation had commitments to purchase drilling and
other equipment for $14.4 million; including $11.4 million for Velocity
Real-Time Systems (“Velocity”), $2.3 million for electronic drilling recorder
(“EDR”) equipment and $0.7 million for motors and machinery and equipment. This
additional equipment is expected to be delivered by the end of the third
quarter of 2017.

(Stated in thousands of dollars except per share amounts, percentages and
shares outstanding)

/T/

Three-month periods ended March 31,
2017 2016 % Change
—————————————————————————-
—————————————————————————-
Operating Results (unaudited) (unaudited)
Revenue 61,122 40,449 51
Net loss (7,143) (7,404) (4)
Loss per share – diluted (0.13) (0.18) (28)
Adjusted EBITDA (1) 4,333 4,115 5
Adjusted EBITDA per share – diluted
(1) 0.08 0.10 (20)
Adjusted EBITDA as a percentage of
revenue (1) 7% 10%
—————————————————————————-
Cash Flow
Cash flows from (used in) operating
activities (9,896) 758 n.m.
Funds from operations (1) 3,983 3,584 11
Funds from operations per share –
diluted (1) 0.07 0.09 (22)
Dividends paid – 416 (100)
Dividends per share (2) – 0.01 (100)
Capital expenditures 1,799 857 n.m.
—————————————————————————-

—————————————————————————-

Mar. 31,
Financial Position (unaudited) ’17 Dec 31, ’16
Working capital (1) 58,866 44,230 33
Long-term debt 11,995 29,014 (59)
Shareholders’ equity 201,967 178,387 13
Common shares outstanding 58,589,887 50,810,721 15
—————————————————————————-
—————————————————————————-
(1) Refer to non-GAAP measures section that follows the Outlook section
(2) Dividends paid by the Corporation on a per share basis in the period.
n.m. – not meaningful

/T/

Non-GAAP Measures

PHX Energy uses certain performance measures throughout this press release that
are not recognizable under Canadian generally accepted accounting principles
(“GAAP”). These performance measures include adjusted earnings before interest,
taxes, depreciation and amortization (“EBITDA”), adjusted EBITDA per share,
funds from operations, funds from operations per share, debt to covenant EBITDA
ratio and working capital. Management believes that these measures provide
supplemental financial information that is useful in the evaluation of the
Corporation’s operations and are commonly used by other oil and natural gas
service companies. Investors should be cautioned, however, that these measures
should not be construed as alternatives to measures determined in accordance
with GAAP as an indicator of PHX Energy’s performance. The Corporation’s method
of calculating these measures may differ from that of other organizations, and
accordingly, these may not be comparable. Please refer to the non-GAAP measures
section following the Outlook section for applicable definitions and
reconciliations.

Cautionary Statement Regarding Forward-Looking Information and Statements

This document contains certain forward-looking information and statements
within the meaning of applicable securities laws. The use of “expect”,
“anticipate”, “continue”, “estimate”, “objective”, “ongoing”, “may”, “will”,
“project”, “could”, “should”, “can”, “believe”, “plans”, “intends”, “strategy”
and similar expressions are intended to identify forward-looking information or
statements.

The forward-looking information and statements included in this document are
not guarantees of future performance and should not be unduly relied upon.
These statements and information involve known and unknown risks, uncertainties
and other factors that may cause actual results or events to differ materially
from those anticipated in such forward-looking statements and information. The
Corporation believes the expectations reflected in such forward-looking
statements and information are reasonable, but no assurance can be given that
these expectations will prove to be correct. Such forward-looking statements
and information included in this document should not be unduly relied upon.
These forward-looking statements and information speak only as of the date of
this document.

In particular, forward-looking information and statements contained in this
document include, without limitation, the delivery of capital expenditure
items, the projected capital expenditures budget and how this budget will be
funded, how R&D projects will enhance and expand PHX Energy’s services, and
projections related to Russia’s future activity levels in Eastern Siberia.

The above are stated under the headings: “Capital Spending”, “Operating Cost
and Expenses”, “Segmented Information” and “Capital Resources”. Furthermore all
statements in the Outlook section of this document contains forward-looking
statements.

In addition to other material factors, expectations and assumptions which may
be identified in this document and other continuous disclosure documents of the
Corporation referenced herein, assumptions have been made in respect of such
forward-looking statements and information regarding, among other things: the
Corporation will continue to conduct its operations in a manner consistent with
past operations; the general continuance of current industry conditions;
anticipated financial performance, business prospects, impact of competition,
strategies, the general stability of the economic and political environment in
which the Corporation operates; exchange and interest rates; the continuance of
existing (and in certain circumstances, the implementation of proposed) tax,
royalty and regulatory regimes; the sufficiency of budgeted capital
expenditures in carrying out planned activities; the availability and cost of
labour and services and the adequacy of cash flow; debt and ability to obtain
financing on acceptable terms to fund its planned expenditures, which are
subject to change based on commodity prices; market conditions and future oil
and natural gas prices; and potential timing delays. Although Management
considers these material factors, expectations and assumptions to be reasonable
based on information currently available to it, no assurance can be given that
they will prove to be correct.

Readers are cautioned that the foregoing lists of factors are not exhaustive.
Additional information on these and other factors that could affect the
Corporation’s operations and financial results are included in reports on file
with the Canadian Securities Regulatory Authorities and may be accessed through
the SEDAR website (www.sedar.com) or at the Corporation’s website. The
forward-looking statements and information contained in this document are
expressly qualified by this cautionary statement. The Corporation does not
undertake any obligation to publicly update or revise any forward-looking
statements or information, whether as a result of new information, future
events or otherwise, except as may be required by applicable securities laws.

Revenue

(Stated in thousands of dollars)

/T/

Three-month periods ended March 31,
2017 2016 % Change
—————————————————————————-
—————————————————————————-
Revenue 61,122 40,449 51
—————————————————————————-
—————————————————————————-

/T/

For the three-month period ended March 31, 2017, consolidated revenue showed a
strong improvement, increasing 51 percent to $61.1 million from $40.4 million
in the comparable 2016-period. In the three-month period ended March 31, 2017,
the Corporation achieved its highest quarterly drilling activity, as measured
by operating days, since the first quarter of 2015. There were 6,684
consolidated operating days in the first quarter of 2017, which is 64 percent
greater than the 4,069 days recorded in the first quarter of 2016. While the
Corporation benefited from increased drilling activity, competition remained
aggressive and day rates were lower relative to the comparable 2016-period.
Average consolidated day rates for the three-month period ended March 31, 2017,
excluding the motor rental division in the US and the Stream division, fell by
9 percent to $8,824 from $9,669 in the first quarter of 2016.

As a percentage of total consolidated revenue, US and international revenues
were 44 and 8 percent, respectively, for the 2017-quarter as compared to 54 and
8 percent in 2016-quarter.

The industry continues to show signs of recovery in 2017, and rig counts across
North America climbed upward as commodity prices remained relatively stable.
The Canadian market improved considerably, with the average rig count being 71
percent greater than in the first quarter of 2016, while the US rig count
rallied by 36 percent over the same period. Throughout North America the vast
majority of wells continued to be horizontal and directional representing 94
percent of all wells drilled in Canada and 91 percent of the average number of
rigs operating per day in the US (Sources: Daily Oil Bulletin and Baker Hughes).

Operating Costs and Expenses

(Stated in thousands of dollars except percentages)

/T/

Three-month periods ended March 31,
2017 2016 % Change
—————————————————————————-
—————————————————————————-
Direct costs 60,805 46,011 32
Gross profit (loss) as a percentage
of revenue 1% (14%)
Depreciation & amortization
(included in direct costs) 10,931 14,003 (22)
Gross profit as percentage of
revenue excluding depreciation &
amortization 18% 21%
—————————————————————————-
—————————————————————————-

/T/

Direct costs are comprised of field and shop expenses, and include depreciation
and amortization on the Corporation’s equipment. In the first quarter of 2017,
direct costs rose by 32 percent to $60.8 million from $46.0 million in the
comparable 2016-period. The Corporation’s gross profit as a percentage of
revenue was 1 percent in the first quarter of 2017 compared to a gross loss
percentage of 14 percent in the 2016-quarter. The change in direct costs and
the improved gross profit as a percentage of revenue was primarily the result
of the Corporation’s increased operating days, albeit at lower day rates and
lower depreciation and amortization.

The reduction in depreciation and amortization expenses in the three-month
period ended March 31, 2017 was mainly the result of PHX Energy’s lower level
of capital spending in the 2016-year. Excluding depreciation and amortization,
gross profit as a percentage of revenue fell slightly to 18 percent for the
three-month period ended March 31, 2017 from 21 percent in the comparable
2016-period. The lower margin in the current year’s quarter is primarily the
result of declining client day rates, increased field and shop labor rates that
were put in place to retain key and experienced personnel as industry activity
increased and labour markets tightened, increased equipment repair costs and
greater third party rental costs.

(Stated in thousands of dollars except percentages)

/T/

Three-month periods ended March 31,
2017 2016 % Change
—————————————————————————-
—————————————————————————-
Selling, general & administrative
(“SG&A”) costs 7,210 6,679 8
Equity-settled share-based payments
(included in SG&A costs) 488 286 71
Cash-settled share-based payments
(recoveries) (included in SG&A
costs) 132 (149) n.m.
Onerous contracts lease payment (107) – (100)
SG&A costs excluding equity and cash-
settled share-based payments and
provision for onerous contracts as a
percentage of revenue 11% 16%
—————————————————————————-
—————————————————————————-
n.m. – not meaningful

/T/

GET ENERGYNOW’S DAILY EMAIL FOR FREE


PHX Energy Announces its First Quarter Results, Reporting Increased Revenue and Activity Levels – Part 2

The Corporation incurred $7.2 million of SG&A costs for the three-month period
ended March 31, 2017 as compared to $6.7 million in the 2016-period. Included
in SG&A costs for the 2017-period were equity-settled and cash-settled
share-based payments of $0.5 million (2016 – $0.3 million) and $0.1 million
(2016 – $0.1 million recovery), respectively. Additionally, for the 2017
three-month period, SG&A costs were reduced by $0.1 million for actual lease
payments made under the Corporation’s onerous office lease contracts that were
reclassified to reduce the provision for onerous contracts (2016 – nil).
Excluding the share-based payment amounts and provision for onerous contracts,
SG&A costs as a percentage of consolidated revenue were 11 percent in the
2017-quarter compared to 16 percent in the 2016-quarter.

For the three-month period ended March 31, 2017, SG&A costs were higher than
the comparable period primarily due to the increase in activity and issuance of
equity and cash-settled awards in March 2017. The Corporation remains focused
on maintaining cost control initiatives to reduce SG&A costs across all regions
and ensuring its cost structure is aligned with activity levels.

Equity-settled share-based payments relate to the amortization of the fair
values of issued options of the Corporation using the Black-Scholes model. In
the three-month period ended March 31, 2017, equity-settled share-based
payments increased by 71 percent, as compared to the corresponding 2016-period,
generally due to compensation expenses related to options granted in March 2017.

Cash-settled share-based retention awards, which are included in SG&A costs,
are measured at fair value, and in the 2017-quarter, the related compensation
expense recognized by PHX Energy was $0.1 million as compared to a recovery of
$0.1 million in the 2016-quarter. The increased compensation expense is
primarily due to the normal vesting of previously granted retention awards and
issuance of new retention awards in March 2017 offset by the reduction in PHX
Energy’s share price from $4.22 as at December 31, 2016 to $3.66 as at March
31, 2017.

(Stated in thousands of dollars)

/T/

Three-month periods ended March 31,
2017 2016 % Change
—————————————————————————-
—————————————————————————-
Research & development expense 607 525 16
—————————————————————————-
—————————————————————————-

/T/

Research and development (“R&D”) expenditures charged to net earnings during
the three-month period ended March 31, 2017 and 2016 were $0.6 million and $0.5
million, respectively. The increase in R&D expenditures in the 2017-quarter is
mainly attributable to increased personnel in the R&D department who continue
to focus on new technology development and cost-saving and reliability
initiatives that will enhance and expand PHX Energy’s services.

(Stated in thousands of dollars)

/T/

Three-month periods ended March 31,
2017 2016 % Change
—————————————————————————-
—————————————————————————-
Finance expense 585 571 2
—————————————————————————-
—————————————————————————-

/T/

Finance expenses relate to interest charges on the Corporation’s long-term and
short-term bank facilities. Finance charges of $0.6 million in the first
quarter of 2017 were consistent with those in the comparable 2016-period.
Although there was a lower amount of borrowings outstanding during the
2017-quarter, the Corporation incurred additional financing charges from the
amendment of the credit facility in the fourth quarter of 2016. In addition, as
a result of the amendment, the applicable pricing on borrowings was fixed at
higher rates compared to the 2016-period.

(Stated in thousands of dollars)

/T/

Three-month periods
ended March 31,
2017 2016
—————————————————————————-
—————————————————————————-
Gain on disposition of drilling equipment (147) (1,205)
Foreign exchange losses (gains) 172 (351)
Provision for bad debts 228 30
—————————————————————————-
Other expense (income) 253 (1,526)
—————————————————————————-
—————————————————————————-

/T/

For the three-month period ended March 31, 2017, other expense was comprised of
a provision for bad debts of $0.2 million, foreign exchange losses of $0.2
million and a gain on disposition of drilling equipment of $0.1 million. During
the period ended March 31, 2017, the Corporation recognized foreign exchange
losses of $0.2 million (2016 – gain of $0.4 million), mainly from the
settlement of Canadian-denominated intercompany payables in the Corporation’s
Russia operations. Provisions for the bad debt in the 2017-quarter relate
mainly to US accounts receivable.

Gains from the disposition of drilling equipment typically result from
insurance programs undertaken whereby proceeds for the lost equipment are at
current replacement values, which are higher than the respective equipment’s
book value. Losses typically result from any asset retirements that were made
before the end of the equipment’s useful life and self-insured downhole
equipment losses. In the 2017-period, the decrease in the gain on disposition
of drilling equipment resulted mainly from fewer occurrences of insured
downhole equipment losses and increased asset retirements.

(Stated in thousands of dollars, except percentages)

/T/

Three-month periods
ended March 31,
2017 2016
—————————————————————————-
—————————————————————————-
Provision for (Recovery of) income taxes (1,195) (4,407)
Effective tax rates 14% 37%
—————————————————————————-
—————————————————————————-

/T/

The recovery of income taxes for the three-month period ended March 31, 2017
was $1.2 million as compared to $4.4 million in the 2016-quarter. The expected
combined Canadian federal and provincial tax rate for 2017 is 27 percent (2016
– 27 percent). The effective tax rate in the 2017-period was lower than the
expected rate mainly as a result of the effect of tax rates in foreign
jurisdictions.

Segmented Information

The Corporation reports three operating segments on a geographical basis
throughout the Canadian provinces of Alberta, Saskatchewan, British Columbia,
and Manitoba; throughout the Gulf Coast, Northeast and Rocky Mountain regions
of the US; and internationally, in Russia and Albania.

Canada

(Stated in thousands of dollars)

/T/

Three-month periods ended March 31,
2017 2016 % Change
—————————————————————————-
—————————————————————————-
Revenue 29,442 15,620 88
Reportable segment loss before tax (2,395) (3,262) (27)
—————————————————————————-
—————————————————————————-

/T/

PHX Energy’s Canadian revenue for the three-month period ended March 31, 2017
increased by 88 percent to $29.4 million from $15.6 million in the
corresponding 2016-period. The improvement was primarily the result of a
significantly higher volume of activity during the 2017-quarter versus the
comparable 2016-period. The Canadian segment reported 4,004 operating days in
the first quarter of 2017, a large increase from the 1,951 days in the
2016-period. Similarly, total industry horizontal and directional drilling
activity, as measured by drilling days, increased by 98 percent in the
2017-quarter to 22,186 days from 11,192 days in the 2016-quarter (Source: Daily
Oil Bulletin). The Canadian market remained highly competitive even with the
increased rig counts, and as such, market pricing did not adjust with the
rebound in activity. PHX Energy’s average day rates declined by 11 percent to
$7,009 in the 2017-quarter from $7,870 in the comparable 2016-period (excluding
Stream revenue of $1.4 million).

With a higher volume of active rigs operating in 2017, the Canadian division
continued to be a prominent player in this market, maintaining its 25 percent
market share and a well-diversified client base. During the 2017-quarter, 63
percent of the Canadian division’s activity was oil well drilling and 37
percent was natural gas well drilling. PHX Energy was active in the Montney,
Wilrich, Bakken, Shaunavon, Duvernay, Cardium and Viking areas.

The Canadian operations’ reportable segment loss before tax for the first
quarter of 2017 was $2.4 million as compared to losses of $3.3 million in the
2016-quarter. The improved profitability of the Canadian segment in the
2017-quarter was primarily the result of higher activity levels as compared to
prior year’s quarter offset by lower intercompany revenue generated from the
lease of drilling and other equipment between the Canadian and US segments.

Stream Services

Included in the Canadian segment’s revenue for the first quarter of 2017 is
$1.4 million of revenue generated by the Stream division (2016 – $0.3 million).
With the commercialization of a new product line and significant expansion of
Stream’s capacity in late-2016, this division achieved its highest quarterly
activity in the 2017-quarter since the fourth quarter of 2014. During the
three-month period ended March 31, 2017, Stream achieved 1,739 operating days,
strong growth over the 385 days in the respective 2016-period. Along with
increased volume, average day rates for the division also rose by 16 percent to
$794 in the first quarter of 2017 from $687 in the 2016 three-month period.

For the three-month period ended March 31, 2017, the Stream division incurred
reportable losses before tax of $0.5 million (2016 – $1.7 million). The Stream
division’s losses in the 2017-period pertain mostly to depreciation expenses of
$0.6 million as well as to costs associated with the expansion of the division.

United States

(Stated in thousands of dollars)

/T/

Three-month periods ended March 31,
2017 2016 % Change
—————————————————————————-
—————————————————————————-
Revenue 26,815 21,739 23
Reportable segment loss before tax (3,007) (7,783) (61)
—————————————————————————-
—————————————————————————-

/T/

In the first quarter of 2017, PHX Energy’s US operations generated revenue of
$26.8 million, an increase of 23 percent from $21.7 million in the
2016-quarter. This revenue growth was mainly the result of the higher industry
rig count. In the first quarter of 2017, the number of horizontal and
directional rigs running per day rose by 40 percent from an average of 487
horizontal and directional rigs running per day during the 2016-quarter to 681
in the 2017-quarter (Source: Baker Hughes). In comparison, the Corporation’s US
activity levels also rebounded as operating days increased by 27 percent to
1,990 days in the 2017-quarter from 1,564 days in the 2016-quarter. Average day
rates, excluding the motor rental division in Midland, Texas and the Rocky
Mountain region, slightly decreased from $13,361 in the 2016-quarter compared
to $13,094 in the 2017-period.

Horizontal and directional drilling represented 91 percent of the industry’s
average number of rigs running on a daily basis during the first quarter of
2017, which was 3 percent greater than the percentage in the 2016-quarter. For
the three-month period ended March 31, 2017, 93 percent of the US operating
division’s activity was oil well drilling, as measured by wells drilled and
excluding the motor rental and gyro surveying divisions. During the first
quarter of 2017, Phoenix USA remained active in the Permian, Eagle Ford,
Bakken, Mississippian/Woodford, Marcellus, Niobrara and Utica basins.

Reportable segment loss before tax for the three-month period ended March 31,
2017 was $3.0 million compared to losses of $7.8 million in the 2016-quarter.
The reduction to the segment losses in 2017 was largely the result of improved
activity levels, stabilization of average day rates and lower rates charged on
the intercompany lease of drilling and other equipment between the Canadian and
US segments.

International

(Stated in thousands of dollars, except percentages)

/T/

Three-month periods ended March 31,
2017 2016 % Change
—————————————————————————-
—————————————————————————-
Revenue 4,865 3,090 57
Reportable segment loss before tax (605) (692) (13)
—————————————————————————-
—————————————————————————-

/T/

For the three-month period ended March 31, 2017, the Corporation’s
international revenue increased by 57 percent to $4.9 million from the $3.1
million generated in the 2016-period. International operating days grew by 25
percent to 691 days in the 2017-quarter from 554 days in the 2016-quarter. The
increase in international activity primarily resulted from the Albanian
division recording 145 operating days in the 2017-quarter, whereas this
division was idle for the first quarter of 2016. In both the 2016 and
2017-quarters, the Corporation generated 8 percent of its consolidated revenue
from its international operations.

PHX Energy’s Russian operations continued to benefit from its diversified
client base during the first quarter of 2017. For the three-month period ended
March 31, 2017, the Russian division achieved operating days of 546, slightly
below the 554 days recorded in the 2016-period. During the quarter, the
division continued to increase activity related to measurement while drilling
(“MWD”) system rentals in Eastern Siberia and this trend is expected to
continue in the second quarter of 2017. The Corporation further continued
efforts to expand its client base in Russia performing technical qualification
trials for prospective clients.

Reportable segment loss from international operations for the three-month
period March 31, 2017 was $0.6 million, which is $0.1 million less than the
loss of $0.7 million reported in the comparable 2016-period. The improvement in
the international operations’ profitability in the 2017-quarter was mainly due
to the recommencement of the Albanian operations.

Investing Activities

PHX Energy used net cash in investing activities of $2.4 million for the
three-month period ended March 31, 2017 as compared to net cash generated of
$1.4 million in the 2016-period. In the first quarter of 2017, the Corporation
received proceeds of $1.4 million (2016 – $2.6 million) from the disposition of
capital equipment, primarily related to the involuntary disposal of drilling
equipment in well bores, and the recognition of a $0.1 million gain on
disposition of drilling equipment (2016 – $1.2 million). Additionally, the
Corporation spent $1.8 million on capital expenditures in the first quarter of
2017 (2016 – $0.9 million). These expenditures included:

/T/

— $0.8 million in MWD systems and spare components
— $0.5 million in computer hardware;
— $0.4 million in EDR systems and spare components; and
— $0.1 million in downhole performance drilling motors, machinery and

equipment and furniture and fixtures.

/T/

The capital expenditure program undertaken in the period was financed generally
from loans and borrowings.

During the three-month period ended March 31, 2017, the Corporation acquired
intangible assets with a total cost of $0.5 million (2016 – $0.2 million), most
of which related to development costs.

GET ENERGYNOW’S DAILY EMAIL FOR FREE


PHX Energy Announces its First Quarter Results, Reporting Increased Revenue and Activity Levels – Part 3

The change in non-cash working capital balances of $1.5 million use of cash for
the three-month period ended March 31, 2017, relates to the net change in the
Corporation’s trade payables that are associated with the acquisition of
capital assets. This…

GET ENERGYNOW’S DAILY EMAIL FOR FREE


BlackPearl Announces First Quarter 2017 Financial and Operating Results

FOR: BLACKPEARL RESOURCES INC.
TSX SYMBOL: PXX
OMX SYMBOL: PXXS

Date issue: May 03, 2017
Time in: 5:00 PM e

Attention:

CALGARY, ALBERTA–(Marketwired – May 3, 2017) – BlackPearl Resources Inc.
(“BlackPearl” or the “Company”) (TSX:PXX)(OMX:PXXS) is pleased to announce its
financial and operating results for the three months ended March 31, 2017.

Highlights include:

/T/

— The Board of Directors sanctioned the expansion of our successful Onion

Lake thermal project in Saskatchewan and construction began on the
second 6,000 barrel per day phase of the project. Target date for
completion of construction and first steam is mid-2018. Peak production
rates are expected 9 to 12 months thereafter.
— Production averaged 10,753 barrels of oil equivalent (boe) per day, a
17% increase compared to Q1 2016 volumes. The increase is attributable
to the production ramp-up on the Onion Lake thermal project, which
produced 6,182 bbls/d in Q1 2017. Additionally, during the first quarter
we re-started a portion of the alkali surfactant polymer (ASP) flood at
Mooney.
— Oil and natural gas revenues increased 186% in the first quarter of 2017
to $37.2 million from $13.0 million in the same period in 2016.
— Net income in Q1 2017 was $7.8 million compared to a loss of $9.3
million in Q1 2016. Funds flow from operations increased to $12.9
million from $3.3 million in 2016.
— The Company maintained its strong financial position with no debt at the
end of the quarter and positive working capital of $3.6 million.
— The Blackrod SAGD pilot continues to provide very positive results; over
the last 24 months the pilot has produced an average of 550 bbls/d with
a steam oil ratio under 3.

/T/

John Festival, President of BlackPearl commented, “We are well underway with
construction of phase two of our thermal project at Onion Lake. Equipment
modules are over 50% complete and we expect to start field assembly and
drilling in the summer. Our success with the first phase of the Onion Lake
thermal project has shown that these long-life, lower cost thermal projects in
Saskatchewan provide some of the best economics in industry even in a lower
commodity price environment. This success has allowed us to grow our production
and lower our cost structure and we expect this will continue with our
expansion of thermal development at Onion Lake.”

Financial and Operating Highlights

/T/

—————————————————————————-

Three months ended
March 31
2017 2016
—————————————————————————-

Daily sales volumes

Oil (bbl/d) 10,105 8,422
Bitumen (bbl/d) (1) 542 584
——————————
Combined 10,647 9,026
Natural gas (mcf/d) 638 845
——————————
Combined (boe/d) (2) 10,753 9,166
——————————

Product pricing ($)

Crude oil – per bbl 40.75 16.77
Natural gas – per mcf 2.50 1.77
——————————
Combined – per boe 40.48 16.67

Operating netback ($/boe)

Sales 40.48 16.67
Realized gains on risk management contracts 0.37 7.84
——————————
Subtotal 40.85 24.51
Royalties 5.90 1.72
Transportation costs 2.67 2.68
Operating costs 15.00 12.35
——————————
Netback (5) 17.28 7.76
——————————

($000’s, except per share and boe amounts)
Revenue

Oil and gas revenue – gross 37,204 13,021

Net income (loss) for the period 7,814 (9,322)
Per share, basic and diluted 0.02 (0.03)

Funds flow from operations(3) 12,924 3,278
Cash flow from operating activities (4) 14,786 3,787

Capital expenditures 13,356 2,077

Working capital deficiency (surplus), end of
period (3,576) (9,155)
Long term debt – 86,000
——————————
Net debt (6) (3,576) 76,845

Shares outstanding, end of period 336,195,568 335,638,226

(1) Includes production from the Blackrod SAGD pilot. All sales and expenses
from the Blackrod SAGD pilot are being recorded as an adjustment to the
capitalized costs of the project until the technical feasibility and
commercial viability of the project is established.
(2) Boe amounts are based on a conversion ratio of 6 mcf of gas to 1 barrel
of oil. Boe’s may be misleading, particularly if used in isolation. A boe
conversion ratio of 6 mcf: 1 barrel is based on an energy equivalency
conversion method primarily applicable at the burner tip and does not
represent a value equivalency at the wellhead.
(3) Funds flow from operations is a non-GAAP measure that represents cash
flow from operating activities before decommissioning costs incurred and
changes in non-cash working capital related to operations. Funds flow from
operations does not have a standardized meaning prescribed by Canadian GAAP
and therefore may not be comparable to similar measures used by other
companies.
(4) Cash flow from operating activities is a GAAP measure and has a
standardized meaning prescribed by Canadian GAAP.
(5) Netback is a non-GAAP measure that does not have a standardized meaning
prescribed by Canadian GAAP and therefore may not be comparable to similar
measures used by other companies.
(6) Net debt is a non-GAAP measure that does not have a standardized meaning
prescribed by Canadian GAAP and therefore may not be comparable to similar
measures used by other companies.

/T/

Operations Review

Onion Lake
During the first quarter we commenced construction of the 6,000 bbl/d expansion
of our thermal project. Similar to the first phase, we entered into a fixed sum
contract for all of the major equipment modules for the central processing
facilities and pad facilities. The fixed sum contract represents approximately
40% of the anticipated total costs of the expansion. These equipment modules
are being built in a fabrication shop near Calgary and will be transferred to
site when completed. Field construction and assembly of the equipment modules
is expected to commence in the third quarter. In addition, during the first
quarter we drilled water source wells which will be used to supply water for
steam generation for the project and we began site preparation for the central
processing facilities.

The thermal expansion at Onion Lake will utilize a combination of a modified
SAGD process (using existing and new vertical wells as steam injectors and
horizontal producers), which was used for phase one and the more traditional
SAGD process (two horizontal wells drilled approximately 5 metres apart). The
advantage of using vertical injectors is that it utilizes existing wellbores
and provides us with the flexibility to steam upper hole zones at a later date.
Initially, we are planning to drill 14 horizontal producer wells, three
horizontal steam injector wells and 20 vertical injector/observation wells.
Drilling these wells represent about 200 days of drilling time and is expected
to commence in the summer.

The Company’s target for initial steam injection for the second phase is
mid-2018. Peak oil production rates are expected 12 months after commencement
of steam injection, which is similar to what we experienced for the first phase
of thermal development. Capital costs for the second phase of this thermal
project are estimated to be between $180 and $185 million, which is
approximately 20% lower than the construction costs for the first phase.

We are continuing to see excellent production results from the first phase of
the Onion Lake thermal project. During the first quarter of 2017 oil production
averaged nearly 6,200 bbl/d with a steam oil ratio (SOR) of 2.5. Cumulatively,
the thermal project has produced in excess of three million barrels of oil. Oil
production will be impacted during the second quarter as a result of a facility
turnaround and inspection in May. In addition, during the drilling of the wells
for the second phase of the project we will have to limit steam injection in
nearby phase one wells which will also temporarily impact oil production
volumes.

Blackrod
At Blackrod, we did not undertake any new activities during the first quarter
of 2017; however, our existing SAGD pilot is continuing to perform
exceptionally well. During Q1 2017, production from the pilot averaged 542
bbl/d. Over the last two years the pilot has produced an average of 550 bbl/d
with an SOR under 3. Cumulatively, the SAGD well pair has produced over 525,000
barrels of oil. We are planning to continue to operate the pilot as we are
still acquiring valuable technical and operational data that will be helpful
designing a commercial project for the area.

We have commercial development approval for an 80,000 bbl/d project on our
Blackrod lands. At current commodity prices, expansion of our Onion Lake
project is economically more attractive than our other projects; however, our
Blackrod lands contain significant amounts of oil and we are confident that as
oil prices improve development of Blackrod will provide excellent long term
value to our shareholders.

Mooney
At Mooney, as a result of the improvement in oil prices late last year and
early in 2017 and changes to our operating procedures we decided to re-initiate
the ASP (Alkalie, Surfactant, Polymer) flood over a portion of the phase one
ASP flood lands. Operating costs tend to be higher for an ASP flood due to the
cost of chemicals for injection and we had temporarily shut-in the ASP flood in
early 2016 due to low commodity prices. During the quarter we restarted ASP
injection in 20 horizontal wells. Production from the Mooney area increased in
the first quarter as a result of the start-up of the flood; however, it is
expected to take several months to see the full impact of the flood on Mooney
production volumes. In total, we have 34 wells on production in the Mooney
area.

Production
Oil and gas production averaged 10,753 barrels of oil equivalent per day in the
first quarter of 2017, a 17% increase compared with the first quarter of 2016.
The increase reflects the successful ramp-up of production from our Onion Lake
thermal project.

Production in our non-thermal areas increased in the first quarter of 2017
compared to the fourth quarter of 2016. With the improvement in crude oil
prices we selectively brought back on production several shut-in wells at Onion
Lake and re-initiated a portion of the ASP flood at Mooney. At Onion Lake, we
still have approximately 500 barrels of oil per day currently shut-in.

Average Daily Sales Volume

/T/

—————————————————————————-
Production by area (boe/d) Q1 2017 Q4 2016 Q1 2016
—————————————————————————-
Onion Lake – thermal 6,182 6,119 4,252
Onion Lake – conventional 2,147 2,011 2,232
Mooney 942 785 1,042
John Lake 808 837 861
Blackrod 542 523 584
Other 132 204 195
—————————————————————————-
10,753 10,479 9,166
—————————————————————————-

/T/

Financial Results
Oil and natural gas sales increased 186% in the first quarter of 2017 to $37.2
million from $13.0 million in the same period in 2016. The increase in oil and
gas sales is attributable to a 143% increase in average sale price received and
a 17% increase in production volumes (on a boe basis).

Our realized oil price (before the effects of risk management activities) in Q1
2017 was $40.75 per barrel compared to $16.77 per barrel in 2016. The increase
in our realized wellhead price reflects higher WTI oil prices in Q1 2017
compared with Q1 2016 (US$51.91/bbl vs US$33.45/bbl), partially offset by a
stronger Canadian dollar relative to the US dollar ($0.756 vs $0.727) and
slightly wider heavy oil differentials (US$14.61/bbl vs US$14.32/bbl).

During the first quarter we also realized a small gain of $0.3 million from our
oil hedging program, which was the equivalent of adding $0.37 per barrel to our
wellhead price in the quarter. The following summarizes the hedging contracts
we currently have outstanding:

/T/

Subject of
Contract Volume Term Reference
————————————————————-
2017
————
Oil 500 bbls/d April 1 to December 31 CDN$ WCS
Oil 500 bbls/d April 1 to December 31 US$ WCS
Oil 1,000 bbls/d April 1 to December 31 CDN$ WCS
Oil 500 bbls/d April 1 to June 30 CDN$ WCS
Oil 1,000 bbls/d April 1 to December 31 US$ WTI
Oil 500 bbls/d July 1 to December 31 CDN$ WCS
2018
————
Oil 500 bbls/d January 1 to December 31 US$ WTI
————————————————————-

Subject of
Contract Strike Price Type
—————————————————-
2017
————
Oil CDN$ 54.30/bbl Swap
Oil CDN$ 52.75/bbl Swap
Oil US$ 40.15/bbl Swap
Oil CDN$ 50.00/bbl Swap
Oil CDN$ 49.50/bbl Swap
Oil CDN$ 40.00/bbl to 52.50/bbl Collar
Oil CDN$ 40.00/bbl to 47.00/bbl Collar
Oil US$ 60.00/bbl Sold Call
Oil CDN$ 53.10/bbl Swap
Oil CDN$ 53.00/bbl Swap
2018
————
Oil US$ 70.00/bbl Sold Call
—————————————————-

/T/

Total production costs increased 43% in the first quarter of 2017 to $13.8
million from $9.6 million in the same period in 2016. On a per boe basis, total
production costs increased 21% in the first quarter of 2017 to $15.00 per boe
from $12.35 per boe in the same period in 2016.

Thermal production costs at Onion Lake were fairly consistent between the first
quarter of 2017 and the fourth quarter of 2016. During the first quarter of
2017 thermal production costs averaged $8.85 per barrel compared with $8.35 per
barrel in Q4 2016 and $10.58 per barrel in Q1 2016.

The increase in total production costs during the first quarter of 2017 was
primarily attributable to an increase in production costs on our non-thermal
properties. The re-initialization of the ASP flood at Mooney resulted in an
increase in chemical and injection costs during the quarter. In addition, we
incurred workover costs on the wells we restarted at Mooney and Onion Lake.
During the first quarter of 2017 production costs on our non-thermal properties
averaged $24.43 per barrel compared with $18.59 per barrel in Q4 2016 and
$14.09 per barrel in Q1 2016. Operating costs on our non-thermal properties are
expected to decrease during the remainder of the year as our workover
activities return to normal levels.

Funds flow from operations in Q1 2017 was $12.9 million compared with $3.3
million in the first quarter of 2016. The increase reflects significantly
higher revenues partially offset by higher royalties, operating costs and G&A
costs. Net income for the quarter was $7.8 million compared to a loss of $9.3
million in Q1 2016.

Capital spending was $13.4 million during Q1 2017, with the majority of costs
spent on the expansion of the Onion Lake thermal project. In addition, during
the quarter we sold some minor non-producing assets for proceeds of $3.4
million.

At March 31, 2017, the Company had no bank debt and had working capital of $3.6
million. The total credit facilities available to the Company are currently
$117.5 million. The lenders next review of these facilities will be completed
by May 31, 2017.

Outlook – Guidance

Our plan for the remainder of 2017 is relatively unchanged with the focus being
the expansion of the Onion Lake thermal project with a target completion date
of mid-2018. We are planning to spend between $185 and $190 million on capital
projects, down from our initial guidance of $200 million. The decrease in
capital spending is the result of deferring drilling on some our conventional
heavy oil projects at John Lake, Onion Lake and other minor project areas to
future periods, as well as adjusting the timing of expenditures on the Onion
Lake thermal expansion.

The capital program is expected to be funded from a combination of our
anticipated funds flow from operations and our undrawn credit facilities. We
are also looking to supplement these sources with additional term debt
financing to provide us with financial flexibility during the construction
phase. Funds flow from operations is expected to be between $55 and $60
million, down from our initial guidance of $65 to $70 million. The decrease in
funds flow from operations reflects a change in the average wellhead price we
expect to receive for the remainder of the year. Year-end 2017 debt levels are
anticipated to be between $130 and $135 million, down from our initial guidance
of $135 and $140 million. The decrease in year-end debt levels reflects a
decrease in capital spending for the remainder of the year. We anticipate oil
and gas production to average between 10,000 and 11,000 boe/d in 2017,
unchanged from our initial guidance.

The 2017 first quarter report to shareholders, including the financial
statements, management’s discussion and analysis and notes to the financial
statements are available on the Company’s website (www.blackpearlresources.ca)
or SEDAR (www.sedar.com).

Non-GAAP Measures
Throughout this release, the Company uses terms “funds flow from operations”,
“operating netback” and “net debt”. These terms do not have any standardized
meaning as prescribed by GAAP and, therefore, may not be comparable with the
calculation of similar measures presented by other issuers.

Funds flow from operations is calculated based on cash flow from operating
activities before decommissioning costs incurred and changes in non-cash
working capital related to operations. Management utilizes funds flow from
operations as a key measure to assess operating performance and the ability of
the Company to finance operating activities, capital expenditures and debt
repayments. Funds flow from operations is not intended to represent cash flow
from operating activities or other measures of financial performance in
accordance with GAAP. The following table reconciles non-GAAP measure funds
flow from operations to cash flow from operating activities, the nearest GAAP
measure.

/T/

Three months ended
March 31,
————————
($000s) 2017 2016
————————
Cash flow from operating activities 14,786 3,787
Add (deduct):
Decommissioning costs incurred 42 147
Changes in non-cash working capital related to
operations (1,904) (656)
————————
Funds flow from operations 12,924 3,278
————————

/T/

Operating netback is calculated as oil and gas revenues less royalties,
production costs and transportation costs on a dollar basis and divided by
total production for the period on a boe basis. Oil and gas revenues exclude
the impact of realized gains on risk management contracts. Operating netback is
a non-GAAP measure commonly used in the oil and gas industry to assist in
measuring operating performance against prior periods on a comparable basis.
Our operating netback calculation is consistent with the definition found in
the Canadian Oil and Gas Evaluation (COGE) Handbook.

Net debt is calculated as long-term debt plus working capital for the period
ended. Working capital consists of cash and cash equivalents, trade and other
receivables, inventory, prepaid expenses and deposits, fair value of risk
management assets less accounts payable and accrued liabilities, current
portion of decommissioning liabilities, deferred consideration and fair value
of risk management liabilities. Management utilizes net debt as a key measure
to assess the liquidity of the Company.

Forward-looking Statements
This release contains certain forward-looking statements and forward-looking
information (collectively referred to as “forward-looking statements”) within
the meaning of applicable Canadian securities laws. All statements other than
statements of historic fact are forward-looking statements. Forward-looking
statements are typically identified by such words as “seek”, “anticipate”,
“plan”, “continue”, “estimate”, “expect”, “may”, “will”, “project”,
“potential”, “targeting”, “intend”, “could”, “might”, “should”, “believe” or
similar words suggesting future events or future performance.

In particular, this release contains forward-looking statements pertaining to
the estimated capital costs of between $180 to $185 million to construct phase
2 of the Onion Lake thermal project and the estimated mid-2018 completion date
and estimated timing to reach peak production rates, estimated timing to see
the full impact on production of the re-initiation of the ASP flood at Mooney,
anticipated debt funding for the Phase 2 thermal expansion at Onion Lake and
all the information under Outlook – Guidance.

The forward-looking information is based on, among other things, expectations
and assumptions by management regarding its future growth, future production
levels, future oil and natural gas prices, continuation of existing tax,
royalty and regulatory regimes, foreign exchange rates, estimates of future
operating costs, timing and amount of capital expenditures, performance of
existing and future wells, recoverability of the Company’s reserves and
contingent resources, the ability to obtain financing on acceptable terms,
availability of skilled labour and drilling and related equipment on a timely
and cost efficient basis, general economic and financial market conditions,
environment matters and the ability to market oil and natural gas successfully
to current and new customers. Although management considers these assumptions
to be reasonable based on information currently available to it, they may prove
to be incorrect.

By their nature, forward-looking statements involve numerous known and unknown
risks and uncertainties that contribute to the possibility that actual results
will differ from those anticipated in the forward looking statements. These
risks include, but are not limited to, risks associated with fluctuations in
market prices for crude oil, natural gas and diluent, general economic, market
and business conditions, volatility of commodity inputs, substantial capital
requirements, conditions including receipt of necessary regulatory and stock
exchange approvals with respect to the issuance of common shares, uncertainties
inherent in estimating quantities of reserves and resources, extent of, and
cost of compliance with, government laws and regulations and the effect of
changes in such laws and regulations from time to time, the need to obtain
regulatory approvals on projects before development commences, environmental
risks and hazards and the cost of compliance with environmental regulations,
aboriginal claims, inherent risks and hazards with operations such as fire,
explosion, blowouts, mechanical or pipe failure, cratering, oil spills,
vandalism and other dangerous conditions, financial loss associated with
derivative risk management contracts, potential cost overruns, variations in
foreign exchange rates, variations in interest rates, diluent and water supply
shortages, competition for capital, equipment, new leases, pipeline capacity
and skilled personnel, uncertainties inherent in the SAGD bitumen and ASP
recovery process, credit risks associated with counterparties, the failure of
the Company or the holder of licences, leases and permits to meet requirements
of such licences, leases and permits, reliance on third parties for pipelines
and other infrastructure, changes in royalty regimes, failure to accurately
estimate abandonment and reclamation costs, inaccurate estimates and
assumptions by management, effectiveness of internal controls, the potential
lack of available drilling equipment and other restrictions, failure to obtain
or keep key personnel, title deficiencies with the Company’s assets,
geo-political risks, risks that the Company does not have adequate insurance
coverage, risk of litigation and risks arising from future acquisition
activities. Readers are also cautioned that the foregoing list of factors is
not exhaustive. Further information regarding these risk factors may be found
under “Risk Factors” in the Annual Information Form.

Undue reliance should not be placed on these forward-looking statements. There
can be no assurance that the plans, intentions or expectations upon which
forward-looking statements are based will be realized. Actual results will
differ, and the differences may be material and adverse to the Company and its
shareholders. Furthermore, the forward-looking statements contained in this
release are made as of the date hereof, and the Company does not undertake any
obligation, except as required by applicable securities legislation, to update
publicly or to revise any of the included forward-looking statements, whether
as a result of new information, future events or otherwise. The forward-looking
statements contained herein are expressly qualified by this cautionary
statement.

The information in this release is subject to the disclosure requirements of
the Company under the EU Market Abuse Regulation and the Swedish Securities
Markets Act. The information was publicly communicated on May 3, 2017 at 3:00
p.m. Mountain Time.

– END RELEASE – 03/05/2017

For further information:
John Festival
President and Chief Executive Officer
(403) 215-8313
OR
Don Cook
Chief Financial Officer
(403) 215-8313
OR
Robert Eriksson
Investor Relations Sweden
+46 701-112615

COMPANY:
FOR: BLACKPEARL RESOURCES INC.
TSX SYMBOL: PXX
OMX SYMBOL: PXXS

INDUSTRY: Energy and Utilities – Oil and Gas
RELEASE ID: 20170503CC0097

Press Release from Marketwired 1-866-736-3779

All press releases are written by the client and have NO affiliation with the news copy written by The Canadian Press. Any questions that arise due to the content or information provided in the press release should be directed to the company/organization
issuing the release, not to The Canadian Press.

GET ENERGYNOW’S DAILY EMAIL FOR FREE


Gran Tierra Energy Inc. Announces First Quarter 2017 Results Highlighted by Strong Financial Performance and New Discoveries in the Putumayo and Middle Magdalena Valley Basins

FOR: GRAN TIERRA ENERGY INC.
NYSE MKT SYMBOL: GTE
TSX SYMBOL: GTE

Date issue: May 03, 2017
Time in: 4:55 PM e

Attention:

CALGARY, ALBERTA–(Marketwired – May 3, 2017) – Gran Tierra Energy Inc. (“Gran
Tierra” or the “Company”) (NYSE MKT:GTE)(TSX:GTE), a company focused on oil and
gas exploration and production in Colombia, today announced its financial and
operating results for the quarter ended March 31, 2017. All dollar amounts are
in United States (“U.S.”) dollars unless otherwise indicated. Per barrel of oil
equivalent (“BOE”) amounts are based on working interest (“WI”) sales before
royalties. For per BOE amounts based on net after royalty (“NAR”) production,
see Gran Tierra’s Quarterly Report on Form 10-Q filed May 3, 2017.

Key Highlights

/T/

— Increased average WI production before royalties in first quarter 2017

(“the Quarter”) to 29,879 barrels of oil equivalent per day (“BOEPD”),
17% higher than first quarter 2016’s average WI production before
royalties of 25,610 BOEPD. First quarter 2017’s average WI production
before royalties was down 4%, or 1,152 BOEPD, relative to fourth quarter
2016 (the “Prior Quarter”), as a result of the sale of certain non-core,
low operating net back assets with associated working interest
production of 950 BOEPD, and a series of technical and operational
decisions affecting the timing of certain projects.

— Demonstrated ongoing strong financial performance in first quarter 2017:

— Operating netback(1) on a per BOE basis increased by 14% relative to
the Prior Quarter to $23.72 per BOE and increased 136% relative to
first quarter 2016;

— Operating expenses for the Quarter of $8.87 per BOE increased by 4%
compared with the Prior Quarter, primarily due to field operations
and logistics costs being higher on a per BOE basis as a result of
lower sales volumes;

— Transportation expenses for the Quarter of $2.58 per BOE were
consistent with the Prior Quarter;

— General and Administrative (“G&A”) expenses for the Quarter
decreased by 25% to $2.81 per BOE compared with the Prior Quarter;

— Net cash provided by operating activities for the Quarter was $50
million compared with $7 million in the Prior Quarter. Net cash
provided by operating activities increased primarily due to
increased oil and natural gas sales, decreased operating,
transportation, G&A, interest expenses and current income tax
expense, lower realized foreign exchange losses and an $5 million
cash inflow from changes in assets and liabilities from operating
activities, partially offset by higher equity tax expense;

— Funds flow from operations(1) increased by 24% to $45 million
compared with the Prior Quarter;

— Capital expenditures in the Quarter were $46 million, in line with
funds flow from operations;

— Net income of $13 million was a significant increase over the Prior
Quarter’s net loss of $127 million due to a reduction in non-cash
impairment charges, and represents the first time Gran Tierra has
reported net income since third quarter 2014;

— Earnings before interest, taxes, depletion, depreciation, accretion
and impairment (“EBITDA”)(1) increased by 100% to $62 million
compared to the Prior Quarter;

— This overall strong financial performance in the Quarter was
achieved while the average Brent oil price only increased by 7% to
$54.66 per barrel (“bbl”) compared with the Prior Quarter;

— The Company repaid a net amount of $5 million of the balance
outstanding on its revolving credit facility during the Quarter and
exited the Quarter with $165 million of undrawn capacity on its $250
million credit facility and $27 million of cash on the balance
sheet. Gran Tierra’s committed borrowing base is expected to be
increased by $50 million to $300 million, subject to final
documentation, which is expected to increase total liquidity to
approximately $242 million.

— Demonstrated strong operational results during the Quarter:

— Successfully drilled, cased and tested the Acordionero-8i injection
well and the Acordionero-9 development well, both of which
discovered a new, deeper medium-gravity 24-27 degrees API oil
reservoir in the Lisama D Sand; the Acordionero-9 is now producing
oil from the Lisama C Sand, and Acordionero-8i was being converted
to a planned water injection pilot at the end of first quarter 2017.

— Continued evaluating the new oil play in Costayaco’s “A” Limestone:

— The Costayaco-2 was recompleted into the “A” Limestone in first
quarter 2017 and now, along with the Costayaco-9 and 19 wells,
continues to produce oil from the “A” Limestone with less than
2% watercut;

— Successfully drilled Costayaco-28, Gran Tierra’s first dedicated
“A” Limestone horizontal well and ran a slotted liner into the
1,718 foot (“ft”) horizontal section where numerous natural
fracture zones were encountered, with production testing
expected to begin around mid-May 2017. As a result of mechanical
challenges drilling the horizontal section, testing, stimulation
and ultimately production was delayed 12 weeks. The well is now
complete and is being stimulated prior to testing;

— Costayaco-29, a second horizontal well, is expected to spud
immediately after Costayaco-28 testing and stimulation is
completed, and is planned to test the “A” Limestone in a
different part of the Costayaco structure.

— Continued drilling in the “N” Sands and “A” Limestone exploration plays

in the Putumayo Basin during first quarter 2017:

— The Confianza-1 exploration well in the Putumayo-7 (“PUT-7”) block
discovered oil in the Villeta “U” Sand and the “A” Limestone, both
of which represent new discoveries in PUT-7, as well as encountered
net oil pay in the previously discovered Villeta “N” Sands. Both the
“U” Sand and the “A” Limestone tested light sweet oil. As of May 2,
2017, the Confianza-1 is now producing from the “N” Sands.

— Subsequent to the end of the Quarter, on April 27, 2017, the Company

closed the previously announced strategic acquisitions of the Santana
and Nancy-Burdine-Maxine blocks, along with key pipeline and
transportation infrastructure, for cash consideration of $30 million.

— Gran Tierra expects 2017 average WI production before royalties to be

34,000 to 38,000 BOEPD from the Company’s assets in Colombia and Brazil,
which would represent an increase of 26% to 40% from our 2016 average WI
production before royalties of 27,062 BOEPD. The 2017 guidance includes
1,200 to 1,500 BOEPD of production from Brazil.

/T/

Message to Shareholders

Gary Guidry, President and Chief Executive Officer of Gran Tierra, commented
“Gran Tierra’s strong first quarter 2017 results clearly demonstrate that we
are delivering on our focused strategy of growing the Company’s net asset value
per share through our financially disciplined and results-driven exploration
and development of our diversified Colombian asset base. We are pleased to
report new oil discoveries in the Lisama D Sand in the Acordionero field in the
Middle Magdalena Valley Basin and the “U” Sand and “A” Limestone in the PUT-7
block in the Putumayo Basin. Based on open hole logs, we also believe the
Lisama B Sand at Acordionero may be a new discovery, but needs to be production
tested at a later date.

We are also continuing to develop our new oil play in Costayaco’s “A”
Limestone, where we are now producing oil from 3 vertical wells and have just
cased our first dedicated horizontal well in this play, the Costayaco-28. We
believe the “A” Limestone play may extend from the Costayaco field in the north
to the PUT-7 block in the south of the Putumayo Basin and could represent a
significant resource with positive basin-wide implications. This new play will
be further tested through the multiple exploration wells we plan on drilling in
the Putumayo Basin in 2017 and 2018. We have a very strong position in the
basin with 13 blocks and 1.1 million gross acres.

We did experience pump failures in both Acordionero-7 and Cumplidor-1, which
impacted first quarter 2017 production by approximately 1,200 BOEPD. Subsequent
to first quarter 2017, we have changed the pump design and expect to minimize
failures going forward. We also deferred production from the final completion
of Confianza (Villeta “N” Sands) and the Acordionero-8i and -9 to complete the
testing of newly discovered zones and experienced well downtime due to
workovers in the Costayaco Field.

Our strong first quarter 2017 financial performance is demonstrated by the fact
that funds flow from operations was up 24% relative to the Prior Quarter to $45
million, and covered 98% of the Company’s first quarter 2017 capital
expenditures of $46 million. The increase in funds flow from operations was due
to higher operating netbacks and lower G&A expenses.

Average Brent prices in the first quarter 2017 increased 7% to $54.66 per bbl
from the Prior Quarter, while Gran Tierra’s average realized oil price
increased 10% to $35.17 per BOE in the same time period. Gran Tierra has
successfully driven down combined operating and transportation expenses to
$11.45 per BOE for the Quarter, a decrease of 5% from one year ago. Our
operating netback increased 14% compared with the Prior Quarter to $23.72 per
BOE, as a result of higher realized prices. We believe our low cost structure
and solid production base allow us to be successful in a variety of pricing
environments.

We are focused on delivering long-term growth in net asset value per share to
our shareholders. Therefore, when Gran Tierra makes new discoveries such as the
Lisama D Sand at Acordionero, the “A” Limestone at Costayaco and the “U” Sand
and “A” Limestone in the PUT-7 block, we will spend the extra time necessary to
fully evaluate these potential new resources even when these deliberate
decisions lead to temporary delays in bringing production online. Our
transformed asset base is located in proven basins with stacked reservoirs and
are either underexplored or underdeveloped and, at times, require additional
time to evaluate. The time dedicated to properly test and assess new
discoveries is expected to result in enhanced long-term value creation. Mostly
as a result of the extended production testing of the Acordionero-8i and 9 and
the Confianza-1 wells, as well as the pump failures at Acordionero-7 and
Cumplidor-1, WI production before royalties for first quarter 2017 averaged
29,879 BOEPD, 4% lower compared to 31,031 BEOPD in the Prior Quarter, but 17%
higher than first quarter 2016’s average WI production before royalties of
25,610 BOEPD. Over the next three years, we continue to forecast both visible
organic production growth and to drill a total of 30 to 35 exploration wells,
with all of this activity expected to be funded from cash flows from operations.

On behalf of our board of directors and the team at Gran Tierra, I want to
thank all of our stakeholders for their continued support. We look forward to
communicating additional updates in the coming quarters. We believe that our
focused strategy is delivering results by proving up our significant
exploration potential and that Gran Tierra is well positioned for growth
through the end of 2017 and beyond.”

Financial and Operational Highlights (all amounts in $000s, except per share
and BOE amounts)

/T/

Three
Months
Ended
December
31 Three Months Ended March 31,
—————————————
—————————————
2016 2017 2016 % Change
—————————————
—————————————
Oil and Gas Sales $ 91,614 $ 94,659 $ 57,403 65
Operating Expenses (24,472) (23,937) (19,067) 26
Transportation Expenses (7,458) (6,942) (12,328) (44)
—————————————
Operating Netback(1) $ 59,684 $ 63,780 $ 26,008 145
—————————————
—————————————

G&A Expenses Before Stock-Based
Compensation $ 10,713 $ 7,563 $ 5,652 34
Stock-Based Compensation 1,891 1,149 1,397 (18)
—————————————
G&A Expenses, Including Stock Based
Compensation $ 12,604 $ 8,712 $ 7,049 24
—————————————
—————————————

Net (Loss) Income $(127,355)$ 12,771 $ (45,032) 128
Per Share – Basic and Diluted $ (0.36)$ 0.03 $ (0.15) 120

EBITDA(1) $ 30,745 $ 61,538 $ 24,184 154

Net Cash Provided by Operating
Activities $ 6,643 $ 49,943 $ 10,812 362
Funds Flow from Operations(1) $ 36,186 $ 45,026 $ 11,563 289

Capital Expenditures $ 58,219 $ 46,160 $ 26,180 76

Average Daily Volumes (BOEPD)
————————————-
————————————-
WI Production Before Royalties 31,031 29,879 25,610 17
Royalties (4,768) (5,089) (2,822) 80
—————————————
Production NAR 26,263 24,790 22,788 9
Decrease in Inventory 214 18 2,642 (99)
—————————————
Sales 26,477 24,808 25,430 (2)
—————————————
—————————————
Royalties, % of WI Production Before
Royalties 15% 17% 11%

Per BOE(2)
————————————-
————————————-
Brent $ 51.13 $ 54.66 $ 33.70 62
Quality and Transportation Discount (13.52) (12.27) (8.90) 38
Royalties (5.72) (7.22) (2.64) 173
—————————————
Average Realized Price 31.89 35.17 22.16 59
Transportation Expenses (2.60) (2.58) (4.76) (46)
—————————————
Average Realized Price Net of
Transportation Expenses 29.29 32.59 17.40 87
Operating Expenses (8.50) (8.87) (7.34) 21
—————————————
Operating Netback(1) 20.79 23.72 10.06 136
G&A Expenses (3.73) (2.81) (2.18) 29
Transaction Expenses – – (0.48) (100)
Severance Expenses (0.01) – (0.39) (100)
Equity Tax (0.02) (0.45) (1.18) (62)
Realized Foreign Exchange Loss (0.47) (0.36) (0.37) (3)
Realized Financial Instruments (Loss)
Gain (0.33) 0.29 0.02 –
Interest Expense, Excluding
Amortization of Debt Issuance Costs (1.19) (0.93) (0.15) 520
Interest Income 0.15 0.15 0.17 (12)
Current Income Tax Expense (2.94) (2.76) (0.78) 254
—————————————
Cash Netback(1) $ 12.25 $ 16.85 $ 4.72 257
—————————————
—————————————

Share Information (000s)
————————————-
————————————-
Common Stock Outstanding, End of
Period 390,807 390,815 287,658 36
Exchangeable Shares Outstanding, End
of Period 8,200 8,192 8,514 (4)
Weighted Average Number of Common and
Exchangeable Shares Outstanding –
Basic 370,745 399,007 293,812 36
Weighted Average Number of Common and
Exchangeable Shares Outstanding –
Diluted 370,745 399,046 293,812 36

As at
———————————————-
———————————————-
(Thousands of U.S. Dollars) March 31, 2017 December 31, 2016 % Change
———————————————-
———————————————-
Cash, Cash Equivalents and $
Current Restricted Cash and
Cash Equivalents 34,379 $ 33,497 3
Revolving Credit Facility $ 85,000 $ 90,000 (6)
Convertible Senior Notes $ 115,000 $ 115,000 –

/T/

(1) Operating netbacks, earnings before interest, taxes, depletion,
depreciation, accretion and impairment (“DD&A”) (“EBITDA”), funds flow from
operations and cash netbacks are non-GAAP measures and do not have a
standardized meaning under generally accepted accounting principles in the
United States of America (“GAAP”). Refer to “Non-GAAP Measures” in this press
release for descriptions of these non-GAAP measures and reconciliations to the
most directly comparable measures calculated and presented in accordance with
GAAP.

(2) Per BOE amounts are based on WI sales before royalties. For per BOE amounts
based on NAR production, see Gran Tierra’s Quarterly Report on Form 10-Q filed
May 3, 2017.

Conference Call Information:

Gran Tierra Energy Inc. will host its first quarter 2017 results conference
call on Thursday, May 4, 2017. Details of the conference call are as follows:

/T/

—————————————————————————-
Date: Thursday, May 4, 2017
—————————————————————————-
Time: 11:00 a.m. Eastern Time (9:00 a.m.
Mountain Time)
—————————————————————————-
North American participants call: 1-844-348-3792 (Toll-Free)
—————————————————————————-
Outside of Canada & USA call: 1-614-999-9309
—————————————————————————-

/T/

Interested parties may also access the live webcast on the investor relations
page of Gran Tierra’s website at www.grantierra.com. An archive of the webcast
will be available on Gran Tierra’s website until the next earnings call. In
addition, an audio replay of the conference call will be available following
the call until May 6, 2017. To access the replay, dial toll-free 1-855-859-2056
(North America), or 1-404-537-3406 (outside of Canada and USA), conference ID:
9267216.

About Gran Tierra Energy Inc.

Gran Tierra Energy Inc. together with its subsidiaries is an independent
international energy company focused on oil and natural gas exploration and
production in Colombia. The Company also has business activities in Peru and
Brazil. The Company is focused on its existing portfolio of assets in Colombia
and will pursue new growth opportunities throughout Colombia, leveraging our
financial strength. The Company’s common shares trade on the NYSE MKT and the
Toronto Stock Exchange under the ticker symbol GTE. Additional information
concerning Gran Tierra is available at www.grantierra.com. Information on the
Company’s website does not constitute a part of this press release. Investor
inquiries may be directed to [email protected] or (403) 265-3221.

Gran Tierra’s Securities and Exchange Commission filings are available on a
website maintained by the Securities and Exchange Commission at
http://www.sec.gov and on SEDAR at http://www.sedar.com.

Forward Looking Statements and Legal Advisories:

This press release contains opinions, forecasts, projections, and other
statements about future events or results that constitute forward-looking
statements within the meaning of the United States Private Securities
Litigation Reform Act of 1995, Section 27A of the Securities Act of 1933, as
amended, and Section 21E of the Securities Exchange Act of 1934, as amended,
and financial outlook and forward looking information within the meaning of
applicable Canadian securities laws (collectively, “forward-looking
statements”). Such forward-looking statements include, but are not limited to,
Gran Tierra’s committed borrowing base, anticipated drilling efficiencies, the
Company’s strategies, the Company’s operations including planned operations,
the Company’s ability to succeed in a variety of pricing environments, the base
capital program, the allocation of capital, the exploration and development of
certain blocks and fields, production growth or estimates and drilling plans
including trends, infrastructure schedules, and the expected timing of certain
projects.

The forward-looking statements contained in this press release reflect several
material factors and expectations and assumptions of Gran Tierra including,
without limitation, that Gran Tierra will continue to conduct its operations in
a manner consistent with its current expectations, the accuracy of testing and
production results and seismic data, pricing and cost estimates (including with
respect to commodity pricing and exchange rates), rig availability, the effects
of drilling down-dip, the effects of waterflood and multi-stage fracture
stimulation operations, the extent and effect of delivery disruptions, and the
general continuance of current or, where applicable, assumed operational,
regulatory and industry conditions including in areas of potential expansion,
and the ability of Gran Tierra to execute its current business and operational
plans in the manner currently planned. Gran Tierra believes the material
factors, expectations and assumptions reflected in the forward-looking
statements are reasonable at this time but no assurance can be given that these
factors, expectations and assumptions will prove to be correct.

Among the important factors that could cause actual results to differ
materially from those indicated by the forward-looking statements in this press
release are: sustained or future declines in commodity prices and potential
resulting future impairments and reductions in proved reserve quantities and
value; Gran Tierra’s operations are located in South America, and unexpected
problems can arise due to guerilla activity; technical difficulties and
operational difficulties may arise which impact the production, transport or
sale of our products; geographic, political and weather conditions can impact
the production, transport or sale of our products; the risk that current global
economic and credit conditions may impact oil prices and oil consumption more
than Gran Tierra currently predicts; the ability of Gran Tierra to execute its
business plan; the risk that unexpected delays and difficulties in developing
currently owned properties may occur; the timely receipt of regulatory or other
required approvals for our operating activities; the failure of exploratory
drilling to result in commercial wells; unexpected delays due to the limited
availability of drilling equipment and personnel; the risk that oil prices
could continue to fall, or current global economic and credit market conditions
may impact oil prices and oil consumption more than Gran Tierra currently
predicts, which could cause Gran Tierra to further modify its strategy and
capital spending program; and the risk factors detailed from time to time in
Gran Tierra’s periodic reports filed with the Securities and Exchange
Commission, including, without limitation, under the caption ” Risk Factors” in
Gran Tierra’s Annual Report on Form 10-K filed March 1, 2017 and its Quarterly
Report on Form 10-Q filed May 3, 2017. These filings are available on the Web
site maintained by the Securities and Exchange Commission at http://www.sec.gov
and on SEDAR at www.sedar.com. Although the current capital spending program
and long term strategy of Gran Tierra is based upon the current expectations of
the management of Gran Tierra, should any one of a number of issues arise, Gran
Tierra may find it necessary to alter its business strategy and/or capital
spending program and there can be no assurance as at the date of this press
release as to how those funds may be reallocated or strategy changed.

All forward-looking statements are made as of the date of this press release
and the fact that this press release remains available does not constitute a
representation by Gran Tierra that Gran Tierra believes these forward-looking
statements continue to be true as of any subsequent date. Actual results may
vary materially from the expected results expressed in forward-looking
statements. Gran Tierra disclaims any intention or obligation to update or
revise any forward-looking statements, whether as a result of new information,
future events or otherwise, except as expressly required by applicable
securities laws. Gran Tierra’s forward-looking statements are expressly
qualified in their entirety by this cautionary statement.

The estimates of future production set forth in this press release may be
considered to be future-oriented financial information or a financial outlook
for the purposes of applicable Canadian securities laws. Financial outlook and
future-oriented financial information contained in this press release about
prospective financial performance, financial position or cash flows are based
on assumptions about future events, including economic conditions and proposed
courses of action, based on management’s assessment of the relevant information
currently available, and to become available in the future. In particular, this
press release contains projected operational information for 2017 for certain
blocks. These projections contain forward-looking statements and are based on a
number of material assumptions and factors set out above. Actual results may
differ significantly from the projections presented herein. These projections
may also be considered to contain future-oriented financial information or a
financial outlook. The actual results of Gran Tierra’s operations for any
period will likely vary from the amounts set forth in these projections, and
such variations may be material. See above for a discussion of the risks that
could cause actual results to vary. The future-oriented financial information
and financial outlooks contained in this press release have been approved by
management as of the date of this press release. Readers are cautioned that any
such financial outlook and future-oriented financial information contained
herein should not be used for purposes other than those for which it is
disclosed herein. The Company and its management believe that the prospective
financial information has been prepared on a reasonable basis, reflecting
management’s best estimates and judgments, and represent, to the best of
management’s knowledge and opinion, the Company’s expected course of action.
However, because this information is highly subjective, it should not be relied
on as necessarily indicative of future results.

Non-GAAP Measures

This press release includes non-GAAP financial measures as further described
herein. These non-GAAP measures do not have a standardized meaning under GAAP.
Investors are cautioned that these measures should not be construed as
alternatives to net income or loss or other measures of financial performance
as determined in accordance with GAAP. Gran Tierra’s method of calculating
these measures may differ from other companies and, accordingly, they may not
be comparable to similar measures used by other companies. Each non-GAAP
financial measure is presented along with the corresponding GAAP measure so as
not to imply that more emphasis should be placed on the non-GAAP measure.

Operating netback as presented is oil and gas sales net of royalties and
operating and transportation expenses. Cash netback as presented is net income
or loss before DD&A expenses, asset impairment, deferred income tax recovery,
amortization of debt issuance costs, unrealized foreign exchange gains and
losses, gain on acquisition, non-cash operating and G&A expenses and unrealized
financial instruments gains and losses. Management believes that operating and
cash netback are useful supplemental measures for investors to analyze
financial performance and provide an indication of the results generated by
Gran Tierra’s principal business activities prior to the consideration of other
income and expenses. See the table entitled Financial and Operational
Highlights, above on page 4 of this press release, for the components of
operating netback. A reconciliation from net loss to cash netback is as follows:

/T/

Three Months
Ended December Three Months Ended
31 March 31,
—————————————
—————————————
Cash Netback – Non-GAAP Measure
($000s) 2016 2017 2016
—————————————
—————————————
Net (loss) income $ (127,355) $ 12,771 $ (45,032)
Adjustments to reconcile net (loss)
income to cash netback
DD&A expenses 35,010 26,593 36,912
Asset impairment 146,934 283 56,898
Deferred income tax (recovery)
expense (38,589) 11,379 (27,136)
Amortization of debt issuance
costs 2,878 605 140
Unrealized foreign exchange gain (3,865) (2,819) (183)
(Adjustment to gain)/ gain on
acquisition 10,783 – (11,712)
Non-cash operating expenses 68 54 62
Non-cash G&A expenses 1,891 1,149 1,397
Unrealized financial instruments
loss (gain) 7,520 (4,671) 888
—————————————
Cash netback $ 35,275 $ 45,344 $ 12,234
—————————————
—————————————

/T/

EBITDA, as presented, is net loss adjusted for DD&A expenses, asset impairment,
interest expense and income tax recovery or expense. Management uses this
financial measure to analyze performance and income or loss generated by Gran
Tierra’s principal business activities prior to the consideration of how
non-cash items affect that income or loss, and believes that this financial
measure is also useful supplemental information for investors to analyze
performance and the Company’s financial results. A reconciliation from net
income or loss to EBITDA is as follows:

/T/

Three
Months
Ended
December Three Months Ended
31 March 31,
——————————–
——————————–
EBITDA – Non-GAAP Measure ($000s) 2016 2017 2016
——————————–
——————————–
Net (loss) income $(127,355) $ 12,771 $ (45,032)
Adjustments to reconcile net (loss) income
to EBITDA
DD&A expenses 35,010 26,593 36,912
Asset impairment 146,934 283 56,898
Interest expense 6,303 3,095 519
Income tax (recovery) expense (30,147) 18,796 (25,113)
——————————–
EBITDA $ 30,745 $ 61,538 $ 24,184
——————————–
——————————–

/T/

Funds flow from operations, as presented, is net cash provided by operating
activities adjusted for net change in assets and liabilities from operating
activities and cash settlement of asset retirement obligation. Management uses
this financial measure to analyze liquidity and cash flows generated by Gran
Tierra’s principal business activities prior to the consideration of how
changes in assets and liabilities from operating activities and cash settlement
of asset retirement obligation affect those cash flows, and believes that this
financial measure is also useful supplemental information for investors to
analyze Gran Tierra’s liquidity and financial results. A reconciliation from
net cash provided by operating activities to funds flow from operations is as
follows:

/T/

Three
Months
Ended
December Three Months Ended
31 March 31,
———————————-
———————————-
Funds Flow From Operations – Non-GAAP
Measure ($000s) 2016 2017 2016
———————————-
———————————-
Net cash provided by operating activities $ 6,643$ 49,943 $ 10,812
Adjustments to reconcile net cash
provided by operating activities to
funds flow from operations
Net change in assets and liabilities
from operating activities 29,434 (4,930) 647
Cash settlement of asset retirement
obligation 109 13 104
———————————-
Funds flow from operations $ 36,186$ 45,026 $ 11,563
———————————-
———————————-

/T/

Presentation of Oil and Gas Information

BOEs have been converted on the basis of 6 thousand cubic feet (“Mcf”) of
natural gas to 1 barrel of oil. BOEs may be misleading, particularly if used in
isolation. A BOE conversion ratio of 6 Mcf: 1 barrel is based on an energy
equivalency conversion method primarily applicable at the burner tip and does
not represent a value equivalency at the wellhead. In addition, given that the
value ratio based on the current price of oil as compared with natural gas is
significantly different from the energy equivalent of six to one, utilizing a
BOE conversion ratio of 6 Mcf: 1 barrel would be misleading as an indication of
value.

Investors are urged to consider closely the disclosures and risk factors in the
Company’s Annual Report on Form 10-K, Quarterly Reports on Form 10-Q and in the
other reports and filings with the SEC, available from the Company’s offices or
website. These forms can also be obtained from the SEC via the internet at
www.sec.gov by calling 1-800-SEC-0330.

– END RELEASE – 03/05/2017

For further information:
For investor and media inquiries:
Gary Guidry
Chief Executive Officer
403-767-6500
OR
Ryan Ellson
Chief Financial Officer
403-767-6501
OR
Rodger Trimble
Vice President, Investor Relations
403-698-7941
[email protected]

COMPANY:
FOR: GRAN TIERRA ENERGY INC.
NYSE MKT SYMBOL: GTE
TSX SYMBOL: GTE

INDUSTRY: Energy and Utilities – Oil and Gas
RELEASE ID: 20170503CC0096

Press Release from Marketwired 1-866-736-3779

All press releases are written by the client and have NO affiliation with the news copy written by The Canadian Press. Any questions that arise due to the content or information provided in the press release should be directed to the company/organization
issuing the release, not to The Canadian Press.

GET ENERGYNOW’S DAILY EMAIL FOR FREE


Spain’s says offshore plant linked to quakes to stay closed

MADRID — Spain’s Energy Ministry says it will not reopen a large offshore gas storage plant that was shut down in 2013 following minor earthquakes in the area.

A ministry statement issued Wednesday said a study carried out by the Massachusetts Institute of Technology and Harvard University concluded that a fault line close to Spain’s eastern coast had been put under stress because of gas being pumped into the facility. The U.S. researchers said the quakes could return, if plant operations were resumed.

Gas injections at the Castor plant were halted after they were linked to hundreds of minor earthquakes in 2013.

The ministry says the plant will not be dismantled for security reasons, at least for now.

The Castor project was estimated to have cost some 1.3 billion euros ($1.42 billion.)

The Associated Press

GET ENERGYNOW’S DAILY EMAIL FOR FREE


Tesla Releases First Quarter 2017 Financial Results

FOR: TESLA, INC.
NASDAQ SYMBOL: TSLA

Date issue: May 03, 2017
Time in: 4:10 PM e

Attention:

PALO ALTO, CA–(Marketwired – May 03, 2017) – Tesla (NASDAQ: TSLA) has released
its financial results for the first quarter of 2017 by posting the current
Update Letter on its website. Please visit http://ir.tesla.com to view the
letter.

As previously announced, Tesla management will host a live question &
answer (Q&A) webcast at 2:30 p.m. Pacific Time (5:30 p.m. Eastern Time) to
discuss the results and outlook.

What: Tesla First Quarter 2017 Financial Results Q&A Webcast
When: Wednesday, May 3, 2017
Time: 2:30 p.m. Pacific Time / 5:30 p.m. Eastern Time
Shareholder Letter: http://ir.tesla.com
Webcast: http://ir.tesla.com (live and replay)

The webcast will be archived on the company’s website following the call.

– END RELEASE – 03/05/2017

For further information:
Investor Relations Contact:
Jeff Evanson
Tesla
[email protected]
OR
Press Contact:
Dave Arnold
Tesla
[email protected]

COMPANY:
FOR: TESLA, INC.
NASDAQ SYMBOL: TSLA

INDUSTRY: Automotive – Cars, Automotive – Other passenger vehicles,
Automotive – Parts and Accessories, Energy and Utilities –
Alternative Energy, Energy and Utilities – Oil and Gas , Energy and
Utilities – Utilities, Environment – Air Pollution Control, Retail
– Consumer Interest, Energy and Utilities – Clean Technology
RELEASE ID: 20170503CC0088

Press Release from Marketwired 1-866-736-3779

All press releases are written by the client and have NO affiliation with the news copy written by The Canadian Press. Any questions that arise due to the content or information provided in the press release should be directed to the company/organization
issuing the release, not to The Canadian Press.

GET ENERGYNOW’S DAILY EMAIL FOR FREE


A Different and Sobering Perspective on The Future of Oil: Why the Industry Must be Supported – David Yager – Yager Management

          David Yager – Yager Management Ltd. Oilfield Service Management Consulting – Oil & Gas Writer – Energy Policy Analyst May 3, 2017 The current discussion about the future of oil is how soon will it be before petroleum becomes a sunset industry. If it isn’t already. Flat or falling demand. … Read more

GET ENERGYNOW’S DAILY EMAIL FOR FREE


Wilton Resources Inc. Announces Resignation of Officer and Appointment of Officer

FOR: WILTON RESOURCES INC.TSX VENTURE SYMBOL: WILDate issue: May 03, 2017Time in: 11:24 AM eAttention:
CALGARY, ALBERTA–(Marketwired – May 3, 2017) –
NOT FOR DISTRIBUTION TO U.S. NEWSWIRE SERVICES OR FOR DISSEMINATION IN THE
UNITED STATES. ANY FAILUR…

GET ENERGYNOW’S DAILY EMAIL FOR FREE


Precision Drilling Corporation Announces Webcast of Annual and Special Meeting of Shareholders

FOR: PRECISION DRILLING CORPORATION
TSX SYMBOL: PD
NYSE SYMBOL: PDS

Date issue: May 03, 2017
Time in: 10:58 AM e

Attention:

CALGARY, ALBERTA–(Marketwired – May 3, 2017) – Precision Drilling Corporation
(“Precision”) (TSX:PD)(NYSE:PDS) will hold its Annual and Special Meeting of
Shareholders on Wednesday, May 17, 2017 at Eighth Avenue Place 525 – 8th Avenue
SW, Suite 410, Calgary, Alberta commencing at 10:00 a.m. MT.

A live webcast of the Annual and Special Meeting followed by a presentation by
Kevin Neveu, Precision’s President and Chief Executive Officer, will be
accessible on Precision’s website at www.precisiondrilling.com by selecting
“Investor Relations”, then “Webcasts & Presentations”. An archived recording of
the conference call will also be available after the conclusion of the live
event.

About Precision

Precision is a leading provider of safe and High Performance, High Value
services to the oil and gas industry. Precision provides customers with access
to an extensive fleet of contract drilling rigs, directional drilling services,
well service and snubbing rigs, camps, rental equipment, and wastewater
treatment units backed by a comprehensive mix of technical support services and
skilled, experienced personnel.

Precision is headquartered in Calgary, Alberta, Canada. Precision is listed on
the Toronto Stock Exchange under the trading symbol “PD” and on the New York
Stock Exchange under the trading symbol “PDS”.

– END RELEASE – 03/05/2017

For further information:
Precision Drilling Corporation
Carey Ford
Senior Vice President and Chief Financial Officer
403.716.4566
403.716.4755 (FAX)
www.precisiondrilling.com

COMPANY:
FOR: PRECISION DRILLING CORPORATION
TSX SYMBOL: PD
NYSE SYMBOL: PDS

INDUSTRY: Energy and Utilities – Equipment, Energy and Utilities –
Oil and Gas
RELEASE ID: 20170503CC0064

Press Release from Marketwired 1-866-736-3779

All press releases are written by the client and have NO affiliation with the news copy written by The Canadian Press. Any questions that arise due to the content or information provided in the press release should be directed to the company/organization
issuing the release, not to The Canadian Press.

GET ENERGYNOW’S DAILY EMAIL FOR FREE


Carl Data Solutions Primed to Enter Smart City Market in India

FOR: CARL DATA SOLUTIONS INC.
CSE SYMBOL: CRL
CSE SYMBOL: CRL.CN
CNSX SYMBOL: CRL
FRANKFURT SYMBOL: 7C5
OTC PINK SYMBOL: CDTAF

Date issue: May 03, 2017
Time in: 9:31 AM e

Attention:

VANCOUVER, BRITISH COLUMBIA–(Marketwired – May 3, 2017) – Carl Data Solutions
Inc. (CSE:CRL)(CSE:CRL.CN)(CNSX:CRL)(FRANKFURT:7C5)(OTC PINK:CDTAF) (“Carl” or
the “Company”), a developer of Big-Data-as-a-Service (“BDaaS”)-based solutions
for data integration, business intelligence, and Industrial Internet-of-Things
(“IIoT”) applications, is primed to enter the Smart City market in India, which
has an estimated worth of $45-50 billion USD over the next 5 years. India’s
infrastructure, from solid waste to street lights, will be upgraded over the
next decade.

Recent acquisition AB Embedded Systems Ltd. (“AB Embedded”), a leader in
control systems and hardware devices, has been incorporated in India for
several years which allows ability to bid on contracts throughout the country.
Carl’s scalable BDaaS platform for data storage, reporting and advanced
analytics combined with AB Embedded’s advanced sensors, gateways and telemetry
for data collection, create the plug-and-play IIoT solutions that are in high
demand for this massive emerging market.

Lawrence Francois, Project Manager with KWL a civil engineering firm who has
previously partnered with Carl on IIoT solutions, commented, “India’s ambitious
urbanization strategy promotes significant redevelopment, creation of new Smart
Cities and a nationwide digitization program. Innovative planning, design and
management of water, wastewater and sanitation infrastructure are critical to
sustainable cities of the future. Smart Cities will need to be developed as a
digital platform for efficient management of its natural resources and critical
infrastructure.”

Recently, AB Embedded expanded to introduce new Smart City products that
include water and solid waste management solutions using advanced telemetry to
cost effectively collect data from remote locations. AB Embedded is currently
organizing several pilot projects in India and North America to test both new
products and the telemetry solutions that connect its devices. According to
Attila Bene, President of AB Embedded, “There are two cities North East of
Mumbai that will be investing $1 billion in Smart City infrastructure. Carl’s
Smart City IIoT solutions are well positioned to possibly obtain up to $30
million in revenue.”

About Carl Data Solutions Inc.

Carl Data Solutions Inc. is focused on providing next generation information
collection, storage and analytics solutions for data-centric companies.
Building on its recent acquisitions, Flow Works Inc., a company that helps its
clients analyze and understand all forms of environmental data through a
powerful platform of data collection, monitoring, analysis and reporting tools
and ETS., Carl continues to develop applications to work with new cloud-based
mass storage services and analytics tools (Big-Data-as-a-Service (“BDaaS”)).

Carl’s development platform can accommodate virtually unlimited storage of any
type of data. This technology allows Carl to build advanced applications for
monitoring, reporting and analysis. Carl’s data collection and storage methods
allow the company to build smart Software-as-a-Service (“SaaS”)-based
applications that can collect data from many diverse sources and provide deep
insight for decision-making purposes. More information can be found at
www.carlsolutions.com.

About AB Embedded Pvt. Ltd.

AB Embedded Pvt. Ltd. has been executing projects in hardware and software
engineering design since 2006 in Calgary, Canada. Since their embedded systems
are engineered to perform specific tasks, their design engineers ensure that
customers’ cost, power consumption, size, performance and reliability are
optimized. Their smart control systems and devices are manufactured
specifically for water, solid waste management, industrial control and
monitoring in all-weather environments.

AB Embedded’s high-performance, high-efficiency control systems, are a top
choice for the Oil & Gas sector because of their reliability and low-power
consumption. AB Embedded believe in constant innovation. They are transforming
the way engineers design, prototype and deploy embedded systems for automation,
measurement and embedded applications. www.ab-embedded.com

On behalf of the Board of Directors:

Greg Johnston, President, Chief Executive Officer, Director

Carl Data Solutions Inc.

The Canadian Securities Exchange (operated by CNSX Markets Inc.) has neither
approved nor disapproved of the contents of this press release.

Forward-Looking Statements

This press release contains certain forward-looking statements within the
meaning of applicable securities law. Forward-looking statements are frequently
characterized by words such as “plan”, “expect”, “project”, “intend”,
“believe”, “anticipate”, “estimate” and other similar words, or statements that
certain events or conditions “may” or “will” occur. In particular,
forward-looking statements in this press release include, but are not limited
to, statements with respect to: the completion of the Acquisition; the
Company’s belief that the Acquisition will contribute to Carl’s corporate
growth strategy to build and acquire companies with a proven record of success
working in data-driven verticals, such as Oil & Gas, Utilities and Resource
Development, whose data management needs are growing with the advancement of
the IIoT; Carl’s plan to enhance AB Embedded’s solutions using its BDaaS
platform to provide additional advanced analytics, reporting and alarming; the
Company’s belief that upon completion of the Acquisition, Carl along with its
subsidiaries, AB Embedded and FlowWorks, will be able to provide turnkey IIoT
solutions for progressive, data-centric companies and cities who rely on large
amounts of data to properly operate and maintain their infrastructure; the
Company’s expectation that Attial Bene will continue with his role to develop,
engineer and integrate of their sensors and communications with Carl’s existing
solutions subsequent to completion of the Acquisition; Mr. Bene’s statement
that Carl’s SaaS based solution will provide the necessary means for clients of
AB Embedded to properly interpret and respond to the information generated by
AB Embedded’s hardware networks; Carl’s expectation to provide unique and
customized solutions from data collection through to predictive analytics using
machine learning; and the Company’s expectation to begin filling gaps and
supplementing existing networks to create even more value for the Company’s
clients with the addition of AB Embedded.

Although the Company believes that the expectations reflected in the
forward-looking statements are reasonable, there can be no assurance that such
expectations will prove to be correct. Such forward-looking statements are
subject to risks and uncertainties that may cause actual results, performance
or developments to differ materially from those contained in the statements
including, without limitation, risks with respect to: delay or failure to
complete the transactions contemplated by the Agreement; the inability to
successfully integrate the business of AB Embedded; the ability of the Company
to establish a market for its services; competitive conditions in the industry;
general economic conditions in Canada and globally; the inability to secure
additional financing; competition for, among other things, capital and skilled
personnel; potential delays or changes in plans with respect to deployment of
services or capital expenditures; possibility that government policies or laws
may change; technological change; risks related to the Company’s competition;
the Company’s not adequately protecting its intellectual property; interruption
or failure of information technology systems; and regulatory risks relating to
the Company’s business, financings and strategic acquisitions. Any
forward-looking statements contained in this press release are made as of the
date of this press release. The Company disclaims any intent or obligation to
update publicly any forward-looking information, whether as a result of new
information, future events or results or otherwise, other than as required by
applicable securities laws.

– END RELEASE – 03/05/2017

For further information:
Carl Data Solutions Inc.
Kimberly Bruce
Corporate Communications
(778) 379-0275
[email protected]

COMPANY:
FOR: CARL DATA SOLUTIONS INC.
CSE SYMBOL: CRL
CSE SYMBOL: CRL.CN
CNSX SYMBOL: CRL
FRANKFURT SYMBOL: 7C5
OTC PINK SYMBOL: CDTAF

INDUSTRY: Computers and Software – Internet, Computers and Software
– Software
RELEASE ID: 20170503CC0055

Press Release from Marketwired 1-866-736-3779

All press releases are written by the client and have NO affiliation with the news copy written by The Canadian Press. Any questions that arise due to the content or information provided in the press release should be directed to the company/organization
issuing the release, not to The Canadian Press.

GET ENERGYNOW’S DAILY EMAIL FOR FREE


Pulse Oil Corp. Announces $8 Million Unit Financing to Acquire Oil and Gas Assets, Restart Production and Commence Horizontal Drilling

FOR: PULSE OIL CORP.
TSX VENTURE SYMBOL: PUL

Date issue: May 03, 2017
Time in: 9:25 AM e

Attention:

CALGARY, ALBERTA–(Marketwired – May 3, 2017) –

NOT FOR DISTRIBUTION TO UNITED STATES NEWSWIRE SERVICES OR FOR DISSEMINATION IN
THE UNITED STATES

Pulse Oil Corp. (“Pulse” or the “Company”) (TSX VENTURE:PUL) announces that
Pulse has signed two new agreements with arms-length parties to acquire
independently assessed proven producing oil and gas reserves in Alberta. These
latest acquisitions meet Pulse’s criteria of acquiring low-risk, low-cost
producing assets with drilling and enhanced oil recovery upside at attractive
prices, the details of which are summarized immediately below.

OVERVIEW OF OIL & GAS ASSETS:
Pulse’s summary of key oil and gas asset details as of closing of the
acquisitions and financing are as follows and are described on a BOE basis.

/T/

—————————————————————————-

Projected
Net BOE/Day Proved and
Property Production: in 8 to 12 Proved Probable
Description BOE/Day Months (“1p”)(4) (“2p”)(4)
—————————————————————————-
Mannville SA 100 850 529,000 (3) 1,031,000 (3)
—————————————————————————-
Whiskey Creek
(5) 85 350 267,000 (2) 329,000 (2)
—————————————————————————-
Bigoray (5) 35 250 464,000 (1) 695,000 (1)
—————————————————————————-
Total 220 1,450 1,260,000 2,055,000
—————————————————————————-

————————————————————-

Proved and
Property Proved: Probable: Net
Description NPV10(4) NPV10(4) Acreage
————————————————————-
Mannville SA $1,171,000 (3) $5,524,000 (3) 30,878
————————————————————-
Whiskey Creek
(5) $3,506,400 (2) $4,184,500 (2) 43,424
————————————————————-
Bigoray (5) $4,058,800 (1) $6,161,800 (1) 7,276
————————————————————-
Total $8,736,200 $15,870,300 81,578
————————————————————-
(1) Bigoray independent reserve evaluation completed by McDaniel &
Associates Consultants Ltd. (“McDaniel”) effective December 31, 2016.
(2) Whiskey Creek independent reserve evaluation completed by McDaniel &
Associates Consultants Ltd. effective July 1, 2016.
(3) Mannville SA independent reserve evaluation completed by Sproule
Associates Limited effective February 28, 2017.
(4) Reserve estimates for each independent reserve evaluation report have
been prepared by a qualified reserve evaluator in accordance with NI 51-101.
The total net present values (NPV10) presented in the above table are before
tax and are based on different effective dates as noted and NPV10’s do not
represent the fair market value of the reserves.
(5) NPV10’s use forecast pricing and costs based on the opinion of the
independent reserve evaluator of the future crude oil, natural gas and
natural gas product prices on the effective date of the reserve evaluation
and escalate annually at a rate of 2% per year, in Canadian dollars. The
forecast of commodity prices used in for Whiskey Creek and Bigoray can be
found at http://www.mcdan.com/priceforecast and for Mannville SA at
https://www.sproule.com/insights/sproule-price-forecasts/forecast-archive.

/T/

For a further breakdown of reserves, per property, please see the detailed
table provided below.

Garth Johnson, CEO of Pulse Oil Corp. stated, “We are excited to be making
these impactful acquisitions. These assets provide economical entries into low
risk, producing fairways in Alberta, while meeting our criteria of adding
producing assets, immediate cash flow and low-risk, low-cost opportunities to
increase shareholder value substantially through drilling, technology,
optimization and enhanced oil recovery.”

Specific details of Pulse’s current assets (Bigoray) and our latest agreements
to acquire two more strategic assets (Mannville SA and Whiskey Creek) are
described below. The acquisitions are subject to receipt of TSX Venture
Exchange approval.

Mannville SA: Pulse signed a definitive agreement with an arms-length private
company incorporated in the Province of Alberta to acquire these 100% owned and
operated assets that consist of proved and probable reserves of 1,031,000 BOE
(NPV10: $5,524,000) and approximately 100 BOE/D of current production within
30,878 net acres of land. The assets contain a minimum of 20 drill-ready
horizontal Mannville locations identified within established oil pools. The
Mannville formation is known as a prolific producing formation with strong
initial production rates and long-life predictable production. Pulse is excited
by this opportunity to increase production with costs less than $1.5 million
per well, drilled, completed and tied in. Pulse feels the low-risk nature of
these producing assets, when combined with the upside potential of low-cost
horizontal drilling operations, will allow Pulse to grow in strength and size
quickly without significant risk to our shareholders.

In addition to the large inventory of existing Mannville drilling locations,
Pulse plans to utilize its 3D seismic data base to expand its horizontal
drilling inventory in the Mannville, as well as further delineate identified
opportunities in the Ellerslie, Pekisko/Shunda and Nisku formations.

The purchase price of the Mannville SA asset is $1.71 million, payable with
$1.35 million in cash and 3 million in shares of Pulse at a deemed issue price
of $0.12, amounting to $360,000, and equalling the closing offering price of
the Subscription Receipts in the Financing (see below for details).

Whiskey Creek: The Whiskey Creek light oil and gas assets average +60% working
interest throughout the Red Earth area of Alberta, as well as sweet gas upside
in the Whiskey Creek area of Southern Alberta. The assets contain proved and
probable reserves of 329,000 BOE (NPV10: $4,184,500) and approximately 85 BOE/d
of production. Pulse is enthusiastic about upside associated with the Whiskey
Creek assets, including the opportunity for low risk uphole completions in
current wells, re-activations and work-overs in dozens of proven producing
wells, and infrastructure optimization, all contributing to increasing
production and cash-flow immediately after closing the acquisition. The Whiskey
Creek assets cover 43,424 acres of land, offering Pulse the opportunity to
further delineate and develop these assets for years to come, while current
production and early stage production increases offer long-life reserves and
steady production/cash-flow to fund future operations.

The purchase price for the Whiskey Creek assets is $1.2 million paid with 10
million common shares of Pulse at closing at a deemed price per share equal to
the offering price of the Subscription Receipts in the Financing (see below for
details).

Bigoray: Pulse acquired a 50% interest in Bigoray in February 2017 upon
completion of its qualifying transaction. The Bigoray light-oil assets appealed
to Pulse due to strong immediate cash flow, large proved reserves and
high-working interest upside. Currently the assets are waiting on a capital
injection to restart behind-pipe production in existing wells, increasing
production quickly in the Cardium, Pekisko and Nisku light oil formations along
with the Mannville gas pools. Pulse anticipates early-stage operations to
increase production from approximately 35 BOE/D net to Pulse, to approximately
250 BOE/D net once proven, producing wells are placed back into production.

In the medium-term, Pulse is also excited about the opportunity to increase
reserves, production and cash-flow by utilizing proven enhanced oil recovery
technology in two producing Nisku Pinnacle Reefs (“NPR’s”) contained within the
Bigoray assets. With approximately 50 offsetting NPR’s surrounding Pulse’s
Bigoray assets having recovered an average of 80% of petroleum initially in
place (“PIIP”), Pulse plans to implement the same enhanced oil recovery (EOR)
technology in their two working interest NPR’s which have averaged only 35%
recovery to date. The Bigoray assets provide Pulse a substantial opportunity to
expand reserves and production materially, without significant risk.

The purchase price for the 50% interest in the Bigoray assets included an
initial payment of $750,000 at closing, with a commitment should Pulse wish to
retain a 50% interest in the Bigoray assets by paying $3 million in capital
costs to conduct recompletions work focused on restarting behind-pipe
production. To date, Pulse, in alignment with the capital commitment timing in
the purchase and sale agreement, has paid an additional $250,000, with plans to
pay $1 million in capital work commitments by June 30, 2017 and $1.75 million
in work commitments on September 29, 2017. Pulse also holds an option until
October 20, 2017, to buy the remaining 50% of the Bigoray assets for $4.25
million, after increasing production and cashflow from the assets from the
planned work program.

More data and videos related to the Bigoray Assets are available at Pulse’s
website at www.pulseoilcorp.com.

OVERVIEW OF FINANCING AND USE OF PROCEEDS:
Proposed Financing (“Financing”): Pulse has entered into an agreement with
Mackie Research Capital Corporation (“MRCC”) to act as lead agent to raise, on
a best-efforts private placement basis, gross proceeds of up to $8.0 million.

The Financing will consist of up to $4.4 million in subscription receipts
(“Subscription Receipts”) to be issued at a price of $0.12 each. The purchasers
of the Subscription Receipts will automatically receive, for no additional
consideration and without any action on their part, for every Subscription
Receipt held, one unit of Pulse (a “Unit”) comprised of one common share of the
Company (a “Unit Common Share”) and one common share purchase warrant (each a
“Warrant”). Each Warrant will entitle the holder to acquire one common share (a
“Warrant Share”) at an exercise price of $0.17 per share for a period of 24
months following closing of the Financing.

In addition to the Subscription Receipts financing outlined above, Pulse will
also be offering up to $3.6 million in flow-through units (“Flow-Through
Units”) to be issued at a price of $0.13 per Flow-Through Unit. Each
Flow-Through Unit shall consist of one common share to be issued on a “flow
through” basis pursuant to the Income Tax Act (Canada) (“Flow-Through Shares”)
and one Warrant Share (also exercisable at an exercise price of $0.17 per share
for a period of 24 months).

MRCC will have an option (the “Over-Allotment Option”) to offer up to an
additional 15% in Subscription Receipts prior to closing of the Financing. MRCC
will have no obligation whatsoever to exercise the Over-Allotment Option, in
whole or in part.

Members of the board, management, insiders and certain accredited investors
plan to participate in this private placement financing alongside investors for
up to $700,000, including Pulse’s CEO participating for approximately $200,000.

The gross proceeds from the sale of Subscription Receipts pursuant to the
Financing will be held in escrow pending completion of the strategic
acquisitions described above. If the strategic acquisitions are completed at or
before 5:00 p.m. (Toronto time) on the date which is 120 days after the closing
of the Financing, the net proceeds from the sale of the Subscription Receipts
will be released from escrow to the Company. If the strategic acquisitions are
not completed by 5:00 p.m. (Toronto time) within 120 days after the closing of
the Financing then the purchase price for the Subscription Receipts will be
returned pro rata to the subscribers, together with a pro rata portion of
interest earned on the escrowed funds.

The Company will use commercially reasonable efforts to obtain the necessary
approvals to list the Flow-Through Shares, the Unit Common Shares, the Warrants
and the Warrant Shares on the TSX Venture Exchange. All securities issued in
the Financing will be subject to a four month hold period from the date of
closing of the Financing.

For each Flow-Through Share, the Company will covenant to incur and renounce to
the subscriber, for the fiscal year ended December 31, 2017, qualifying
“Canadian exploration expenses” within the meaning of the Income Tax Act
(Canada) in an amount equal to the purchase price of the Flow-Through Unit.

The use of proceeds in respect of the Financing alongside the reinvestment of
the Company’s increasing cash flows over the next 12 months focuses exclusively
on low-risk operations to complete the acquisitions of the Bigoray and
Mannville SA assets, increase production and cash flow immediately and fund the
initial horizontal drilling operations in the Mannville Formation as follows:

/T/

—————————————————————————-

Without
Warrants Warrants
Planned Use of Proceeds Exercised(1) Exercised(2)
—————————————————————————-
Mannville SA:
—————————————————————————-
Purchase price $ 1,350,000 $ 1,350,000
—————————————————————————-
Drilling of up to three Mannville
horizontal wells $ 4,500,000 $ –
—————————————————————————-
Drilling of up to six Mannville
horizontal wells $ 9,000,000
—————————————————————————-
Bigoray:
—————————————————————————-
Exercise option to buy 100% of Bigoray $ – $ 4,250,000
—————————————————————————-
Purchase price capex for recompletions
and re-start production $ 2,750,000 $ 2,750,000
—————————————————————————-
Preparation for enhanced oil recovery
project $ – $ 250,000
—————————————————————————-
Whiskey Creek:
—————————————————————————-
Reactivations, production optimization
and workovers $ 500,000 $ 500,000
—————————————————————————-
Uphole recompletions to bring on
behind pipe production $ 700,000 $ 700,000
—————————————————————————-
General Corporate Purposes $ 310,000 $ 1,375,744
—————————————————————————-
Total Use of Proceeds: $ 10,110,000 $ 20,175,744
—————————————————————————-
(1) Assuming $8,000,000 raised via Financing, less fees, cash flow of
approx. $3,000,000 from operations and no Warrant proceeds.
(2) Assuming $8,000,000 raised via Financing, less fees, cash flow of
approx. $3,000,000 from operations and Warrant proceeds of $10,941,026 less
fees.

/T/

The Subscription Receipts and Flow-Through Units will be offered in all
provinces of Canada other than Quebec. Completion of the Financing is subject
to certain closing conditions, including the receipt of all necessary approvals
of the TSX Venture Exchange. Subject to satisfaction or waiver of all such
conditions, closing of the Financing is expected to occur on or about May 29,
2017.

DETAILED BREAKDOWN OF OIL & GAS ASSETS:
Pulse’s summary of key oil and gas asset details as of closing of the
acquisitions and financing are as follows and are described in detail below and
are prepared on a BOE basis:

/T/

—————————————————————————-

Proved
Proved Developed Total
Property Developed Non- Proved Proved and
Description Producing Producing Undeveloped Probable Probable
—————————————————————————-
Mannville SA:
—————————————————————————-
Light and Medium
Oil 13,700 – 144,900 174,700 333,300
—————————————————————————-
Natural Gas 93,167 – 207,667 266,500 567,334
—————————————————————————-
NGL 21,500 – 48,000 61,600 131,100
—————————————————————————-
Total: (3) 128,367 – 400,567 502,800 1,031,734
—————————————————————————-

—————————————————————————-
Whiskey Creek:
—————————————————————————-
Light and Medium
Oil 182,100 58,800 – 28,300 269,200
—————————————————————————-
Natural Gas 24,100 – – 30,600 54,700
—————————————————————————-
NGL 2,100 – – 3,000 5,100
—————————————————————————-
Total: (2) 208,300 58,800 – 61,900 329,000
—————————————————————————-

—————————————————————————-
Bigoray:
—————————————————————————-
Light and Medium
Oil – 259,000 – 61,000 320,000
—————————————————————————-
Heavy Oil – 13,000 99,100 112,100
—————————————————————————-
Natural Gas 15,367 123,283 – 51,717 190,367
—————————————————————————-
NGL 8,800 44,600 – 19,100 72,500
—————————————————————————-
Total: (1) 24,167 439,883 – 230,917 694,967
—————————————————————————-
(1) Bigoray independent reserve evaluation completed by McDaniel &
Associates Consultants Ltd. effective December 31, 2016.
(2) Whiskey Creek independent reserve evaluation completed by McDaniel &
Associates Consultants Ltd. effective July 1, 2016.
(3) Mannville SA independent reserve evaluation completed by Sproule
Associates Limited effective February 28, 2017.

/T/

Reserve estimates for each independent reserve evaluation report have been
prepared by a qualified reserve evaluator in accordance with NI 51-101. The
totals presented in the above table are based on different effective dates and
therefore may not be representative of the assets in total.

For further information on Pulse please visit www.sedar.com or
www.pulseoilcorp.com.

About Pulse Oil Corp.
Pulse is a Canadian company incorporated on September 17, 2012 under the
Business Corporation Act of Alberta and has plans to become a leading oil and
gas company. Pulse will focus on acquiring affordable, small to medium sized
proven oil and gas assets with significant upside. The Company plans to achieve
further growth through low-risk, technically diligent drilling, infrastructure
ownership and reserve growth utilizing new technology and proven enhanced oil
recovery techniques.

Neither the TSX Venture Exchange, Inc. nor its Regulation Service Provider (as
that term is defined under the policies of the TSX Venture Exchange) has in any
way passed upon the merits of the Proposed Acquisition and associated
transactions and has neither approved nor disapproved of the contents of this
press release.

READER ADVISORY

This press release contains forward-looking information including but not
limited to the expected completion of the Financing and the planned use of
proceeds of the Financing.. Forward-looking information involves known and
unknown risks, uncertainties, assumptions and other factors that may cause
actual results or events to differ materially from those anticipated in such
forward-looking information. The forward-looking statements contained in this
press release are made as of the date hereof and the Company undertakes no
obligations to update publicly or revise any forward-looking statements or
information, whether as a result of new information, future events or
otherwise, unless so required by applicable securities laws.

Barrels of oil equivalent (boe) is calculated using the conversion factor of 6
mcf (thousand cubic feet) of natural gas being equivalent to one barrel of oil.
Boes may be misleading, particularly if used in isolation. A boe conversion
ratio of 6 mcf:1 bbl (barrel) is based on an energy equivalency conversion
method primarily applicable at the burner tip and does not represent a value
equivalency at the wellhead. Given that the value ratio based on the current
price of crude oil as compared to natural gas is significantly different from
the energy equivalency of 6:1, utilizing a conversion on a 6:1 basis may be
misleading as an indication of value.

This press release does not constitute and the subject matter hereof is not, an
offer for sale or a solicitation of an offer to buy, in the United States or to
any “U.S Person” (as such term is defined in Regulation S under the U.S.
Securities Act of 1933, as amended (the “1933 Act”)) of any equity or other
securities of Pulse Oil Corp. The securities of Pulse Oil Corp. have not been
registered under the 1933 Act and may not be offered or sold in the United
States (or to a U.S. Person) absent registration under the 1933 Act or an
applicable exemption from the registration requirements of the 1933 Act.

– END RELEASE – 03/05/2017

For further information:
Pulse Oil Corp.
Garth Johnson
CEO
(604) 306-4421
[email protected]
OR
Drew Cadenhead
President and COO
(403) 714-2336
[email protected]

COMPANY:
FOR: PULSE OIL CORP.
TSX VENTURE SYMBOL: PUL

INDUSTRY: Energy and Utilities – Oil and Gas
RELEASE ID: 20170503CC0054

Press Release from Marketwired 1-866-736-3779

All press releases are written by the client and have NO affiliation with the news copy written by The Canadian Press. Any questions that arise due to the content or information provided in the press release should be directed to the company/organization
issuing the release, not to The Canadian Press.

GET ENERGYNOW’S DAILY EMAIL FOR FREE


Brookfield Renewable Reports First Quarter Results

FOR: BROOKFIELD RENEWABLE PARTNERS L.P.TSX SYMBOL: BEP.UNNYSE SYMBOL: BEPDate issue: May 03, 2017Time in: 6:45 AM eAttention:
BROOKFIELD, NEWS–(Marketwired – May 3, 2017) –
All amounts in US dollars unless otherwise indicated
Brookfield Renewable Par…

GET ENERGYNOW’S DAILY EMAIL FOR FREE


Fraser Institute Media Advisory: Why do carbon taxes not work as expected across Canada? New study coming Thursday, May 4

FOR: THE FRASER INSTITUTE
Date issue: May 03, 2017Time in: 5:00 AM eAttention:
CALGARY, AB –(Marketwired – May 03, 2017) – On Thursday, May 4, the Fraser
Institute will release a new study examining carbon taxes and cap-and-trade
systems in Canada.

GET ENERGYNOW’S DAILY EMAIL FOR FREE


"So What Are Your Salary Expectations?" – Navigating the Uncomfortable Conversation – Wendy Ferguson – BHRLR, CPHR

          By Wendy Ferguson – BHRLR, CPHR – Ferguson HR Consulting In the current oil patch job market there are a number of companies hiring and some are even having challenges hiring enough qualified personnel. For job seekers, that’s the good news. For those fortunate enough to get to the interview … Read more

GET ENERGYNOW’S DAILY EMAIL FOR FREE


The Latest: Gas leak from abandoned pipe caused fatal blast

FIRESTONE, Colo. — The Latest on a fatal house explosion in northern Colorado (all times local):

2:50 p.m.

Fire officials say a fatal house explosion in northern Colorado was caused by unrefined natural gas that was leaking from a small abandoned pipeline from a nearby well.

Ted Poszywak, chief of the Frederick-Firestone fire department, said Tuesday the April 17 explosion in Firestone that killed two people and left another badly burned happened when the odourless gas in the old line, which had been cut, leaked into the soil and made its way into the home’s basement.

Investigators do not know how or when the small pipe was cut. The house was within 200 feet (60 metres) of the well, and the pipeline was buried about 7 feet (2.1 metres) underground.

The well was drilled in 1993, and the house and others nearby were built later.

Firestone is about 30 miles (48.2 kilometres) north of Denver.

___

10:50 a.m.

Firefighters are planning to discuss their investigation into a fatal house explosion near a gas well in Colorado.

Investigators scheduled a news conference for Tuesday on the April 17 explosion in Firestone that killed two people and left another badly burned.

The house was within 200 feet (60 metres) of a well, but investigators haven’t yet said whether the well was involved.

State regulators planned to test the soil for evidence of underground leaks from the well but haven’t released the results.

The well was drilled in 1993 and the house and others nearby were built later.

The state regulates the distance between new wells and existing homes, but local governments control how close new houses can be built to existing wells. In Firestone, the requirement is 150 feet.

The Associated Press

GET ENERGYNOW’S DAILY EMAIL FOR FREE


B.C. First Nation begins social media campaign against Kinder Morgan expansion

VANCOUVER — A British Columbia First Nation hopes selfies and social media will add clout to its battle against the planned expansion of an oil pipeline.

The Tsleil-Waututh Nation has erected a billboard near downtown Vancouver that proclaims “I’m Another Voter Against the Pipeline.”

It invites supporters to take a selfie in front of the board and post it online as voters in British Columbia get ready to head to the polls on May 9.

Tsleil-Waututh spokeswoman Charlene Aleck says posters with the same message have been sent around the province and a bus shelter version of the billboard is set up in north Burnaby.

She says the selfie campaign is a unique way to harness the power of social media and illustrates the extent of opposition to Kinder Morgan’s expansion plans for its Trans Mountain pipeline.

Kinder Morgan plans to triple the capacity of its 1,150-kilometre pipeline running from Alberta to a terminal in Burnaby. 

The $6.8-billion expansion will dramatically increase the number of oil tankers moving through Burrard Inlet and Georgia Strait, raising concerns of the Tsleil-Waututh, whose lands border those waterways.

“This campaign gives everyone the ability to make it clear that we all have a right to care and a right to be heard,” says Aleck.

“Social media makes it easy for us to remind our friends and neighbours that we can make a difference on May 9th.”

Selfies taken using the new billboard campaign can be viewed on the Tsleil-Waututh Nation Sacred Trust Facebook page.

The Canadian Press

GET ENERGYNOW’S DAILY EMAIL FOR FREE


STEP Energy Services raises $100 million in IPO, half of initial target

CALGARY — STEP Energy Services (TSX:STEP) says it has raised $100 million in an initial public offering, falling short of the $200 million target it set out earlier this year.

The offering illustrates how even with Canadian oil and gas services producers recovering from a two-year crude price crash, accessing capital markets can be a struggle.

Last month, Source Energy Services (TSX:SHLE) went public in the first major energy company IPO since October 2014, suggesting markets were thawing. But Source also scaled back its plans, closing a $175-million IPO after initially aiming to raise about $300 million.

STEP had hoped to sell its shares for between $14 and $16, according to its preliminary prospectus filed in February.

However, its adjusted prospectus filed last week set the price at $10 per share. The stock ended the session on Tuesday at $9.95.

Step offers a range of well completion services, while Source is one of the largest suppliers of speciality sand to Canada’s well fracking industry.


The Canadian Press

GET ENERGYNOW’S DAILY EMAIL FOR FREE


Strata-X Disposes of Non-Core Wyoming Asset

FOR: STRATA-X ENERGY LTD.TSX VENTURE Symbol: SXEASX Symbol: SXADate issue: May 02, 2017Time in: 7:30 PM eAttention:
DENVER, CO and BRISBANE, AUSTRALIA and VANCOUVER, BC –(Marketwired – May 02,
2017) – The directors and management of Strata-X Energy …

GET ENERGYNOW’S DAILY EMAIL FOR FREE


Exito Energy II Inc. and Good Life Networks Inc. Receive TSXV Conditional Approval for Qualifying Transaction and Mail Meeting Materials

FOR: EXITO ENERGY II INC.TSX VENTURE SYMBOL: EXI.PDate issue: May 02, 2017Time in: 6:09 PM eAttention:
CALGARY, ALBERTA–(Marketwired – May 2, 2017) –
THIS PRESS RELEASE IS NOT FOR PUBLICATION OR DISSEMINATION IN THE UNITED
STATES. FAILURE TO COMPLY W…

GET ENERGYNOW’S DAILY EMAIL FOR FREE


Pengrowth Delivers Transformational Debt Reduction in First Quarter Driven by Asset Sales

FOR: PENGROWTH ENERGY CORPORATION
TSX SYMBOL: PGF
NYSE SYMBOL: PGH

Date issue: May 02, 2017
Time in: 6:08 PM e

Attention:

CALGARY, ALBERTA–(Marketwired – May 2, 2017) – Pengrowth Energy Corporation
(TSX:PGF)(NYSE:PGH) is pleased to announce its first quarter 2017 operating
results, a substantial reduction in outstanding debt, significant asset sales
and further reductions in its cost structures.

Since the start of 2017 Pengrowth has closed or expects to close $707 million
of asset sales, which when combined with the $287 million of cash on hand at
year end 2016, represents a net debt reduction of nearly $1.0 billion or
approximately 60 percent of December 31, 2016 debt, while only reducing the
Company’s Proven and Probable reserves as of December 31, 2016 by approximately
11 percent. This significant level of debt reduction should enable Pengrowth to
either replace existing debt with new debt that has less restrictive covenants
or renegotiate the terms of the remaining existing debt, which would allow
Pengrowth to pursue the expansion of Lindbergh.

Derek Evans, President and Chief Executive Officer of Pengrowth commented, “We
are delighted by the progress that we have made on reducing our debt and
strengthening our balance sheet. Our efforts and results to date have been
transformational for Pengrowth and have put us on a path to either renegotiate
or refinance our remaining term debt into a new structure that should allow for
the flexibility to develop the second phase of our world class Lindbergh
thermal asset.”

Highlights:

/T/

— Reduced total debt before working capital by $535 million through the

prepayment of US $300 million of the US $400 million 6.35 percent senior
notes due July 26, 2017 (“6.35 percent Notes”) and the payment on
maturity of $126.6 million of outstanding convertible debentures on
March 31, 2017.
— Entered into an agreement to sell a portion of its Swan Hills assets in
north central Alberta for total cash consideration of $180 million,
before customary adjustments.
— Sold its non-producing Montney lands at Bernadet in north east British
Columbia for cash consideration of $92 million, with the transaction
closing on April 11, 2017.
— Subsequent to quarter end, entered into an agreement to sell the
remainder of its Swan Hills assets in north central Alberta for total
cash consideration of $185 million, before customary adjustments.
— Achieved additional expense reductions in the quarter with operating and
general and administrative expenses down $9.5 million and $3.1 million,
respectively, from the first quarter of 2016.
— Reduced expected interest expense, on an annualized basis, by more than
$65 million per year with the debt payments completed in the quarter,
coupled with the expected additional debt reduction resulting from the
closing of the Swan Hills dispositions.
— Achieved average daily production of 52,957 barrels of oil equivalent
(boe) per day during the quarter.
— Realized a 256 percent increase in combined operating netbacks before
commodity risk management, of $17.18 per boe compared to $4.82 per boe
in the same period last year.

/T/

Operations

Pengrowth achieved first quarter average daily production of 52,957 boe per
day, compared to average daily production of 62,056 boe per day in the first
quarter of 2016. The decrease in production year over year can be attributed to
the absence of volumes from property divestments, additional shut-in natural
gas volumes and natural declines, as well as the absence of a condensate
shipment from the Sable Offshore Energy Project in the quarter.

Performance from the Company’s Lindbergh thermal project continues to exceed
nameplate capacity with production in the quarter averaging 14,865 barrels
(bbl) per day at an average steam oil ratio of 2.57 times. Production in the
quarter was impacted by the Phase One well pairs commencing their expected
natural decline after having been on production for over 24 months. Pengrowth
has not drilled any new well pairs into the project in the last two years, and
the Company expects production will decline over the year until the new well
pairs associated with the Phase One optimization program begin steaming later
this year.

During the quarter, the Phase One optimization program commenced with $13.7
million of capital being put to work drilling infill and observation wells as
well as related surface and facility construction. It is anticipated that a
total of seven new SAGD well pairs will be drilled over the next two quarters,
with first production expected by the end of the year.

In addition to Phase one optimization expenditures and activities, ongoing
engineering and design work relating to the second expansion phase was carried
out in the quarter. Pengrowth anticipates having 70 percent of the engineering
and design work complete by the end of year and to be ready to execute on Phase
Two as funds become available.

Financial Results

The Company delivered first quarter funds flow from operations of $26.9 million
($0.05 per share), compared to funds flow of $106.2 million ($0.20 per share)
for the same period in 2016. The decrease in funds flow year over year was
primarily due to the absence of significant hedging gains realized in the first
quarter of 2016 coupled with lower production volumes year over year and a
realized hedging loss in the first quarter of 2017. Pengrowth realized $127.0
million of hedging gains in the first quarter of 2016 from its risk management
program, which had a higher fixed volume and higher fixed price point on the
contracts compared to the first quarter of 2017. Offsetting this were higher
realized prices during the first quarter of 2017 compared to the same period in
2016 due to material improvements in both crude oil and natural gas benchmark
prices. The result of which led to a 256 percent increase in operating
netbacks, before the impacts of commodity risk management, of $17.18 per boe in
the first quarter of 2017 compared to $4.82 per boe in the first quarter of
2016.

Financial Resources and Liquidity

A key focus for Pengrowth in 2017 continues to be on improving the health and
strength of its balance sheet. The Company reduced its total debt by $535
million through the prepayment of US $300 million of its 6.35 percent Notes and
the redemption of $126.6 million of convertible debentures at maturity.
Following these payments, Pengrowth’s total debt at March 31, 2017 amounted to
$1.15 billion compared to $1.68 billion at December 31, 2016. On April 26,
2017, the Company gave notice of prepayment to the holders of its remaining
6.35 percent Notes that it intends to prepay the US $100 million of Notes on
June 2, 2017.

Following the debt repayments by March 31, 2017, Pengrowth’s ratio of trailing
twelve month senior debt to Adjusted EBITDA decreased to 2.5 times from 3.1
times at December 31, 2016. Pengrowth projects it will remain on side of its
financial covenants through 2017 and 2018 using certain assumptions. The key
assumptions used in the projection include an improvement in West Texas crude
oil to US $60 per barrel by the third quarter of 2017, closing of the two
announced Swan Hills dispositions by May 31, 2017 and using the cash proceeds
to prepay the 2017 and 2018 unsecured notes. To provide additional financial
flexibility, Pengrowth is considering accessing the capital markets before the
end of third quarter of 2017 to replace existing debt with less restrictive
high yield debt, or renegotiating the terms of the remaining existing debt.
This financial flexibility together with proceeds from any additional asset
dispositions could be used towards the funding of the Lindbergh expansion and
other capital projects.

The vast majority of Pengrowth’s long term debt and interest payments are
denominated in US dollars and, as such, are subject to fluctuations in the
exchange rate between the Canadian and US dollars. Pengrowth manages this
foreign exchange exposure through swap contracts on the majority of its
outstanding foreign denominated notes. At March 31, 2017 Pengrowth held US $620
million of swap contracts at a weighted average exchange rate of Cdn $0.75/US
$1.00.

Risk Management

At the end of the quarter, Pengrowth elected to close out its 2017 oil risk
management contracts at a cost of $12.7 million and at this time has no oil
risk management contracts in place. The liquidated contracts had an average
hedge value that was below current prices and resulted in a loss to Pengrowth
in the first quarter. The Company also entered into new natural gas risk
management contracts in the quarter to provide downside protection against
potential declines in natural gas prices. A complete summary of Pengrowth’s
commodity risk management contracts in place as at March 31, 2017 for the
remainder of 2017 is provided in the table below:

/T/

————————————
Natural Gas Q2 2017 Q3 2017 Q4 2017
—————————————————————————-
Volumes (MMcf/d) 58.3 58.3 22.8
—————————————————————————-
Fixed AECO price (Cdn$/Mcf) $2.72 $2.72 $2.82
—————————————————————————-

/T/

Dispositions

Since late 2016, the Company has announced a number of transactions, including
the recent agreements to sell its Swan Hills assets in north central Alberta
and its non-producing Montney lands at Bernadet in north east British Columbia.
The total cash proceeds from the announced dispositions amounts to $707 million
and Pengrowth anticipates using the proceeds from these sales towards debt
reduction. When combined with the $287 million of cash on hand that the Company
had at December 31, 2016, the Company’s total debt will be reduced by
approximately $1.0 billion since year end 2016. A summary of the asset
disposition transactions entered into or closed since year end is provided in
the following table:

/T/

——————————————————
Proceeds Expected or Actual
Announcement Date ($ million) Closing Date
—————————————————————————-
Lindbergh GORR December 14, 2016 $250 January 6, 2017
—————————————————————————-
First Swan Hills
package March 20, 2017 $180 May 31, 2017
—————————————————————————-
Bernadet Lands March 23, 2017 $92 April 11, 2017
—————————————————————————-
Second Swan Hills
package April 25, 2017 $185 May 31, 2017
—————————————————————————-
Total gross proceeds $707
———————————————————-

/T/

Outlook

In 2017 the Company has achieved substantial success in selling assets,
substantially reducing debt and improving the strength of the balance sheet.
The announced asset sales and associated delevering of the balance sheet will
allow Pengrowth to focus on its key core assets at Lindbergh and Groundbirch.

The Company remains in discussions with lenders of its syndicated bank facility
and with the holders of its senior term notes to achieve the financial
flexibility it needs to move forward with the development of the next expansion
phase of its Lindbergh thermal project.

Analyst call

Pengrowth will host an analyst call and listen-only audio webcast beginning at
6:30 A.M. Mountain Daylight Time (MDT) on Wednesday, May 3, 2017, during which
management will review Pengrowth’s first quarter results and respond to
questions from the analyst community.

To ensure timely participation in the teleconference, callers are encouraged to
dial in 10 minutes prior to the start of the call to register.

/T/

Dial-in numbers:

Toll free: (844) 358-9179 or International: (478) 219-0186
Live listen only audio webcast: http://edge.media-server.com/m/p/n587h8ip

/T/

Pengrowth’s unaudited Financial Statements for the three months ended March 31,
2017 and related Management’s Discussion and Analysis can be viewed on
Pengrowth’s website at www.pengrowth.com. They have also been filed on SEDAR at
www.sedar.com and on EDGAR at www.sec.gov/edgar

About Pengrowth:

Pengrowth Energy Corporation is a Canadian intermediate energy company focused
on the sustainable development and production of oil and natural gas in Western
Canada. The Company is headquartered in Calgary, Alberta, Canada and has been
operating in the Western basin for over 28 years. The Company’s shares trade on
both the Toronto Stock Exchange under the symbol “PGF” and on the New York
Stock Exchange under the symbol “PGH”.

PENGROWTH ENERGY CORPORATION

Derek Evans
President and Chief Executive Officer

Currency:

All amounts are stated in Canadian dollars unless otherwise specified.

Caution Regarding Engineering Terms:

When used herein, the term “boe” means barrels of oil equivalent on the basis
of one boe being equal to one barrel of oil or NGLs or 6,000 cubic feet of
natural gas (6 mcf: 1 bbl). Barrels of oil equivalent may be misleading,
particularly if used in isolation. A conversion ratio of six mcf of natural gas
to one boe is based on an energy equivalency conversion method primarily
applicable at the burner tip and does not represent a value equivalency at the
wellhead. All production figures stated are based on Company Interest before
the deduction of royalties.

Caution Regarding Forward Looking Information:

This press release contains forward-looking statements within the meaning of
securities laws, including the “safe harbour” provisions of the Canadian
securities legislation and the United States Private Securities Litigation
Reform Act of 1995. Forward-looking information is often, but not always,
identified by the use of words such as “anticipate”, “believe”, “expect”,
“plan”, “intend”, “forecast”, “target”, “project”, “guidance”, “may”, “will”,
“should”, “could”, “estimate”, “predict” or similar words suggesting future
outcomes or language suggesting an outlook. Forward-looking statements in this
press release include, but are not limited to: plans to use disposition
proceeds to reduce indebtedness; approximately $1.0 billion of debt reduction
or 60 percent since December 31, 2016 by the end of the second quarter;
significant debt reduction allowing the company to renegotiate or refinance
remaining term debt which would allow the development of the second phase of
Lindbergh; anticipated sale proceeds for Swan Hills assets and the timing of
receipt thereof; anticipated interest savings from debt repayments; Lindbergh
thermal project continuing to exceed nameplate capacity; anticipated drilling
of seven new well pairs at Lindbergh with first production expected by the end
of the year; anticipation of having 70 percent of Lindbergh Phase Two design
work completed by the end of the year; continued focus on improving financial
strength and liquidity; anticipated prepayment of US $100 million of term notes
on June 2, 2017; forecasts regarding not violating financial covenants in 2017
or 2018 and the assumptions relied upon in such forecasts; consideration of
accessing the capital markets in 2017 to replace existing term debt or
renegotiate the covenants in such debt; hedging contracts in place; anticipated
disposition proceeds and debt repayment; focus on Lindbergh and Groundbirch
properties and ongoing discussions with lenders in an effort to achieve needed
financial flexibility. Forward-looking statements and information are based on
current beliefs as well as assumptions made by and information currently
available to Pengrowth concerning anticipated financial performance, business
prospects, strategies and regulatory developments. Although management
considers these assumptions to be reasonable based on information currently
available to it, they may prove to be incorrect.

By their very nature, forward-looking statements involve inherent risks and
uncertainties, both general and specific, and risks that predictions,
forecasts, projections and other forward-looking statements will not be
achieved. We caution readers not to place undue reliance on these statements as
a number of important factors could cause the actual results to differ
materially from the beliefs, plans, objectives, expectations and anticipations,
estimates and intentions expressed in such forward-looking statements. These
factors include, but are not limited to: changes in general economic, market
and business conditions; the volatility of oil and gas prices; fluctuations in
production and development costs and capital expenditures; the imprecision of
reserve estimates and estimates of recoverable quantities of oil, natural gas
and liquids; Pengrowth’s ability to replace and expand oil and gas reserves;
geological, technical, drilling and processing problems and other difficulties
in producing reserves; environmental claims and liabilities; incorrect
assessments of value when making acquisitions; increases in debt service
charges; the loss of key personnel; the marketability of production; defaults
by third party operators; unforeseen title defects; fluctuations in foreign
currency and exchange rates; fluctuations in interest rates; inadequate
insurance coverage; compliance with environmental laws and regulations; actions
by governmental or regulatory agencies, including changes in tax laws;
Pengrowth’s ability to access external sources of debt and equity capital; the
impact of foreign and domestic government programs and the occurrence of
unexpected events involved in the operation and development of oil and gas
properties. Further information regarding these factors may be found under the
heading “Business Risks” in our most recent management’s discussion and
analysis and under “Risk Factors” in our Annual Information Form dated February
28, 2017.

The foregoing list of factors that may affect future results is not exhaustive.
When relying on our forward-looking statements to make decisions, investors and
others should carefully consider the foregoing factors and other uncertainties
and potential events. Furthermore, the forward-looking statements contained in
this press release are made as of the date of this press release, and Pengrowth
does not undertake any obligation to update publicly or to revise any of the
included forward-looking statements, whether as a result of new information,
future events or otherwise, except as required by applicable laws. The
forward-looking statements contained in this press release are expressly
qualified by this cautionary statement.

Non-GAAP and Operational Measures

In addition to providing measures prepared in accordance with International
Financial Reporting Standards (IFRS), Pengrowth presents additional and
non-GAAP measures including adjusted net income (loss), operating netbacks,
total debt before working capital, total debt including working capital, cash
G&A expenses and funds flow from operations.

These measures do not have any standardized meaning prescribed by GAAP and
therefore are unlikely to be comparable to similar measures presented by other
companies.

These measures are provided, in part, to assist readers in determining
Pengrowth’s ability to generate cash from operations. Pengrowth believes these
measures are useful in assessing operating performance and liquidity of
Pengrowth’s ongoing business on an overall basis.

These measures should be considered in addition to, and not as a substitute
for, net income (loss), cash provided by operations and other measures of
financial performance and liquidity reported in accordance with IFRS. Further
information with respect to these additional and non-GAAP measures can be found
in the MD&A.

– END RELEASE – 02/05/2017

For further information:
Wassem Khalil
Manager, Investor Relations
(403) 233-0224 or Toll free 1-855-336-8814
OR
Investor Relations
[email protected]
www.pengrowth.com

COMPANY:
FOR: PENGROWTH ENERGY CORPORATION
TSX SYMBOL: PGF
NYSE SYMBOL: PGH

INDUSTRY: Energy and Utilities – Oil and Gas
RELEASE ID: 20170502CC0104

Press Release from Marketwired 1-866-736-3779

All press releases are written by the client and have NO affiliation with the news copy written by The Canadian Press. Any questions that arise due to the content or information provided in the press release should be directed to the company/organization
issuing the release, not to The Canadian Press.

GET ENERGYNOW’S DAILY EMAIL FOR FREE


Regina steelmaking plant to supply 75% of Trans Mountain Pipeline expansion needs

CALGARY — Kinder Morgan says it plans to buy more than 75 per cent of the pipe it needs for its Trans Mountain Pipeline expansion from a steelmaking factory in Regina.

It says it has an agreement to purchase about 250,000 tonnes of pipe, equivalent to 800 kilometres of pipeline, from EVRAZ North America.

In a joint news release, both companies say material for the pipe will be sourced from EVRAZ’s recycled metal operations in Alberta, Saskatchewan, Manitoba and Ontario.

The deal is contingent upon Kinder Morgan’s final investment decision on its $7.4-billion project to triple capacity of its 1,150-km Trans Mountain oil conduit from the Edmonton area to Burnaby, B.C.

NDP Leader John Horgan, a candidate in next week’s B.C. election, opposes the project while Liberal Leader Christy Clark backs the development.

Kinder Morgan says it must finalize financing before proceeding, with construction expected to begin this fall and completion in late 2019.

It filed a prospectus for an initial public offering of restricted voting shares last week but has also said it is seeking partners to help pay for the line.

The project received federal approval in November but is subject to 157 conditions from the National Energy Board and 37 conditions attached to B.C.’s environmental certificate.

The Canadian Press

GET ENERGYNOW’S DAILY EMAIL FOR FREE


Encana reports on the election of directors voting results from the 2017 Annual Meeting of Shareholders

FOR: ENCANA CORPORATIONTSX Symbol: ECANYSE Symbol: ECADate issue: May 02, 2017Time in: 5:30 PM eAttention:
CALGARY, AB –(Marketwired – May 02, 2017) – (TSX: ECA) (NYSE: ECA)
The following matter was voted upon at the Annual Meeting of Shareholders o…

GET ENERGYNOW’S DAILY EMAIL FOR FREE


Canadian Utilities Limited Provides Series Y Preferred Shares Conversion Privilege and Dividend Rate Notice

FOR: CANADIAN UTILITIES LIMITED
TSX SYMBOL: CU
TSX SYMBOL: CU.X

Date issue: May 02, 2017
Time in: 5:05 PM e

Attention:

CALGARY, ALBERTA–(Marketwired – May 2, 2017) – Canadian Utilities Limited
(TSX: CU, CU.X)

Canadian Utilities Limited announced today that it has notified the registered
shareholder of its Cumulative Redeemable Second Preferred Shares Series Y
(“Series Y Preferred Shares”) of a conversion privilege and applicable dividend
rates. As a result, subject to certain conditions, the holders of Series Y
Preferred Shares will have the right to choose one of the following options
with regard to their shares:

/T/

1. To retain any or all of their Series Y Preferred Shares and continue to

receive a fixed rate quarterly dividend; or
2. To convert, on a one-for-one basis, any or all of their Series Y
Preferred Shares into Cumulative Redeemable Second Preferred Shares
Series Z (“Series Z Preferred Shares”) of Canadian Utilities Limited and
receive a floating rate quarterly dividend.

/T/

Effective June 1, 2017, the annual dividend rate for the Series Y Preferred
Shares is set at 3.40% for the five-year period from and including June 1, 2017
to but excluding June 1, 2022 and the dividend rate for the Series Z Preferred
Shares is set at an annual rate of 2.95% for the three-month period commencing
June 1, 2017 to but excluding September 1, 2017. The dividend rate for the
Series Z Preferred Shares will be reset each quarter. Both rates were
calculated according to the terms described in the prospectus supplement of
Canadian Utilities Limited dated September 15, 2011.

Beneficial owners of Series Y Preferred Shares who wish to exercise their right
of conversion should communicate as soon as possible with their broker or other
nominee and ensure that they follow their instructions in order to meet the
deadline to exercise such right, which is 3 p.m. (Calgary time) / 5 p.m.
(Toronto time) on May 17, 2017. Any notices received after this deadline will
not be valid. As such, it is recommended that this be done well in advance of
the deadline in order to provide the broker or other intermediary with time to
complete the necessary steps.

The foregoing conversions are subject to the conditions that: (i) if Canadian
Utilities Limited determines that there would be less than 2,000,000 Series Y
Preferred Shares outstanding on June 1, 2017, then all remaining Series Y
Preferred Shares will automatically be converted into Series Z Preferred Shares
on June 1, 2017, and (ii) alternatively, if Canadian Utilities Limited
determines that there would be less than 2,000,000 Series Z Preferred Shares
outstanding on June 1, 2017 after giving effect to conversion notices received,
no Series Y Preferred Shares will be converted into Series Z Preferred Shares.
If either of these scenarios occurs, Canadian Utilities Limited will issue a
news release to that effect on or before May 24, 2017.

Holders of the Series Y Preferred Shares and the Series Z Preferred Shares, as
applicable, will have the opportunity to convert their shares again on June 1,
2022, and every five years thereafter as long as the shares remain outstanding.

For more information on the terms of, and risks associated with an investment
in, the Series Y Preferred Shares and the Series Z Preferred Shares, please see
Canadian Utilities Limited’s prospectus supplement dated September 15, 2011,
which can be found under Canadian Utilities Limited’s profile on SEDAR at
www.sedar.com.

With approximately 5,400 employees and assets of $19 billion, Canadian
Utilities Limited is an ATCO company. ATCO is a diversified global corporation
delivering service excellence and innovative business solutions in Structures &
Logistics (workforce housing, innovative modular facilities, construction, site
support services, and logistics and operations management); Electricity
(electricity generation, transmission, and distribution); Pipelines & Liquids
(natural gas transmission, distribution and infrastructure development, energy
storage, and industrial water solutions); and Retail Energy (electricity and
natural gas retail sales). More information can be found at
www.canadianutilities.com.

Forward-Looking Information:

Certain statements contained in this news release may constitute
forward-looking information. Forward-looking information is often, but not
always, identified by the use of words such as “anticipate”, “plan”,
“estimate”, “expect”, “may”, “will”, “intend”, “should”, and similar
expressions.

Forward-looking information involves known and unknown risks, uncertainties and
other factors that may cause actual results or events to differ materially from
those anticipated in such forward-looking information.

The Company’s actual results could differ materially from those anticipated in
this forward-looking information as a result of regulatory decisions,
competitive factors in the industries in which the Company operates, prevailing
economic conditions, and other factors, many of which are beyond the control of
the Company.

The Company believes that the expectations reflected in the forward-looking
information are reasonable, but no assurance can be given that these
expectations will prove to be correct and such forward-looking information
should not be unduly relied upon.

Any forward-looking information contained in this news release represents the
Company’s expectations as of the date hereof, and is subject to change after
such date. The Company disclaims any intention or obligation to update or
revise any forward-looking information whether as a result of new information,
future events or otherwise, except as required by applicable securities
legislation.

– END RELEASE – 02/05/2017

For further information:
Media & Investor Inquiries:
B.R. (Brian) Bale
Senior Vice President & Chief Financial Officer
403-292-7502

COMPANY:
FOR: CANADIAN UTILITIES LIMITED
TSX SYMBOL: CU
TSX SYMBOL: CU.X

INDUSTRY: Energy and Utilities – Utilities, Energy and Utilities –
Pipelines
RELEASE ID: 20170502CC0096

Press Release from Marketwired 1-866-736-3779

All press releases are written by the client and have NO affiliation with the news copy written by The Canadian Press. Any questions that arise due to the content or information provided in the press release should be directed to the company/organization
issuing the release, not to The Canadian Press.

GET ENERGYNOW’S DAILY EMAIL FOR FREE


Dundee Energy Limited Announces First Quarter 2017 Financial Results

FOR: DUNDEE ENERGY LIMITED
TSX SYMBOL: DEN

Date issue: May 02, 2017
Time in: 5:02 PM e

Attention:

TORONTO, ONTARIO–(Marketwired – May 2, 2017) – Dundee Energy Limited (“Dundee
Energy” or the “Corporation”) (TSX:DEN) today announced its financial results
for the three month period ended March 31, 2017. The Corporation’s unaudited
condensed interim consolidated financial statements, along with its
management’s discussion and analysis have been filed on the System for
Electronic Document Analysis and Retrieval (“SEDAR”) and may be viewed under
the Corporation’s profile at www.sedar.com or the Corporation’s website at
www.dundee-energy.com.

FINANCIAL HIGHLIGHTS

/T/

— Net loss attributable to owners of the parent for the three months ended

March 31, 2017 was $33,000. This compares with a net loss attributable
to owners of the parent of $2.9 million in the same period of the prior
year.
— Revenues before royalty interests earned from oil and natural gas sales
during the first quarter of 2017 were $7.0 million, compared with $5.0
million of revenues earned in the same quarter of 2016, reflecting
improved commodity prices, partially offset by lower production volumes.
— Production volumes during the first quarter of 2017 averaged 10,238
Mcf/d (three months ended March 31, 2016 – 10,872 Mcf/d) of natural gas
and 436 bbls/d (three months ended March 31, 2016 – 490 bbls/d) of oil
and liquids. Reductions in production volume reflect the expected
natural depletion of the Corporation’s resources. Due primarily to
financial constraints, the Corporation has limited its capital works and
development initiatives, which has temporarily curtailed the potential
for further exploitation of its producing properties.
— Field netbacks during the three months ended March 31, 2017, before
realized amounts related to derivative financial instruments, were
$2.47/Mcf (three months ended March 31, 2016 – $0.98/Mcf) from natural
gas and $29.73/bbl (three months ended March 31, 2016 – $12.34/bbl) from
oil and liquids.

/T/

LIQUIDITY

On January 31, 2017, Dundee Energy Limited Partnership (“DELP”), the
Corporation’s primary operating subsidiary, entered into a forbearance
agreement (the “Forbearance Agreement”) with its lender, in respect of its
demand revolving loan credit facility. Under the terms of the Forbearance
Agreement, provided that certain ongoing conditions are met, the lender to DELP
agreed to forbear from exercising its enforcement rights and remedies arising
from DELP’s failure to reduce the amounts borrowed pursuant to such credit
facility, to amounts that correspond to, or fall below the borrowing base
available to DELP, as determined by its lender with reference to the
Corporation’s reserves and the current and projected market prices for oil and
natural gas, as determined by the Corporation’s lender, until the earlier of
May 15, 2017; the occurrence of an event of default under the terms of the
credit facility; or the occurrence of a default or breach of representation by
DELP under the Forbearance Agreement.

The Forbearance Agreement provides a definitive timeline within which the
Corporation will be required to complete its intended process to identify
strategic alternatives which may include debt restructuring, a sale of all or a
material portion of the assets of DELP, the outright sale of DELP, or a
business combination or other transaction involving DELP and a third party.
Under the terms of the Forbearance Agreement, DELP had committed to enter into
a binding agreement under these arrangements, which binding agreement was to be
satisfactory to its lender, by April 7, 2017. The lender has not yet provided
its consent to any of the proposals made by the Corporation, and these
proposals remain under consideration by DELP and DELP’s lender. The lender has
not provided a waiver of the April 7, 2017 deadline. In any case, the lender at
all times retains its right to demand repayment in full, including during the
forbearance period. The Corporation and DELP continue to assess their options
in this regard.

There can be no assurance that the Corporation’s lender will not exercise its
right to demand under the terms of the credit facility, whether in whole or in
part. This material uncertainty casts significant doubt upon the Corporation’s
ability to continue as a going concern and the ultimate appropriateness of
using accounting principles applicable to a going concern. The Corporation’s
unaudited condensed interim consolidated financial statements as at and for the
three months ended March 31, 2017, do not include any adjustments to the
amounts and classification of assets and liabilities that might be necessary
should the Corporation be unable to continue as a going concern. If the
Corporation is not able to continue as a going concern, the Corporation may be
required to realize its assets and discharge its liabilities in other than the
normal course of business and at amounts different from those reflected in
these unaudited condensed interim consolidated financial statements. These
differences could be material.

/T/

SOUTHERN ONTARIO ASSETS
(in thousands)
—————————————————————————
—————————————————————————

Oil and
Natural Gas Liquids Total
—————————————————————————
Net Sales
Three months ended March 31, 2017 $ 3,764 $ 2,182 $ 5,946
Three months ended March 31, 2016 2,642 1,588 4,230
—————————————————————————
Net increase in net sales $ 1,122 $ 594 $ 1,716
—————————————————————————
—————————————————————————

Effect of changes in production
volumes $ (181) $ (189) $ (370)
Effect of changes in commodity
prices 1,303 783 2,086
—————————————————————————
$ 1,122 $ 594 $ 1,716
—————————————————————————
—————————————————————————

/T/

Net sales were $5.9 million in the first quarter of 2017, an increase of $1.7
million over net sales of $4.2 million generated in the same period of 2016.
Higher realized prices for underlying commodities increased aggregate net sales
by $2.1 million, partially offset by lower production volumes, the effect of
which was to reduce net sales by $0.4 million.

/T/

Field Level Cash Flows and Field Netbacks
(in thousands)
—————————————————————————-
For the three months ended
March 31, 2017
—————————————————————————-
Oil and
Natural Gas Liquids Total
—————————————————————————-
Total sales $ 4,408 $ 2,569 $ 6,977
Royalties (644) (387) (1,031)
Production expenditures (1,485) (1,015) (2,500)
—————————————————————————-
2,279 1,167 3,446
Realized (loss) gain on
derivative financial
instruments (366) – (366)
—————————————————————————-
Field level cash flows $ 1,913 $ 1,167 $ 3,080
—————————————————————————-

—————————————————————————-
—————————————————————————-
For the three months ended
March 31, 2017
—————————————————————————-
Oil and
Natural Gas Liquids Total
$/Mcf $/bbl $/boe
—————————————————————————-
Total sales $ 4.78 $ 65.47 $ 36.19
Royalties (0.70) (9.88) (5.35)
Production expenditures (1.61) (25.86) (12.97)
—————————————————————————-
2.47 29.73 17.87
Realized (loss) gain on
derivative financial
instruments (0.40) – (1.90)
—————————————————————————-
Field netbacks $ 2.07 $ 29.73 $ 15.97
—————————————————————————-

Field Level Cash Flows and Field Netbacks
(in thousands)
—————————————————————————
For the three months ended
March 31, 2016
—————————————————————————
Oil and
Natural Gas Liquids Total
—————————————————————————
Total sales $ 3,110 $ 1,865 $ 4,975
Royalties (468) (277) (745)
Production expenditures (1,668) (1,039) (2,707)
—————————————————————————
974 549 1,523
Realized (loss) gain on
derivative financial
instruments 199 – 199
—————————————————————————
Field level cash flows $ 1,173 $ 549 $ 1,722
—————————————————————————

—————————————————————————
—————————————————————————
For the three months ended
March 31, 2016
—————————————————————————
Oil and
Natural Gas Liquids Total
$/Mcf $/bbl $/boe
—————————————————————————
Total sales $ 3.14 $ 41.89 $ 23.76
Royalties (0.47) (6.21) (3.56)
Production expenditures (1.69) (23.34) (12.93)
—————————————————————————
0.98 12.34 7.27
Realized (loss) gain on
derivative financial
instruments 0.20 – 0.95
—————————————————————————
Field netbacks $ 1.18 $ 12.34 $ 8.22
—————————————————————————

/T/

CASTOR UNDERGROUND GAS STORAGE PROJECT

In March 2017, the Corporation announced that the arbitral tribunal of the
International Chamber of Commerce had rendered its decision related to the
Castor Project, denying the Corporation’s claim. The decision was rendered by a
majority of the three-person tribunal, with the third member issuing a
dissenting opinion. The Corporation and counsel are currently assessing what
steps, if any, may be taken based on the decision rendered.

NON-IFRS MEASURES

The Corporation believes that important measures of operating performance
include certain measures that are not defined under International Financial
Reporting Standards (“IFRS”) and as such, may not be comparable to similar
measures used by other companies. While these measures are non-IFRS, they are
common benchmarks in the oil and natural gas industry, and are used by the
Corporation in assessing its operating results, including net earnings and cash
flows.

/T/

— “Field Level Cash Flows” are calculated as revenues from oil and gas

sales, less royalties and production expenditures, adjusted for realized
gains or losses on risk management contracts.
— “Field Netbacks” refer to field level cash flows expressed on a
measurement unit or barrel of oil equivalent basis.

/T/

ABOUT THE CORPORATION

Dundee Energy Limited is a Canadian-based oil and natural gas company with a
mandate to create long-term value for its shareholders through the exploration,
development, production and marketing of oil and natural gas, and through other
high impact energy projects. Dundee Energy holds interests, both directly and
indirectly, in the largest accumulation of producing oil and gas assets in
Ontario and, through a preferred share investment, in certain exploration and
evaluation programs for oil and natural gas offshore Tunisia. The Corporation’s
common shares trade on the Toronto Stock Exchange under the symbol “DEN”.

FORWARD-LOOKING STATEMENTS

Certain information set forth in these documents, including management’s
assessment of each of the Corporation’s future plans and operations, contains
forward-looking statements. Forward-looking statements are statements that are
predictive in nature, depend upon or refer to future events or conditions and
may include words such as “expects”, “anticipates”, “intends”, “plans”,
“believes”, “estimates” or similar expressions.

In particular, forward-looking statements contained in this document include,
but are not limited to, statements with respect to: expectations regarding the
Corporation’s ability to raise capital; volatility of commodity prices;
effectiveness of hedging strategies; exploration, development and production;
quantity of oil and natural gas reserve and recovery estimates; pending legal
actions; treatment under government regulatory regimes and tax laws; financial
and business prospects and financial outlook; performance characteristics of
the Corporation’s oil and natural gas properties; the Corporation’s capital
expenditure programs; supply and demand for oil and natural gas; drilling plans
and strategy; availability of rigs, equipment and other goods and services;
continually adding to reserves through acquisitions, exploration and
development; anticipated work programs and land tenure; the granting of
operating permits, licenses or authorities to prospect; the timing of
acquisitions; the realization of the anticipated benefits of the Corporation’s
acquisitions and dispositions and other risk factors discussed or referred to
in the section entitled “Risk Factors” in the Corporation’s Annual Information
Form for the year ended December 31, 2016.

Readers are cautioned that the assumptions used in the preparation of such
information, although considered reasonable at the time of preparation, may
prove to be imprecise and, as such, undue reliance should not be placed on
forward-looking statements. The Corporation’s actual results, performance or
achievement could differ materially from those expressed in, or implied by,
these forward-looking statements and, accordingly, no assurance can be given
that any of the events anticipated by the forward-looking statements will
transpire or occur, or if any of them do so, what benefits the Corporation will
derive from them. The Corporation disclaims any intention or obligation to
update or revise any forward-looking statements, whether as a result of new
information, future events or otherwise, except as required by law.

– END RELEASE – 02/05/2017

For further information:
Dundee Energy Limited
21st Floor,
1 Adelaide Street East
Toronto, ON M5C 2V9
OR
Dundee Energy Limited
Bruce Sherley
President & CEO
(403) 651-4581
(416) 363-4536 (FAX)
[email protected]
www.dundee-energy.com

COMPANY:
FOR: DUNDEE ENERGY LIMITED
TSX SYMBOL: DEN

INDUSTRY: Energy and Utilities – Oil and Gas
RELEASE ID: 20170502CC0095

Press Release from Marketwired 1-866-736-3779

All press releases are written by the client and have NO affiliation with the news copy written by The Canadian Press. Any questions that arise due to the content or information provided in the press release should be directed to the company/organization
issuing the release, not to The Canadian Press.

GET ENERGYNOW’S DAILY EMAIL FOR FREE


Suit aims to block fracking plan for National Forest in Ohio

COLUMBUS, Ohio — A coalition of conservation groups has filed a lawsuit aimed at blocking plans to allow fracking in eastern Ohio’s Wayne National Forest.

The Sierra Club, Ohio Environmental Council and the Center for Biological Diversity filed the lawsuit Tuesday in U.S District Court in Columbus.

The lawsuit against the Bureau of Land Management and U.S. Forest Service aims to void leases allowing hydraulic fracturing in Ohio’s only national forest. It contends the leases violate the National Environmental Policy Act.

Neither federal agency immediately responded to requests for comment Tuesday.

The leases don’t automatically allow companies to drill. They provide a 10-year window to apply for permits for gas and oil exploration.

Opponents say opening the land to fracking will threaten public health and local wildlife by polluting the air and water.

The Associated Press

GET ENERGYNOW’S DAILY EMAIL FOR FREE


CORRECTION: ViewSonic Canada Drives Significant Growth in Q1 2017 Led by Newly Appointed General Manager, Deidre Deacon

FOR: VIEWSONIC CORP.
Date issue: May 02, 2017Time in: 12:17 PM eAttention:
Results outpace industry growth as Canadian team on track to meet growing
business demand for large format and interactive display products
TORONTO, ONTARIO–(Marketwired – May…

GET ENERGYNOW’S DAILY EMAIL FOR FREE


Encana would still invest in Canada and U.S. if border tax implemented, CEO says

CALGARY — The head of Encana Corp. (TSX:ECA) says the company will continue to invest in Canada and the U.S. even if President Donald Trump erects border taxes on Canadian energy exports.

The Calgary-based oil and gas firm has focused exploration and production activities on four formations over the past several years: the Permian and Eagle Ford in Texas and the Montney and Duvernay in B.C. and Alberta.

A border adjustment tax could make it more difficult for Canadian producers to compete in the U.S., Canada’s largest customer of oil and gas.

But Encana’s geographic “optionality” is an important advantage, CEO Doug Suttles said Tuesday, adding that its Canadian operations are valuable because of the light petroleum liquids such as condensate that are produced with natural gas from its Montney and Duvernay wells.

“Because condensate is an imported product from the United States, we think that if a border tax raised the price of oil in the United States, it would also raise the price of condensate,” he said on a conference call with reporters before Encana’s annual meeting. “So even though we’d be producing it here in Canada, we’d benefit from that.”

Condensate is used by oilsands producers in northern Alberta to dilute heavy bitumen to allow it to flow in a pipeline. It fetches prices that are typically close to benchmark U.S. crude prices.

Encana has targeted Montney liquids production — mostly condensate — to grow by five times to 70,000 barrels per day by 2019.

If a border tax causes higher oil prices in the U.S., Encana’s oil production south of the border would also stand to benefit from that, Suttles added.

Trump recently lumped energy in with other trade irritants such as softwood lumber and dairy in calling for “very big changes” to the North American Free Trade Agreement, although he has since backed away from his call to eliminate the trade deal.

Encana is budgeted to spend more than US$1 billion on its two core U.S. plays this year and about US$325 million on Montney and Duvernay, with contributions from joint venture partners taking total expenditures in Canada to about US$1 billion as well.

The company, which reports in U.S. currency, handily beat analyst expectations with $431 million of net income or 44 cents per share in the first quarter of 2017. Analysts had estimated two cents per share of net income, according to Thomson Reuters data.

Kristopher Zack of Desjardins Capital Markets said Encana’s performance was mainly driven by a US$42-million cash tax recovery.

The results contrasted with deep losses in last year’s first quarter, when benchmark crude prices were at a 13-year low. Encana lost $379 million or 45 cents per share in the first quarter of 2016.

Revenue was US$1.297 billion for the three-month period ended March 31, up from $753 million a year ago.

Encana reported first-quarter production of 317,900 barrels of oil equivalent per day, with 75 per cent from its four core areas.


Follow @HealingSlowly on Twitter.

Dan Healing, The Canadian Press

GET ENERGYNOW’S DAILY EMAIL FOR FREE


BTL Group Advances 2017 Blockchain Strategy Around Interbit Platform

FOR: BTL GROUP LTD.TSX VENTURE SYMBOL: BTLDate issue: May 02, 2017Time in: 8:56 AM eAttention:
VANCOUVER, BRITISH COLUMBIA and LONDON, UNITED KINGDOM–(Marketwired – May 2,
2017) – BTL GROUP LTD. (TSX VENTURE:BTL) (“BTL”) is pleased to provide a
progr…

GET ENERGYNOW’S DAILY EMAIL FOR FREE


PrairieSky Receives TSX Approval for Renewed Normal Course Issuer Bid

FOR: PRAIRIESKY ROYALTY LTD.
TSX SYMBOL: PSK

Date issue: May 02, 2017
Time in: 8:00 AM e

Attention:

CALGARY, ALBERTA–(Marketwired – May 2, 2017) – PrairieSky Royalty Ltd.
(“PrairieSky” or the “Company”) (TSX:PSK) is pleased to announce that
theToronto Stock Exchange (the “TSX”) has accepted the notice of PrairieSky’s
intention to commence a normal course issuer bid (the “NCIB”). PrairieSky
previously purchased an aggregate of 1,429,100 common shares at a weighted
average price per share of $27.98 under a normal course issuer bid that ran
between May 2, 2016 and May 1, 2017.

On April 24, 2017, PrairieSky announced its intention to seek TSX approval to
renew its NCIB for an additional one year period. The NCIB allows the Company
to purchase up to 1,600,000 common shares (representing approximately 1% of the
public float of 203,856,672 common shares issued and outstanding as of May 1,
2017) over a period of twelve months commencing on May 4, 2017. The NCIB will
expire no later than May 3, 2018.

Under the NCIB, common shares may be repurchased in open market transactions on
the TSX, and/or other Canadian exchanges, or by such other means as may be
permitted by the TSX and applicable securities laws. In accordance with the
rules of the TSX governing normal course issuer bids, the total number of
common shares the Company is permitted to purchase is subject to a daily
purchase limit of 147,525 common shares, representing 25% of the average daily
trading volume of common shares on the TSX calculated for the six-month period
ended April 30, 2017, provided, however, that the Company may make one block
purchase per calendar week which exceeds the daily repurchase restriction. Any
common shares that are purchased under the NCIB will be cancelled upon their
purchase by PrairieSky.

PrairieSky intends to enter into an automatic purchase plan with its broker,
BMO Nesbitt Burns Inc., in order to facilitate purchases of its common shares.
The automatic purchase plan allows for purchases by the Company of its common
share at any time, including, without limitation, when the Company would
ordinarily not be permitted to make purchases due to regulatory restriction or
self-imposed blackout periods. Purchases will be made by PrairieSky’s broker
based upon the parameters prescribed by the TSX and the terms of the parties’
written agreement.

PrairieSky currently intends to only use $44.0 million to effect NCIB purchases
over the next 12 months (approximately $3.7 million per month). However, the
Company’s board of directors may consider, from time to time, applying to the
TSX to increase the amount of NCIB purchases. Decisions regarding increases to
the NCIB will be based on market conditions, share price, best use of available
cash, and other factors including other options to expand our portfolio of
royalty assets.

FORWARD-LOOKING STATEMENTS

This press release contains certain forward-looking statements. The use of any
of the words “expect”, “anticipate”, “may”, “will”, “should”, “believe”,
“intends”, and similar expressions are intended to identify
forward-looking statements. Forward-looking statements contained in this press
release include our expectations with respect to entering into an automatic
purchase plan and the dollar value and number of common shares under NCIB
purchases to be effected over the next 12 months.

With respect to forward-looking statements contained in this press release, we
have made several assumptions including that the common shares will from time
to time trade below their value, that the Company will complete purchases of
common shares pursuant to the NCIB and those described in detail in our MD&A
and the Annual Information Form for the period ended December 31, 2016. Readers
and investors are cautioned that the assumptions used in the preparation of
such forward-looking information and statements, although considered reasonable
at the time of preparation, may prove to be imprecise and, as such, undue
reliance should not be placed on forward-looking statements. Our actual
results, performance, or achievements could differ materially from those
expressed in, or implied by, these forward-looking statements. We can give no
assurance that any of the events anticipated will transpire or occur, or if any
of them do, what benefits we will derive from them.

By their nature, forward-looking statements are subject to numerous risks and
uncertainties, some of which are beyond our control, including the market price
of the common shares being too high to ensure that purchases benefit the
Company and its shareholders, impact of general economic conditions, industry
conditions, volatility of commodity prices, stock market volatility and failure
to execute purchases under the normal course issuer bid. The foregoing and
other risks are described in more detail in PrairieSky’s MD&A, and the Annual
Information Form for the period ended December 31, 2016 under the headings
“Risk Management” and “Risk Factors”, respectively, each of which is available
at www.sedar.com.

Further, any forward-looking statement is made only as of the date of this
press release, and PrairieSky undertakes no obligation to update or revise any
forward-looking statement or statements to reflect events or circumstances
after the date on which such statement is made or to reflect the occurrence of
unanticipated events, except as required by applicable securities laws. New
factors emerge from time to time, and it is not possible for PrairieSky to
predict all of these factors or to assess in advance the impact of each such
factor on PrairieSky’s business or the extent to which any factor, or
combination of factors, may cause actual results to differ materially from
those contained in any forward-looking statements.

The forward-looking statements contained in this document are expressly
qualified by this cautionary statement.

ABOUT PRAIRIESKY ROYALTY LTD.

PrairieSky is a royalty-focused company, generating royalty revenues as
petroleum and natural gas are produced from its properties. PrairieSky has a
diverse portfolio of properties that have a long history of generating free
cash flow and that represent the largest and most concentrated
independently-owned fee simple mineral title position in Canada. PrairieSky’s
common shares trade on the Toronto Stock Exchange under the symbol PSK.

– END RELEASE – 02/05/2017

For further information:
PrairieSky Royalty Ltd.
Investor Relations
(587) 293-4000
www.prairiesky.com

COMPANY:
FOR: PRAIRIESKY ROYALTY LTD.
TSX SYMBOL: PSK

INDUSTRY: Energy and Utilities – Oil and Gas
RELEASE ID: 20170502CC0024

Press Release from Marketwired 1-866-736-3779

All press releases are written by the client and have NO affiliation with the news copy written by The Canadian Press. Any questions that arise due to the content or information provided in the press release should be directed to the company/organization
issuing the release, not to The Canadian Press.

GET ENERGYNOW’S DAILY EMAIL FOR FREE


Just Energy Group Announces Commencement of an At-the-Market Program in the United States for the 8.50% Series A Fixed-to-Floating Rate Cumulative Redeemable Perpetual Preferred Shares

FOR: JUST ENERGY GROUP INC.
NYSE SYMBOL: JE
TSX SYMBOL: JE

Date issue: May 02, 2017
Time in: 7:41 AM e

Attention:

TORONTO, ONTARIO–(Marketwired – May 2, 2017) – Just Energy Group Inc. (“Just
Energy” or the “Company”) (TSX:JE)(NYSE:JE), a leading retail energy provider
specializing in electricity and natural gas commodities, energy efficiency
solutions, and renewable energy options, is pleased to announce it has entered
into an at-the-market issuance sales agreement dated May 1, 2017 (the “Sales
Agreement”) with FBR Capital Markets & Co. (“FBR”), pursuant to which Just
Energy may, at its discretion and from time-to-time during the term of the
Sales Agreement, offer and sell in the United States, through FBR, acting as
the Company’s agent, 8.50% Series A Fixed-to-Floating Rate Cumulative
Redeemable Perpetual Preferred Shares of the Company (“Preferred Shares”)
having an aggregate offering price of up to US $150 million (the “Offering”).
Sales of Preferred Shares pursuant to the Sales Agreement may be made in the
United States by any method permitted by law deemed to be an “at-the-market”
offering as defined in Rule 415 of the United States Securities Act of 1933, as
amended, including without limitation sales made directly on the New York Stock
Exchange (the “NYSE”), on any other recognized marketplace in the United States
upon which the Preferred Shares are listed or quoted or where the Preferred
Shares are traded in the United States or to or through a market maker. The
Preferred Shares will be distributed at the market prices prevailing at the
time of each sale, and, as a result, prices may vary as between purchasers and
during the period of distribution. No Preferred Shares sold in the Offering
will be distributed, offered or sold in Canada, including through the Toronto
Stock Exchange or other trading markets in Canada.

The Offering will be made by way of a prospectus supplement dated May 2, 2017,
to the Company’s existing U.S. registration statement on Form F-10 (the
“Registration Statement”). The U.S. prospectus supplement (together with the
related Registration Statement) is available on the SEC’s website
(www.sec.gov). Alternatively, FBR will provide copies of the U.S. prospectus
upon request by contacting FBR Capital Markets & Co. (1300 N. 17th Street,
Suite 1400, Arlington, Virginia 22209, Phone: 703.312.9500).

The Company intends to use the net proceeds of the Offering for general
corporate purposes.

This press release does not constitute an offer to sell or the solicitation of
an offer to buy securities, nor will there be any sale of the securities in any
jurisdiction in which such offer, solicitation or sale would be unlawful prior
to the registration or qualification under the securities laws of any such
jurisdiction.

About Just Energy Group Inc.

Established in 1997, Just Energy (NYSE:JE)(TSX:JE) is a leading retail energy
provider specializing in electricity and natural gas commodities, energy
efficiency solutions, and renewable energy options. With offices located across
the United States, Canada, the United Kingdom and Germany, Just Energy serves
approximately two million residential and commercial customers providing homes
and businesses with a broad range of energy solutions that deliver comfort,
convenience and control. Just Energy Group Inc. is the parent company of Amigo
Energy, Green Star Energy, Hudson Energy, Just Energy Solar, Tara Energy and
TerraPass.

FORWARD-LOOKING STATEMENTS

This press release may contain forward-looking statements and information.
Forward-looking statements and information in this press release include, but
are not limited to, the completion of the offering; payments of dividends on
the Preferred Shares and the planned use of proceeds for the offering. These
statements are based on current expectations that involve a number of risks and
uncertainties which could cause actual results to differ from those
anticipated. These risks include, but are not limited to general economic and
market conditions, levels of customer natural gas and electricity consumption,
rates of customer additions and renewals, rates of customer attrition,
fluctuations in natural gas and electricity prices, changes in regulatory
regimes, results of litigation and decisions by regulatory authorities,
competition and dependence on certain suppliers. Additional information on
these and other factors that could affect Just Energy’s operations, financial
results or dividend levels are included in Just Energy’s annual information
form and other reports on file with Canadian securities regulatory authorities
which can be accessed through the SEDAR website at www.sedar.com or by visiting
EDGAR on the SEC’s website at www.sec.gov.

Neither the Toronto Stock Exchange nor the New York Stock Exchange has approved
nor disapproved of the information contained herein.

– END RELEASE – 02/05/2017

For further information:
Patrick McCullough
Chief Financial Officer
(713) 933-0895
[email protected]
OR
Michael Cummings
Investor Relations
(617) 461-1101
[email protected]

COMPANY:
FOR: JUST ENERGY GROUP INC.
NYSE SYMBOL: JE
TSX SYMBOL: JE

INDUSTRY: Energy and Utilities – Oil and Gas , Financial Services –
Personal Finance
RELEASE ID: 20170502CC0023

Press Release from Marketwired 1-866-736-3779

All press releases are written by the client and have NO affiliation with the news copy written by The Canadian Press. Any questions that arise due to the content or information provided in the press release should be directed to the company/organization
issuing the release, not to The Canadian Press.

GET ENERGYNOW’S DAILY EMAIL FOR FREE


ViewSonic Canada Drives Significant Growth in Q1 2017 Led by Newly Appointed General Manager, Deidre Deacon

FOR: VIEWSONIC CORP.
Date issue: May 02, 2017Time in: 7:30 AM eAttention:
Results outpace industry growth as Canadian team on track to meet growing
business demand for large format and interactive display products
TORONTO, ONTARIO–(Marketwired – May …

GET ENERGYNOW’S DAILY EMAIL FOR FREE


Manitok Energy Inc. Discloses Highlights From Year-End Reserves Report and Announces 2016 Year-End Financial Results.

FOR: MANITOK ENERGY INC.
TSX VENTURE SYMBOL: MEI

Date issue: May 02, 2017
Time in: 7:30 AM e

Attention:

CALGARY, ALBERTA–(Marketwired – May 2, 2017) –

THIS PRESS RELEASE IS NOT FOR PUBLICATION OR DISSEMINATION IN THE UNITED
STATES. FAILURE TO COMPLY WITH THIS RESTRICTION MAY CONSTITUTE A VIOLATION OF
UNITED STATES SECURITIES LAW.

Manitok Energy Inc. (the “Corporation” or “Manitok”) (TSX VENTURE:MEI) is
pleased to provide highlights from its 2016 independent reserves evaluation and
announce its financial results for the fiscal year-ended December 31, 2016.

2016 Independent Reserves Evaluation

Sproule Associates Limited (“Sproule”), Manitok’s independent qualified
reserves evaluator based in Calgary, Alberta, prepared a reserves estimation
and economic evaluation effective December 31, 2016 in respect of Manitok’s oil
and natural gas properties (“2016 Sproule Report”). Sproule also prepared the
reserves estimation and economic evaluation effective December 31, 2015 (“2015
Sproule Report”) and together with the 2016 Sproule Report, the “Sproule
Reports”). The reserves estimates stated herein are effective as at December
31, 2016 and 2015 (as applicable) and are extracted from the Sproule Reports.
The Sproule Reports have been prepared in accordance with the definitions,
standards and procedures contained in the Canadian Oil and Gas Evaluation
Handbook (“COGE Handbook”) and National Instrument 51-101 Standards of
Disclosure for Oil and Gas Activities (“NI 51-101”).

2016 Year-End Reserves Highlights

Below are highlights from the Sproule Reports. Full details are available
electronically on Manitok’s profile on the System for Electronic Document
Analysis and Retrieval (“SEDAR”) at www.sedar.com and also on Manitok’s website
at www.manitokenergy.com:

/T/

— Manitok achieved significant reserves growth in 2016 despite it being a

challenging year in our industry. Based on the 2016 Sproule Report,
total proven developed producing (“PDP”) reserves were 9,671 Mboe (27%
oil), total proved (“TP”) reserves were 17,008 Mboe (30% oil) and total
proved plus probable (“P+P”) reserves were 28,154 Mboe (29% oil). The
Corporation’s PDP reserves increased by 61%, TP reserves increased by
71% and P+P reserves increased by 60% from the 2015 Sproule Report to
the 2016 Sproule Report.

— Manitok replaced its 2016 production by 217% with the increase in PDP

reserves, 420% with the increase in TP reserves and 625% with the
increase in P+P reserves through a successful drilling program in its
southern Alberta core area in the fourth quarter of 2016 and several
successful acquisitions in 2016.

— The Corporation’s 2016 average finding, development and acquisition

(“FD&A”) costs, including the change in future development capital
(“FDC”), are $7.15/boe for TP reserves and are $6.02/boe for P+P
reserves.

— Recycle ratios are 1.9 times, using 2016 FD&A costs including FDC, for

TP reserves and are 2.2 times for P+P reserves. The recycle ratios above
are based on an average fourth quarter 2016 operating netback of
$13.42/boe, including the realized gain on financial instruments of
$1.64/boe, which is representative of current commodity prices.

— When considering the reserves generated from the 4th quarter drilling

program in 2016 alone, the F&D costs, including FDC, were $10.39/boe and
$19.41/boe respectively for P+P and TP reserves. This includes all
drilling, completions, equipping, facilities expansion and tie-in costs
in 2016 relative to reserve additions in 2016.

— Year over year, Manitok increased its reserve life index (“RLI”) by 36%,

to 9.4 years from 6.9 years, on TP reserves, and by 27%, to 15.6 years
from 12.2 years, on P+P reserves(1).

— The pre-tax net present value discounted at 10% (“NPV10%”)(2) of PDP, TP

and P+P reserves increased by approximately 30%, 43% and 44%
respectively, to $114.9 million, $188.3 million and $299.8 million
respectively, in the 2016 Sproule Report as compared to the 2015 Sproule
Report.

— The net asset value on a P+P NPV10% valuation (“NAV”) is about $0.81 per

share diluted (current share price of $0.13), assuming an undeveloped
land value of approximately $33.3 million (valued at $100/acre), net
debt of about $74.5 million at March 31, 2017 and other obligations, and
having 262,819,832 common shares outstanding.

/T/

(1) Production rate used to calculate the 2016 RLI is based on the estimated
average production rate for 2017 on PDP reserves disclosed in the 2016 Sproule
Report and the 2015 RLI is based on the estimated average production rate for
2016 on PDP reserves disclosed in the 2015 Sproule Report.

(2) Estimates of future net revenues whether discounted or not do not represent
fair market value.Reserves Tables

The following table summarizes Manitok’s working interest oil and natural gas
reserves based on the 2016 Sproule Report, using the 2016 Sproule Report
forecast price assumptions:

/T/

Summary of Oil and Natural Gas Reserves as at December 31, 2016(1)(2)

—————————————————————————-

Light and Medium Natural
Reserve Category Crude Oil(3) Gas(6)
—————————————————-
Gross(4) Net(5) Gross(4) Net(5)
(Mbbls) (Mbbls) (Mmcf) (Mmcf)
—————————————————————————-
Proved
Developed Producing 2,733.5 2,165.0 34,437 29,418
Developed Non-
Producing 488.0 426.4 6,791 5,807
Undeveloped 1,986.5 1,662.0 15,400 13,990
—————————————————————————-
Total Proved 5,207.9 4,253.4 56,627 49,216
Probable 3,052.9 2,424.9 39,259 34,112
—————————————————————————-
Total Proved Plus
Probable 8,260.6 6,678.3 95,887 83,328
—————————————————————————-
—————————————————————————-

Summary of Oil and Natural Gas Reserves as at December 31, 2016(1)(2)

—————————————————————————-

Natural Gas
Reserve Category Liquids Total
—————————————————-
Gross(4) Net(5) Gross(4) Net(5)
(Mbbls) (Mbbls) (Mboe) (Mboe)
—————————————————————————-
Proved
Developed Producing 1,197.7 878.9 9,670.7 7,946.9
Developed Non-
Producing 381.4 288.4 2,001.2 1,682.6
Undeveloped 782.7 677.3 5,335.8 4,671.1
—————————————————————————-
Total Proved 2,361.9 1,844.6 17,007.7 14,300.6
Probable 1,550.3 1,168.7 11,146.3 9,278.9
—————————————————————————-
Total Proved Plus
Probable 3,912.2 3,013.3 28,154.0 23,579.5
—————————————————————————-
—————————————————————————-
(1) Based on Sproule’s December 31, 2016 forecast prices and costs. The
forecast of commodity prices used in the 2016 Sproule Report can be
found at www.sproule.com.
(2) Columns may not add due to rounding of individual items.
(3) Estimates of reserves of light and medium oil includes an immaterial
amount of reserves related to heavy crude oil.
(4) Gross reserves are the Corporation’s working interest share before
deduction of royalty obligations and without including any royalty
interests.
(5) Net reserves are the Corporation’s working interest share after
deduction of royalty obligations, plus royalty interests in such
reserves.
(6) Estimates of reserves of natural gas include solution gas and both
associated and non-associated gas.

/T/

The following table is a summary of the net present value of future net revenue
associated with Manitok’s reserves based on the 2016 Sproule Report before
deducting future income tax expense and calculated at various discount rates:

/T/

Net Present Values of Future Net Revenue Before Income Taxes

—————————————————————————-

Value Before Income Taxes Discounted at
Reserve Category (%/year)(1)(2)(3)
————————————————–
0% 5% 10% 15% 20%
(M$) (M$) (M$) (M$) (M$)
—————————————————————————-
Proved
Developed Producing 162,419 134,410 114,872 100,804 90,242
Developed Non-Producing 35,481 26,619 20,899 17,027 14,276
Undeveloped 100,890 70,698 52,549 40,832 32,731
—————————————————————————-
Total Proved 298,790 231,727 188,320 158,662 137,249
Probable 224,823 153,514 111,459 84,601 66,328
—————————————————————————-
Total Proved Plus Probable 523,613 385,241 299,780 243,264 203,577
—————————————————————————-
—————————————————————————-
(1) Based on Sproule’s December 31, 2016 forecast prices and costs. The
forecast of commodity prices used in the 2016 Sproule Report can be
found at www.sproule.com.
(2) Columns may not add due to rounding of individual items.
(3) Estimates of future net revenues whether discounted or not do not
represent fair market value.

/T/

The following table is a reconciliation of Manitok’s gross reserves as derived
from the Sproule Reports:

/T/

Reserves Reconciliation of Gross Reserves(1)(2)

—————————————————————————

Gross Gross Gross Proved
Proved Probable Plus Probable
(Mboe) (Mboe) Mboe)
—————————————————————————-
December 31, 2015 9,938.4 7,687.2 17,625.6
Discoveries, extensions and infill
drilling 978.2 1,494.8 2,473.0
Acquisitions (dispositions) 8,383.1 2,891.8 11,274.9
Technical revisions(3) (339.7) (641.4) (981.1)
Economic factors (268.2) (286.0) (554.2)
Production over the year (1,684.2) – (1,684.2)
—————————————————————————-
December 31, 2016 17,007.7 11,146.3 28,154.0
—————————————————————————-
—————————————————————————-
(1) Gross reserves are the Corporation’s working interest share before
deduction of royalty obligations and without including any royalty
interests.
(2) Columns may not add due to rounding of individual items.
(3) “Technical Revisions” resulted mainly from operating costs and gas
shrinkage increases as well as reservoir performance in the Wayne and
Rockyford areas.

/T/

The full text of Manitok’s year-end report containing its audited financial
statements as at and for the year ended December 31, 2016, the related
management’s discussion and analysis, NI 51-101 reserves disclosure and
Manitok’s annual information form for the year ended December 31, 2016 is
available electronically on Manitok’s profile on SEDAR at www.sedar.com and
also on Manitok’s website at www.manitokenergy.com on or before May 2, 2017.

2016 Year-End Results and Relevant Subsequent Events

Below are notable items from Manitok’s audited financial statements as at and
for the year ended December 31, 2016, the notes related thereto and the related
management’s discussion and analysis. Full details are available electronically
on Manitok’s profile on SEDAR at www.sedar.com and also on Manitok’s website at
www.manitokenergy.com:

/T/

— Production in 2016 averaged 4,602 boe/d (44% light oil and liquids) as

compared to 4,480 boe/d (49% light oil and liquids) in 2015.

— Fourth quarter production averaged 6,123 boe/d (39% light oil and

liquids), a 37% increase over production of 4,459 boe/d (49% light oil
and liquids) in the fourth quarter of 2015.

— Recorded funds from operations of $18.5 million in 2016, a 39% decrease

over funds from operations of $30.4 million in 2015.

— Operating netback including the realized gain or loss on financial

instruments was $18.45/boe in 2016, a 28% decrease over the operating
netback of $25.67/boe in 2015.

— Combined operating and transportation costs averaged $14.63/boe in 2016,

which remained consistent with $14.85/boe incurred in 2015.

— Combined operating and transportation costs averaged $12.37/boe in the

fourth quarter of, which is a 14% decrease from $14.39/boe incurred in
the fourth quarter of 2015.

— Capital expenditures before acquisition and divestitures were $20.3

million as compared to $15.9 million in 2015. Capital expenditures after
acquisition and divestitures were $39.8 million as compared to $40.6
million in 2015.

— On September 29, 2016, Manitok executed and closed an asset purchase

agreement for the acquisition of approximately 1,750 boe/d of production
(34% oil and liquids) which includes approximately 90,000 acres (55,800
net) of undeveloped land, and facilities in the Willesden Green area.
Total consideration for the acquisition was $13.5 million comprised of
$9.0 million of cash and $4.5 million of CEL Units, part of a marketed
underwritten offering of 212,071 Collateralized Exchange Listed Units of
Manitok (“CEL Units”) for total aggregate gross proceeds of $21.2
million.

— On November 29, 2016, Manitok closed an equity financing completed by

way of a short form base shelf prospectus as supplemented by a
prospectus supplement dated November 22, 2016 and raised net proceeds of
$4.5 million.

— As at December 31, 2016, net bank debt was $42.2 million and net debt

was $75.2 million, which includes CEL Units and long-term financial
obligations.

— As at March 31, 2017, Manitok anticipates its net bank debt will be

approximately $41.5 million and its total net debt to be approximately
$74.5 million, which includes CEL Units and long term financing
obligations.

— Manitok’s annual financial statements as at and for the year ended

December 31, 2016 have been qualified with a going concern note relating
to the uncertainty surrounding meeting capital commitments and liquidity
in the current low price commodity environment.

— Manitok announced an acquisition on May 1, 2017, which included $3.5

million of net working capital ($3.0 million cash), and 430 boe/d of
production. Both the immediate benefit of the cash and additional cash
flow from the assets will reduce Manitok’s debt and provide an
improvement to its liquidity going forward.

/T/

OPERATIONAL AND FINANCIAL SUMMARY

/T/

—————————————————————————-

Three months ended Twelve months ended
December 31 December 31

2016 2015 2016 2015
—————————————————————————-
—————————————————————————-
Operating
Average daily
production
Light oil (bbls/d) 1,864 2,002 1,709 2,077
Natural gas (mcf/d) 22,281 13,540 15,417 13,607
NGLs (bbls/d) 545 200 323 135
—————————————————————————-
Total (boe/d) 6,123 4,459 4,602 4,480
—————————————————————————-
—————————————————————————-
Average realized sales
price
Light oil ($/bbl) 56.43 47.83 48.11 52.70
Natural gas ($/mcf) 3.23 2.73 2.49 2.92
NGLs ($/bbl) 30.63 27.88 26.54 35.64
—————————————————————————-
Total ($/boe) 31.67 31.01 28.07 34.38
—————————————————————————-
—————————————————————————-
Netback and Cost ($ per
boe)
Petroleum and natural
gas sales 31.67 31.01 28.07 34.38
Processing revenue 0.31 1.16 0.49 0.48
Realized gain (loss)
on financial
instruments 1.64 18.20 12.25 14.58
Royalty expenses (7.82) (8.30) (7.73) (8.92)
Operating expenses,
net of recoveries (11.59) (12.67) (13.30) (12.69)
Transportation and
marketing expenses (0.78) (1.72) (1.33) (2.16)
—————————————————————————-
Operating netback(1) 13.43 27.68 18.45 25.67
General and
administrative
expenses, net of
recoveries (3.39) (3.29) (3.90) (4.06)
Interest and financing
expenses (3.10) (3.71) (3.62) (3.02)
—————————————————————————-
Funds from operations
netback(1) 6.94 20.68 10.93 18.59
—————————————————————————-
—————————————————————————-
Financial
Petroleum and natural
gas revenue ($000) 17,848 12,720 47,280 56,210
—————————————————————————-
Funds from operations
($000)(1) 4,038 8,488 18,540 30,390
Per share – basic
($)(1) 0.02 0.10 0.10 0.40
Per share – diluted
($)(1) 0.02 0.10 0.10 0.40
—————————————————————————-
Net loss ($000) (16,421) (5,258) (24,694) (27,195)
Per share – basic ($) (0.07) (0.06) (0.13) (0.36)
Per share – diluted
($)(2) (0.07) (0.06) (0.13) (0.36)
—————————————————————————-
Common shares
outstanding
End of period – basic 262,819,832 143,936,115 262,819,832 143,936,115
End of period –
diluted 325,592,540 150,334,260 325,592,540 150,334,260
Weighted average for
the period – basic
and diluted 239,616,115 85,729,418 191,462,156 76,292,523
—————————————————————————-
Capital expenditures,
net of divestitures
($000) 27,569 2,847 39,793 40,597
Adjusted working capital
(surplus) deficit
($000)(1) 9,074 (8,951) 9,074 (8,951)
Drawn on credit
facilities ($000) 33,083 62,398 33,083 62,398
—————————————————————————-
Net bank debt ($000) (1) 42,157 53,447 42,157 53,447
Senior Secured Notes
($000) 18,138 – 18,138 –
Long-term financial
obligations ($000) 14,856 14,948 14,856 14,948
—————————————————————————-
Net debt ($000) (1) 75,151 68,395 75,151 68,395
—————————————————————————-

—————————————————————————-
—————————————————————————-
(1) Funds from operations, funds from operations per share, funds from

operations netback, operating netback, adjusted working capital
(surplus) deficit, net bank debt and net debt do not have standardized
meanings prescribed by generally accepted accounting principles and
therefore should not be considered in isolation. These reported amounts
and their underlying calculations are not necessarily comparable or
calculated in an identical manner to a similarly titled measure of
other companies where similar terminology is used. Where these measures
are used they should be given careful consideration by the reader.
Refer to the Non-GAAP Measures paragraph in the Advisories section of
this MD&A. The basic and diluted weighted average shares outstanding
are the same for periods in which the Corporation records a net loss
and when all the outstanding stock options and warrants are anti-
dilutive.

/T/

About Manitok

Manitok is a public oil and gas exploration and development company focused on
Lithic Glauconitic light oil in southeast Alberta and Cardium light oil in west
central Alberta. The Corporation utilizes its expertise, combined with the
latest recovery techniques, to develop the remaining oil and liquids-rich
natural gas pools in its core areas of the Western Canadian Sedimentary Basin.

For further information view our website at www.manitokenergy.com.

Forward-looking Statements

This press release contains forward-looking statements. More particularly, this
press release contains statements concerning the anticipated net bank debt and
total net debt as at March 31, 2017 and the likelihood of Manitok’s ability to
comply with its working capital covenant in the future. The forward-looking
statements in this press release are based on certain key expectations and
assumptions made by Manitok, including expectations and assumptions concerning
the success of future drilling and development activities, the performance of
existing wells, the performance of new wells, the successful application of
technology, prevailing weather conditions, commodity prices, royalty regimes
and exchange rates and the availability of capital, labour and services.

Although Manitok believes that the expectations and assumptions on which the
forward-looking statements are based are reasonable, undue reliance should not
be placed on the forward-looking statements because Manitok can give no
assurance that they will prove to be correct. Since forward-looking statements
address future events and conditions, by their very nature they involve
inherent risks and uncertainties. Actual results could differ materially from
those currently anticipated due to a number of factors and risks. These
include, but are not limited to, risks associated with the oil and gas industry
in general (e.g., operational risks in development, exploration and production;
delays or changes in plans with respect to exploration or development projects
or capital expenditures; the uncertainty of reserves estimates; the uncertainty
of estimates and projections relating to production, costs and expenses; and
health, safety and environmental risks), uncertainty as to the availability of
labour and services, commodity price and exchange rate fluctuations, unexpected
adverse weather conditions, general business, economic, competitive, political
and social uncertainties, capital market conditions and market prices for
securities and changes to existing laws and regulations. Certain of these risks
are set out in more detail in the AIF, which is available on Manitok’s SEDAR
profile at www.sedar.com.

Forward-looking statements are based on estimates and opinions of management of
Manitok at the time the statements are presented. Manitok may, as considered
necessary in the circumstances, update or revise such forward-looking
statements, whether as a result of new information, future events or otherwise,
but Manitok undertakes no obligation to update or revise any forward-looking
statements, except as required by applicable securities laws.

Non-IFRS Financial Measures

This press release contains references to measures used in the oil and natural
gas industry such as “funds from operations”, “funds from operations netback”,
“funds from operations per share”, “operating netback”, “adjusted working
capital (surplus) deficit”, “net bank debt” and “net debt”. These measures do
not have standardized meanings prescribed by generally accepted accounting
principles (“GAAP”), including International Financial Reporting Standards
(“IFRS”) and therefore should not be considered in isolation. These reported
amounts and their underlying calculations are not necessarily comparable or
calculated in an identical manner to a similarly titled measure of other
companies where similar terminology is used. Where these measures are used,
they should be given careful consideration by the reader. These measures have
been described and presented in the MD&A and Annual Report in order to provide
shareholders and potential investors with additional information regarding the
Corporation’s liquidity and its ability to generate funds to finance its
operations.

Funds from operations should not be considered an alternative to, or more
meaningful than, cash provided by operating, investing and financing activities
or net income (loss) as determined in accordance with IFRS, as an indicator of
Manitok’s performance or liquidity. Funds from operations is used by Manitok to
evaluate operating results and Manitok’s ability to generate cash flow to fund
capital expenditures and repay indebtedness. Funds from operations denotes cash
flow from operating activities as it appears on the Corporation’s Statement of
Cash Flows before decommissioning expenditures, acquisition-related expenses
and changes in non-cash operating working capital. Funds from operations is
also derived from net income (loss) plus acquisition-related expenses and
non-cash items including deferred income tax expense (recovery), depletion and
depreciation expense, impairment expense, stock-based compensation expense,
accretion expense, unrealized gains or losses on financial instruments and
gains or losses on asset divestitures. Funds from operations netback is
calculated on a per boe basis and funds from operations per share is calculated
as funds from operations divided by the weighted average number of basic and
diluted common shares outstanding. Operating netback denotes petroleum and
natural gas revenue and realized gains or losses on financial instruments less
royalty expenses, operating expenses and transportation and marketing expenses
calculated on a per boe basis. Adjusted working capital (surplus) deficit
includes current assets less current liabilities excluding the current portion
of the amount drawn on the credit facilities, the current portion of the fair
value of financial instruments, the deferred premium on financial instruments
and provisions. Manitok uses net bank debt and net debt as a measure to assess
its financial position. Net bank debt includes outstanding bank indebtedness
plus adjusted working capital (surplus) deficit and net debt includes net bank
debt plus the senior secured notes and the long-term financial obligations.

Barrels of Oil Equivalent

The term barrels of oil equivalent (“boe”) may be misleading, particularly if
used in isolation. Per boe amounts have been calculated using a conversion
ratio of six thousand cubic feet (6 mcf) of natural gas to one barrel (1 bbl)
of crude oil. The boe conversion ratio of 6 mcf to 1 bbl is based on an energy
equivalency conversion method primarily applicable at the burner tip and does
not represent a value equivalency at the wellhead. Given that the value ratio
based on the current price of crude oil as compared to natural gas is
significantly different from the energy equivalency of 6:1, utilizing a
conversion on a 6:1 basis may be misleading as an indication of value.

Neither the TSX Venture Exchange nor its Regulation Services Provider (as that
term is defined in the policies of the TSX Venture Exchange) accepts
responsibility for the adequacy or accuracy of this release.

– END RELEASE – 02/05/2017

For further information:
Manitok Energy Inc.
Massimo M. Geremia
President & Chief Executive Officer
403-984-1751
[email protected]
www.manitokenergy.com

COMPANY:
FOR: MANITOK ENERGY INC.
TSX VENTURE SYMBOL: MEI

INDUSTRY: Energy and Utilities – Oil and Gas
RELEASE ID: 20170502CC0022

Press Release from Marketwired 1-866-736-3779

All press releases are written by the client and have NO affiliation with the news copy written by The Canadian Press. Any questions that arise due to the content or information provided in the press release should be directed to the company/organization
issuing the release, not to The Canadian Press.

GET ENERGYNOW’S DAILY EMAIL FOR FREE


Snipp Interactive Reports Q4-2016 and Fiscal 2016 Financial Results

FOR: SNIPP INTERACTIVE, INC.OTCQX SYMBOL: SNIPFTSX VENTURE SYMBOL: SPNDate issue: May 02, 2017Time in: 7:21 AM eAttention:
WASHINGTON, DC–(Marketwired – May 2, 2017) – Snipp Interactive Inc. (“Snipp”
or the “Company”) (OTCQX:SNIPF)(TSX VENTURE:SPN), …

GET ENERGYNOW’S DAILY EMAIL FOR FREE


Pennine announces Technical Report for Velca Block, Albania

FOR: PENNINE PETROLEUM CORPORATIONTSX VENTURE SYMBOL: PNNDate issue: May 02, 2017Time in: 7:01 AM eAttention:
CALGARY, ALBERTA–(Marketwired – May 2, 2017) – Pennine Petroleum Corporation
(TSX VENTURE:PNN) (“Pennine” or the “Corporation”) is pleased t…

GET ENERGYNOW’S DAILY EMAIL FOR FREE


Solar Alliance Completes First Los Angeles Solar Installation and Provides Expansion Update

FOR: SOLAR ALLIANCE ENERGY INC.TSX VENTURE Symbol: SANOTCQB Symbol: SAENFDate issue: May 02, 2017Time in: 7:00 AM eAttention:
VANCOUVER, BC –(Marketwired – May 02, 2017) – Solar Alliance Energy Inc.
(‘Solar Alliance’) or (the ‘Company’) (TSX VENTURE…

GET ENERGYNOW’S DAILY EMAIL FOR FREE


Encana delivers strong first quarter results; company’s multi-basin advantage drives growth and value

FOR: ENCANA CORPORATION
TSX Symbol: ECA
NYSE Symbol: ECA

Date issue: May 02, 2017
Time in: 6:00 AM e

Attention:

CALGARY, AB –(Marketwired – May 02, 2017) – (TSX: ECA) (NYSE: ECA)

Encana’s first quarter performance strongly underpins its five-year plan and
2017 objectives of returning to growth by mid-year, delivering at least 20
percent production growth in its core assets from the fourth quarter of 2016
to the fourth quarter of 2017 and maintaining or enhancing efficiencies
despite sector inflation. Highlights from the quarter include:

/T/

— net earnings of $431 million compared to a net loss of $379 million in

the first quarter of 2016
— cash from operating activities of $106 million and non-GAAP cash flow of
$278 million
— non-GAAP corporate margin of $9.72 per barrel of oil equivalent (BOE),
up from $2.92 per BOE in the first quarter of 2016
— core asset production of 237,300 barrels of oil equivalent per day
(BOE/d), representing 75 percent of total production
— liquids production of 110,900 barrels per day (bbls/d) including oil and
plant condensate production of 87,900 bbls/d, which represents almost 80
percent of total liquids production
— enhanced well performance across the portfolio using an advanced
completion design pioneered in the Eagle Ford during the previous
quarter
— new Permian 12-well pad delivered peak daily production of 14,000 BOE/d,
including 11,000 bbls/d of oil
— infrastructure on schedule to support Montney liquids growth to an
expected 70,000 bbls/d by 2019

/T/

“Our culture of innovation and agility drives the real-time transfer of
technology across our multi-basin portfolio to create a strong competitive
advantage,” said Doug Suttles, Encana President & CEO. “We saw this during the
quarter, when the combination of our large multi-well pads, simultaneous use
of multiple drilling rigs and frac spreads and advanced completion design
drove efficiencies and returns.”

“Our strong performance through the first quarter gives us a lot of confidence
for 2017 and our five-year plan,” added Suttles. “We expect to significantly
increase crude and condensate production through the year and deliver strong
corporate margin growth. We are boosting well productivity while offsetting
inflation through continued operational efficiencies and active supply chain
management. Our risk management and marketing programs effectively manage risk
and preserve optionality.”

Strong first quarter results: Encana positioned to meet or exceed 2017 targets
Encana reported strong financial and operational results for the first
quarter, driven by increased liquids production and improved margins. The
company expects to grow oil and condensate production by greater than 35
percent and total production from its core assets by more than 20 percent
between the fourth quarter of 2016 and the fourth quarter of 2017. This
includes an expected fourth quarter ramp up of Montney production when new
facilities become operational. The company expects total production will begin
to grow from the middle of 2017.

In 2018, Encana is positioned to further increase its non-GAAP corporate
margin at flat pricing of $55 WTI and $3 NYMEX and grow total production from
its core assets between the fourth quarter of 2017 and the fourth quarter of
2018.

Encana generated cash from operating activities of $106 million in the first
quarter of 2017. Non-GAAP cash flow was $278 million compared to $102 million
in the first quarter of 2016. Encana delivered first quarter net earnings of
$431 million, or $0.44 per share, compared to a first quarter 2016 net loss of
$379 million. Non-GAAP operating earnings were $104 million, or $0.11 per
share, compared to a first quarter 2016 non-GAAP operating loss of $130
million.

The company’s focus on its premium return well inventory, combined with
continued efficiencies, contributed to a first quarter non-GAAP corporate
margin of $9.72 per BOE, up from $2.92 per BOE in the first quarter of 2016.
This is ahead of the company’s expectations and sets Encana on track to
deliver a non-GAAP corporate margin of greater than $10.00 per BOE in 2017.

The company delivered first quarter production of 317,900 BOE/d, including
total liquids production of 110,900 bbls/d, of which almost 80 percent was
light oil and plant condensate. Encana’s core assets contributed 237,300
BOE/d, making up 75 percent of total production. Natural gas production in the
first quarter averaged 1,241 million cubic feet per day (MMcf/d).

Encana concluded the first quarter of 2017 with total liquidity of more than
$5.0 billion, comprising cash and cash equivalents of $523 million and
available credit facilities of $4.5 billion. Encana further streamlined its
portfolio with the sale of its Tuscaloosa Marine Shale assets in Mississippi
and Louisiana; the transaction was completed on April 13, 2017.

Delivering better wells: Multi-basin advantage and advanced completion design
Encana continues to innovate and share knowledge across its high-quality,
multi-basin portfolio to deliver better wells and quality returns. The company
is delivering strong well performance using an advanced completion design that
it successfully piloted in the Eagle Ford in late 2016. In the Montney, this
design delivered up to a 60 percent production increase on two wells in the
Tower area and two wells in Pipestone over a 60-day period.

This design is also driving strong results in the Austin Chalk area of the
Eagle Ford, with three wells brought on production during the first quarter
each delivering average 30-day initial production rates of 1,300 BOE/d,
including 1,000 bbls/d of oil. In addition, five new Austin Chalk wells
brought on production in mid-April are each delivering an average of over
2,150 BOE/d, including over 1,900 bbls/d of oil. Advanced completions are
underway in the Permian and Duvernay.

Differentiated execution: Developing the Cube
Encana continues to pioneer new approaches with its large multi-well pad,
full-scale development model. This development approach targets multiple
stacked pay zones from a single above-ground location to optimize resource
recovery and lower development costs and operating expenses.

The most recent example of Encana’s full-scale development is its Abbie Laine
pad in the Permian. During the first quarter, Encana targeted five different
stacked pay zones from 12 wells with each delivering an average 30-day initial
production rates of over 1,000 BOE/d, including over 800 bbls/d of oil. Peak
daily production from the 12-well pad was approximately 14,000 BOE/d,
including 11,000 bbls/d of oil.

Maintaining well costs: Efficiencies outpace sector inflation
In anticipation of a busier year for the industry, Encana secured between 60
and 70 percent of its 2017 drilling and completions program through
self-sourcing or at contracted rates in the fourth quarter of 2016. The
company expects to hold total year-over-year drilling and completion costs
essentially flat through active supply chain management and ongoing operating
efficiencies.

Encana is on track to meet or exceed its 2017 guidance. First quarter
operating expense was down by $34 million, or 20 percent year-over-year, and
transportation and processing costs were down by $57 million, or 21 percent,
compared to the first quarter of 2016.

Managing risk and preserving optionality: Updates to Encana’s Risk Management
Program
Encana’s multi-basin portfolio, short-cycle capital program and robust risk
management strategy effectively position the company to manage risk and
protect value. Encana has protected between 70 and 75 percent of its expected
oil, condensate and natural gas production for the remainder of 2017.

As at April 26, 2017, Encana had hedged approximately 81,000 bbls/d of
expected 2017 oil and condensate production for the balance of the year using
a variety of structures at an average price of $51.33 per barrel (bbl). The
company has hedged approximately 865 MMcf/d of expected 2017 natural gas
production for the balance of the year using a variety of structures at an
average price of $3.15 per thousand cubic feet (Mcf). For 2018, the company
has hedged approximately 31,000 bbls/d of expected oil and condensate
production at an average price of $55.45 per bbl and approximately 500 MMcf/d
of expected natural gas production at an average price of $3.06 per Mcf.

In addition, Encana is actively managing regional price risk through a
combination of term financial basis hedging and physical transportation,
resulting in Encana having only limited exposure to AECO natural gas and
Midland oil pricing through 2020.

In the Montney, over 50 percent of Encana’s 2017 and two thirds of its
expected 2018 to 2020 Western Canadian natural gas price exposure is protected
from the AECO benchmark. From 2018 to 2020, the company expects to transport
approximately 500 MMcf/d of its physical gas to market areas in the Pacific
Northwest, Midwest (Chicago) and Northeast (Dawn, Ontario). Long-term
financial basis hedge programs further diversify away from the AECO market.
Encana has hedged approximately 475 MMcf/d of AECO basis for the 2018 to 2020
period at NYMEX less $0.87 per Mcf.

In the Permian, more than 80 percent of Encana’s expected 2017 to 2020 oil
production is protected from Midland pricing. In 2017, Encana has hedged an
average of 35,000 bbls/d of Midland differential at WTI less $0.61 per bbl.
From 2018 to 2020, Encana has hedged an average of approximately 17,000 bbls/d
of Midland differential at WTI less $0.83 per bbl. The company’s physical
transportation includes 25,000 bbls/d on Enterprise Products’ upcoming
Midland-to-Houston pipeline with an option for up to an additional 25,000
bbls/d. Production delivered on this pipeline will have access to the Houston
refining complex and export markets.

Dividend Declared
On May 1, 2017, the Board of Directors declared a dividend of $0.015 per
common share payable on June 30, 2017 to common shareholders of record as of
June 15, 2017.

/T/

First Quarter Highlights

—————————————————————————-

Non-GAAP Cash Flow Reconciliation
—————————————————————————-
(for the period ended March 31)
($ millions, except per share amounts) Q1 2017 Q1 2016
—————————————————————————-

Cash from (used in) operating activities 106 157
Deduct (add back):
Net change in other assets and liabilities (12) (4)
Net change in non-cash working capital (160) 59

—————————————————————————-
Non-GAAP cash flow(1) 278 102
—————————————————————————-
Non-GAAP Operating Earnings Reconciliation
—————————————————————————-
Net earnings (loss) 431 (379)
Before-tax (addition) deduction:
Unrealized gain (loss) on risk management 362 (55)
Impairments – (912)
Restructuring charges – (31)
Non-operating foreign exchange gain (loss) 34 344
Gain (loss) on divestitures (1) –
Gain on debt retirement – 89
—————————————————————————-
395 (565)
Income tax (68) 316
—————————————————————————-
After-tax (addition) deduction 327 (249)
—————————————————————————-
Non-GAAP operating earnings (loss)(1) 104 (130)
Non-GAAP operating earnings (loss) per share 0.11 (0.15)
—————————————————————————-

/T/

(1) Non-GAAP cash flow and non-GAAP operating earnings (loss) are non-GAAP
measures as defined in Note 1.

/T/

—————————————————————————-

Production Summary
—————————————————————————-
(for the period ended March 31)
(average) Q1 2017 Q1 2016 % ∆
—————————————————————————-
Natural gas (MMcf/d) 1,241 1,516 (18)
—————————————————————————-
Liquids (Mbbls/d) 110.9 130.8 (15)
—————————————————————————-
Total production (MBOE/d) 317.9 383.4 (17)
—————————————————————————-

/T/

/T/

—————————————————————————-

Natural Gas and Liquids Prices
—————————————————————————-
Q1 2017 Q1 2016
—————————————————————————-
Natural gas
—————————————————————————-
NYMEX ($/MMBtu) 3.32 2.09
Encana realized gas price(1) ($/Mcf) 2.50 2.18
—————————————————————————-
Oil and NGLs($/bbl)
—————————————————————————-
WTI 51.91 33.45
Encana realized liquids price(1) 43.45 33.09
—————————————————————————-

/T/

(1) Prices include the impact of realized gain (loss) on risk management.

First Quarter Conference Call and Annual Meeting of Shareholders
A conference call and webcast to discuss the 2017 first quarter results will
be held for the investment community today, May 2, 2017, at 7 a.m. MT (9 a.m.
ET). To participate, please dial (844) 707-0663 (toll-free in North America)
or (703) 326-3003 (international) approximately 10 minutes prior to the
conference call.

The Annual Meeting of Shareholders will be held today, May 2, 2017, at the BMO
Centre, Palomino Room, 20 Roundup Way S.E., Calgary, Alberta, beginning at 10
a.m. MT (12 p.m. ET). Live audio webcasts of the first quarter conference call
and the Annual Meeting of Shareholders, including slides, will also be
available on Encana’s website, www.encana.com, under Investors/Presentations &
Events. The webcasts will be archived for approximately 90 days.

Encana Corporation
Encana is a leading North American energy producer that is focused on
developing its strong portfolio of resource plays, held directly and
indirectly through its subsidiaries, producing natural gas, oil and natural
gas liquids (NGLs). By partnering with employees, community organizations and
other businesses, Encana contributes to the strength and sustainability of the
communities where it operates. Encana common shares trade on the Toronto and
New York stock exchanges under the symbol ECA.

Important Information
Encana reports in U.S. dollars unless otherwise noted. Production, sales and
reserves estimates are reported on a net (after-royalties) basis, unless
otherwise noted. The term liquids is used to represent oil, NGLs and
condensate. The term liquids-rich is used to represent natural gas streams
with associated liquids volumes. Unless otherwise specified or the context
otherwise requires, references to Encana or to the company includes reference
to subsidiaries of and partnership interests held by Encana Corporation and
its subsidiaries.

NOTE 1: Non-GAAP measures – Certain measures in this news release do not have
any standardized meaning as prescribed by U.S. GAAP and, therefore, are
considered non-GAAP measures. These measures may not be comparable to similar
measures presented by other companies and should not be viewed as a substitute
for measures reported under U.S. GAAP.

/T/

— Non-GAAP Cash Flow is a non-GAAP measure defined as cash from operating

activities excluding net change in other assets and liabilities, net
change in non-cash working capital and current tax on sale of assets.
Non-GAAP Corporate Margin is a non-GAAP measure defined as Non-GAAP Cash
Flow per BOE of production.
— Non-GAAP Operating Earnings (Loss) is a non-GAAP measure defined as net
earnings (loss) excluding non-recurring or non-cash items that
management believes reduces the comparability of the company’s financial
performance between periods. These items may include, but are not
limited to, unrealized gains/losses on risk management, impairments,
restructuring charges, non-operating foreign exchange gains/losses,
gains/losses on divestitures and gains on debt retirement. Income taxes
may include valuation allowances and the provision related to the pre-
tax items listed, as well as income taxes related to divestitures and
adjustments to normalize the effect of income taxes calculated using the
estimated annual effective income tax rate.

/T/

ADVISORY REGARDING RESERVES & OTHER RESOURCES INFORMATION – The conversion of
natural gas volumes to barrels of oil equivalent (BOE) is on the basis of six
thousand cubic feet to one barrel. BOE is based on a generic energy
equivalency conversion method primarily applicable at the burner tip and does
not represent economic value equivalency at the wellhead. Readers are
cautioned that BOE may be misleading, particularly if used in isolation. The
conversion of million British thermal units (MMBtu) is on the basis that one
MMBtu equals one thousand cubic feet (Mcf) based on a standard heat value Mcf.
30-day initial or peak production and other short-term rates are not
necessarily indicative of long-term performance or of ultimate recovery.
Drilling and completions costs in the Permian, Eagle Ford, Duvernay and
Montney have been normalized based on lateral lengths of 7,500 feet, 5,000
feet, 8,200 feet and 9,000 feet, respectively. Premium return well inventory
are locations with expected after tax returns greater than 35 percent at
$50/bbl WTI and $3/MMBtu NYMEX.

ADVISORY REGARDING FORWARD-LOOKING STATEMENTS – This news release contains
certain forward-looking statements or information (collectively, “FLS”) within
the meaning of applicable securities legislation. FLS include: advancement of
and expected growth and returns in Encana’s five-year plan; expectation of
meeting or exceeding the targets in Encana’s corporate guidance; anticipated
production, composition of commodity mix, cash flow and corporate margins;
anticipated costs, ability to maintain or enhance efficiencies, manage
inflation and success of supply chain management; expected costs, capacity and
timing of infrastructure being operational; anticipated hedging and outcomes
of risk management program, including exposure to certain commodity prices,
amount of hedged production and physical sales locations; ability to access
credit facilities and other sources of liquidity; performance of Encana’s
assets relative to peers; advantages of Encana’s multi-basin portfolio and
multi-well pad full-scale development model; and anticipated dividends.

Readers are cautioned against unduly relying on FLS which, by their nature,
involve numerous assumptions, risks and uncertainties that may cause such
statements not to occur, or results to differ materially from those expressed
or implied. These assumptions include: future commodity prices and
differentials; foreign exchange rates; Encana’s ability to access its
revolving credit facilities and shelf prospectuses; assumptions contained in
Encana’s corporate guidance and in the news release; data contained in key
modeling statistics; availability of attractive hedges and enforceability of
risk management program; effectiveness of Encana’s drive to productivity and
efficiencies; results from innovations; the expectation that counterparties
will fulfill their obligations under the gathering, midstream and marketing
agreements; access to transportation and processing facilities where Encana
operates; assumed tax, royalty and regulatory regimes; and expectations and
projections made in light of, and generally consistent with, Encana’s
historical experience and its perception of historical trends, including with
respect to the pace of technological development, the benefits achieved and
general industry expectations.

Risks and uncertainties that may affect these business outcomes include: the
ability to generate sufficient cash flow to meet Encana’s obligations;
commodity price volatility; ability to secure adequate product transportation
and potential pipeline curtailments; variability and discretion of Encana’s
board of directors to declare and pay dividends, if any; the timing and costs
of well, facilities and pipeline construction; business interruption and
casualty losses or unexpected technical difficulties; counterparty and credit
risk; risk and effect of a downgrade in credit rating and its impact on access
to capital markets and other sources of liquidity; fluctuations in currency
and interest rates; risks inherent in Encana’s corporate guidance; failure to
achieve anticipated results from cost and efficiency initiatives; risks
inherent in marketing operations; risks associated with technology; changes in
or interpretation of royalty, tax, environmental, greenhouse gas, carbon,
accounting and other laws or regulations; risks associated with existing and
potential future lawsuits and regulatory actions made against Encana; impact
to Encana as a result of disputes arising with its partners, including the
suspension by its partners of certain of their obligations and the inability
to dispose of assets or interests in certain arrangements; Encana’s ability to
acquire or find additional reserves; imprecision of reserves estimates and
estimates of recoverable quantities of natural gas and liquids from plays and
other sources not currently classified as proved, probable or possible
reserves or economic contingent resources, including future net revenue
estimates; risks associated with past and future acquisitions or divestitures
of certain assets or other transactions or receipt of amounts contemplated
under the transaction agreements (such transactions may include third-party
capital investments, farm-outs or partnerships, which Encana may refer to from
time to time as “partnerships” or “joint ventures” and the funds received in
respect thereof which Encana may refer to from time to time as “proceeds”,
“deferred purchase price” and/or “carry capital”, regardless of the legal
form) as a result of various conditions not being met; and other risks and
uncertainties impacting Encana’s business, as described in its most recent
Annual Report on Form 10-K and as described from time to time in Encana’s
other periodic filings as filed on SEDAR and EDGAR.

Although Encana believes the expectations represented by such FLS are
reasonable, there can be no assurance that such expectations will prove to be
correct. Readers are cautioned that the assumptions, risks and uncertainties
referenced above are not exhaustive. FLS are made as of the date of this news
release and, except as required by law, Encana undertakes no obligation to
update publicly or revise any FLS. The FLS contained in this news release are
expressly qualified by these cautionary statements.

SOURCE: Encana Corporation

– END RELEASE – 02/05/2017

For further information:

Further information on Encana Corporation is available on the company’s website, www.encana.com, or by contacting:

Investor contact:
Brendan McCracken
Vice-President, Investor Relations
(403) 645-2978

Patti Posadowski
Sr. Advisor, Investor Relations
(403) 645-2252

Media contact:
Simon Scott
Vice-President, Communications
(403) 645-2526

Jay Averill
Director, Media Relations
(403) 645-4747

COMPANY:
FOR: ENCANA CORPORATION
TSX Symbol: ECA
NYSE Symbol: ECA

INDUSTRY: Energy and Utilities – Oil and Gas
RELEASE ID: 20170502CC037

Press Release from Marketwired 1-866-736-3779

All press releases are written by the client and have NO affiliation with the news copy written by The Canadian Press. Any questions that arise due to the content or information provided in the press release should be directed to the company/organization
issuing the release, not to The Canadian Press.

GET ENERGYNOW’S DAILY EMAIL FOR FREE


Fortis Reports First Quarter Earnings of $294 million – Part 1

FOR: FORTIS INC.
TSX SYMBOL: FTS
NYSE SYMBOL: FTS

Date issue: May 02, 2017
Time in: 6:00 AM e

Attention:

ST. JOHN’S, NEWFOUNDLAND AND LABRADOR–(Marketwired – May 2, 2017) – Fortis
Inc. (“Fortis” or the “Corporation”) (TSX:FTS)(NYSE:FTS), a leader in the North
American regulated electric and gas utility industry, released its first
quarter results today. The Corporation’s net earnings attributable to common
equity shareholders for the first quarter of 2017 were $294 million, or $0.72
per common share, compared to $162 million, or $0.57 per common share, for the
first quarter of 2016. The quarterly results were heavily influenced by the
addition of electric transmission company ITC Holdings Corp. (“ITC”), acquired
in October 2016.

On an adjusted basis, net earnings attributable to common equity shareholders
for the first quarter were $281 million, or $0.69 per common share, an increase
of $0.02 per common share over the first quarter of 2016. A reconciliation of
adjusted net earnings and adjusted earnings per common share is provided in the
Corporation’s Interim Management Discussion and Analysis for the three months
ended March 31, 2017.

“We had good first quarter earnings and remain on plan for the year,” said
Barry Perry, President and Chief Executive Officer, Fortis. “Increased earnings
at UNS, driven by the rate settlement, and accretion from ITC will contribute
to strong results for the remainder of 2017.”

“The integration of ITC is going well. The final piece of permanent financing
was put in place during the first quarter as we raised $500 million in common
equity through a private placement. In addition, we are on track to deliver our
capital plan for the year,” said Mr. Perry.

Strong first quarter adjusted earnings per share and cash flow; capital
expenditure plan on track

/T/

— Adjusted earnings per common share benefited from the impact of the rate

case at UNS and the accretion associated with the acquisition of ITC,
partially offset by lower earnings at FortisAlberta and unfavourable
foreign exchange associated with US dollar-denominated earnings.
— Earnings per common share growth was tempered by a higher weighted
average number of common shares due to the sale of 12.2 million common
shares, for gross proceeds of $500 million, to an institutional investor
in March 2017.
— Cash flow from operating activities totalled $0.5 billion, an increase
of 12% over the first quarter of 2016. The increase reflects higher
earnings at the regulated utilities, driven by ITC, partially offset by
unfavourable changes in working capital. Operating cash flow from ITC
was less than the normal run rate due to the payment of the United
States Federal Energy Regulatory Commission ordered return on equity
refunds.
— Capital expenditures were $0.7 billion, representing almost one quarter
of the consolidated capital expenditure forecast of $3.0 billion for
2017.

/T/

Execution of growth strategy

The Corporation’s capital program continues to address the infrastructure needs
of customers. The Corporation’s five-year consolidated capital expenditures
through 2021 are expected to be approximately $13 billion, including more than
$3.5 billion of capital expenditures at ITC.

Construction continues on the Tilbury liquefied natural gas (“LNG”) facility
expansion in British Columbia, the Corporation’s largest ongoing capital
project, at an estimated capital cost of $400 million, before allowance for
funds used during construction and development costs. During the quarter the
LNG storage tank was commissioned and key components continue to be installed,
with an expected in-service date of mid-2017.

The Corporation continues to invest in four Multi-Value Projects (“MVPs”) at
ITC, which are regional electric transmission projects that have been
identified by the Midcontinent Independent System Operator to address system
capacity needs and reliability in various states. Approximately US$119 million
was invested in the MVPs from the date of acquisition of ITC and an additional
US$159 million is expected to be spent in 2017. Three of the MVPs are expected
to be completed by the end of 2018, with the fourth scheduled for completion in
2023.

In addition to the Corporation’s base consolidated capital expenditure
forecast, management is pursuing additional investment opportunities within
existing service territories. Specifically, the Corporation continues to pursue
additional LNG infrastructure investment opportunities in British Columbia,
including the potential pipeline expansion to the proposed Woodfibre LNG export
facility and further expansion of its Tilbury LNG facility.

Two significant electric transmission investment opportunities are being
pursued. The Lake Erie Connector project at ITC would connect the Ontario and
PJM Interconnection, LLC grids for the first time, and the Wataynikaneyap Power
project in Northwestern Ontario involves construction of new transmission lines
to connect remote First Nation communities to the electricity grid. During the
quarter a significant milestone was achieved with respect to the Wataynikaneyap
Power project with the approval by the Ontario Energy Board of a deferral
account to recognize development costs incurred between November 2010 and the
commencement of construction. Fortis and its utilities are focused on achieving
key milestones in 2017 to further advance these opportunities.

Regulatory proceedings

Fortis is focused on maintaining constructive regulatory relationships and
outcomes across its utilities.

During the first quarter, Tucson Electric Power Company (“TEP”) received a rate
order that approved new rates that took effect February 27, 2017 and included
an increase in non-fuel base revenue of US$81.5 million, an allowed rate of
return on common shareholder’s equity (“ROE”) of 9.75%, and a common equity
component of capital structure of approximately 50%.

Outlook

The Corporation’s results for 2017 will continue to benefit from the addition
of ITC and the impact of the TEP rate case. Over the long term, Fortis is well
positioned to enhance value for shareholders through the execution of its
capital plan, the balance and strength of its diversified portfolio of utility
businesses, as well as growth opportunities within its franchise regions.

Over the five-year period through 2021, the Corporation’s capital program is
expected to be approximately $13 billion, increasing rate base to almost $30
billion in 2021. Fortis expects this long-term sustainable growth in rate base
to support continuing growth in earnings and dividends.

Fortis has targeted average annual dividend growth of approximately 6% through
2021. This dividend guidance takes into account many factors, including the
expectation of reasonable outcomes for regulatory proceedings at the
Corporation’s utilities, the successful execution of the five-year capital
expenditure program, and management’s continued confidence in the strength of
the Corporation’s diversified portfolio of utilities and record of operational
excellence.

“Our diversified portfolio of utilities and highly executable capital plan
allow us to deliver low-risk growth,” commented Mr. Perry. “We remain focused
on continuing to achieve strong operational and financial performance in 2017
while we continue to execute on our strategy and integrate ITC into our
business.”

/T/

Teleconference to Discuss First Quarter 2017 Results

A teleconference and webcast will be held on May 2 at 8:30 a.m. (Eastern).
Barry Perry, President and Chief Executive Officer and Karl Smith, Executive
Vice President, Chief Financial Officer, will discuss the Corporation’s
first quarter 2017 results.

Analysts, members of the media and other interested parties in North America
are invited to participate by calling 1.877.223.4471. International
participants may participate by calling 647.788.4922. Please dial in 10
minutes prior to the start of the call. No pass code is required.

A live and archived audio webcast of the teleconference will be available on
the Corporation’s website, http://www.fortisinc.com/.

A replay of the conference will be available two hours after the conclusion
of the call until June 2, 2017. Please call 1.800.585.8367 or 416.621.4642
and enter pass code 94192862.

/T/

Interim Management Discussion and Analysis

For the three months ended March 31, 2017

Dated May 1, 2017

FORWARD-LOOKING INFORMATION

The following Fortis Inc. (“Fortis” or the “Corporation”) Management Discussion
and Analysis (“MD&A”) has been prepared in accordance with National Instrument
51-102 – Continuous Disclosure Obligations. The MD&A should be read in
conjunction with the interim unaudited consolidated financial statements and
notes thereto for the three months ended March 31, 2017 and the MD&A and
audited consolidated financial statements for the year ended December 31, 2016
included in the Corporation’s 2016 Annual Report. Financial information
contained in the MD&A has been prepared in accordance with accounting
principles generally accepted in the United States (“US GAAP”) and is presented
in Canadian dollars unless otherwise specified.

Fortis includes forward-looking information in the MD&A within the meaning of
applicable securities laws including the Private Securities Litigation Reform
Act of 1995. Forward-looking information included in the MD&A reflect
expectations of Fortis management regarding future growth, results of
operations, performance and business prospects and opportunities as of May 1,
2017. Wherever possible, words such as “anticipates”, “believes”, “budgets”,
“could”, “estimates”, “expects”, “forecasts”, “intends”, “may”, “might”,
“plans”, “projects”, “schedule”, “should”, “target”, “will”, “would” and the
negative of these terms and other similar terminology or expressions have been
used to identify the forward-looking information, which include, without
limitation: the expected timing of filing of regulatory applications and
receipt and outcome of regulatory decisions; the expectation that the
Corporation’s 2017 results will continue to benefit from the acquisition of ITC
and the impact of Tucson Electric Power Company’s general rate case; the
Corporation’s forecast gross consolidated and segmented capital expenditures
for 2017 and from 2017 to 2021; the nature, timing and expected costs of
certain capital projects including, without limitation, expansions of the
Tilbury liquefied natural gas (“LNG”) facility and Multi-Value Projects, and
additional opportunities including the pipeline expansion to the Woodfibre LNG
site, the Wataynikaneyap Project and the Lake Erie Connector Project; the
expectation that the Corporation’s significant capital expenditure program will
support continuing growth in earnings and dividends; expected consolidated
fixed-term debt maturities and repayments over the next five years; the
expectation that subsidiary operating expenses and interest costs will be paid
out of subsidiary operating cash flows; the expectation that cash required to
complete subsidiary capital expenditure programs will be sourced from a
combination of borrowings under credit facilities, long-term debt offerings and
equity injections from Fortis;
the expectation that borrowings under credit facilities may be required from
time to time to support seasonal working capital requirements; the expectation
that cash required of Fortis to support subsidiary capital expenditure programs
and finance acquisitions will be derived from a combination of borrowings under
the Corporation’s committed corporate credit facility and proceeds from the
issuance of common shares, preference shares and long-term debt and advances
from minority investors; the expectation that borrowings under the
Corporation’s committed corporate credit facility may be required from time to
time to support the servicing of debt and payment of dividends; the expectation
that maintaining the targeted capital structure of the Corporation’s regulated
operating subsidiaries will not have an impact on its ability to pay dividends
in the foreseeable future; the intent of management to refinance certain
borrowings under Corporation’s and subsidiaries’ long-term committed credit
facilities with long-term permanent financing; the expectation that the
Corporation and its subsidiaries will remain compliant with debt covenants
throughout 2017; the expectation that long-term debt will not be settled prior
to maturity; the expectation that any liability from current legal proceedings
and claims will not have a material adverse effect on the Corporation’s
consolidated financial position, results of operations or cash flows; the
expectation that the ITC shareholder litigation settlement, if approved, will
not have a significant impact on the financial condition or results of
operation of ITC Holdings; target average annual dividend growth through 2021;
the Corporation’s forecast rate base over the five-year period through 2021;
and the expectation that the adoption of future accounting pronouncements will
not have a material impact on the Corporation’s consolidated financial
statements.

Certain material factors or assumptions have been applied in drawing the
conclusions contained in the forward-looking statements, including, without
limitation: the receipt of applicable regulatory approvals and requested rate
orders, no material adverse regulatory decisions being received, and the
expectation of regulatory stability; no material capital project and financing
cost overrun related to any of the Corporation’s capital projects; the
realization of additional opportunities including natural gas related
infrastructure and generation; the Board of Directors exercising its discretion
to declare dividends, taking into account the business performance and
financial conditions of the Corporation; no significant variability in interest
rates; no significant operational disruptions or environmental liability due to
a catastrophic event or environmental upset caused by severe weather, other
acts of nature or other major events; the continued ability to maintain the
electricity and gas systems to ensure their continued performance; no severe
and prolonged downturn in economic conditions; no significant decline in
capital spending; sufficient liquidity and capital resources; the continuation
of regulator-approved mechanisms to flow through the cost of natural gas and
energy supply costs in customer rates; the ability to hedge exposures to
fluctuations in foreign exchange rates, natural gas prices and electricity
prices; no significant changes in tax laws; no significant counterparty
defaults; the continued competitiveness of natural gas pricing when compared
with electricity and other alternative sources of energy; the continued
availability of natural gas, fuel, coal and electricity supply; continuation
and regulatory approval of power supply and capacity purchase contracts; the
ability to fund defined benefit pension plans, earn the assumed long-term rates
of return on the related assets and recover net pension costs in customer
rates; no significant changes in government energy plans, environmental laws
and regulations that may materially negatively affect the Corporation and its
subsidiaries; maintenance of adequate insurance coverage; the ability to obtain
and maintain licences and permits; retention of existing service areas; the
continued tax deferred treatment of earnings from the Corporation’s Caribbean
operations; continued maintenance of information technology infrastructure and
no material breach of cyber-security; continued favourable relations with First
Nations; favourable labour relations; that the Corporation can reasonably
assess the merit of and potential liability attributable to ongoing legal
proceedings; and sufficient human resources to deliver service and execute the
capital program.

Forward-looking statements involve significant risks, uncertainties and
assumptions. Fortis cautions readers that a number of factors could cause
actual results, performance or achievements to differ materially from the
results discussed or implied in the forward-looking statements. These factors
should be considered carefully and undue reliance should not be placed on the
forward-looking statements. Risk factors which could cause results or events to
differ from current expectations are detailed under the heading “Business Risk
Management” in this MD&A and in continuous disclosure materials filed from time
to time with Canadian securities regulatory authorities and the Securities and
Exchange Commission. Key risk factors for 2017 include, but are not limited to:
uncertainty regarding the outcome of regulatory proceedings at the
Corporation’s utilities; uncertainty of the impact a continuation of a low
interest rate environment may have on the allowed rate of return on common
shareholders’ equity at the Corporation’s regulated utilities; the impact of
fluctuations in foreign exchange rates; uncertainty related to proposed tax
reform in the United States; risk associated with the impacts of less
favourable economic conditions on the Corporation’s results of operations; risk
that the expected benefits of the acquisition of ITC may fail to materialize,
or may not occur within the time periods anticipated; risk associated with the
Corporation’s ability to comply with Section 404(a) of the Sarbanes-Oxley Act
of 2002 and the related rules of the U.S. Securities and Exchange Commission
and the Public Company Accounting Oversight Board; risk associated with the
completion of the Corporation’s 2017 capital expenditures plan, including
completion of major capital projects in the timelines anticipated and at the
expected amounts; and uncertainty in the timing and access to capital markets
to arrange sufficient and cost-effective financing to finance, among other
things, capital expenditures and the repayment of maturing debt.

GET ENERGYNOW’S DAILY EMAIL FOR FREE


Fortis Reports First Quarter Earnings of $294 million – Part 3

CENTRAL HUDSON

/T/

—————————————————————————-
Financial Highlights (Unaudited) Quarter Ended March 31
2017 2016 Variance
—————————————————————————-
Average US:CAD Exchange Rate (1) 1.32 1.37 (0.05)
—————————————————————————-
Electricity Sales (GWh) 1,244 1,255 (11)
Gas Volumes (PJ) 9 9 –
Revenue ($ millions) 258 249 9
Earnings ($ millions) 23 24 (1)
—————————————————————————-
(1) The reporting currency of Central Hudson is the US dollar.

/T/

Electricity Sales & Gas Volumes

The decrease in electricity sales was primarily due to lower average
consumption as a result of warmer temperatures. Gas volumes were comparable
with the same period in 2016.

Changes in electricity sales and gas volumes at Central Hudson are subject to
regulatory revenue decoupling mechanisms and, as a result, do not have a
material impact on revenue and earnings.

Revenue

The increase in revenue was due to higher delivery revenue from increases in
base electricity rates effective July 1, 2016 and the recovery from customers
of higher gas commodity costs, partially offset by approximately $9 million of
unfavourable foreign exchange associated with the translation of US
dollar-denominated revenue.

Earnings

The decrease in earnings was primarily due to approximately $1 million of
unfavourable foreign exchange associated with the translation of US
dollar-denominated earnings and higher-than-expected storm restoration costs
incurred in the first quarter of 2017, partially offset by increases in
delivery revenue.

REGULATED GAS UTILITY – CANADIAN

FORTISBC ENERGY

/T/

—————————————————————————-
Financial Highlights (Unaudited) Quarter Ended March 31
2017 2016 Variance
—————————————————————————-
Gas Volumes (PJ) 83 68 15
Revenue ($ millions) 449 406 43
Earnings ($ millions) 97 92 5
—————————————————————————-

/T/

Gas Volumes

The increase in gas volumes was primarily due to growth in the number of
customers and higher average consumption by residential and commercial
customers as a result of colder temperatures. Also contributing to the increase
was higher volumes for transportation customers due to additional customers
switching to natural gas compared to alternative fuel sources.

Revenue

The increase in revenue was primarily due to higher gas volumes and a higher
commodity cost of natural gas charged to customers.

Earnings

The increase in earnings was primarily due to the timing of quarterly revenue
and operating expenses as compared to the same period in 2016. Also
contributing to the increase was higher AFUDC.

FortisBC Energy earns approximately the same margin regardless of whether a
customer contracts for the purchase and delivery of natural gas or only for the
delivery of natural gas. As a result of the operation of regulatory deferral
mechanisms, changes in consumption levels and the cost of natural gas do not
materially affect earnings.

REGULATED ELECTRIC UTILITIES – CANADIAN

FORTISALBERTA

/T/

—————————————————————————-
Financial Highlights (Unaudited) Quarter Ended March 31
2017 2016 Variance
—————————————————————————-
Energy Deliveries (GWh) 4,551 4,556 (5)
Revenue ($ millions) 147 142 5
Earnings ($ millions) 25 31 (6)
—————————————————————————-

/T/

Energy Deliveries

The decrease in energy deliveries was primarily due to lower average
consumption by oil and gas customers as a result of decreased oil and gas
activity in Alberta. The decrease was largely offset by higher average
consumption by residential, commercial and farm customers as a result of colder
temperatures and growth in the numbers of customers.

Revenue

The increase in revenue was primarily due to an increase in capital tracker
revenue and higher revenue related to the flow through of costs to customers.
The increase was partially offset by a decrease in customer rates effective
January 1, 2017 based on a combined inflation and productivity factor of
negative 1.9% and lower average consumption.

Earnings

The decrease in earnings was primarily due to a decrease in customer rates, as
discussed above, and higher operating expenses, partially offset by an increase
in capital tracker revenue.

FORTISBC ELECTRIC (1)

/T/

—————————————————————————-
Financial Highlights (Unaudited) Quarter Ended March 31
2017 2016 Variance
—————————————————————————-
Electricity Sales (GWh) 945 851 94
Revenue ($ millions) 113 104 9
Earnings ($ millions) 15 15 –
—————————————————————————-
(1) Includes the regulated operations of FortisBC Inc. and operating,
maintenance and management services related to the Waneta, Brilliant and
Arrow Lakes hydroelectric generating plants.

/T/

Electricity Sales

The increase in electricity sales was primarily due to higher average
consumption as a result of colder temperatures.

Revenue

The increase in revenue was primarily due to higher electricity sales and an
increase in base electricity rates effective January 1, 2017, partially offset
by higher flow-through adjustments owing to customers.

Earnings

Earnings were comparable with the same period in 2016.

Variances from regulated forecasts used to set rates for electricity revenue
and power purchase costs are flowed back to customers in future rates through
approved regulatory deferral mechanisms and, therefore, these variances do not
have an impact on earnings.

EASTERN CANADIAN ELECTRIC UTILITIES (1)

/T/

—————————————————————————-
Financial Highlights (Unaudited) Quarter Ended March 31
2017 2016 Variance
—————————————————————————-
Electricity Sales (GWh) 2,737 2,706 31
Revenue ($ millions) 332 329 3
Earnings ($ millions) 18 18 –
—————————————————————————-
(1) Comprised of Newfoundland Power Inc., Maritime Electric Company, Limited
and FortisOntario Inc. (“FortisOntario”).

/T/

Electricity Sales

The increase in electricity sales was due to higher average consumption and
growth in the number of customers.

Revenue

The increase in revenue was due to higher electricity sales and an increase in
customer rates effective July 1, 2016 at Newfoundland Power, partially offset
by the flow through in customer electricity rates of lower energy supply costs.

Earnings

Earnings were comparable with the same period in 2016.

REGULATED ELECTRIC UTILITIES – CARIBBEAN (1)

/T/

—————————————————————————-
Financial Highlights (Unaudited) Quarter Ended March 31
2017 2016 Variance
—————————————————————————-
Average US:CAD Exchange Rate (2) 1.32 1.37 (0.05)
—————————————————————————-
Electricity Sales (GWh) 191 190 1
Revenue ($ millions) 70 75 (5)
Earnings ($ millions) 8 10 (2)
—————————————————————————-
(1) Comprised of Caribbean Utilities Company, Ltd. (“Caribbean Utilities”),
in which Fortis holds an approximate 60% controlling interest, and two
wholly owned utilities, FortisTCI Limited and Turks and Caicos Utilities
Limited (collectively “Fortis Turks and Caicos”). Also includes the
Corporation’s 33% equity investment in Belize Electricity Limited
(“Belize Electricity”).
(2) The reporting currency of Caribbean Utilities and Fortis Turks and
Caicos is the US dollar. The reporting currency of Belize Electricity is
the Belizean dollar, which is pegged to the US dollar at
BZ$2.00=US$1.00.

/T/

Electricity Sales

Electricity sales were comparable with the same period in 2016.

Revenue

The decrease in revenue was mainly due to approximately $3 million of
unfavourable foreign exchange associated with the translation of US
dollar-denominated revenue and the flow through in customer electricity rates
of lower fuel costs.

Earnings

The decrease in earnings was primarily due to a decrease in equity income from
Belize Electricity.

NON-REGULATED – ENERGY INFRASTRUCTURE (1)

/T/

—————————————————————————-
Financial Highlights (Unaudited) Quarter Ended March 31
2017 2016 Variance
—————————————————————————-
Energy Sales (GWh) 82 89 (7)
Revenue ($ millions) 56 29 27
Earnings ($ millions) 23 11 12
—————————————————————————-
(1) Primarily comprised of long-term contracted generation assets in British
Columbia and Belize, with a combined generating capacity of 391 MW, and
the Aitken Creek natural gas storage facility in British Columbia, with
a total working gas capacity of 77 billion cubic feet.

/T/

Energy Sales

The decrease in energy sales was primarily due to decreased production in
Belize due to lower rainfall.

Revenue

The increase in revenue was driven by the acquisition of Aitken Creek in April
2016, with revenue of $26 million recognized in the first quarter of 2017.

Earnings

The increase in earnings was driven by earnings contribution of $13 million
from Aitken Creek, which includes an after-tax $6 million unrealized gain on
the mark-to-market of derivatives.

CORPORATE AND OTHER (1)

/T/

—————————————————————————-
Financial Highlights (Unaudited) Quarter Ended March 31
($ millions) 2017 2016 Variance
—————————————————————————-
Revenue – 1 (1)
Operating Expenses 12 25 (13)
Other Income (Expenses), Net – 3 (3)
Finance Charges 50 28 22
Income Tax Recovery (31) (17) (14)
—————————————————————————-
(31) (32) 1
Preference Share Dividends 16 19 (3)
—————————————————————————-
Net Corporate and Other Expenses (47) (51) 4
—————————————————————————-
(1) Includes Fortis net Corporate expenses and non-regulated holding company
expenses.

/T/

Net Corporate and Other expenses in the first quarter of 2016 were impacted by
acquisition-related expenses associated with ITC totalling $20 million ($17
million after tax). Acquisition-related expenses included: (i) investment
banking, legal, consulting and other fees totalling approximately $16 million
($14 million after tax), which were included in operating expenses; and (ii)
fees associated with the Corporation’s acquisition credit facilities totalling
approximately $4 million ($3 million after tax), which were included in finance
charges.

Excluding the above-noted items, net Corporate and Other expenses were $47
million for the first quarter of 2017 compared to $34 million for the same
period last year. The increase was primarily due to higher finance charges, a
decrease in other income, and higher operating expenses, partially offset by a
higher income tax recovery and lower preference share dividends.

The increase in finance charges was mainly due to the acquisitions of ITC and
Aitken Creek in October 2016 and April 2016, respectively. The decrease in
other income was primarily due to the release of provisions on the wind-up of a
partnership in the first quarter of 2016. The increase in operating expenses
was mainly due to higher compensation-related expenditures, general
inflationary increases and ancillary expenses to support the acquisition of ITC
and the Corporation’s listing on the New York Stock Exchange. The higher income
tax recovery was mainly related to the increase in Corporate and Other finance
charges. The decrease in preference share dividends was due to the redemption
of First Preference Shares, Series E in September 2016.

REGULATORY HIGHLIGHTS

The nature of regulation associated with each of the Corporation’s regulated
electric and gas utilities is generally consistent with that disclosed in the
2016 Annual MD&A. The following summarizes the significant ongoing regulatory
proceedings and significant decisions and applications for the Corporation’s
regulated utilities in the first quarter of 2017.

ITC

ROE Complaints

Since 2013 two third-party complaints were filed with FERC requesting that FERC
find the Midcontinent Independent System Operator (“MISO”) regional base ROE
for all MISO transmission owners, including some of ITC’s operating
subsidiaries, for the periods November 2013 through February 2015 (the “Initial
Refund Period” or “Initial Complaint”) and February 2015 through May 2016 (the
“Second Refund Period” or “Second Complaint”) to no longer be just and
reasonable. In September 2016 FERC issued an order affirming the presiding
Administrative Law Judge’s (“ALJ”) initial decision for the Initial Refund
Period and setting the base ROE for the Initial Refund Period at 10.32%, with a
maximum ROE of 11.35%. Additionally, the rates established by the September
2016 order will be used prospectively from the date of the order until a new
approved rate is established for the Second Refund Period. FERC’s September
2016 order regarding the Initial Complaint is currently under appeal by the
MISO transmission owners. In June 2016 the presiding ALJ issued an initial
decision for the Second Refund Period, which recommended a base ROE of 9.70%,
with a maximum ROE of 10.68%, which is a recommendation to FERC.

During the first quarter of 2017, ITC provided a refund of US$121 million,
including interest, for the Initial Refund Period. This refund is subject to a
final true-up pursuant to the refund process which is expected to be finalized
during the second quarter of 2017. As at March 31, 2017, the estimated range of
refunds for the Second Refund Period was between US$103 million to US$140
million and ITC has recognized an aggregated estimated regulatory liability of
US$140 million.

The estimated regulatory liabilities were accrued by ITC before its acquisition
by Fortis. There is uncertainty regarding the final outcome of the Initial and
Second Complaints and the timing of the completion of these matters. This is
due, in part, to a recent court decision requiring FERC to further justify the
methodology used to establish new ROEs. It is possible that the outcome of
these matters could differ materially from the estimated range of refunds.

UNS Energy

General Rate Application

In February 2017 the Arizona Corporation Commission issued a rate order for new
rates that took effect February 27, 2017 (“2017 Rate Order”). Provisions of the
2017 Rate Order include: (i) an increase in non-fuel base revenue of US$81.5
million, including US$15 million of operating costs related to the 50.5%
undivided interest in Unit 1 of Springerville Generating Station purchased by
TEP in September 2016; (ii) a 7.04% return on original cost rate base,
including a cost of equity of 9.75% and an embedded cost of long-term debt of
4.32%; (iii) a common equity component of capital structure of approximately
50%; and (iv) the adoption of proposed depreciation rates which reflect a
reduction in the depreciable life for Unit 1 of San Juan Generating Station.
Certain aspects of the general rate application, including net metering and
rate design for new distributed generation customers, have been deferred to a
second phase of TEP’s rate case proceeding, which is expected to be completed
by the end of 2017. TEP cannot predict the outcome of this proceeding.

GET ENERGYNOW’S DAILY EMAIL FOR FREE


Fortis Reports First Quarter Earnings of $294 million – Part 5

The consolidated capital structure of Fortis is presented in the following
table.

/T/

—————————————————————————-
Capital Structure (Unaudited) As at
March 31, 2017 December 31, 2016
($ millions) (%) ($ millions) (%)
—————————————————————————-
Total debt and capital lease and
finance obligations (net of cash) (1) 22,141 59.3 22,490 60.6
Preference shares 1,623 4.3 1,623 4.4
Common shareholders’ equity 13,588 36.4 12,974 35.0
—————————————————————————-
Total 37,352 100.0 37,087 100.0
—————————————————————————-
(1) Includes long-term debt and capital lease and finance obligations,
including current portion, and short-term borrowings, net of cash

/T/

Including amounts related to non-controlling interests, the Corporation’s
capital structure as at March 31, 2017 was 56.5% total debt and capital lease
and finance obligations (net of cash), 4.1% preference shares, 34.7% common
shareholders’ equity and 4.7% non-controlling interests (December 31, 2016 –
57.8% total debt and capital lease and finance obligations (net of cash), 4.2%
preference shares, 33.3% common shareholders’ equity and 4.7% non-controlling
interests). The change in the Corporation’s capital structure was mainly due to
an increase in common equity at the Corporation due to the issuance of $500
million of common shares, used to repay short-term borrowings.

CREDIT RATINGS

As at March 31, 2017, the Corporation’s credit ratings were as follows.

/T/

Rating Agency Credit Rating Type of Rating Outlook
—————————————————————————-
Standard & Poor’s A- Corporate Stable
BBB+ Unsecured debt Stable
DBRS BBB (high) Unsecured debt Stable
Moody’s Investor Service Baa3 Issuer Stable
Baa3 Unsecured debt Stable

/T/

The above-noted credit ratings reflect the Corporation’s low business-risk
profile and diversity of its operations, the stand-alone nature and financial
separation of each of the regulated subsidiaries of Fortis, and the level of
debt at the holding company.

CAPITAL EXPENDITURE PROGRAM

A breakdown of the $709 million in gross consolidated capital expenditures by
segment year-to-date 2017 is provided in the following table.

/T/

—————————————————————————-
Gross Consolidated Capital Expenditures (Unaudited) (1)
Year-to-Date March 31, 2017
($ millions)
—————————————————————————-

Regulated
——————————————————————

UNS Central FortisBC Fortis FortisBC
ITC Energy Hudson Energy Alberta Electric
—————————————————————————-
Total 268 127 50 94 93 21
—————————————————————————-

—————————————————————————-
Gross Consolidated Capital Expenditures (Unaudited) (1)
Year-to-Date March 31, 2017
($
millions)
—————————————————————————-

Regulated
————————
Total
Eastern Caribbean Regulated Non-Regulated
Canadian Electric Utilities (2) Total
—————————————————————————-
Total 27 25 705 4 709
—————————————————————————-
(1) Represents cash payments to construct capital and intangible assets, as
reflected on the consolidated statement of cash flows. Excludes the non-
cash equity component of AFUDC.
(2) Includes Energy Infrastructure and Corporate and Other segments

/T/

Planned capital expenditures are based on detailed forecasts of energy demand,
weather, cost of labour and materials, as well as other factors, including
economic conditions, which could change and cause actual expenditures to differ
from those forecast.

Gross consolidated capital expenditures for 2017 are forecast to be
approximately $3.0 billion. There have been no material changes in the overall
expected level, nature and timing of the Corporation’s significant capital
projects from those that were disclosed in the 2016 Annual MD&A.

At ITC approximately US$119 million was invested in the Multi-Value Projects
(“MVPs”) from the date of acquisition and an additional US$159 million is
expected to be spent in 2017. The MVPs consist of four regional electric
transmission projects that have been identified by MISO to address system
capacity needs and reliability in various states.

FortisBC Energy’s construction of the Tilbury liquefied natural gas (“LNG”)
facility expansion (“Tilbury LNG Facility Expansion”) in British Columbia is
ongoing. Approximately $424 million, including AFUDC and development costs, has
been invested to the end of the first quarter of 2017. The total cost of the
project scope that is currently under construction is estimated at
approximately $470 million, including approximately $70 million of AFUDC and
development costs, which could be impacted depending on the date the project is
considered in service for rate-making purposes. The facility includes a second
LNG tank and a new liquefier, both to be in service in mid-2017. Key activities
during the first quarter included commissioning of the LNG storage tank and the
continued installation of the liquefaction process area piping insulation,
electrical and instrumentation cable and terminations.

Beginning with the first Order in Council (“OIC”) in 2013, the Government of
British Columbia continues to support the Tilbury LNG Facility Expansion. The
most recent OIC issued in March 2017 further facilitates the expansion of the
facility by increasing the capital cost limit to $425 million from $400
million, before AFUDC and development costs. This latest OIC also provides
greater discretion around when certain projects approved pursuant to previous
OICs, including the Tilbury LNG Facility Expansion, could be added to rate base.

Over the five-year period 2017 through 2021, gross consolidated capital
expenditures are expected to be approximately $13 billion. The breakdown of the
capital spending has not changed materially from that disclosed in the 2016
Annual MD&A.

ADDITIONAL INVESTMENT OPPORTUNITIES

In addition to the Corporation’s base consolidated capital expenditure
forecast, management is pursuing additional investment opportunities within
existing service territories. These additional investment opportunities, as
discussed below, are not included in the Corporation’s base capital expenditure
forecast.

The Corporation continues to pursue additional LNG infrastructure investment
opportunities in British Columbia, including a pipeline expansion to the
proposed Woodfibre LNG site and a further expansion of Tilbury.

FortisBC Energy’s potential pipeline expansion is conditional on Woodfibre LNG
proceeding with its LNG export facility. FortisBC Energy received an OIC from
the Government of British Columbia effectively exempting this project from
further regulatory approval by the British Columbia Utilities Commission.
Woodfibre LNG has obtained an export license from the National Energy Board and
received environmental assessment approvals from the Squamish First Nation, the
British Columbia Environmental Assessment Office, and the Canadian
Environmental Assessment Agency. FortisBC Energy also received environmental
assessment approval from the Squamish First Nation and provincial environmental
assessment approval in 2016. The potential pipeline expansion was initially
estimated at a total project cost of up to $600 million, however, this estimate
will be updated for final scoping, detailed construction estimates and
scheduling. In November 2016 Woodfibre LNG announced the approval from its
parent company, Pacific Oil & Gas Limited, which is part of the Singapore-based
RGE group of companies, of the funds necessary to complete the project. This
project may move forward pending additional approvals and a final investment
decision by Woodfibre LNG but is not expected to be in service earlier than
2020.

The Corporation’s Tilbury LNG facility is uniquely positioned to meet customer
demand for clean-burning natural gas. The site is scalable and can accommodate
additional storage and liquefaction equipment, and is relatively close to
international shipping lanes. Fortis continues to have discussions with a
number of potential export customers.

In January 2017 ITC received approval of a Presidential Permit from the U.S.
Department of Energy for the Lake Erie Connector transmission line, which is a
required approval for international border-crossing projects. Also in January,
ITC received a report from Canada’s National Energy Board recommending the
issuance of a Certificate of Public Convenience and Necessity (“CPCN”) with
prescribed conditions for the transmission line. The Lake Erie Connector
project at ITC is a proposed 1,000 MW, bi-directional, high-voltage direct
current underwater transmission line that would provide the first direct link
between the markets of the Ontario Independent Electricity System Operator and
PJM Interconnection, LLC (“PJM”). The project would enable transmission
customers to more efficiently access energy, capacity and renewable energy
credit opportunities in both markets. The project continues to advance through
regulatory, operational, and economic milestones. Key milestones for 2017
include: receiving final approval of the CPCN from Canada’s Governor in Council
with a decision expected on or before June 30, 2017; receiving approval from
the U.S. Army Corps of Engineers and Pennsylvania Department of Environmental
Protection in a joint application; completing project cost refinements; and
securing favourable transmission service agreements with prospective
counterparties. Pending achievement of key milestones, the expected in-service
date for the project is late 2020.

The Wataynikaneyap Power Project continues to advance in Ontario.
Wataynikaneyap Power consists of a partnership between 22 First Nations and
FortisOntario, with a mandate to develop new transmission lines to connect
remote First Nations communities to the electricity grid in Ontario. In 2016
the Government of Ontario designated Wataynikaneyap Power as the licensed
transmission company to complete this project. FortisOntario reached an
agreement with Renewable Energy Systems Canada in December 2016 to acquire its
ownership interest in the Wataynikaneyap Partnership. The transaction was
approved by the Ontario Energy Board (“OEB”) and closed in March 2017. As a
result, FortisOntario’s ownership interest in the Wataynikaneyap Partnership
has increased to 49%, with the remaining 51% ownership interest held by the 22
First Nations communities. The total estimated capital cost for the project,
subject to final cost estimation, is approximately $1.35 billion and is
expected to contribute to significant savings for the First Nations communities
and result in a significant reduction in greenhouse gas emissions. In March
2017 the project reached a significant milestone with the approval by the OEB
of a deferral account to recognize development costs incurred between November
2010 and the commencement of construction. In addition to environmental
assessments underway, other regulatory approvals are currently being sought and
the next regulatory milestone will be the preparation and filing of the leave
to construct with the OEB. Construction will commence pending the receipt of
permits, approvals and a cost-sharing agreement between the federal and
provincial government.

The Corporation also has other significant opportunities that have not yet been
included in the Corporation’s capital expenditure forecast including, but not
limited to: transmission investment opportunities at ITC; investment
opportunities in New York Transco, LLC to address electric transmission
constraints in New York State at CH Energy; renewable energy alternatives,
gas-fired generation and transmission investments at UNS Energy; and further
gas infrastructure opportunities at FortisBC Energy.

CASH FLOW REQUIREMENTS

At the subsidiary level, it is expected that operating expenses and interest
costs will generally be paid out of subsidiary operating cash flows, with
varying levels of residual cash flows available for subsidiary capital
expenditures and/or dividend payments to Fortis. Borrowings under credit
facilities may be required from time to time to support seasonal working
capital requirements. Cash required to complete subsidiary capital expenditure
programs is also expected to be financed from a combination of borrowings under
credit facilities, long-term debt offerings and equity injections from Fortis.

The Corporation’s ability to service its debt obligations and pay dividends on
its common and preference shares is dependent on the financial results of the
operating subsidiaries and the related cash payments from these subsidiaries.
Certain regulated subsidiaries may be subject to restrictions that may limit
their ability to distribute cash to Fortis. These include restrictions by
certain regulators limiting the amount of annual dividends and restrictions by
certain lenders limiting the amount of debt to total capitalization at the
subsidiaries. In addition, there are practical limitations on using the net
assets of each of the Corporation’s regulated operating subsidiaries to pay
dividends based on management’s intent to maintain the regulator-approved
capital structures for each of its regulated operating subsidiaries. The
Corporation does not expect that maintaining the targeted capital structures of
its regulated operating subsidiaries will have an impact on its ability to pay
dividends in the foreseeable future.

Cash required of Fortis to support subsidiary capital expenditure programs and
finance acquisitions is expected to be derived from a combination of borrowings
under the Corporation’s committed corporate credit facility and proceeds from
the issuance of common shares, preference shares and long-term debt, and
advances from minority investors. Depending on the timing of cash payments from
the subsidiaries, borrowings under the Corporation’s committed corporate credit
facility may be required from time to time to support the servicing of debt and
payment of dividends.

In November 2016 Fortis filed a short-form base shelf prospectus, under which
the Corporation may issue common or preference shares, subscription receipts or
debt securities in an aggregate principal amount of up to $5 billion during the
25-month life of the base shelf prospectus. In March 2017 Fortis issued $500
million common equity and in December 2016 issued $500 million unsecured notes
at 2.85%, both under the base shelf prospectus.

In April 2017 ITC issued 30-year US$200 million 4.16% secured first mortgage
bonds. The net proceeds from the issuance was used to repay credit facility
borrowings and for general corporate purposes.

As at March 31, 2017, management expects consolidated fixed-term debt
maturities and repayments to average approximately $740 million annually over
the next five years. The combination of available credit facilities and
manageable annual debt maturities and repayments provides the Corporation and
its subsidiaries with flexibility in the timing of access to capital markets.

Fortis and its subsidiaries were in compliance with debt covenants as at March
31, 2017 and are expected to remain compliant throughout 2017.

CREDIT FACILITIES

As at March 31, 2017, the Corporation and its subsidiaries had consolidated
credit facilities of approximately $5.4 billion, of which approximately $3.8
billion was unused, including $909 million unused under the Corporation’s
committed revolving corporate credit facility. The credit facilities are
syndicated mostly with large banks in Canada and the United States, with no one
bank holding more than 20% of these facilities. Approximately $5.0 billion of
the total credit facilities are committed facilities with maturities ranging
from 2017 through 2021.

GET ENERGYNOW’S DAILY EMAIL FOR FREE


Fortis Reports First Quarter Earnings of $294 million – Part 12

The fair value of long-term debt is calculated using quoted market prices when
available. When quoted market prices are not available, as is the case with the
Waneta Partnership promissory note and certain long-term debt, the fair value
is determined by either: (i) discounting the future cash flows of the specific
debt instrument at an estimated yield to maturity equivalent to benchmark
government bonds or treasury bills with similar terms to maturity, plus a
credit risk premium equal to that of issuers of similar credit quality; or (ii)
obtaining from third parties indicative prices for the same or similarly rated
issues of debt of the same remaining maturities. Since the Corporation does not
intend to settle the long-term debt or promissory note prior to maturity, the
excess of the estimated fair value above the carrying value does not represent
an actual liability.

15. FINANCIAL RISK MANAGEMENT

The Corporation is primarily exposed to credit risk, liquidity risk and market
risk as a result of holding financial instruments in the normal course of
business.

/T/

Credit risk Risk that a counterparty to a financial instrument might fail
to meet its obligations under the terms of the financial
instrument.
Liquidity risk Risk that an entity will encounter difficulty in raising
funds to meet commitments associated with financial
instruments.
Market risk Risk that the fair value or future cash flows of a financial
instrument will fluctuate due to changes in market prices.
The Corporation is exposed to foreign exchange risk, interest
rate risk and commodity price risk.

/T/

Credit Risk

For cash equivalents, trade and other accounts receivable, and long-term other
receivables, the Corporation’s credit risk is generally limited to the carrying
value on the consolidated balance sheet. The Corporation generally has a large
and diversified customer base, which minimizes the concentration of credit
risk. The Corporation and its subsidiaries have various policies to minimize
credit risk, which include requiring customer deposits, prepayments and/or
credit checks for certain customers and performing disconnections and/or using
third-party collection agencies for overdue accounts.

ITC has a concentration of credit risk as a result of approximately 70% of its
revenue being derived from three primary customers. Credit risk is limited as
such customers have investment-grade credit ratings. ITC also reduces its
exposure to credit risk by requiring a letter of credit or cash deposit equal
to the credit exposure, which is determined by a credit-scoring model and other
factors.

FortisAlberta has a concentration of credit risk as a result of its
distribution service billings being to a relatively small group of retailers.
As at March 31, 2017, FortisAlberta’s gross credit risk exposure was
approximately $127 million, representing the projected value of retailer
billings over a 37-day period. The Company has reduced its exposure to $2
million by obtaining from the retailers either a cash deposit, bond, letter of
credit, an investment-grade credit rating from a major rating agency, or a
financial guarantee from an entity with an investment-grade credit rating.

UNS Energy, Central Hudson, FortisBC Energy and Aitken Creek may be exposed to
credit risk in the event of non-performance by counterparties to derivative
instruments. The Companies use netting arrangements to reduce credit risk and
net settle payments with counterparties where net settlement provisions exist.
They also limit credit risk by mostly dealing with counterparties that have
investment-grade credit ratings. At UNS Energy, contractual arrangements also
contain certain provisions requiring counterparties to derivative instruments
to post collateral under certain circumstances.

Liquidity Risk

The Corporation’s consolidated financial position could be adversely affected
if it, or one of its subsidiaries, fails to arrange sufficient and
cost-effective financing to fund, among other things, capital expenditures,
acquisitions and the repayment of maturing debt. The ability to arrange
sufficient and cost-effective financing is subject to numerous factors,
including the consolidated results of operations and financial position of the
Corporation and its subsidiaries, conditions in capital and bank credit
markets, ratings assigned by rating agencies and general economic conditions.

To help mitigate liquidity risk, the Corporation and its regulated utilities
have secured committed credit facilities to support short-term financing of
capital expenditures, seasonal working capital requirements, and for general
corporate purposes. In addition to its credit facilities, ITC uses commercial
paper to finance its short-term cash requirements, and may use credit facility
borrowings, from time to time, to repay borrowings under its commercial paper
program.

The Corporation’s committed corporate credit facility is used for interim
financing of acquisitions and for general corporate purposes. Depending on the
timing of cash payments from subsidiaries, borrowings under the Corporation’s
committed corporate credit facility may be required from time to time to
support the servicing of debt and payment of dividends. As at March 31, 2017,
over the next five years, average annual consolidated fixed-term debt
maturities and repayments are expected to be approximately $740 million. The
combination of available credit facilities and reasonable annual debt
maturities and repayments provides the Corporation and its subsidiaries with
flexibility in the timing of access to capital markets.

As at March 31, 2017, the Corporation and its subsidiaries had consolidated
credit facilities of approximately $5.4 billion, of which approximately $3.8
billion was unused, including $909 million unused under the Corporation’s
committed revolving corporate credit facility. The credit facilities are
syndicated mostly with large banks in Canada and the United States, with no one
bank holding more than 20% of these facilities. Approximately $5.0 billion of
the total credit facilities are committed facilities with maturities ranging
from 2017 through 2021.

The following summary outlines the credit facilities of the Corporation and its
subsidiaries.

/T/

As at
December
Regulated Corporate March 31, 31,
($ millions) Utilities and Other 2017 2016
—————————————————————————-
Total credit facilities (1) 4,061 1,385 5,446 5,976
Credit facilities utilized:
Short-term borrowings (1)
(2) (543) (2) (545) (1,155)
Long-term debt (Note 6)
(3) (640) (390) (1,030) (973)
Letters of credit
outstanding (68) (51) (119) (119)
—————————————————————————-
Credit facilities unused (1) 2,810 942 3,752 3,729
—————————————————————————-
(1) Total credit facilities and short-term borrowings as at March 31, 2017
include $179 million (US$135 million) outstanding under ITC’s commercial
paper program (December 31, 2016 – $195 million (US$145 million)).
Outstanding commercial paper does not reduce available capacity under
the Corporation’s consolidated credit facilities.
(2) The weighted average interest rate on short-term borrowings was
approximately 1.4% as at March 31, 2017 (December 31, 2016 – 1.7%).
(3) As at March 31, 2017, credit facility borrowings classified as long-term
debt included $123 million in current installments of long-term debt on
the consolidated balance sheet (December 31, 2016 – $61 million). The
weighted average interest rate on credit facility borrowings classified
as long-term debt was approximately 2.0% as at March 31, 2017 (December
31, 2016 – 1.8%).

/T/

As at March 31, 2017 and December 31, 2016, certain borrowings under the
Corporation’s and subsidiaries’ long-term committed credit facilities were
classified as long-term debt. It is management’s intention to refinance these
borrowings with long-term permanent financing during future periods. The only
significant change in credit facilities from that disclosed in the
Corporation’s 2016 annual audited consolidated financial statements is as
follows.

In March 2017 the Corporation repaid short-term borrowings using net proceeds
from the issuance of common shares (Note 7).

The Corporation and its currently rated utilities target investment-grade
credit ratings to maintain capital market access at reasonable interest rates.
As at March 31, 2017, the Corporation’s credit ratings were as follows.

/T/

Rating Agency Credit Rating Type of Rating Outlook
—————————————————————————-
Standard & Poor’s A- Corporate Stable
BBB+ Unsecured debt Stable
DBRS BBB (high) Unsecured debt Stable
Moody’s Investor Service Baa3 Issuer Stable
Baa3 Unsecured debt Stable

/T/

The above-noted credit ratings reflect the Corporation’s low business-risk
profile and diversity of its operations, the stand-alone nature and financial
separation of each of the regulated subsidiaries of Fortis, and the level of
debt at the holding company.

Market Risk

Foreign Exchange Risk

The reporting currency of ITC, UNS Energy, Central Hudson, Caribbean Utilities,
Fortis Turks and Caicos and BECOL is the US dollar. The Corporation’s earnings
from, and net investments in, foreign subsidiaries are exposed to fluctuations
in the US dollar-to-Canadian dollar exchange rate. The Corporation has
decreased the above-noted exposure through the use of US dollar-denominated
borrowings at the corporate level. The foreign exchange gain or loss on the
translation of US dollar-denominated interest expense partially offsets the
foreign exchange gain or loss on the translation of the Corporation’s foreign
subsidiaries’ earnings.

As at March 31, 2017, the Corporation’s corporately issued US$3,496 million
(December 31, 2016 – US$3,511 million) long-term debt had been designated as an
effective hedge of a portion of the Corporation’s foreign net investments. As
at March 31, 2017, the Corporation had approximately US$7,386 million (December
31, 2016 – US$7,250 million) in foreign net investments that were unhedged.
Foreign currency exchange rate fluctuations associated with the translation of
the Corporation’s corporately issued US dollar-denominated borrowings
designated as effective hedges are recorded on the consolidated balance sheet
in accumulated other comprehensive income and serve to help offset unrealized
foreign currency exchange gains and losses on the net investments in foreign
subsidiaries, which gains and losses are also recorded on the consolidated
balance sheet in accumulated other comprehensive income.

As a result of the acquisition of ITC, consolidated earnings and cash flows of
Fortis are impacted to a greater extent by fluctuations in the US
dollar-to-Canadian dollar exchange rate. On an annual basis, it is estimated
that a 5 cent increase or decrease in the US dollar relative to the Canadian
dollar exchange rate of US$1.00=CAD$1.33 as at March 31, 2017 would increase or
decrease earnings per common share of Fortis by approximately 7 cents.
Management will continue to hedge future exchange rate fluctuations related to
the Corporation’s foreign net investments and US dollar-denominated earnings
streams, where appropriate, through future US dollar-denominated borrowings,
and will continue to monitor the Corporation’s exposure to foreign currency
fluctuations on a regular basis.

Interest Rate Risk

The Corporation and most of its subsidiaries are exposed to interest rate risk
associated with borrowings under variable-rate credit facilities, variable-rate
long-term debt and the refinancing of long-term debt. The Corporation and its
subsidiaries may enter into interest rate swap agreements to help reduce this
risk (Note 14).

Commodity Price Risk

UNS Energy is exposed to commodity price risk associated with changes in the
market price of gas, purchased power and coal. Central Hudson is exposed to
commodity price risk associated with changes in the market price of electricity
and gas. FortisBC Energy is exposed to commodity price risk associated with
changes in the market price of gas. The risks have been reduced by entering
into derivative contracts that effectively fix the price of natural gas, power
and electricity purchases. Aitken Creek is exposed to commodity price risk
associated with changes in the market price of gas and enters into derivative
contracts to manage the financial risk posed by physical transactions. These
derivative instruments are recorded on the consolidated balance sheet at fair
value and any change in the fair value is deferred as a regulatory asset or
liability, as permitted by the regulators, for recovery from, or refund to,
customers in future rates, except at Aitken Creek where the changes in fair
value are recorded in earnings (Note 14).

16. BUSINESS ACQUISITIONS

As at March 31, 2017, the purchase price allocation related to ITC, acquired on
October 14, 2016, remains preliminary pending final assessment of fair value
estimates, income taxes, consideration transferred, and identification of
assets and liabilities.

During the first quarter of 2017, the purchase price allocation related to
Aitken Creek, acquired on April 1, 2016, was finalized with no material
adjustments.

17. COMMITMENTS AND CONTINGENCIES

There were no material changes in the nature and amount of the Corporation’s
commitments from those disclosed in the Corporation’s 2016 annual audited
consolidated financial statements.

The Corporation and its subsidiaries are subject to various legal proceedings
and claims associated with the ordinary course of business operations. The
following describes the nature of the Corporation’s contingencies.

Central Hudson

Prior to and after its acquisition by Fortis, various asbestos lawsuits have
been brought against Central Hudson. While a total of 3,364 asbestos cases have
been raised, 1,175 remained pending as at March 31, 2017. Of the cases no
longer pending against Central Hudson, 2,033 have been dismissed or
discontinued without payment by the Company, and Central Hudson has settled the
remaining 156 cases. The Company is presently unable to assess the validity of
the outstanding asbestos lawsuits; however, based on information known to
Central Hudson at this time, including the Company’s experience in the
settlement and/or dismissal of asbestos cases, Central Hudson believes that the
costs that may be incurred in connection with the remaining lawsuits will not
have a material effect on its financial position, results of operations or cash
flows and, accordingly, no amount has been accrued in the consolidated
financial statements.

FHI

In April 2013 FHI and Fortis were named as defendants in an action in the B.C.
Supreme Court by the Coldwater Indian Band (“Band”). The claim is in regard to
interests in a pipeline right of way on reserve lands. The pipeline on the
right of way was transferred by FHI (then Terasen Inc.) to Kinder Morgan Inc.
in April 2007. The Band seeks orders cancelling the right of way and claims
damages for wrongful interference with the Band’s use and enjoyment of reserve
lands. In May 2016 the Federal Court entered a decision dismissing the
Coldwater Band’s application for judicial review of the ministerial consent.
The Band has appealed that decision. The outcome cannot be reasonably
determined and estimated at this time and, accordingly, no amount has been
accrued in the consolidated financial statements.

Fortis and ITC

Following announcement of the acquisition of ITC in February 2016, complaints
which named Fortis and other defendants were filed in the Oakland County
Circuit Court in the State of Michigan (“Superior Court”) and the United States
District Court in and for the Eastern District of Michigan. The complaints
generally allege, among other things, that the directors of ITC breached their
fiduciary duties in connection with the merger agreement and that ITC, Fortis,
FortisUS Inc. and Element Acquisition Sub Inc. aided and abetted those
purported breaches. The complaints seek class action certification and a
variety of relief including, among other things, unspecified damages, and
costs, including attorneys’ fees and expenses. In July 2016 the federal actions
were voluntarily dismissed by the federal plaintiffs. The federal plaintiffs
reserved the right to make certain other claims, and ITC and the individual
members of the ITC board of directors reserved the right to oppose any such
claim. In June 2016 the Superior Court granted a motion for summary disposition
dismissing the aiding and abetting claims asserted against Fortis, FortisUS
Inc. and Element Acquisition Sub Inc. In January 2017 the Superior Court issued
a revised scheduling order, which, among other things, requires the parties,
including ITC, to complete discovery by May 2017, and set a trial date for
September 2017. A hearing on the plaintiff’s motion for class certification was
held in February 2017.

GET ENERGYNOW’S DAILY EMAIL FOR FREE


Point Loma Resources Announces Year End Financial and Operating Results

FOR: POINT LOMA RESOURCES LTD
TSX VENTURE Symbol: PLX

Date issue: May 01, 2017
Time in: 10:49 PM e

Attention:

CALGARY, AB –(Marketwired – May 01, 2017) – Point Loma Resources Ltd. (TSX
VENTURE: PLX) (the “Corporation” or “Point Loma”) is pleased to report
financial and operating results for the three months and year ended December
31, 2016. Highlights of the period and additional updates are summarized
below:

HIGHLIGHTS

/T/

—————————————————————————-
Financial Year ended December Three Months ended
31, 2016 (1) December 31, 2016
—————————————————————————-
($ thousands, except share amounts)

Gross revenue 1,599 970
Cash used in operating activities (638) (168)
Funds used in operations (2) (1,248) (618)
Per share – basic (0.07) (0.02)
Net loss (4,429) (2,522)
Per share – basic (0.26) (0.10)

Capital expenditures 4,809 2,258
Working capital deficit 1,491 1,491
Share capital
Weighted average shares
outstanding for period 17,366,757 21,655,040
Outstanding shares at end of
period 27,353,325 27,353,325

Operations

Daily average production
————————————

Crude oil and liquids (bbls/d) 67 146
Natural gas (mcf/d) 450 1,171
Total production (boe/d at 6:1) 142 341

Average sales price
————————————

Crude oil and liquids ($/bbl) 46.33 48.18
Natural gas ($/mcf) 2.80 3.02
Equivalent ($/boe) 30.72 30.91
Netback
Revenues ($/boe) 30.72 30.91
Royalties ($/boe) (5.16) (5.47)
Operating expense (S/boe) (21.89) (26.81)
Transportation expense ($/boe) (1.70) (0.80)
——————– ——————-
Netback (S/boe) 1.97 (2.17)
——————– ——————-

—————————————————————————-

—————————————————————————-

/T/

/T/

1. Twelve months ended December 31, 2016 includes only the operations for

the period from July 1, 2016 to December 31, 2016.
2. Funds used in operations is cash flow used in operating activities less
changes in non-cash working capital and transaction costs paid.

/T/

Fourth Quarter Summary

The fourth quarter of 2016 was challenging operationally for Point Loma as
several wells had pumping and operational problems that were further magnified
by wet conditions. As a result, the Corporation was unable to gain access to
wellsites with the equipment required to rectify the operations in normal
short order. This prevented Point Loma from producing at expected rates
through the period resulting in higher operating costs per boe.

In addition Point Loma has worked through some issues related to repair and
maintenance in the Paddle River area that resulted in additional costs in the
fourth quarter.

It is expected in 2017 that improved run time and a return to expected levels
of maintenance costs will result in improved volumes, revenues and netbacks.

With the return to production of the majority of wells that experienced
operating challenges and the tie-in of a new Nordegg producer, Point Loma was
able to achieve an exit rate for the quarter of 570 boe/d.

Outlook

In January 2017, Point Loma announced two transactions that have increased the
Corporations production to approximately 900 boe/d. These acquisitions also
include additional production that Point Loma can re-activate with a
negotiation of egress and some minor pipeline activity. Point Loma will pursue
these opportunities in 2017.

In April 2017, Point Loma has announced a disposition and joint venture with
Salt Bush Energy Ltd. that will see Point Loma sell a 20 percent interest in
operating assets and receive cash consideration of $5 million upon closing
which is expected prior to June 9, 2017. This capital will be utilized to
accelerate activity on the Point Loma properties through drilling, facilities
additions and certain targeted acquisitions.

Point Loma plans to begin drilling its large opportunity base which should
include development locations and new pool targets.

Additional Information

Point Loma has filed its annual audited financial statements, Management’s
Discussion and Analysis (MD&A) and Annual Information Form (AIF) for the year
ended December 31, 2016 with Canadian securities regulators. These filings,
and additional information including the Corporation’s recently updated
corporate presentation can be found at Point Loma’s website at
www.pointloma.ca or at Point Loma’s profile on the System for Electronic
Document Analysis and Retrieval website at www.sedar.com.

About Point Loma

Point Loma is a public oil and gas development and exploration company focused
on horizontally exploiting conventional oil and gas reservoirs in west central
Alberta. Point Loma’s business plan is to utilize its experience to drill,
develop and acquire accretive assets with potential for horizontal multi-stage
frac technology and exploit opportunities for secondary recovery.

A Note Regarding Forward-Looking Information

This press release contains forward-looking statements and forward-looking
information within the meaning of applicable securities laws, including
without limitation, statements pertaining to Point Loma’s expectations as to
production and future potential production increases, as well as increases in
cash flow and the timing thereof; future gas processing rates; Point Loma’s
expectations as to future prices of oil and natural gas; the focus of Point
Loma’s management team and go-forward strategy.

The use of any of the words “will”, “expects”, “believe”, “plans”, “potential”
and similar expressions are intended to identify forward-looking statements or
information. Although Point Loma believes that the expectations and
assumptions on which such forward-looking statements and information are based
are reasonable, undue reliance should not be placed on the forward-looking
statements and information because Point Loma cannot give assurance that they
will prove to be correct.

Since forward-looking statements and information address future events and
conditions, by their very nature they involve inherent risks and
uncertainties. Actual results could differ materially from those currently
anticipated due to a number of factors and risks. These include, but are not
limited to, the risks associated with the oil and gas industry in general such
as operational risks in development, exploration and production; delays or
changes in plans with respect to exploration or development projects or
capital expenditures; the uncertainty of reserve and resource estimates; the
inability of Point Loma to bring additional production on stream or in the
anticipated quantities disclosed herein; the uncertainty of estimates and
projections relating to reserves, resources, production, costs and expenses;
health, safety and environmental risks; commodity price and exchange rate
fluctuations; marketing and transportation; loss of markets; environmental
risks; competition; incorrect assessment of the value of acquisitions; failure
to realize the anticipated benefits of acquisitions; ability to access
sufficient capital from internal and external sources; changes in legislation,
including but not limited to tax laws, royalties and environmental
regulations, actual production from the acquired assets may be greater or less
than estimates. Management has included the above summary of assumptions and
risks related to forward-looking information provided in this press release in
order to provide security holders with a more complete perspective on Point
Loma’s future operations and such information may not be appropriate for other
purposes.

The forward-looking statements and information contained in this press release
are made as of the date hereof and Point Loma does not undertake any
obligation to update publicly or revise any forward-looking statements or
information, whether as a result of new information, future events or
otherwise, unless so required by applicable securities laws.

Oil and Gas Information

“BOEs” may be misleading, particularly if used in isolation. A BOE conversion
ratio of six thousand cubic feet of natural gas to one barrel of oil
equivalent (6 Mcf: 1 bbl) is based on an energy equivalency conversion method
primarily applicable at the burner tip and does not represent a value
equivalency at the wellhead. As the value ratio between natural gas and crude
oil based on the current prices of natural gas and crude oil is significantly
different from the energy equivalency of 6:1, utilizing a conversion on a 6:1
basis may be misleading as an indication of value.

– END RELEASE – 01/05/2017

For further information:

For further information, please contact:

Terry Meek
President and CEO
Telephone: (403) 705-5051 ext.101
[email protected]

Kevin Angus
Executive Vice-President Business Development
Telephone: (403) 705-5051 ext. 103
[email protected]

Randall Boyd
Vice President Finance and CFO
Telephone: (403) 705-5051 ext. 105
[email protected]

COMPANY:
FOR: POINT LOMA RESOURCES LTD
TSX VENTURE Symbol: PLX

INDUSTRY: Energy and Utilities – Oil and Gas
RELEASE ID: 20170501CC040

Press Release from Marketwired 1-866-736-3779

All press releases are written by the client and have NO affiliation with the news copy written by The Canadian Press. Any questions that arise due to the content or information provided in the press release should be directed to the company/organization
issuing the release, not to The Canadian Press.

GET ENERGYNOW’S DAILY EMAIL FOR FREE


Strong Customer Demand Drives Additional Contract Commitments and Increased Capital Expenditure for Trinidad Drilling in 2017, Partly Funded by JV Distribution

FOR: TRINIDAD DRILLING LTD.
TSX SYMBOL: TDG

Date issue: May 01, 2017
Time in: 10:07 PM e

Attention:

CALGARY, ALBERTA–(Marketwired – May 1, 2017) –

NOT FOR DISTRIBUTION TO UNITED STATES NEWSWIRE SERVICES OR FOR DISSEMINATION IN
THE UNITED STATES.

Trinidad Drilling Ltd. (TSX:TDG) (“Trinidad” and “the Company”) announced today
that it has increased its capital expenditure budget for 2017 by $80 million,
in response to strong demand from customers, particularly in the Permian Basin
in the US. In 2017, Trinidad expects to spend approximately $175 million in
capital expenditures, with $155 million directed towards rig upgrades and $20
million towards maintenance capital.

The incremental capital of $135 million over the Company’s initial $40 million
capital budget is largely backed by customer commitments, including early
termination provisions that covers all the committed incremental capital, with
additional contracts expected to be signed. Capital associated with the
contracts under negotiation will not be spent unless suitable contract terms
can be agreed. Of the total 2017 upgrade capital, approximately 75% will be
spent in the US and 25% will be spent in Canada, with rig upgrades expected to
be completed throughout the first three quarters of 2017. Trinidad expects to
recover the upgrade capital invested in 2017 through incremental Adjusted
EBITDA(1) (on an annualized basis) within 2.5 years.

“We have seen a strong increase in customer demand in 2017, with recent
acceleration in the past two months,” said Brent Conway, Trinidad’s President
and Chief Executive Officer. “This demand is focused on modern, high
performance equipment that allows our customers to drill wells quickly and
efficiently. Our already high spec fleet is able to be upgraded relatively
easily to meet the changing demands of our customers, allowing us to maintain
our position as a leading high performance driller and to improve the future
marketability of our fleet.”

Trinidad’s expanded upgrade program includes increasing the pressure capacity
of mud circulating systems, adding mud pumps, moving systems, additional
generators and AC power conversion. Following the completion of the upgrade
program, half of Trinidad’s US fleet will be equipped with a moving system and
just under half will have 7500 PSI, making these rigs fit the new “ultra,
high-spec” category US customers are increasingly requesting.

In the US, Trinidad currently has 32 rigs or 47% of its US fleet operating,
including 26 rigs operating in the Permian Basin. Another 11 rigs are expected
to start up in the Permian in the coming months, giving Trinidad strong and
growing market share in North America’s most active play. By the end of the
third quarter, Trinidad expects to have approximately 45 rigs operating in the
US. In Canada, it is currently spring break-up, a time when rig activity
typically lowers due to road bans and wet ground conditions. Trinidad currently
has 7 rigs or 10% of its Canadian fleet running, well ahead of the levels
running at the same time in the past two years. Trinidad expects activity
levels in Canada to rebound quickly once ground conditions allow rigs to return
to work.

Customer demand in both Canada and the US has been growing since crude oil
prices began to improve towards the end of 2016. During the early stages of the
rebound, opportunities existed to upgrade rigs for customers; however, the
contract terms available did not meet Trinidad’s economic thresholds and the
Company initially planned a low capital budget for 2017. As conditions have
improved and contract terms changed to exceed Trinidad’s thresholds, the
Company took the opportunity to lock in increasing dayrates, termination
provisions and contract upside. Several of the contracts signed include price
escalation clauses tied to crude oil prices, performance incentives and
contract duration. These contracts allow Trinidad to lock in a base revenue
level, while allowing the Company to share in the benefits of increasing
commodity prices and strong operational performance.

Since the beginning of March this year, Trinidad has added 8 new long-term
contracts. Including the contracts associated with the current upgrade program,
Trinidad has 31 rigs, or 21% of its fleet under long-term contracts, with an
average term remaining of 1.6 years. The Company also has a significant number
of rigs under contracts with term of less than one year, not included in the
long-term contract base.

1. See Non-GAAP Measures Definitions section of this document for further
details.

Early in the second quarter of 2017, Trinidad received a distribution from its
international joint venture operations of approximately $40 million. These
funds, along with cash on hand, funds generated from its operations and where
necessary, the Company’s revolving credit facility, will be used to fund the
capital expenditure program.

Trinidad is a corporation focused on sustainable growth that trades on the
Toronto Stock Exchange under the symbol TDG. Trinidad’s divisions currently
operate in the drilling sector of the oil and natural gas industry, with
operations in Canada, the United States and internationally. In addition,
through joint venture arrangements, Trinidad operates drilling rigs in Saudi
Arabia and Mexico, and is currently assessing operations in other international
markets. Trinidad is focused on providing modern, reliable, expertly designed
equipment operated by well-trained and experienced personnel. Trinidad’s
drilling fleet is one of the most adaptable, technologically advanced and
competitive in the industry.

NON-GAAP MEASURES DEFINITIONS

This document contains references to Adjusted EBITDA that does not have any
standardized meaning prescribed by IFRS and may not be comparable to similar
measures presented by other companies. Adjusted EBITDA is computed on a
consistent basis for each reporting period and is defined as follows:

Adjusted EBITDA is used by management and investors to analyze the Company’s
profitability based on the Company’s principal business activities prior to how
these activities are financed, how assets are depreciated and amortized and how
the results are taxed in various jurisdictions. Additionally, in order to focus
on the core business alone, amounts are removed related to foreign exchange,
share-based payment expense, impairment expenses the sale of assets, and fair
value adjustments on financial assets and liabilities, as the Company does not
deem these to relate to the core drilling business. Adjusted EBITDA also takes
into account the Company’s portion of the principal activities of the joint
venture arrangements by removing the (gain) loss from investment in joint
ventures and including adjusted EBITDA from investment in joint ventures.
Adjusted EBITDA is not intended to represent net (loss) income as calculated in
accordance with IFRS. Adjusted EBITDA is calculated using 100% of the related
amounts from all entities controlled by Trinidad where Trinidad may not hold
100% of the outstanding shares.

FORWARD-LOOKING INFORMATION

This document contains certain forward-looking information and statements
(“forward-looking statements”) within the meaning of applicable Canadian
securities laws, relating to Trinidad’s plans, strategies, objectives,
expectations and intentions for the future. The use of any of the words
“expect”, “anticipate”, “continue”, “will”, “plans” and similar expressions are
intended to identify forward-looking statements. In particular, this document
contains forward-looking statements pertaining to, among other things:
Trinidad’s 2017 capital budget, including the amounts and breakdown of
anticipated capital expenditures and the projects that are expected to be
undertaken during 2017; the maintenance of Trinidad’s rig fleet in 2017;
Trinidad’s ability to sign contracts for its upgraded rigs; the future
utilization and margin levels of upgraded rigs; that the demand for high spec
equipment will grow; Trinidad’s ability to fund its capital program from cash
generated from our operations, Joint Venture distributions, the Company’s
revolving facility and cash on hand; the rebound in activity in Canada, the
number of rigs operating in Trinidad’s US division and Trinidad’s ability to
generate an Adjusted EBITDA to repay capital investment within 2.5 years.

Various assumptions were used in drawing the conclusions or making the
projections contained in the forward-looking statements throughout this
document. While Trinidad believes that the expectations and material factors
and assumptions reflected in its forward-looking statements are reasonable as
at the date hereof, there can be no assurance that any of these expectations,
factors or assumptions will prove to be correct. In particular, in presenting
its forward-looking statements, Trinidad has made assumptions respecting, among
other things: that Trinidad’s customers will honor their take-or-pay contracts;
future liquidity levels; future industry conditions and general economic
conditions; oil and gas supply and demand conditions in 2017; internal capital
expenditure programs and other expenditures by oil and gas exploration and
production companies; areas of industry activity and rig demand (and the spec
requirements thereof) in such areas; regulatory and legislative conditions;
commodity prices, in particular oil and natural gas; future expected cash
flows; foreign currency exchange rates and interest rates; and future
performance and operations of joint ventures and partnership arrangements.

The forward-looking statements included in this document are not guarantees of
future performance and should not be unduly relied upon. Readers are cautioned
that forward-looking statements are based on current expectations, estimates
and projections that, by their nature, involve a number of known and unknown
risks and uncertainties, which could cause actual results to differ materially
from those anticipated and described in the forward-looking statements. These
known and unknown risks and uncertainties include, but are not limited to:
potential changes in the regulatory and legislative environment; political
uncertainty and instability in North American and internationally, and changes
in political leadership in North America and elsewhere; volatility in commodity
prices and foreign currency exchange, interest and tax rates; the ability of
Trinidad to attract and retain qualified personnel, in particular field staff
to crew the Company’s rigs; the existence of competitors, technological changes
and developments in the oilfield services industry; operating risks inherent in
the oilfield services industry; variations in internal capital expenditure
programs and other expenditures by oil and gas exploration and production
companies; volatility in supply and demand for commodities, in particular oil
and natural gas; and changes in general economic conditions including the
capital and credit markets.

Trinidad cautions that the foregoing list of assumptions, risks and
uncertainties is not exhaustive. Although the Company’s current 2017 capital
budget is based upon the current expectations of Trinidad’s management, should
any one of a number of issues arise, Trinidad may find it necessary to alter
its business strategy and/or capital spending program and there can be no
assurance as at the date of this document as to how those funds may be
reallocated or the Company’s strategy changed. Additional information on risks
and other factors that could affect Trinidad’s business, strategy, operations
or financial results are described in reports filed with securities regulatory
authorities (accessible through the SEDAR website www.sedar.com) including but
not limited to Trinidad’s annual and quarterly MD&A and financial statements,
Annual Information Form and Management Information Circular. The
forward-looking statements contained in this document speak only as of the date
of this document and Trinidad assumes no obligation to publicly update or
revise them to reflect new events or circumstances, except as may be required
pursuant to applicable securities laws.

– END RELEASE – 01/05/2017

For further information:
Brent Conway
President & Chief Executive Officer
403-265-6525
OR
Lesley Bolster
Chief Financial Officer
403-265-6525
OR
Lisa Ottmann
Vice President, Investor Relations
403-294-4401
[email protected]

COMPANY:
FOR: TRINIDAD DRILLING LTD.
TSX SYMBOL: TDG

INDUSTRY: Energy and Utilities – Oil and Gas
RELEASE ID: 20170501CC0131

Press Release from Marketwired 1-866-736-3779

All press releases are written by the client and have NO affiliation with the news copy written by The Canadian Press. Any questions that arise due to the content or information provided in the press release should be directed to the company/organization
issuing the release, not to The Canadian Press.

GET ENERGYNOW’S DAILY EMAIL FOR FREE


Trinidad Drilling Announces Changes to its Stock Option Plan in Alignment with ISS Recommendations

FOR: TRINIDAD DRILLING LTD.
TSX SYMBOL: TDG

Date issue: May 01, 2017
Time in: 10:01 PM e

Attention:

CALGARY, ALBERTA–(Marketwired – May 1, 2017) –

NOT FOR DISTRIBUTION TO UNITED STATES NEWSWIRE SERVICES OR FOR DISSEMINATION IN
THE UNITED STATES.

Trinidad Drilling Ltd. (TSX:TDG) (Trinidad) announces that the board of
directors of Trinidad (the “Board”) has approved minor amendments to its stock
option plan (the “Option Plan”). The amendments have been proposed to align the
Option Plan with recommendations raised by Institutional Shareholder Services
(“ISS”) in the course of its review of the matters to be voted on at the
upcoming annual meeting of the shareholders of Trinidad to be held on May 10,
2017 (the “Meeting”). As the Option Plan already complies with the rules and
policies of the Toronto Stock Exchange, Trinidad’s Board of Directors has
approved these changes with the goal of bringing Trinidad’s Option Plan in line
with current corporate governance best practices and addressing what Trinidad
understands were the factors that resulted in ISS issuing a negative
recommendation for re-approval of the Option Plan at the Meeting.

The amendments to the Option Plan will reduce the number of common shares of
Trinidad subject to the Option Plan to a rolling 4% of the issued and
outstanding shares, provide for double trigger acceleration of vesting of
options upon a change of control, and provide that all grants of options made
pursuant to the Option Plan shall be subject to a new incentive compensation
clawback policy adopted by the Corporation. The Toronto Stock Exchange will
have to approve the amended and restated Option Plan and Trinidad will be
making application for the same.

The amended and restated Option Plan will be proposed to the shareholders for
ratification at the Meeting. A copy of the amended and restated Option Plan can
be found on Trinidad’s SEDAR profile at www.sedar.com.

The Board feels that these amendments bring Trinidad’s Option Plan in line with
current corporate governance best practices and address all of the concerns
raised by ISS with respect to the Option Plan.

Trinidad believes a critical component of their executive compensation program
is the provision of long-term incentives to the executives, senior managers and
other key employees of the organization to ensure that a clear link exists
between employee compensation and the growth in shareholder value. The Option
Plan is a fundamental component of its corporate strategy which is designed to
align individual goals and objectives with Trinidad’s objective of creating
shareholder value.

FORWARD-LOOKING INFORMATION

This news release contains forward-looking statements and forward-looking
information (collectively, “forward-looking information”) within the meaning of
applicable Canadian securities laws. The use of any of the words “expect”,
“anticipate”, “will”, “future” and similar expressions are intended to identify
forward-looking information. In particular, this news release contains
forward-looking information pertaining to Trinidad’s understanding of ISS’s
concerns regarding its Option Plan and ratification of the Option Plan at the
Meeting.

The forward-looking information included in this news release is not a
guarantee of future performance and should not be unduly relied upon.
Forward-looking information is based on current expectations, estimates and
projections that involve a number of risks and uncertainties, which could cause
actual results to differ materially from those anticipated and described in the
forward-looking information including, without limitation: Trinidad’s belief
that they have addressed all of ISS’s concerns regarding the Option Plan and
that the Option Plan will be ratified at the Meeting. The forward-looking
information contained in this news release speaks only as of the date of this
news release and Trinidad assumes no obligation to publicly update or revise
such forward-looking information to reflect new events or circumstances, except
as may be required pursuant to applicable securities laws.

This news release shall not constitute an offer to sell or the solicitation of
an offer to buy the shares in any jurisdiction. The shares offered will not be
and have not been registered under the United States Securities Act of 1933 and
may not be offered or sold in the United States or to a United States person,
absent registration, or an applicable exemption therefrom.

Trinidad is a corporation focused on sustainable growth that trades on the
Toronto Stock Exchange under the symbol TDG. Trinidad’s divisions currently
operate in the drilling sector of the oil and natural gas industry, with
operations in Canada, the United States and internationally. In addition,
through joint venture arrangements, Trinidad operates drilling rigs in Saudi
Arabia and Mexico, and is currently assessing operations in other international
markets. Trinidad is focused on providing modern, reliable, expertly designed
equipment operated by well-trained and experienced personnel. Trinidad’s
drilling fleet is one of the most adaptable, technologically advanced and
competitive in the industry.

– END RELEASE – 01/05/2017

For further information:
Brent Conway
President & Chief Executive Officer
403-265-6525
OR
Lesley Bolster
Chief Financial Officer
403-265-6525
OR
Lisa Ottmann
Vice President, Investor Relations
403-294-4401
email: [email protected]

COMPANY:
FOR: TRINIDAD DRILLING LTD.
TSX SYMBOL: TDG

INDUSTRY: Energy and Utilities – Oil and Gas
RELEASE ID: 20170501CC0129

Press Release from Marketwired 1-866-736-3779

All press releases are written by the client and have NO affiliation with the news copy written by The Canadian Press. Any questions that arise due to the content or information provided in the press release should be directed to the company/organization
issuing the release, not to The Canadian Press.

GET ENERGYNOW’S DAILY EMAIL FOR FREE


Marquee Energy Ltd. Announces Corporate Update, Year-End 2016 Financial and Operating Results and Year-End 2016 Reserves

FOR: MARQUEE ENERGY LTD.
OTCQX Symbol: MQLXF
TSX VENTURE Symbol: MQL

Date issue: May 01, 2017
Time in: 8:53 PM e

Attention:

CALGARY, AB –(Marketwired – May 01, 2017) –

NOT FOR DISTRIBUTION TO U.S. NEWS SERVICES OR FOR DISSEMINTATION IN THE UNITED
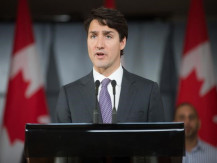
STATES

Marquee Energy Ltd. (“Marquee” or the “Company”) (TSX VENTURE: MQX) announces
a corporate update, its fourth quarter operational results and financial
results for the three and twelve months ended December 31, 2016, and year-end
2016 reserves. The Company’s financial statements and Management’s Discussion
and Analysis (“MD&A”) for the three months and twelve months ended December
31, 2016 are available on SEDAR at www.sedar.com and on Marquee’s website at
www.marquee-energy.com.

CORPORATE UPDATE

In response to persistent low commodity prices throughout 2016, the Company
reduced its capital budget and focused its efforts over the past year on
improving its balance sheet and liquidity position in order to re-position the
Company to resume development of its light oil asset at Michichi, Alberta.

During the second quarter of 2016, the Company disposed of non-core shallow
gas assets and heavy oil assets for net proceeds of $5.1 million, reducing
decommissioning liabilities by $31.5 million and eliminating future capital
commitments of $22.3 million.

On December 6, 2016, Alberta Oilsands Inc. (“AOS”) and Marquee Energy Ltd.
(“Old Marquee”), completed a plan of arrangement pursuant to which AOS
acquired all of the issued and outstanding shares of Old Marquee and Old
Marquee became a wholly-owned subsidiary of AOS (the “Arrangement”).
Immediately following the Arrangement, Old Marquee was amalgamated into AOS by
way of short-form vertical amalgamation, to form the Company, which operates
under the name of “Marquee Energy Ltd”. The Company reports on SEDAR under the
previous AOS profile. This transaction, in combination with the
rationalization of non-core properties during 2016, reduced bank debt to $15.8
million at December 31, 2016 representing a reduction of $36.6 million from
December 31, 2015.

Highlights of the Company’s asset base include:

/T/

— Over 320 multi-zone horizontal development drilling locations at

Michichi targeting the Banff reservoir have been identified through
extensive 2D and 3D seismic, vertical well control (1,300 vertical
wells) and offsetting horizontal wells drilled in the Michichi area;

/T/

/T/

— Costs to drill, complete, equip, and tie-in a new horizontal well have

continued to decrease with current estimated expenditures of $1.7
million per well. Economics based on the April 25, 2017 strip price
forecast indicates that new wells at Michichi are expected to payout in
approximately 1.2 years and generate an internal rate of return of 76%
with finding and development costs of approximately $9/boe; and

/T/

/T/

— Operatorship of two gas plants and an oil battery, as well as an

extensive gathering system and field compression provide opportunities
for timely tie-in of new production.

/T/

The Company’s Board of Directors approved a capital program of approximately
$7.0 million for the first half of 2017. Marquee remains focused on the
management of its balance sheet and believes it is prudent to limit capital
spending to free corporate cash flow at this time. Details on guidance for
2017 and further capital plans for the year will be forthcoming.

The Company recently completed its Q1 2017 drilling program at Michichi with
all three wells being placed on production in early April. The three wells
continue to clean-up post completion, and over the last week have averaged 180
boe/d per well (based on field estimates). Marquee will provide further well
performance updates as it becomes available.

/T/

FINANCIAL AND OPERATIONAL HIGHLIGHTS

—————————————————————————-

Three months ended Year ended
December 31, December 31,
2016 2015 2016 2015
—————————————————————————-
Financial (000’s
except per share
and per boe
amounts)
Oil and natural gas
sales (1) $ 8,013 $ 12,153 $ 31,538 $ 55,137
Funds flow from
operations (2) $ (153) $ 2,471 $ 1,897 $ 18,402
Per share – basic
and diluted $ 0.01 $ 0.01 $ 0.01 $ 0.05
Per boe $ 8.06 $ 5.45 $ 1.10 $ 9.30
Net income (loss) $ (10,063) $ (26,701) $ (22,185) $ (53,419)
Per share – basic
and diluted $ (0.04) $ (0.08) $ (0.10) $ (0.15)
Capital expenditures $ 2,852 $ 2,386 $ 3,539 $ 18,539
Acquisitions $ – $ – $ – $ 27,049
Dispositions (3) $ (1,700) $ – $ (6,827) $ (38,653)

Net debt (2) $ 17,165 $ 50,277 $ 17,165 $ 50,277
Total Assets $ 169,162 $ 227,941 $ 169,162 $ 227,941
Weighted average
basic and diluted
shares outstanding 226,740,053 354,093,535 226,740,053 354,093,535

Operational
Net wells drilled – – – 6
Daily sales volumes
Oil (bbls per day) 1,047 1,691 1,254 1,646
Heavy Oil (bbls
per day) – 461 162 598
NGL’s (bbls per
day) 172 176 142 185
Natural Gas (mcf
per day) 8,034 15,578 10,824 15,831
Total (boe per
day) 2,558 4,924 3,361 5,068
% Oil and NGL’s 48% 47% 46% 48%
Average realized
prices
Light Oil ($/bbl) $ 51.38 $ 42.76 $ 42.78 $ 46.60
Heavy Oil ($/bbl) $ – $ 29.35 $ 23.61 $ 38.26
NGL’s ($/bbl) $ 30.52 $ 32.67 $ 32.37 $ 34.91
Natural Gas
($/mcf) $ 3.49 $ 2.60 $ 2.23 $ 2.84
Netback
Revenue ($/boe) $ 34.05 $ 26.83 $ 25.64 $ 29.81
Royalties ($/boe) $ (1.64) $ (3.41) $ (1.99) $ (3.57)
Operating and
transportation
costs ($/boe) $ (24.29) $ (18.63) $ (17.54) $ (16.74)
Operating netback
prior to hedging
(2) $ 8.12 $ 4.79 $ 6.11 $ 9.50
Realized hedging
gain (loss)
($/boe) $ (1.25) $ 4.64 $ 1.41 $ 4.97
Operating netback
($/boe) (2) $ 6.87 $ 9.43 $ 7.52 $ 14.47
—————————————————————————-

/T/

(1) Before Royalties
(2) Defined under the Non-GAAP Measures section of this MD&A
(3) Proceeds on dispositions

2016 YEAR END RESERVES

Marquee’s year end reserves for 2016 are based on the Sproule Associates
Limited (“Sproule”) independent evaluation of the Company’s reserves dated
effective December 31, 2016, which has been prepared in accordance with NI
51-101 and the Canadian Oil and Gas Evaluation Handbook (“COGE Handbook”).
Additional reserves information required under NI 51-101 will be included in
Marquee’s Annual Information Form to be filed on SEDAR.

Sproule used a Canadian Light Sweet Crude price forecast based on US$55 WTI
and US$65 WTI for light oil for 2017 and 2018, respectively, and $3.26 per GJ
and $3.10 per GJ for AECO natural gas in 2017 and 2018, respectively.

/T/

Summary of Reserves
As at December 31, 2016(1)

—————————————————
Gross Company Reserves (2)
—————————————————————————-
Description Light Crude Conventional Natural Gas Total (Mboe)
Oil (Mbbl) Natural Liquids
Gas (MMcf) (Mbbl)
—————————————————————————-
Proved producing 1,997 15,539 243 4,830
Proved non-producing 180 648 9 297
Proved undeveloped 4,386 13,355 387 6,999
—————————————————————————-
Total proved 6,563 29,542 640 12,126
Probable 3,140 12,758 289 5,555
—————————————————————————-
Total proved plus
probable 9,703 42,298 929 17,681
—————————————————————————-

/T/

(1) Based on Sproule December 31, 2016 forecast prices
(2) Gross Company reserves are the Company’s total working interest share
before the deduction of royalties

/T/

Summary of Before Tax Net Present Values
As at December 31, 2016(1)

——————————————————-
Before Tax Net Present Value of Future Revenue ($M)
——————————————————-
Discount Rate
—————————————————————————-
Description 0% 5% 10% 15% 20%

—————————————————————————-
Proved producing $74,528 $63,529 $54,834 $48,103 $42,868
Proved non-producing $4,617 $3,585 $2,884 $2,384 $2,013
Proved undeveloped $146,793 $103,720 $73,468 $52,612 $37,975
—————————————————————————-
Total proved $225,938 $170,834 $131,186 $103,099 $82,856
Probable $151,330 $101,093 $71,668 $53,283 $41,072
—————————————————————————-
Total proved plus
probable $377,268 $271,927 $202,854 $156,382 $123,928
Per Basic Share $0.87 $0.62 $0.47 $0.36 $0.28

—————————————————————————-

/T/

(1) Based on Sproule December 31, 2016 forecast prices

/T/

Reconciliation of Reserves

——————————————————–
2016 Reserves Reconciliation
—————————————————————————-
Description (mboe) December 31, Acquired Production Additions, December 31,
2015 (Sold) revisions 2016

—————————————————————————-
Total proved 0 12,188 (62) 0 12,126
Probable 0 0 0 0 5,555
Proved plus
probable 0 17,743 62 0 17,681
—————————————————————————-

/T/

Finding, Development and Acquisition Costs

Marquee incurred capital expenditures from December 6, 2016 to December 31,
2016 of $0.25 million comprised of monies spent on land and seismic. Costs
related to reserve acquisitions in 2016 are $29.6 million, and includes the
announced purchase price of acquisitions including any estimated working
capital deficit or surplus rather than the amounts allocated to property,
plant and equipment for accounting purposes. Historical F&D and FD&A costs for
2014 and 2015 are nil as AOS sold all of its reserves in 2012 and did not have
any reserves in 2014 and 2015. The following table summarizes the Company’s
Finding, Development and Acquisition costs including changes in Future
Development Costs:

/T/

—————————————————
Including the Change in Future Development Costs(1)
—————————————————————————-
Description 2016 2015 2014 3 Year
Weighted
Average
—————————————————————————-
Total proved ($/boe)
F&D costs(3) – n/a n/a –
FD&A costs(2,3) $2.45 n/a n/a $2.45
FDC(4) – n/a n/a –
—————————————————————————-
Proved plus probable
($/boe)
F&D costs(3) – n/a n/a –
FD&A costs(2,3) 1.68 n/a n/a $1.68
FDC(3) – n/a n/a –
—————————————————————————-

/T/

(1) The Company incurred minimal capital cost post December 6, 2016
amalgamation.
(2) Comprised mainly of the Costs related to acquisition of Old Marquee
reserves by the Company.
(3) See the “Additional Advisories” section of this press release for
information pertaining to these oil and gas metrics

ANNUAL GENERAL MEETING OF SHAREHOLDERS

The Company’s Annual General Meeting of Shareholders is scheduled for 2:00 PM
on Monday June 26, 2017 in the Strand/Tivoli room at the Metropolitan
Conference Centre in Calgary, AB. The record date for the meeting has been set
as May 23, 2017.

ABOUT MARQUEE

Marquee is a Calgary based, junior energy company focused on light oil
development and production in the Michichi area of eastern Alberta through the
exploitation of existing opportunities and possible consolidation. Marquee’s
shares trade on the TSX Venture Exchange under the trading symbol “MQX”.
Additional information about Marquee may be found on its website
www.marquee-energy.com and in its continuous disclosure documents filed with
Canadian securities regulators on the System for Electronic Document Analysis
and Retrieval (SEDAR) at www.sedar.com.

FORWARD-LOOKING STATEMENTS OR INFORMATION

Certain statements included or incorporated by reference in this news release
may constitute forward -looking statements under applicable securities
legislation. Such forward-looking statements or information typically contain
statements with words such as “anticipate”, “believe”, “expect”, “plan”,
“intend”, “estimate”, “propose”, or similar words suggesting future outcomes
or statements regarding an outlook. Forward-looking statements or information
in this news release may include, but are not limited to: reserves estimates
and the net present value of the future net reserves related thereto; the
number and quality of future potential drilling and development opportunities;
anticipated capital budgets and expenditures; the Company’s development plan;
the size and extent of the Michichi oil fairway; and the timing of disclosure
of further 2017 guidance, capital expenditure plans and well performance.

Such forward-looking statements or information are based on a number of
assumptions all or any of which may prove to be incorrect. In addition to any
other assumptions identified in this document, assumptions have been made
regarding, among other things: the ability of the Company to obtain equipment,
services and supplies in a timely manner to carry out its activities; the
ability of the Company to market crude oil, natural gas liquids and natural
gas successfully to current and new customers; the ability to secure adequate
product transportation; the timely receipt of required regulatory approvals;
the ability of the Company to obtain financing on acceptable terms; interest
rates; regulatory framework regarding taxes, royalties and environmental
matters; future crude oil, natural gas liquids and natural gas prices; the
ability to successfully integrate acquisitions into Marquee’s business and
management’s expectations relating to the timing and results of development
activities.

Forward-looking information is based on current expectations, estimates and
projections that involve a number of risks and uncertainties which could cause
actual results to differ materially from those anticipated by the Company and
described in the forward-looking information. Material risk factors affecting
the Company and its business are contained in Marquee’s Annual Information
Form, which is available under Marquee’s issuer profile on SEDAR at
www.sedar.com.

The forward-looking information contained in this press release is made as of
the date hereof and the Company undertakes no obligation to update publicly or
revise any forward-looking information, whether as a result of new
information, future events or otherwise, unless required by applicable
securities laws. The forward -looking information contained in this press
release is expressly qualified by this cautionary statement.

DRILLING LOCATIONS

This press release discloses drilling locations in three categories: (i)
proved locations; (ii) probable locations; and (iii) unbooked locations.
Proved locations and probable locations are derived from the Company’s most
recent independent reserves report prepared by Sproule as at December 31, 2016
and account for drilling locations that have associated proved and/or probable
reserves, as applicable. Unbooked locations are internal estimates based on
the Company’s prospective acreage and assumptions as to the number of wells
that can be drilled per section based on industry practice and internal
review. Unbooked locations do not have attributed reserves. Of the 322
Michichi drilling locations identified herein, 69 are proved locations, 19 are
probable locations, and the remaining 234 are unbooked locations. Unbooked
locations have been identified by management as an estimation of our
multi-year drilling activities based on evaluation of applicable geologic,
seismic, engineering, production and reserves information. There is no
certainty that the Company will drill all unbooked drilling locations and if
drilled there is no certainty that such locations will result in additional
oil and gas reserves or production. The drilling locations on which the
Company will actually drill wells will ultimately depend upon the availability
of capital, regulatory approvals, seasonal restrictions, oil and natural gas
prices, costs, actual drilling results, additional reservoir information that
is obtained and other factors. While certain of the unbooked drilling
locations have been de – risked by drilling existing wells in relative close
proximity to such unbooked drilling locations, other unbooked drilling
locations are farther away from existing wells where management has less
information about the characteristics of the reservoir and therefore there is
more uncertainty whether wells will be drilled in such locations and if
drilled there is more uncertainty that such wells will result in additional
oil and gas reserves or production.

NON-GAAP FINANCIAL MEASURES

This press release contains the term “operating netbacks prior to hedging” and
“operating netbacks” which do not have standardized meanings prescribed by
IFRS and, therefore, may not be comparable with the calculation of similar
measures presented by other companies. Marquee uses operating netbacks to
analyze operating performance. Marquee believes this benchmark is a key
measure of profitability and overall sustainability for the Company and this
term is commonly used in the oil and natural gas industry. Operating netbacks
are not intended to represent operating profits, net earnings or other
measures of financial performance calculated in accordance with IFRS.

Operating netbacks prior to hedging are calculated by subtracting royalties,
production, and operating and transportation expenses from revenues before
other income/losses. Operating netbacks include realized hedging gain (loss).

This press release also contains the term “funds flow from operations” which
should not be considered an alternative to, or more meaningful than “cash flow
from operating activities”, as determined in accordance with IFRS, as an
indicator of the Company’s performance. “Funds flow from operations” does not
have any standardized meaning prescribed by IFRS and therefore reference to
funds flow from operations or funds flow from operations per share may not be
comparable with the calculation of similar measures presented by other
entities. Management uses funds flow from operations to analyze operating
performance and leverage and considers funds flow from operations to be a key
measure as it demonstrates the

Company’s ability to generate cash necessary to fund future capital
investments and to repay debt. Funds flow from operations per share is
calculated using the weighted average number of shares for the period.

In addition, the press release contains the term “net debt”, which does not
have any standardized meaning under IFRS and therefore may not be comparable
to similar measures presented by other issuers. Net debt is calculated as net
debt, defined as current assets less current liabilities (excluding fair value
of commodity contracts and flow-through share premiums). Management considers
net debt as an important additional measure to monitor debt repayment
requirements and track the financial viability of the Company.

ADDITIONAL ADVISORIES

Boes are presented on the basis of one boe for six Mcf of natural gas.
Disclosure provided herein in respect of boe may be misleading, particularly
if used in isolation. A boe conversion ratio of 6 Mcf: 1 bbl is based on an
energy equivalency conversion method primarily applicable at the burner tip
and does not represent a value equivalency at the wellhead. Given that the
value ratio based on the current price of crude oil as compared to natural gas
is significantly different from the energy equivalency of 6:1, utilizing a
conversion on a 6:1 basis may be misleading as an indication of value.

This press release contains disclosure in respect of F&D costs and FD&A costs,
which are considered oil and gas metrics within the meaning of NI 51-101. F&D
costs are calculated as the sum of development capital plus the change in
future development capital for the period divided by the reserves additions
for the period. FD&A costs are calculated as the sum of development capital
plus the change in future development capital and acquisition costs for the
period divided by the reserves. Management uses F&D costs as a measure to
assess the performance of the Company’s resources required to locate and
extract new hydrocarbon reservoirs. The aggregate of the exploration and
development costs incurred in the most recent financial year and the change
during that year in estimated future development costs generally will not
reflect total finding and development costs related to reserves additions for
that year. FD&A and F&D costs used by Marquee may not be comparable to similar
measures used by other issuers.

Neither the TSX Venture Exchange nor its Regulation Services Provider (as that
term is defined in the policies of the TSX Venture Exchange) accepts
responsibility for the adequacy or accuracy of this release.

– END RELEASE – 01/05/2017

For further information:

FOR ADDITIONAL INFORMATION PLEASE CONTACT:

Richard Thompson
President & Chief Executive Officer
(403) 817-5561
[email protected]

or visit the Company’s website at www.marquee-energy.com

COMPANY:
FOR: MARQUEE ENERGY LTD.
OTCQX Symbol: MQLXF
TSX VENTURE Symbol: MQL

INDUSTRY: Energy and Utilities – Oil and Gas
RELEASE ID: 20170501CC036

Press Release from Marketwired 1-866-736-3779

All press releases are written by the client and have NO affiliation with the news copy written by The Canadian Press. Any questions that arise due to the content or information provided in the press release should be directed to the company/organization
issuing the release, not to The Canadian Press.

GET ENERGYNOW’S DAILY EMAIL FOR FREE


Peat Announces Interim Financial Statements, an Update to Potential Technology Initiatives, and Changes to the Board

FOR: PEAT RESOURCES LIMITEDTSX VENTURE SYMBOL: PETDate issue: May 01, 2017Time in: 8:11 PM eAttention:
TORONTO, ONTARIO–(Marketwired – May 1, 2017) – Peat Resources Limited (the
“Company”) (TSX VENTURE:PET) today announces its interim financial state…

GET ENERGYNOW’S DAILY EMAIL FOR FREE


Western Energy Services Corp. Announces Changes to Its Stock Option Plan and Restricted Share Unit Plan to Address ISS Recommendations

FOR: WESTERN ENERGY SERVICES CORP.TSX SYMBOL: WRGDate issue: May 01, 2017Time in: 8:02 PM eAttention:
CALGARY, ALBERTA–(Marketwired – May 1, 2017) – Western Energy Services Corp.
(“Western” or the “Company”) (TSX:WRG) announces that the board of dire…

GET ENERGYNOW’S DAILY EMAIL FOR FREE


Petrocapita Announces Release of Year End Reserves, Financial Statements and MD&A and Update on Re-Organization

FOR: PETROCAPITA INCOME TRUST
CSE SYMBOL: PCE.UN

Date issue: May 01, 2017
Time in: 7:48 PM e

Attention:

CALGARY, ALBERTA–(Marketwired – May 1, 2017) – Petrocapita Income Trust
(CSE:PCE.UN) (“Petrocapita” or the “Trust”) announces that the Oil and Gas
Reserves, the Audited Financial Statements and Management’s Discussion and
Analysis for the years ended December 31, 2016 and December 31, 2015 have been
filed with the Canadian Securities Exchange (“CSE”) and on the System for
Electronic Document Analysis and Retrieval (“SEDAR”) and may be accessed at
www.sedar.com.

Additionally, during the process of evaluating the Trust’s proved plus probable
oil and gas reserves for 2016, and pursuant to a previously announced
re-organization of the Trust, the Trust’s independent third party valuator has
appraised the potential economic value of the produced water disposal and
treating facilities equivalent to the proved and probable oil and gas
properties of the Trust owned by its subsidiaries, Petrocapita Processing L.P.
and Petrocapita Oil and Gas L.P., respectively. Apportionment of the value of
the mid-stream facilities associated with, but apart from, the Trust’s reserves
was based on a net present value of future net revenues from these facilities
in each case after tax and discounted at 10%. The estimated values are related
to, but not included in, the Trust’s reserves, do not necessarily represent
fair market values, and have been derived by the Trust’s independent valuators
utilizing various assumptions, including transfer pricing at market and a
facility-to-reserves life index adjusted utilization as between Petrocapita and
third parties of 64% Petrocapita total proven and 93% Petrocapita proven plus
probable. Based on these parameters, the produced water and treating facilities
equivalent to proved plus probable are valued at $155.7 million ($71.1 million
total proved).

The focus on infrastructure development for Petrocapita began in 2013 and
continued into 2016 when the Trust acquired the heavily mid-stream focused
assets of Palliser Oil & Gas Corporation, as well as complimentary
transportation and well servicing assets. The intent is to continue to focus on
building out a portfolio of infrastructure/mid-stream assets as Petrocapita
continues to believe that the integration of such assets, together with a core
base of production, will result in increasing profitability, which is
particularly beneficial in a low oil price environment. Coincidentally, oil and
gas production assets in the Trust’s area of interest continue to be offered on
a heavily discounted basis, the acquisition of which will allow the core base
of production to grow and utilization of mid-stream assets to improve. Finally,
utilization of the same mid-stream assets by third parties will again improve
profitability and reduce consolidated operating costs.

About Petrocapita

Petrocapita Income Trust is a Specified Investment Flow Through trust
developing and acquiring heavy oil production and infrastructure assets in the
Lloydminster area of east central Alberta and west central Saskatchewan through
its wholly owned subsidiaries, Petrocapita Oil and Gas L.P. and Petrocapita

Processing L.P. Petrocapita owns and operates 445 gross (426.3 net) oil wells,
91 gross (22 net) gas wells, 19 produced water disposal facilities, 3 custom
oil processing facilities, 3 natural gas compressor stations, 72.75 km in
pipelines, oil well service rigs and trucks, fluid haul tractors and trailers,
motor graders, and well site processing equipment. It is seeking accretive
opportunities to acquire both oil production and complimentary midstream assets
during a cyclical low in the oil and gas markets.

FORWARD LOOKING INFORMATION:

Certain statements and information contained in this news release constitute
forward-looking statements and forward-looking information as defined under
applicable securities legislation (collectively, “forward-looking statements”).
These forward-looking statements relate to future events or Petrocapita’s
future performance. All statements other than statements of historical fact are
forward-looking statements. The use of any of the words “anticipate”, “plan”,
“contemplate”, “continue”, “estimate”, “expect”, “intend”, “propose”, “might”,
“may”, “will”, “shall”, “project”, “should”, “could”, “would”, “believe”,
“predict”, “forecast”, “pursue”, “potential” and “capable” and similar
expressions are intended to identify forward-looking statements. In particular,
and without limitation, these statements contain forward-looking statements
pertaining to Petrocapita’s estimated operational cost savings and pertaining
to the valuation of its water disposal facilities and treating facilities
(“facilities”). These statements involve known and unknown risks, uncertainties
and other factors that may cause actual results or events to differ materially
from those anticipated in such forward-looking statements. Although management
believes that the expectations conveyed by any forward-looking statements are
reasonable, no assurance can be given that these expectations will prove to be
correct and such forward-looking statements included in this news release
should not be unduly relied upon.
With respect to forward-looking statements contained in this news release,
assumptions have been made regarding, among other things: future crude oil
prices; the magnitude of per barrel cost savings which may be realized by
Petrocapita through upgrading its facilities; the level of future utilization
of Petrocapita’s facilities; the magnitude of future net revenues derived from
utilization of Petrocapita’s facilities; the duration over which future
revenues may be derived from Petrocapita’s facilities; and the ability of
Petrocapita to maintain reasonably stable operating and general administrative
expenses. The forward-looking statements contained in this news release involve
significant risks and uncertainties and should not be read as guarantees of
future performance or results. A number of factors could cause actual results
to differ materially from the results discussed in the forward-looking
statements, including, but not limited to, the risks related to: volatility in
market prices and demand for crude oil; general economic, market and business
conditions; difficulties encountered in the development and production of
Petrocapita’s reserves; difficulties encountered in the upgrading and/or
operation of Petrocapita’s facilities; the loss of key personnel; the failure
to realize the benefits of upgrading Petrocapita’s facilities; the inability to
generate sufficient cash flow from operations to meet current and future
obligations; the inability to obtain required debt and/or equity capital on
acceptable terms or at all; changes in tax law or other adverse regulatory,
royalty or tax changes; diversion of management to manage unforeseen business
or operating issues; current global financial conditions.

Information and statements in this news release relating to valuation of
Petrocapita’s facilities have been prepared by a third-party engineering firm
and are based on various estimates and assumptions, many of which have been
referred to above. Estimates of future net revenues associated with
Petrocapita’s facilities as prepared by different engineers, or by the same
engineers at different times, may vary. Petrocapita’s actual future net
revenues associated with its facilities will vary from estimates thereof and
such variations could be material.

Readers are cautioned that the risk factors set forth above should not be
construed as exhaustive. Additional information on risks, uncertainties and
factors that could affect the foregoing forward-looking information and/or
Petrocapita’s operations or results therefrom is included in its filings with
the securities commissions which have been filed under Petrocapita’s profile on
SEDAR (www.sedar.com).

Although the forward-looking statements contained in this news release are
based upon what Petrocapita’s management believes to be reasonable assumptions,
Petrocapita cannot assure investors that actual results will be consistent with
such information. Forward-looking statements reflect management’s current
beliefs and are based on information currently available to Petrocapita.
Petrocapita cautions readers not to place undue reliance on Petrocapita’s
forward-looking statements. The forward-looking statements are made as of the
date of this news release and Petrocapita assumes no obligation to update or
revise such information to reflect new events or circumstances, except as may
be required by applicable securities laws.

– END RELEASE – 01/05/2017

For further information:
Alex Lemmens
President
(587) 393-3460
OR
Steve Elliott
Investor Relations
(587) 700-8408

COMPANY:
FOR: PETROCAPITA INCOME TRUST
CSE SYMBOL: PCE.UN

INDUSTRY: Energy and Utilities – Equipment, Energy and Utilities –
Oil and Gas , Financial Services – Investment Services and Trading
RELEASE ID: 20170501CC0118

Press Release from Marketwired 1-866-736-3779

All press releases are written by the client and have NO affiliation with the news copy written by The Canadian Press. Any questions that arise due to the content or information provided in the press release should be directed to the company/organization
issuing the release, not to The Canadian Press.

GET ENERGYNOW’S DAILY EMAIL FOR FREE


Trump says he’s willing to consider raising gas tax

WASHINGTON — President Donald Trump on Monday said he will explore the possibility of higher gasoline and diesel fuel taxes, suggesting an increase could pay for his ambitious infrastructure plan.

“It’s something that I would certainly consider,” Trump told Bloomberg News in an interview.

The president indicated that the additional money would be directed toward highway construction and repair. That’s been a problem area because fuel taxes have been unchanged since 1993 and created financial challenges for preserving the Highway Trust Fund.

The federal government currently finances its trust fund with an 18.4 cents per gallon tax on gasoline and a 24.4 cents per gallon tax on diesel fuel, neither of which are adjusted for inflation so the revenues raised has effectively fallen over time.

To keep a positive balance in the trust fund, lawmakers have injected an additional $143 billion into it since 2008, according to a report last year by the Congressional Budget Office. Highway-related tax revenue raised just $37.4 billion in fiscal 2015, meaning that maintenance has been deferred as potholes and traffic jams have worsened.

It’s a rare tax increase that enjoys support from the businesses most likely to bear the higher costs.

The U.S. trucking industry — which shoulders roughly half the cost of the fuel taxes — would welcome an increase if it’s dedicated to fixing infrastructure. The industry benefits because better roads reduce travel times, curb the frequency of vehicle repairs and improve roadway safety.

“The cost of doing nothing is more expensive than a higher fuel tax,” said Chris Spears, president of the American Trucking Associations.

By increasing fuel taxes by 35 cents a gallon and indexing them to inflation, the federal government would raise an additional $473.6 billion over the next decade, according to the staff of the congressional Joint Committee on Taxation.

White House spokesman Sean Spicer said at the Monday news briefing that the president was only considering raising fuel taxes out of respect to requests from the trucking industry.

“He has an open mind,” Spicer said.

Raising fuel taxes has generally been opposed by Republican lawmakers at the state level.

Asked if he’d rule out a gas tax increase, House Ways and Means Committee Chairman Kevin Brady, R-Texas, told reporters Monday, “In my view, yes.” He added later, “But we’re going to have that discussion with the White House and we want to learn more about the president’s ideas.”

A committee aide said later that Brady’s answer reflected an assumption that infrastructure tax issues will be addressed separately by other House committees.

Trump also told Bloomberg News that the personal and corporate income tax plan his administration outlined last week is just the starting point for negotiations with Congress.

“Everything is a starting point,” the president said.

Trump’s proposed plan would slash the corporate tax rate to 15 per cent and lower rates for individuals, likely increasing the deficit substantially if passed.

____

Associated Press writer Alan Fram contributed to this report.

Josh Boak And Jill Colvin, The Associated Press


GET ENERGYNOW’S DAILY EMAIL FOR FREE


Antler Hill Oil & Gas Ltd. Files its Financial Statements for the Year Ended December 31, 2016 on SEDAR

FOR: ANTLER HILL OIL & GAS LTD.
NEX BOARD SYMBOL: AHO.H
TSX VENTURE SYMBOL: AHO.H

Date issue: May 01, 2017
Time in: 6:10 PM e

Attention:

CALGARY, ALBERTA–(Marketwired – May 1, 2017) –

THIS PRESS RELEASE IS NOT FOR DISTRIBUTION TO ANY U.S. NEWSWIRE SERVICES OR FOR
DISSEMINATION IN THE UNITED STATES OF AMERICA.

Antler Hill Oil & Gas Ltd. (NEX:AHO.H) (the “Corporation”) announces that the
Corporation has filed its Financial Statements for the year ended December 31,
2016 on SEDAR.

Neither the TSX Venture Exchange, Inc. nor its Regulation Service Provider (as
that term is defined under the policies of the TSX Venture Exchange) has
neither approved nor disapproved of the contents of this press release.

This news release may contain assumptions, estimates, and other forward-looking
statements regarding future events. Such forward-looking statements involve
inherent risks and uncertainties and are subject to factors, many of which are
beyond the Corporation’s control that may cause actual results or performance
to differ materially from those currently anticipated in such statements. Such
forward-looking statements include comments regarding the private placement and
use of funds.

– END RELEASE – 01/05/2017

For further information:
Antler Hill Oil & Gas Ltd.
Vic Luhowy
President
(403) 860-4225

COMPANY:
FOR: ANTLER HILL OIL & GAS LTD.
NEX BOARD SYMBOL: AHO.H
TSX VENTURE SYMBOL: AHO.H

INDUSTRY: Energy and Utilities – Oil and Gas
RELEASE ID: 20170501CC0110

Press Release from Marketwired 1-866-736-3779

All press releases are written by the client and have NO affiliation with the news copy written by The Canadian Press. Any questions that arise due to the content or information provided in the press release should be directed to the company/organization
issuing the release, not to The Canadian Press.

GET ENERGYNOW’S DAILY EMAIL FOR FREE


Pembina Pipeline plans friendly takeover of Veresen in $9.7 billion deal

CALGARY — Pembina Pipeline Corp. announced Monday a $9.7-billion friendly takeover offer for Veresen Inc. in the latest case of energy companies pushing for scale and diversification in uncertain times.

The Calgary-based companies both provide pipeline, storage and processing infrastructure in several key oil-and-gas producing areas of Western Canada, but their geographic and product profiles are complementary, their officials told a conference call with financial analysts.

“We are predominantly a liquids company, Veresen is predominantly a gas company. And I think that is the magic,” Pembina CEO Mick Dilger said.

“Now we can bring both service offerings to our customers.”

Veresen (TSX:VSN) shares soared by close to 20 per cent on the news, gaining $2.72 to $17.96 on the Toronto Stock Exchange. Pembina’s stock-and-cash (TSX:PPL) offer was worth the equivalent of $18.65 per Veresen share when announced.

Veresen CEO Don Althoff said there will be more near-term growth opportunities than either company could achieve separately because of Pembina’s financial strength and the location of Veresen’s operational base.

“The plays you serve matter — especially in lower commodity price environments — because it’s the most prolific and economic areas that will continue to grow and be developed,” Althoff said.

AltaCorp Capital analyst Dirk Lever said the deal was a great fit for both companies.

“There’s terrific synergies between the two companies, there’s really no overlap at all,” Lever said.

The companies said they expect to achieve up to $100 million in annualized pre-tax efficiencies through a combination of cost savings and growth.

The deal, which the companies said would create one of the largest energy infrastructure firms in Canada, will make it easier to  finance what are increasingly expensive growth projects, said Lever.

“It’s no longer a million dollar game that we’re looking at, it’s a billion dollar game. And you need the size and heft in order to get these projects done,” he said.

Althoff said their proposed US$3-billion Jordan Cove liquefied natural gas terminal could benefit from the combined balance sheet, though they have regulatory and contract barriers to solve there as well.

“This was always the project that was just a little too big for Veresen, but it’s not too big for the combined entity,” he said.

Pembina also has several big projects in the works, including a potential $4-billion polypropylene upgrader that would benefit from an Alberta government incentive program.

The deal is one of several multibillion-dollar takeovers in Canada’s pipeline industry in the last year.

In December, shareholders approved Enbridge’s (TSX:ENB) US$28-billion acquisition of Houston-based Spectra Energy, about half a year after TransCanada (TSX:TRP) completed its takeover of Columbia Pipeline Group of Houston in a deal valued at US$13 billion.

As part the latest deal, Veresen shareholders would receive nearly $4.85 in cash and the rest in Pembina stock, assuming the maximum $1.523 billion in cash is issued, while Pembina would increase its dividend by about six per cent.


Follow @ibicks on Twitter.

Ian Bickis, The Canadian Press

GET ENERGYNOW’S DAILY EMAIL FOR FREE


Esrey Announces Signing of a Non-Binding Letter of Intent With PRG PLC

FOR: ESREY ENERGY LTD.
TSX VENTURE SYMBOL: EEL

Date issue: May 01, 2017
Time in: 5:22 PM e

Attention:

VANCOUVER, BRITISH COLUMBIA–(Marketwired – May 1, 2017) – Esrey Energy Ltd.
(“Esrey” or the “Company”) (TSX VENTURE:EEL) announces that it has entered into
a non-binding letter of intent (“LOI”) with PRG PLC, a private Malta company
(“PRG”), to acquire Zinc Power Limited (“Zinc Power”), a majority owned
subsidiary of PRG at arm’s length to the Company and its principals, whose
principal assets include approximately 130,000 tonnes of zinc tailings located
in Kosovo (the “Acquisition”).

Under the terms of the LOI, Esrey is to acquire 100% of the shares of Zinc
Power from PRG and the minority shareholders of Zinc Power in exchange for
39,762,771 shares of Esrey (the “Esrey Shares”) being an amount equal to 100%
of the current issued and outstanding shares of Esrey. It is contemplated that
on closing (“Closing”) of the Acquisition, PRG will distribute the Esrey shares
otherwise issuable to it to the shareholders of PRG on a pro rata basis. The
Esrey Shares will be subject to resale restrictions in accordance with the
policies of the TSX Venture Exchange including, but not necessarily limited to,
a four-month hold period.

The LOI also provides that Esrey loan US $500,000 to Zinc Power, which loan is
guaranteed by PRG.

On Closing, it is intended that Ray Power and Nitesh Shah of PRG would be
appointed as directors of Esrey and Richard Green would resign.

Closing remains subject to each of Esrey and PRG completing a satisfactory due
diligence review of the other and entering into a definitive agreement by May
12, 2017 and the acceptance of the Acquisition by the TSX Venture Exchange.

ESREY ENERGY LTD.

“David Nelson”

President & CEO

Neither TSX Venture Exchange nor its Regulation Services Provider (as that term
is defined in the policies of the TSX Venture Exchange) accepts responsibility
for the adequacy or accuracy of this release.

Cautionary Note Regarding Forward-Looking Statements

Certain statements contained in this news release constitute “forward-looking
information” as such term is used in applicable Canadian securities laws.
Forward-looking information is based on plans and estimates of management at
the date the information is provided and certain factors and assumptions of
management. Forward looking information is subject to a variety of risks and
uncertainties and other factors that could cause plans, estimates and actual
results to vary materially from those projected in such forward-looking
information. Factors that could cause the forward-looking information in this
news release to change or to be inaccurate include, but are not limited to, the
risks related to unsatisfactory results of due diligence, international
operations and doing business in foreign jurisdictions, and the risk of
commodity price and foreign exchange rate fluctuations.

– END RELEASE – 01/05/2017

For further information:
Investor relations:
1-778-373-0103
Email: [email protected]

COMPANY:
FOR: ESREY ENERGY LTD.
TSX VENTURE SYMBOL: EEL

INDUSTRY: Energy and Utilities – Oil and Gas
RELEASE ID: 20170501CC0103

Press Release from Marketwired 1-866-736-3779

All press releases are written by the client and have NO affiliation with the news copy written by The Canadian Press. Any questions that arise due to the content or information provided in the press release should be directed to the company/organization
issuing the release, not to The Canadian Press.

GET ENERGYNOW’S DAILY EMAIL FOR FREE


Weekly Canadian Oil & Gas Industry Highlights – May 1, 2017

May 1, 2017 Presented by POIM Consulting Group Major /Interesting Projects Canadian Natural Resources Limited large compressor install at existing Gas Plant Gold Creek 13-26-067-05W6 Husky Energy Limited large compressor install at existing Gas Plant FERRIER 04-02-037-10W5 Velvet Energy Ltd large battery includes Desanders, Pumps, Tanks PEMBINA 01-29-048-11W5 Seven Generations Energy Ltd. Large Battery KARR … Read more

GET ENERGYNOW’S DAILY EMAIL FOR FREE


Eurogas International Inc. Announces 2017 First Quarter Financial Results

FOR: EUROGAS INTERNATIONAL INC.
CSE SYMBOL: EI
CSE SYMBOL: EI.CN
CNSX SYMBOL: EI

Date issue: May 01, 2017
Time in: 5:01 PM e

Attention:

TORONTO, ONTARIO–(Marketwired – May 1, 2017) – Eurogas International Inc.
(“Eurogas International” or the “Corporation”) (CSE:EI)(CSE:EI.CN)(CNSX:EI)
today announced its 2017 first quarter financial results. The Corporation’s
unaudited condensed interim financial statements, along with the accompanying
management’s discussion and analysis have been filed on the System for
Electronic Document Analysis and Retrieval (“SEDAR”) and may be viewed by
interested parties under the Corporation’s profile at www.sedar.com or the
Corporation’s website at www.eurogasinternational.com.

FORWARD-LOOKING STATEMENTS

Certain information set forth in this document, including management’s
assessment of the Corporation’s future plans and operations, contains
forward-looking statements. Forward-looking statements are statements that are
predictive in nature, depend upon or refer to future events or conditions, or
include words such as “expects”, “anticipates”, “intends”, “plans”, “believes”,
“estimates” or similar expressions. By their nature, forward-looking statements
are subject to numerous risks and uncertainties, some of which are beyond the
Corporation’s control, including the risks that the Corporation is unable to
access sufficient capital from internal and external sources, volatility of
commodity prices, currency fluctuations, risks associated with foreign
operations, exploration, development and production risks, risks of not being
able to obtain or renew permits and licenses, environmental risks, the impact
of general economic conditions, reliance on key personnel and management,
competition from other industry participants, and other risk factors discussed
or referred to in other documents filed from time to time with the securities
administrators, all of which may be accessed at www.sedar.com. Readers are
cautioned that the assumptions used in the preparation of such information,
although considered reasonable at the time of preparation, may prove to be
imprecise and, as such, undue reliance should not be placed on forward-looking
statements. The Corporation’s actual results, performance or achievement could
differ materially from those expressed in, or implied by, these forward-looking
statements and accordingly, no assurance can be given that any of the events
anticipated by the forward-looking statements will transpire or occur, or if
any of them do so, what impact they might have on the Corporation. The
Corporation disclaims any intention or obligation to update or revise any
forward-looking statements, whether as a result of new information, future
events or otherwise, except as required by law.

ABOUT EUROGAS INTERNATIONAL

Eurogas International Inc. is an independent oil and gas exploration company
listed on the Canadian Securities Exchange (www.cnsx.ca) under the symbol EI.

All documentation in respect of the Corporation may be viewed under the
Corporation’s profile on SEDAR (www.sedar.com) or under the Corporation’s
website at www.eurogasinternational.com.

– END RELEASE – 01/05/2017

For further information:
Eurogas International Inc.
c/o Dundee Corporation
1 Adelaide Street East, 21st floor
Toronto, ON M5C 2V9
(416) 350-3388
Fax: (416) 363-4536
OR
Jaffar Khan
President & CEO
www.eurogasinternational.com

COMPANY:
FOR: EUROGAS INTERNATIONAL INC.
CSE SYMBOL: EI
CSE SYMBOL: EI.CN
CNSX SYMBOL: EI

INDUSTRY: Energy and Utilities – Oil and Gas
RELEASE ID: 20170501CC0100

Press Release from Marketwired 1-866-736-3779

All press releases are written by the client and have NO affiliation with the news copy written by The Canadian Press. Any questions that arise due to the content or information provided in the press release should be directed to the company/organization
issuing the release, not to The Canadian Press.

GET ENERGYNOW’S DAILY EMAIL FOR FREE


Divestco Announces Normal Course Issuer Bid and Granting of Stock Options

FOR: DIVESTCO INC.
TSX VENTURE Symbol: DVT

Date issue: May 01, 2017
Time in: 5:00 PM e

Attention:

CALGARY, AB –(Marketwired – May 01, 2017) – Divestco Inc. (“Divestco” or the
“Company”) (TSX VENTURE: DVT) announces that it intends to commence a normal
course issuer bid (the “Bid”), whereby certain of the issued and outstanding
Class A shares of Divestco (the “Class A Shares”) will be purchased through
the TSX Venture Exchange (the “TSXV”) and cancelled. The Bid has been filed
with and accepted by the TSXV and pursuant to the terms and conditions of the
Bid, Divestco may purchase up to 3,344,180 (a maximum of 5%) of its issued and
outstanding Class A Shares (66,883,608 Class A Shares are outstanding as at
May 1, 2017) in a twelve-month period. The Bid will commence on the 2nd day of
May, 2017 and will terminate on the earlier of the 1st day of May, 2018 and
the date on which the maximum number of Class A Shares are purchased pursuant
to the Bid. Purchases of Class A Shares under the Bid will occur at the market
price at the time of purchase. Purchases made pursuant to the bid will be made
by Canaccord Genuity Wealth Management, a division of Canaccord Genuity Group
on behalf of Divestco. Divestco has previously purchased its Class A Shares
pursuant to normal course issuer bids from 2004 to 2008.

The Company’s board of directors and management believe that from time to
time, the market price of its Class A Shares may not reflect their underlying
value and that the purchase of its Class A Shares may represent an appropriate
and desirable use of corporate funds. Divestco intends to fund the purchases
out of available cash.

Divestco also announces that pursuant to the Company’s stock option plan, it
has granted stock options to acquire up to an aggregate of 4,250,000 Class A
shares, including 2,000,000 options granted to officers and 750,000 options
granted to the Board of Directors. The options are for a five-year term,
expiring on April 30, 2022, and are exercisable at a price of $0.08 per share
pursuant to a vesting schedule of one-third following the first anniversary of
the date of grant (the “Grant Date”), one-third following the second
anniversary of the Grant Date and the remaining one-third following the third
anniversary of the Grant Date.

About the Company

Divestco provides innovative geoscience solutions to Energy and Service
companies worldwide. Our customers predominantly operate in the areas of
geology, geophysics and engineering and we work with our clients to ensure
they have the right solutions, at the right time, to help them make more
informed decisions. Commitment, innovation, accountability and agility form
the cornerstone of our values and enable us to consistently provide reliable
solutions and exceptional, personalized service in all of the core areas in
which we operate. Divestco provides Software & Data, Seismic Processing,
Geomatics Services, and Seismic Data & Brokerage. Divestco is headquartered in
Calgary and trades on the TSX Venture Exchange under the symbol “DVT”.

Additional information on the Company is available on its website at
Divestco.com and on SEDAR at sedar.com.

Neither TSX Venture Exchange nor its Regulation Services Provider (as that
term is defined in the policies of the TSX Venture Exchange) accepts
responsibility for the adequacy or accuracy of this news release.

Forward-Looking Information and Statements

In particular, this press release contains forward-looking information and
statements pertaining to the Bid. This forward-looking information and the
related statements are based upon factors, expectations and assumptions
reflected in the forward-looking statements that reasonable at this time but
no assurance can be given that these factors, expectations and assumptions
will prove to be correct.

The forward-looking information and statements contained in this press release
are based upon several material factors and expectations and assumptions of
Divestco including, without limitation: Divestco’s status as a going concern;
that Divestco will continue to conduct its operations in a manner consistent
with past operations; future interests rates; future availability of debt
and/or equity sources to fund Divestco’s capital and operating requirements as
needed on terms acceptable to management of Divestco or at all; future prices
for crude oil and natural gas; and the ability of the Company to complete a
sale of non-strategic assets, including but not limited to finding appropriate
potential purchasers who are willing to purchase such assets at market prices.

The forward-looking information and statements included in this press release
are not guarantees of future performance and should not be unduly relied upon.
Such information and statements involve known and unknown risks, uncertainties
and other factors that may cause actual results or events to differ materially
from those anticipated in such forward-looking information and statements
including, without limitation: general economic, market and business
conditions; increased debt levels or debt service requirements; limited,
unfavourable or no access to debt or equity capital markets; volatility in
market prices for crude oil and natural gas; ability of Divestco’s clients to
explore for, develop and produce oil and gas; availability of financing and
capital; the ability of Divestco’s customers to pay in a timely manner;
fluctuations in interest rates; demand for the Company’s product and services;
the lack of a suitable purchaser for Divestco’s non-strategic assets;
competitive actions by other companies; failure to obtain regulatory approvals
in a timely manner; adverse conditions in the debt and equity markets; and
government actions including changes in environment and other regulation; and
certain other risks detailed from time to time in Divestco’s public disclosure
documents including, without limitation, those risks identified in this press
release.

The forward-looking information and statements contained in this press release
speak only as of the date of this press release, and Divestco does not assume
any obligation to publicly update or revise them to reflect new events or
circumstances, except as may be required pursuant to applicable laws.

– END RELEASE – 01/05/2017

For further information:

For more information please contact:
Divestco Inc.
(www.divestco.com)

Mr. Stephen Popadynetz
CEO and President
Tel 587-952-8152

Mr. Danny Chiarastella
Chief Financial Officer
Tel 587-952-8027

COMPANY:
FOR: DIVESTCO INC.
TSX VENTURE Symbol: DVT

INDUSTRY: Energy and Utilities – Oil and Gas
RELEASE ID: 20170501CC015

Press Release from Marketwired 1-866-736-3779

All press releases are written by the client and have NO affiliation with the news copy written by The Canadian Press. Any questions that arise due to the content or information provided in the press release should be directed to the company/organization
issuing the release, not to The Canadian Press.

GET ENERGYNOW’S DAILY EMAIL FOR FREE


Enercare Announces Results of 2017 Annual and Special Meeting

FOR: ENERCARE INC.TSX Symbol: ECIDate issue: May 01, 2017Time in: 4:30 PM eAttention:
TORONTO, ON –(Marketwired – May 01, 2017) – Enercare Inc. (“Enercare”) (TSX:
ECI) announced the results from its Annual and Special Meeting of shareholders
held ea…

GET ENERGYNOW’S DAILY EMAIL FOR FREE


High Arctic to Announce First Quarter Results and Host Q1 Conference Call

FOR: HIGH ARCTIC ENERGY SERVICES INC.TSX SYMBOL: HWODate issue: May 01, 2017Time in: 4:10 PM eAttention:
CALGARY, ALBERTA–(Marketwired – May 1, 2017) –
NOT FOR DISTRIBUTION TO U.S. NEWSWIRE SERVICES OR FOR DISSEMINATION IN THE
UNITED STATES. ANY FAIL…

GET ENERGYNOW’S DAILY EMAIL FOR FREE


Justices won’t hear challenge over Alaska polar bear habitat

WASHINGTON — The Supreme Court won’t hear an appeal from Alaska and oil and gas industry groups protesting the government’s designation of more than 187,000 square miles in the state as critical habitat for threatened polar bears.

The justice on Monday left in place an appeals court ruling that said the U.S. Fish and Wildlife Service followed the law when it authorized the massive habitat in a coastal area larger than the state of California.

Alaska officials, the American Petroleum Institute and others said the designation was too extensive and accused the agency over overreaching.

A federal judge had rejected the plan, saying the agency had not shown that certain areas on land and barrier islands were appropriate for polar bear dens. But a federal appeals court overturned that ruling last year.

The Associated Press

GET ENERGYNOW’S DAILY EMAIL FOR FREE


Justices side with Venezuela in dispute over seized oil rigs

WASHINGTON — A unanimous Supreme Court on Monday gave the government of Venezuela another chance to fend off a lawsuit alleging the country illegally seized 11 oil drilling rigs from an Oklahoma-based company in 2010.

The justices ruled that lower courts had set the bar too low in allowing the lawsuit brought by Helmerich & Payne International Drilling Company to move forward.

Foreign countries are generally immune from lawsuits in the U.S., but a federal statute makes an exception in certain cases when private property is seized.

Writing for the court, Justice Stephen Breyer said companies must make a stronger argument at the outset of a case that property was actually taken in violation of international law. He said such cases must be more than just “non-frivolous” to avoid being tossed out.

If cases against foreign governments are allowed too easily to proceed in American courts, it could “create friction with other nations and reciprocal actions against this country,” Breyer said.

The U.S. government had sided with Venezuela, arguing that ruling for the company could harm foreign relations and lead other countries to retaliate against American interests.

The case began after Venezuela’s former president Hugo Chavez issued a decree seizing control of the oil rigs owned by U.S. driller Helmerich & Payne International Drilling Co. The company refused to operate them after Venezuela’s state-owned oil company fell more than $100 million behind in payments.

Chavez said the “forced acquisition” was necessary to put the idled rigs back to work.

Venezuela argued that the seizure did not violate international law because the rigs were owned by a Venezuelan subsidiary of Helmerich & Payne. But a federal appeals court sided with the company, ruling that it could move ahead with a lawsuit claiming the move harmed U.S. shareholders.

Justice Neil Gorsuch did not take part in the case, which was argued before he took his seat on the court.

Sam Hananel, The Associated Press

GET ENERGYNOW’S DAILY EMAIL FOR FREE


High employees mean higher costs when marijuana legalized, oil and gas CEOs warn

CALGARY — Oilpatch CEOs fear their costs will rise when the federal government passes recently introduced legislation to legalize recreational marijuana.

The issue of drug use is closely watched in the industry, where workers tend to be young and hazards include long commutes to and from remote drilling sites, wells that produce poisonous or explosive gas and exposure to heavy machinery. Many oil and gas companies have strict bans on alcohol and drugs at work.

Precision Drilling CEO Kevin Neveu, whose Calgary-based firm operates in both Canada and the United States, says his opposition to legalization is supported by his company’s experiences in Colorado after that state legalized the drug in 2014.

He said costs there have increased for employees who need drug counselling or for those who fail drug tests and must be sent home under Precision’s “zero tolerance” drug and alcohol policy.

And it’s more difficult to find new recruits, typically young men, who can pass pre-employment drug tests, he said.

“We have certainly failed more people in Colorado (for drug use) after legalization than we did before,” he said, though he was unable to give specific numbers.

“There’s a link, there’s a cause. Even during the recruitment phase where we warn them we’ll do a test, a surprising number still test positive.”

Canada’s Liberal government campaigned on a promise to legalize marijuana for recreational use, arguing prohibition does not prevent young people from using the drug. It also said too many Canadians end up with criminal records for possessing small amounts and legalization would help remove the criminal element linked to the drug.

But Jeff Tonken, CEO of Calgary-based natural gas producer Birchcliff Energy (TSX:BIR), agreed with Neveu that employee costs will rise if the government succeeds in legalizing recreational pot by July 1, 2018.

“It’s going to be more costly for us to police the safety of our people,” he said.

He said workers sign an agreement when hired giving permission for random tests for drugs and alcohol consumption.

If someone fails a test, they must leave the job site, he said, but the company may still be responsible for paying for substance abuse treatment or covering a leave of absence.

SureHire Inc., an Edmonton-based drug testing company with branches across Canada, charges between $85 and $135 for a 12-panel point of collection test or a saliva drug test. A hair drug test costs $275 to $325, but costs rise if the sample is “non-negative” because it must then be sent to a lab for confirmation. Usually, the company pays.

“This is a really good time for companies to review their internal policies and procedures,” said Jason Sheehy, SureHire’s director of occupational health services.

He pointed out that medical marijuana has been available in Canada since 2001, but there still is no test to determine if someone is impaired by any drug other than alcohol — tests can only show that someone has consumed the drug at some point.

Nor can the test show when the drug was taken, he said. For example, an infrequent marijuana user’s urine sample might test positive for five to 10 days after marijuana use, but a heavy user will show positive for up to 30 days.

Enform, an oil and gas industry training and safety organization, said in a recent statement that the federal legislation fails to address the need to do further research on marijuana impairment testing technologies, nor did it cover how labour and workplace legislation can be harmonized from province to province.

“There is well-documented research to demonstrate cognitive impairments that can last for more than 24 hours and up to 20 days for chronic marijuana use,” said Enform CEO Cameron MacGillivray, calling for a legal prohibition on marijuana in or near the workplace.

Matt Pascuzzo, spokesman for federal Employment Minister Patty Hajdu, said the government will ensure Canadians’ health and safety are protected as it works with provinces and territories on measures addressing impairment at work.

Mark Salkeld, president of the Petroleum Services Association of Canada, said freer access to marijuana is more likely to cause problems in his industry than in many others because of its hazards.

“You know, you don’t want guys stoned in those environments. Or even hungover,” he said.


Follow @HealingSlowly on Twitter.

Dan Healing, The Canadian Press

GET ENERGYNOW’S DAILY EMAIL FOR FREE


Suncor says Mildred Lake shipments resume following fire in March

CALGARY — Suncor Energy (TSX:SU) says that shipments from its Mildred Lake oilsands operation have resumed following a fire in March.

The company says it completed repairs and start-up activities to begin shipping product by pipeline on the weekend.

The fire burned for two days in March at the Mildred Lake oilsands upgrader after a pipeline began leaking near one of its two hydrotreating units.

The plant can produce about 350,000 barrels per day when it is operating at capacity.

Shipments are currently at approximately 140,000 barrels per day and are expected to ramp up as additional units complete turnaround activities.

Suncor says production is expected to return to full rates in June.

The Canadian Press

GET ENERGYNOW’S DAILY EMAIL FOR FREE


Forent Energy Announces Filing of an Application to Appoint a Receiver by its Lender

FOR: FORENT ENERGY LTD.
TSX VENTURE SYMBOL: FEN

Date issue: May 01, 2017
Time in: 9:30 AM e

Attention:

CALGARY, ALBERTA–(Marketwired – May 1, 2017) – Forent Energy Ltd. (“Forent” or
the “Company”) (TSX VENTURE:FEN) announces that its senior lender has filed an
application to appoint a receiver over the Company. The application will be
heard at the Calgary Court Center on Friday, May 5, 2017 at 2:00 p.m. In the
event that a receiver is appointed, the Company anticipates that the TSX
Venture Exchange will suspend and then delist the Company’s securities.

No directors or officers of the Company have submitted resignations. It is
anticipated that the directors and officers of the Company will resign
concurrent with the appointment of a receiver.

In addition, as a result of restrictions placed on the Company by its senior
lender, Forent will not be able to file its 2016 Annual Audited financial
statements and MD&A by the due date.

Notwithstanding the foregoing, the Company is continuing to pursue strategic
alternatives.

Reader Advisory and Note Regarding Forward Looking Information

Certain statements contained within this press release, and in certain
documents incorporated by reference into this document constitute forward
looking statements. These statements relate to future events or future
performance. All statements, other than statements of historical fact, may be
forward looking statements. Forward looking statements are often, but not
always, identified by the use of words such as “seek”, “anticipate”, “budget”,
“plan”, “continue”, “estimate”, “expect”, “forecast”, “may”, “will”, “project”,
“predict”, “potential”, “targeting”, “intend”, “could”, “might”, “should”,
“believe” and similar expressions. These statements involve known and unknown
risks, uncertainties and other factors that may cause actual results or events
to differ materially from those anticipated in such forward looking statements.
In particular, this press release contains the following forward looking
statements pertaining to, without limitation, the following: whether the lender
will be successful in their court application to have a receiver appointed over
the Company; whether the TSXV suspends and delists the Company’s securities if
a receiver is appointed by the court; whether the directors and officers of the
Company will resign from their positions with the Company; and whether the
Company will be successful in its strategic alternatives efforts.

Readers are cautioned that the foregoing lists of factors are not exhaustive.
The forward looking statements contained in this press release and the
documents incorporated by reference herein are expressly qualified by this
cautionary statement. The forward looking statements contained in this press
release speak only as of the date thereof and FEN does not assume any
obligation to publicly update or revise them to reflect new events or
circumstances, except as may be required pursuant to applicable securities laws

For more information on the Company, Investors should review the Company’s
registered filings which are available at www.sedar.com.

NEITHER THE TSX VENTURE EXCHANGE NOR ITS REGULATION SERVICES PROVIDER (AS THAT
TERM IS DEFINED IN THE POLICIES OF THE TSX VENTURE EXCHANGE) ACCEPTS
RESPONSIBILITY FOR THE ADEQUACY OR ACCURACY OF THIS RELEASE.

– END RELEASE – 01/05/2017

For further information:
Forent Energy Ltd.
Curtis Hartzler
President & CEO
(403) 262-9444 #204
[email protected]
www.forentenergy.com

COMPANY:
FOR: FORENT ENERGY LTD.
TSX VENTURE SYMBOL: FEN

INDUSTRY: Energy and Utilities – Oil and Gas
RELEASE ID: 20170501CC0060

Press Release from Marketwired 1-866-736-3779

All press releases are written by the client and have NO affiliation with the news copy written by The Canadian Press. Any questions that arise due to the content or information provided in the press release should be directed to the company/organization
issuing the release, not to The Canadian Press.

GET ENERGYNOW’S DAILY EMAIL FOR FREE


RTDNA Canada Announces 2017 National Award Finalists

FOR: RADIO TELEVISION NEWS DIRECTORS ASSOCIATION

Date issue: May 01, 2017
Time in: 8:00 AM e

Attention:

TORONTO, ONTARIO–(Marketwired – May 1, 2017) – RTDNA Canada is pleased to
announce the finalists for the RTDNA Canada National Awards. The entries
represent excellence in broadcast and digital journalism in Canada.

The RTDNA Canada Awards honour the best journalists, programs, stations and
news gathering organizations in radio, television and digital. “As our industry
continues to weather a bombardment from many fronts, it is crucial to pause,
regroup and celebrate outstanding Canadian journalism,” says RTDNA Canada
President Ian Koenigsfest. “All nominees should be proud of the exceptional
work they have submitted for the RTDNA’s prestigious National awards; our
industry is stronger because of them.”

National winners will be announced at the 2017 National Conference & Awards
Gala in Toronto on May 27. To see more information, and to register, visit
http://www.rtdnacanada.com/general-information-2017-national-conference/.

2017 RTDNA Awards – National Finalists:

Digital

Adrienne Clarkson Award – Diversity

/T/

— CBC Montreal: Real Talk on Race
— CBC Nova Scotia: School Board Deals with Racially Charged Incidents
— CBC Yellowknife: Kitikmeot Women Revive Traditional Inuit Tattoos

/T/

Charlie Edwards Award – Spot News

/T/

— CBC Toronto: Rob Ford’s Death Coverage
— CTV Vancouver Island: On-Duty Mountie Killed in Langford Crash
— Global Edmonton: Fort McMurray Wildfire

/T/

Data Storytelling Award

/T/

— CBC Vancouver: Every Parking Ticket Issued in Vancouver Last Year
— CBC Yellowknife: Is Yellowknife Ready to Reckon with Its Toxic Legacy?
— CTV News Ottawa: Fort McMurray Fire Spread Comparison Graphic

/T/

Digital Media Award (Large Market)

/T/

— CBC Montreal Website: Engaging Our Audience Digitally
— Global Edmonton: Family Matters
— NEWS1130.COM

/T/

Digital Media Award (Small/Medium Market)

/T/

— CBC Nova Scotia Facebook: CBC.CA/NS
— CBC Saskatchewan: SK Votes 2016: Brad Wall Wins 3rd Majority in

Saskatchewan
— CBC Thunder Bay: Deep Water

/T/

Gord Sinclair Award – Live Special Events

/T/

— CBC Prince Edward Island: CBC Public Forum on Electoral Reform
— CBC Vancouver: Royal Visit
— CBC Whitehorse: Yukon Royal Visit

/T/

Ron Laidlaw Award – Continuing Coverage

/T/

— CBC Hamilton: Tim Bosma Murder Trial Coverage
— CBC Nova Scotia: Norwegian-Canadian War Hero
— Global BC News Online: Fentanyl Crisis in B.C.
— Global Edmonton: Fort McMurray Wildfire

/T/

Sam Ross Award – Editorial / Commentary

/T/

— CBC Montreal: Editorial Value: Politics, Sports and Indigenous Affairs
— CBC Vancouver: Big Oil vs. Big Whale: Will Pipeline Trump Orca?
— CTV Calgary: Postscript

/T/

Sports Feature Reporting Award (Large Market)

/T/

— CBC Edmonton: Winter Cycling 101
— CBC Montreal: Montrealer’s Collection is a Snapshot of Baseball History
— Global News BC Online: BC Wrestler’s Legendary Career

/T/

Sports Feature Reporting Award (Small/Medium Market)

/T/

— CBC North: 2016 Arctic Winter Games

/T/

Multiplatform

Dan McArthur Award – In-Depth or Investigative

/T/

— CBC New Brunswick: Special Deals
— CBC Thunder Bay: Deep Water
— CBC Vancouver: The Frontline of Fentanyl

/T/

Radio

Adrienne Clarkson Award – Diversity

/T/

— CBC Quebec City: Facing Justice: Canada’s Treatment of Indigenous

Offenders
— CBC Saskatchewan: CBC Blue Sky: The R Word – Racism in Saskatchewan
— CBC Vancouver: Finding Refuge

/T/

Byron MacGregor Award – Best Newscast (Small Market)

/T/

— 989XFM: 8 A.M. News – July 28, 2016
— CKBZ Kamloops: B-100 Noon News

/T/

Byron MacGregor Award – Best Newscast (Medium Market)

/T/

— 650 CKOM: Midday Report: David Kirton & Gerald Bauman
— CBC Windsor: Windsor Morning: Tornados Land
— C-FAX 1070 AM: Victoria @ Noon

/T/

Byron MacGregor Award – Best Newscast (Large Market)

/T/

— 1310NEWS: The 1310 Morning News
— 660NEWS: Wildfire
— CBC Vancouver: Radio News: Kinder Morgan Pipeline Expansion, Nov. 29,

2016

/T/

Charlie Edwards Award – Spot News

/T/

— 680 NEWS: Stakeout, Shootout, and a Stabbing
— CBC Calgary: News Special: The Death of Jim Prentice: Former Premier

Killed in a Plane Crash
— CBC Prince Edward Island: School Evacuations

/T/

Dave Rogers Award – Short Feature (Small/Medium Market)

/T/

— 980 CJME: Martel on the Move – Election IQ
— CBC Nelson: Daybreak South: Expedition to Earth
— CBC Thunder Bay: A Promise Kept

/T/

Dave Rogers Award – Short Feature (Large Market)

/T/

— 630 CHED: Metis Welcome: Kirby Bourne Tour
— CBC Vancouer: Facing Fentanyl: A Young Addict and his Mom
— NEWSTALK1010: City Hall Lunacy: James Moore

/T/

Dave Rogers Award – Long Feature (Small/Medium Market)

/T/

— CBC Nelson: Daybreak South: The Krazy Canadian
— CBC Nova Scotia: Atlantic Voice: A Journey to Jamaica
— CBC Quebec City: Unique Home Care Program for Mentally Ill Patients
— CBC Whitehorse: Ross River Reacts to Fatal Dog Attack on Community

Member

/T/

Dave Rogers Award – Long Feature (Large Market)

/T/

— CBC Edmonton: Dental Nightmare: ‘Life Will Never be the Same’
— CBC Montreal: Two Veterans, Decades Apart
— CKNW: On the Front Lines at St. Paul’s Hospital

/T/

Dick Smyth Award – Creative Use of Sound

/T/

— CBC Edmonton: Waterbeds: From a Flood to a Drip
— CBC Toronto: Metro Morning: “Letters to Mohammed”
— CBC Vancouver: Fault Lines: 24 Hours After

/T/

Gord Sinclair Award – Live Special Events

/T/

— 570News Kitchener: Live Remembrance Day Broadcast
— 650 CKOM’s Day of Caring for Fort McMurray
— CBC Vancouver and CBC Calgary: Pipeline Persuasion

/T/

Peter Gzowski Award – Radio News Information Program

/T/

— CBC New Brunswick: Information Morning Fredericton: Feb. 22, 2016
— CBC Quebec City: Six Quebecers Killed in Burkina Faso Terrorist Attack
— News Talk 770: Return to Fort McMurray

/T/

Ron Laidlaw Award – Continuing Coverage

/T/

— 660NEWS: The Beast
— CBC Sudbury: The Fight to Save Local Schools
— CBC Vancouver: Fault Lines

/T/

Sam Ross Award – Editorial / Commentary

/T/

— 980 CJME: Taylor Field – Saying Farewell
— NEWS 1130: A Minute with Bill Good
— NEWSTALK1010: Pulse Nightclub Aftermath: Jim Richards

/T/

Sports Feature Reporting Award (Small/Medium Market)

/T/

— CBC Kamloops: Daybreak: Women’s World Hockey Comes to Kamloops
— CBC Thunder Bay: Drunkinental Cup

/T/

Sports Feature Reporting Award (Large Market)

/T/

— CBC Calgary: Taekwondo Kid
— CBC Montreal: Andie’s All Stars: Fiona Robinson
— CBC Vancouver: Field of Dreams: Uganda’s Improbable Journey to the

Softball World Championships

/T/

Television

Adrienne Clarkson Award – Diversity

/T/

— CBC News Manitoba: Access Denied
— City: Transgender Surgery
— CTV Atlantic: Being Muslim: New Home, New Challenges
— Global News BC: Haida People

/T/

Bert Cannings Award – Best Newscast (Small Market)

/T/

— CBC New Brunswick
— CBC North: Northbeat
— CFJC TV: A Reunion 38 Years in the Making, Nov. 17, 2016

/T/

Bert Cannings Award – Best Newscast (Medium Market)

/T/

— CTV Kitchener: Bosma Verdict
— Global Halifax: News at 6: December 5, 2016
— Global Saskatoon: La Loche School Shooting, January 22, 2016

/T/

Bert Cannings Award – Best Newscast (Large Market)

/T/

— CTV News Toronto: CTV News at Six
— Global Edmonton: Fort McMurray Wildfire
— Global News BC: Snow Mayhem, Monday, December 5, 2016

/T/

Charlie Edwards Award – Spot News

/T/

— CBC Newfoundland & Labrador: Here & Now: Bay de Verde Fish Plant Fire
— CTV News Ottawa: Sinkhole Swallows Rideau Street
— CTV Vancouver: Snowstorm

/T/

Dave Rogers Award – Short Feature (Small/Medium Market)

/T/

— CTV Kitchener: Calendar Girls
— Global New Brunswick: Senior Dog Walker
— Global Regina: An Olympic Heart

/T/

Dave Rogers Award – Short Feature (Large Market)

/T/

— CBC Vancouver News at 6: Forever Young
— CTV Calgary: Transplant Reunion
— CTV News Ottawa: Making an Impression: 13-Year-Old Evan Sharma is Being

Called “The Next Picasso”

/T/

Dave Rogers Award – Long Feature (Small/Medium Market)

/T/

— CKPG: I Hear Vinyl’s Back
— Global Regina: Wasted
— NTV: The Carter File Special: No Place Like Home

/T/

Dave Rogers Award – Long Feature (Large Market)

/T/

— CBC News: Vancouver at 6: A Night in the ER: Fentanyl Crisis Ground Zero
— CTV News Edmonton: Mustang Ride
— Global News: Cold Case

/T/

Gord Sinclair Award – Live Special Events

/T/

— CBC Newfoundland & Labrador: Beaumont-Hamel 100
— CP24: Olympic Parade
— CTV Vancouver: The Royal Visit

/T/

Hugh Haugland Award – Creative Use of Video

/T/

— CTV News Edmonton: HIV
— CTV News Toronto: In an Officer’s Shoes
— CTV Vancouver: Secret Bowling Alley

/T/

Ron Laidlaw Award – Continuing Coverage

/T/

— CTV Atlantic: Red Tape: Family Fights for Lost Boy
— CTV Vancouver: Fentanyl Epidemic
— Global Edmonton: Fort McMurray Wildfire

/T/

Sam Ross Award – Editorial / Commentary

/T/

— CTV Atlantic: Freedom’s Not Just another Word: Reflections on the

Sacrifice of Those Who Served
— Global Edmonton: Life School: Bob Layton Editorial
— Global Toronto: God Has Left Twitter

/T/

Sports Feature Reporting Award (Small/Medium Market)

/T/

— CHEK: Liam Runs
— CTV Atlantic: Maritime Referees: A Closer Look at the Men in Stripes
— CTV Kitchener: On the Roster: Blind Curlers

/T/

Sports Feature Reporting Award (Large Market)

/T/

— CTV News Ottawa: Joe Sandulo in the Battle of His Life
— CTV Vancouver: Life on the Line: The Nolan Bellerose Story
— CTV Winnipeg: Picture Perfect

/T/

Trina McQueen Award – Television News Information Program

/T/

— CTV Atlantic: We Remember: Of Service and Sacrifice
— Global News BC: In Conversation with the Prime Minister
— Global Regina: Focus Saskatchewan

/T/

ABOUT RTDNA

RTDNA Canada is the voice of electronic and digital journalists and news
managers in Canada. The members of RTDNA Canada recognize the responsibility of
broadcast and digital journalists to promote and to protect the freedom to
report independently about matters of public interest and to present a wide
range of expressions, opinions and ideas. The RTDNA Canada Journalistic Code of
Ethics, adopted by the Canadian Broadcast Standards Council, is used to measure
fairness and accuracy in our profession.

WEBSITE

http://www.rtdnacanada.com/general-information-2017-national-conference/

– END RELEASE – 01/05/2017

For further information:
Ian Koenigsfest
President
RTNDA Canada
[email protected]
OR
Joanna Rose
RTDNA Canada
[email protected]

COMPANY:
FOR: RADIO TELEVISION NEWS DIRECTORS ASSOCIATION

INDUSTRY: Professional Services – Associations
RELEASE ID: 20170501CC0031

Press Release from Marketwired 1-866-736-3779

All press releases are written by the client and have NO affiliation with the news copy written by The Canadian Press. Any questions that arise due to the content or information provided in the press release should be directed to the company/organization
issuing the release, not to The Canadian Press.

GET ENERGYNOW’S DAILY EMAIL FOR FREE


Acquisition of Canadian Equipment Rentals Corp. Common Shares by Dean Swanberg Through D.S.S. Holdings Inc.

FOR: MR. DEAN SWANBERG
Date issue: May 01, 2017Time in: 8:00 AM eAttention:
CALGARY, ALBERTA–(Marketwired – May 1, 2017) –
NOT FOR DISSEMINATION IN THE UNITED STATES. ANY FAILURE TO COMPLY WITH THIS
RESTRICTION MAY CONSTITUTE A VIOLATION OF U.S. SECU…

GET ENERGYNOW’S DAILY EMAIL FOR FREE


Mooncor Corporate Update

FOR: MOONCOR OIL & GAS CORP.
TSX VENTURE SYMBOL: MOO

Date issue: May 01, 2017
Time in: 8:00 AM e

Attention:

TORONTO, ONTARIO–(Marketwired – May 1, 2017) – Mooncor Oil & Gas Corp. (the
“Corporation”) (TSX VENTURE:MOO) is pleased to announce that it has released
its financial results for the year ended December 31, 2016. The financial
statements, notes to the financial statements and Management’s Discussion and
Analysis for the year ended December 31, 2016 are available on SEDAR at
www.sedar.com.

“The Corporation is pleased to report that the total production for the Month
of April is 1,039 Barrels of Oil. The corporation will continue to work on the
Company’s two Lloydminster wells as both wells require further work, 04-28 well
requires a Flush – by as soon as the weather cooperates and the 03-28 well
requires a bottom hole pump changed or upgraded to handle all the Sand,” stated
Allen Lone, CEO of Mooncor Oil & Gas Corp

About Mooncor Oil & Gas Corp.

Mooncor is a junior oil and gas exploration company. Mooncor holds interests in
lands in the Pondera and Teton Counties in Northwestern Montana, the Muskwa /
Duvernay liquids rich shale gas area in Hamburg, Alberta, and in southwest
Ontario where the focus has been on conventional oil and gas opportunities.

Neither TSX Venture Exchange nor its Regulation Services Provider (as that term
is defined in the policies of the TSX Venture Exchange) accepts responsibility
for the adequacy or accuracy of this release.

The information in this news release includes certain information and
statements about management’s view of future events, expectations, plans and
prospects that constitute forward looking statements, including Mooncor
conducting extended production tests on two suspended wells by September 31,
2015, or at all. These statements are based upon assumptions that are subject
to significant risks and uncertainties. Because of these risks and
uncertainties and as a result of a variety of factors, the actual results,
expectations, achievements or performance may differ materially from those
anticipated and indicated by these forward looking statements. Although Mooncor
believes that the expectations reflected in forward looking statements are
reasonable, it can give no assurances that the expectations of any forward
looking statements will prove to be correct. Except as required by law, Mooncor
disclaims any intention and assumes no obligation to update or revise any
forward looking statements to reflect actual results, whether as a result of
new information, future events, changes in assumptions, changes in factors
affecting such forward looking statements or otherwise.

– END RELEASE – 01/05/2017

For further information:
Mooncor Oil & Gas Corp.
Allen Lone
Chief Executive Officer
905.275.7570
[email protected]

COMPANY:
FOR: MOONCOR OIL & GAS CORP.
TSX VENTURE SYMBOL: MOO

INDUSTRY: Energy and Utilities – Oil and Gas
RELEASE ID: 20170501CC0039

Press Release from Marketwired 1-866-736-3779

All press releases are written by the client and have NO affiliation with the news copy written by The Canadian Press. Any questions that arise due to the content or information provided in the press release should be directed to the company/organization
issuing the release, not to The Canadian Press.

GET ENERGYNOW’S DAILY EMAIL FOR FREE


Manitok Energy Inc. and Craft Oil Ltd. Enter Into Arrangement Agreement

FOR: MANITOK ENERGY INC.
TSX VENTURE SYMBOL: MEI

AND CRAFT OIL LTD.

Date issue: May 01, 2017
Time in: 7:30 AM e

Attention:

CALGARY, ALBERTA–(Marketwired – May 1, 2017) –

THIS PRESS RELEASE IS NOT FOR PUBLICATION OR DISSEMINATION IN THE UNITED
STATES. FAILURE TO COMPLY WITH THIS RESTRICTION MAY CONSTITUTE A VIOLATION OF
UNITED STATES SECURITIES LAW.

Manitok Energy Inc. (“Manitok”) (TSX VENTURE:MEI) and Craft Oil Ltd. (“Craft”)
are pleased to announce that Manitok and Craft have entered into an arrangement
agreement dated as of April 28, 2017 (the “Arrangement Agreement”). Under the
terms of the Arrangement Agreement, Manitok will acquire all of the issued and
outstanding common shares of Craft (“Craft Shares”) by way of a plan of
arrangement under the Business Corporations Act (Alberta) (the “Arrangement”)
for $6.6 million of common shares of Manitok (“Manitok Shares”) at the Manitok
Share Price (defined below). Craft’s assets include approximately $3.5 million
of net working capital (includes about $3.0 million of cash), 430 boe/d (about
30% oil and liquids) of production and approximately 62,000 acres of gross
total land (48,000 net) and 31,000 acres of gross undeveloped land (26,490 net)
in the Peace River Arch area of Alberta. Based on the reserves report prepared
by McDaniel & Associate Consultants effective December 31, 2016, total proved
reserves of Craft are about 1.3 million boe (about 30% oil and liquids), after
giving effect to certain dispositions of assets completed by Craft in 2017.
Craft has no debt. Craft’s assets are complimentary to Manitok’s existing
assets in the Peace River Arch area of Alberta. When combined following the
completion of the Arrangement, Manitok’s total production in the Peace River
Arch area will be approximately 675 boe/d. Craft also has approximately $33
million in total tax pools, including approximately $17 million in non-capital
losses.

Pursuant to the Arrangement, each Craft shareholder will receive, for each
Craft Share, such number of Manitok Shares that is obtained by dividing $6.6
million by the Manitok Share Price (as defined below) and dividing that number
by the total issued and outstanding Craft Shares and the number of Craft Shares
that would be issued on the cashless exercise of all “in-the-money” options and
performance warrants of Craft. The “Manitok Share Price” will be such price as
is as mutually agreed between the parties prior to 5 trading days preceding the
date that is 5 calendar days preceding the meeting of Craft shareholders to be
convened to approve the Arrangement (the “Craft Meeting Date”), or in the event
that the parties cannot come to a mutual agreement, the volume weighted average
trading price of Manitok Shares on the TSX Venture Exchange (“TSX-V”),
calculated by using 5 trading days preceding the date that is 5 calendar days
preceding the Craft Meeting Date.

The Arrangement Agreement contains customary representations and warranties of
each party, and non-solicitation and interim operations covenants. The
Arrangement is subject to customary conditions for a transaction of this
nature, which include court and regulatory approvals (including the approval of
the TSX-V) and the approval of 66 2/3% of the votes cast by Craft shareholders
represented in person or by proxy at a meeting of Craft shareholders to be
called to consider the Arrangement. As part of the Arrangement, certain
officers, directors and shareholders of Craft have entered into a share lock-up
agreement for a total of approximately 14% of the total common shares
outstanding for Craft. Both parties of the Arrangement have agreed to a mutual
break fee of $250,000 subject to certain conditions. A special meeting of the
shareholders of Craft to approve the Arrangement is anticipated to be held on
or about June 5, 2017.

The Board of Directors of Craft has unanimously agreed to recommend the
approval of the Arrangement.

A copy of the Arrangement Agreement will be available under each of Manitok’s
and Craft’s SEDAR profile at www.sedar.com.

About Craft

Craft is engaged in the exploration for, development of and production of oil
and natural gas properties in Western Canada and is a reporting issuer in all
provinces and territories of Canada. Craft common shares are not listed on any
recognized exchange in Canada. Craft was incorporated under the Business
Corporations Act (Alberta) and has its head office in Calgary, Alberta.

About Manitok

Manitok is a public oil and gas exploration and development company focused on
Lithic Glauconitic light oil in southeast Alberta and Cardium light oil in west
central Alberta. The Corporation utilizes its expertise, combined with the
latest recovery techniques, to develop the remaining oil and liquids-rich
natural gas pools in its core areas of the Western Canadian Sedimentary Basin.

Caution Respecting BOE

The term barrels of oil equivalent (“BOE”) may be misleading, particularly if
used in isolation. A BOE conversion ratio of 6 Mcf:1 Bbl and an Mcfe conversion
ratio of 1 Bbl:6 Mcf are based on an approximate energy equivalency conversion
method primarily applicable at the burner tip and does not represent a value
equivalency at the wellhead. Since the value ratio based on the current price
of crude oil compared to natural gas is significantly different from the energy
equivalency conversion ratio of 6:1, utilizing a conversion based on a 6:1
ratio is misleading as an indication of value.

Forward-looking Information Cautionary Statement

This press release contains forward-looking statements. More particularly, this
press release contains statements concerning the terms of the Arrangement, the
timing and completion of the Arrangement, the timing of the special meeting of
Craft shareholders and anticipated benefits of the Arrangement to Manitok.

The forward-looking statements in this press release are based on certain key
expectations and assumptions made by Manitok and Craft, including expectations
and assumptions concerning the prevailing market conditions, the intentions of
their lenders, commodity prices, and the availability of capital.

Although Manitok and Craft believe that the expectations and assumptions on
which the forward-looking statements are based are reasonable, undue reliance
should not be placed on the forward-looking statements because Manitok and
Craft can give no assurance that they will prove to be correct. Since
forward-looking statements address future events and conditions, by their very
nature they involve inherent risks and uncertainties. Actual results could
differ materially from those currently anticipated due to a number of factors
and risks. These include, but are not limited to, risks associated with adverse
market conditions, the inability of Manitok or Craft to complete the
Arrangement at all or on the terms announced, not obtaining the required court,
shareholder and regulatory approvals, a lender not approving the amendment to a
credit facility and the risks associated with the oil and gas industry in
general (e.g., operational risks in development, exploration and production;
delays or changes in plans with respect to exploration or development projects
or capital expenditures; the uncertainty of reserves estimates; the uncertainty
of estimates and projections relating to production, costs and expenses; and
health, safety and environmental risks), uncertainty as to the availability of
labour and services, commodity price and exchange rate fluctuations, unexpected
adverse weather conditions, general business, economic, competitive, political
and social uncertainties, capital market conditions and market prices for
securities and changes to existing laws and regulations. More information about
certain of these risks are set out in the documents filed from time to time
with the Canadian securities regulatory authorities, available on Manitok’s and
Craft’s SEDAR profiles at www.sedar.com.

Forward-looking statements are based on estimates and opinions of management of
Manitok and Craft at the time the statements are presented. Manitok and Craft
may, as considered necessary in the circumstances, update or revise such
forward-looking statements, whether as a result of new information, future
events or otherwise, but Manitok and Craft undertake no obligation to update or
revise any forward-looking statements, except as required by applicable
securities laws.

The estimates of reserves and future net revenue for individual properties may
not reflect the same confidence level as estimates of reserves and future net
revenue for all properties, due to the effects of aggregation.

Neither the TSX Venture Exchange nor its Regulation Services Provider (as that
term is defined in the policies of the TSX Venture Exchange) accepts
responsibility for the adequacy or accuracy of this release.

– END RELEASE – 01/05/2017

For further information:
Manitok Energy Inc.
Massimo M. Geremia
President & Chief Executive Officer
403-984-1751
[email protected]
www.manitokenergy.com
OR
Craft Oil Ltd.
Trevor Spagrud
President & Chief Executive Officer
403-264-1592
www.craftoil.ca

COMPANY:
FOR: MANITOK ENERGY INC.
TSX VENTURE SYMBOL: MEI

AND CRAFT OIL LTD.

INDUSTRY: Energy and Utilities – Oil and Gas
RELEASE ID: 20170501CC0027

Press Release from Marketwired 1-866-736-3779

All press releases are written by the client and have NO affiliation with the news copy written by The Canadian Press. Any questions that arise due to the content or information provided in the press release should be directed to the company/organization
issuing the release, not to The Canadian Press.

GET ENERGYNOW’S DAILY EMAIL FOR FREE


Enercare Schedules First Quarter 2017 Conference Call for Friday, May 12, 2017

FOR: ENERCARE INC.TSX Symbol: ECIDate issue: May 01, 2017Time in: 7:11 AM eAttention:
TORONTO, ON –(Marketwired – May 01, 2017) – Enercare Inc. (“Enercare”) (TSX:
ECI) will release its financial results for the first quarter ended March 31,
2017, on…

GET ENERGYNOW’S DAILY EMAIL FOR FREE


Bonterra Energy Corp. Confirms Cash Dividend for April 2017 Payable May 31, 2017

FOR: BONTERRA ENERGY CORP.TSX SYMBOL: BNEDate issue: May 01, 2017Time in: 7:00 AM eAttention:
CALGARY, ALBERTA–(Marketwired – May 1, 2017) – Bonterra Energy Corp.
(www.bonterraenergy.com) (TSX:BNE) announces that the April 2017 monthly cash
dividend …

GET ENERGYNOW’S DAILY EMAIL FOR FREE


Suncor Energy confirms restart of pipeline shipments from Syncrude Mildred Lake Oil Sands facility

FOR: SUNCOR ENERGY INC.TSX SYMBOL: SUNYSE SYMBOL: SUDate issue: May 01, 2017Time in: 6:30 AM eAttention:
CALGARY, ALBERTA–(Marketwired – May 1, 2017) – Suncor today announced that
shipments from the Syncrude Mildred Lake Oil Sands facility have resum…

GET ENERGYNOW’S DAILY EMAIL FOR FREE