


 CDN NEWS |
  US NEWS


During the three months ended March 31, 2017, on a geographic basis, Canada experienced a decrease in total software license sales, which was partially offset by increases in the Eastern Hemisphere and South America, as compared to the same period of the previous fiscal year.
During the year ended March 31, 2017, on a geographic basis, total software license sales decreased in all geographic segments, with the exception of South America, as compared to the previous fiscal year.
The Canadian market (representing 27% of total annual software license revenue) experienced a 15% and 18% decrease in annuity/maintenance license revenue during the three months and year ended March 31, 2017, respectively, compared to the same periods of the previous fiscal year, due to a reduction in licensing by some customers. No perpetual sales were realized in Canada during the three months ended March 31, 2017. Fewer perpetual sales were realized during the year ended March 31, 2017, compared to the previous fiscal year.
The United States market (representing 24% of total annual software license revenue) experienced a 2% and 5% decrease in annuity/maintenance license revenue during the three months and year ended March 31, 2017, respectively, compared to the same periods of the previous fiscal year, due to decreased spending by existing customers. Perpetual license revenue for the three months ended March 31, 2017 was comparable to the same period of the previous fiscal year. Perpetual license revenue decreased by 83% during the year ended March 31, 2017, compared to the previous fiscal year, as a result of a significant perpetual sale in the first quarter of the previous fiscal year.
South America (representing 17% of total annual software license revenue) experienced a decrease of 9% in annuity/maintenance license revenue during the three months ended March 31, 2017, compared to the same period of the previous fiscal year, due to decreased spending by some customers. Annuity/maintenance license revenue for the year ended March 31, 2017 increased by 62%, compared to the previous fiscal year. Our revenue in South America can be significantly impacted by the variability of the amounts recorded from a customer for whom revenue is recognized only when cash is received (see the discussion about revenue earned in the current quarter that pertains to usage of products in prior quarters on the next page, above the "Quarterly Software License Revenue" graph). The most recent payments from this customer were recognized during the quarter ended December 31, 2016. No payments were received from this customer during the year ended March 31, 2016. To provide a normalized comparison, if we remove the revenue from this particular customer from the year ended March 31, 2017, we note that the annuity/maintenance license revenue decreased by 14% instead of increasing by 62%.
More perpetual sales were realized in South America during the three months ended March 31, 2017, compared to the same period of the previous fiscal year, resulting in a 187% increase. On a year-to-date basis, perpetual license revenue was comparable to the previous fiscal year.
The Eastern Hemisphere (representing 32% of total annual software license revenue) experienced a 24% and 8% decrease in annuity/maintenance license revenue during the three months and year ended March 31, 2017, respectively, compared to the same periods of the previous fiscal year. While some of the decrease in both periods is due to reduced licensing by some customers, a portion of the quarter-over-quarter decrease is also due to the timing of finalizing certain contracts that come up for renewal in the fourth quarter of each fiscal year. Since some of those contracts were still under negotiation as at March 31, 2017, no revenue was recognized on them in the three months ended March 31, 2017.
The Eastern Hemisphere experienced a 464% increase in perpetual license revenue during the three months ended March 31, 2017, compared to the same period of the previous fiscal year, as a result of several large perpetual sales realized in Asia and the Middle East. During the year ended March 31, 2017, the Eastern Hemisphere realized fewer perpetual sales, leading to an 11% decrease in perpetual license revenue compared to the previous fiscal year.
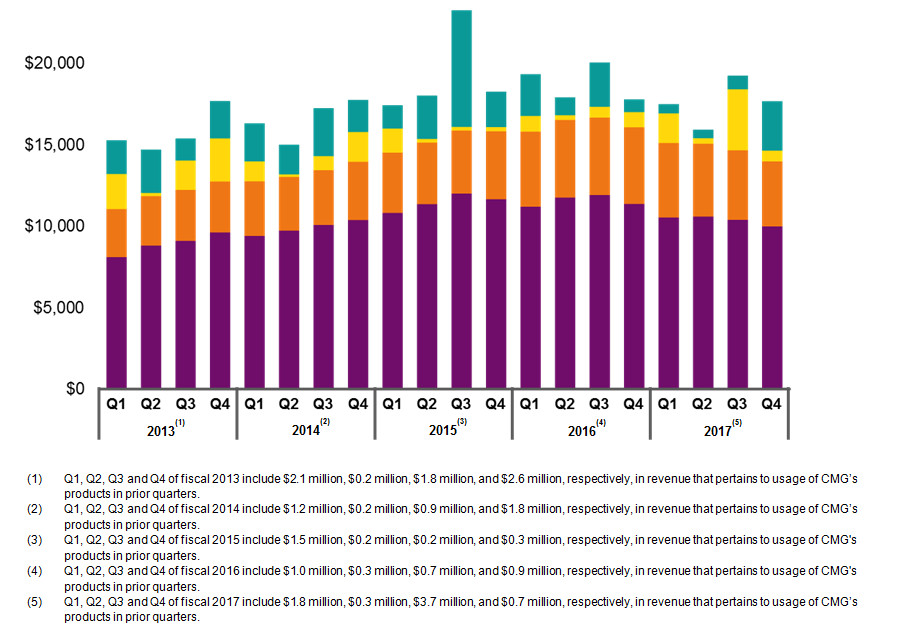
As footnoted in the Quarterly Performance table, in the normal course of business CMG may complete the negotiation of certain annuity/maintenance contracts and/or fulfill revenue recognition requirements within a current quarter that includes usage of CMG's products in prior quarters. This situation particularly affects contracts negotiated with countries that face increased economic and political risks leading to the revenue recognition criteria being satisfied only at the time of the receipt of cash. The dollar magnitude of such contracts may be significant to the quarterly comparatives of our annuity/maintenance license revenue stream and, to provide a normalized comparison, we specifically identify the revenue component where revenue recognition is satisfied in the current period for products provided in previous quarters.
To view the Quarterly Software License Revenue ($thousands) chart, please visit the following link: http://media3.marketwire.com/docs/1095079_graph.jpg
Deferred Revenue
/T/
Fiscal Fiscal 2017 2016 $ change % change ($ thousands) ---------------------------------------------------------------------------- ---------------------------------------------------------------------------- Deferred revenue at: Q1 (June 30) 26,154 27,006 (852) -3% Q2 (September 30) 20,787 22,608 (1,821) -8% Q3 (December 31) 18,916 17,243 1,673 10% Q4 (March 31) 38,232 (1) 33,629 4,603 14% ---------------------------------------------------------------------------- ---------------------------------------------------------------------------- (1) Includes current deferred revenue of $36.3 million and long-term deferred revenue of $1.9 million./T/
CMG's deferred revenue consists primarily of amounts for pre-sold licenses. Our annuity/maintenance revenue is deferred and recognized on a straight-line basis or according to usage over the life of the related license period, which is generally one year or less. Amounts are deferred for licenses that have been provided and revenue recognition reflects the passage of time.
The above table illustrates the normal trend in the deferred revenue balance from the beginning of the calendar year (which corresponds with Q4 of our fiscal year), when most renewals occur, to the end of the calendar year (which corresponds with Q3 of our fiscal year). Our fourth quarter corresponds with the beginning of the fiscal year for most oil and gas companies, representing a time when they enter a new budget year and sign/renew their contracts.
Deferred revenue as at Q4 of fiscal 2017 increased by 14% compared to Q4 of fiscal 2016. The deferred revenue balance at March 31, 2017 includes a number of contracts that were not included in the deferred revenue balance in the comparative quarter, because the contracts were finalized and invoiced prior to March 31, 2017, whereas in the previous fiscal year the contracts were finalized and invoiced subsequent to March 31, 2016.
Professional Services Revenue
CMG recorded professional services revenue of $1.4 million for the three months ended March 31, 2017, which represented an increase of $0.2 million compared to the same period of the previous fiscal year. The increase was due to the new CoFlow development agreement with Shell, which entitles CMG to higher contract research revenue compared the old joint venture agreement. The increase in contract research revenue was offset by lower consulting revenue due to a decline in project activity by our customers.
Professional services revenue for the year ended March 31, 2017 was $4.9 million, which represented a decrease of $1.0 million compared to the same periods of the previous fiscal year, primarily due to a decline in project activity by our customers, partially offset by higher contract research revenue.
Professional services revenue consists of specialized consulting, training, and contract research activities. CMG performs consulting and contract research activities on an ongoing basis, but such activities are not considered to be a core part of our business and are primarily undertaken to increase our knowledge base and hence expand the technological abilities of our simulators in a funded manner, combined with servicing our customers' needs. In addition, these activities are undertaken to market the capabilities of our suite of software products with the ultimate objective to increase software license sales. Our experience is that consulting activities are variable in nature as both the timing and dollar magnitude of work are dependent on activities and budgets within customer companies.
Expenses
/T/
Three months ended March 31, 2017 2016 $ change % change ($ thousands) ---------------------------------------------------------------------------- ----------------------------------------------------------------------------Sales, marketing and professional services 5,259 6,071 (812) -13% Research and development 4,587 4,208 379 9% General and administrative 1,582 1,697 (115) -7% ---------------------------------------------------------------------------- Total operating expenses 11,428 11,976 (548) -5% ---------------------------------------------------------------------------- ----------------------------------------------------------------------------
Direct employee costs(1) 9,096 9,634 (538) -6% Other corporate costs 2,332 2,342 (10) 0% ---------------------------------------------------------------------------- 11,428 11,976 (548) -5% ---------------------------------------------------------------------------- ----------------------------------------------------------------------------
Year ended March 31, 2017 2016 $ change % change ($ thousands) ---------------------------------------------------------------------------- ----------------------------------------------------------------------------
Sales, marketing and professional services 19,353 21,450 (2,097) -10% Research and development 16,423 16,865 (442) -3% General and administrative 6,000 6,447 (447) -7% ---------------------------------------------------------------------------- Total operating expenses 41,776 44,762 (2,986) -7% ---------------------------------------------------------------------------- ----------------------------------------------------------------------------
Direct employee costs(1) 33,214 36,026 (2,812) -8% Other corporate costs 8,562 8,736 (174) -2% ---------------------------------------------------------------------------- 41,776 44,762 (2,986) -7% ---------------------------------------------------------------------------- ---------------------------------------------------------------------------- (1) Includes salaries, bonuses, stock-based compensation, benefits, commissions, and professional development. See "Non-IFRS Financial Measures".
/T/
CMG's total operating expenses decreased by 5% and 7% for the three months and year ended March 31, 2017, compared to the same periods of the previous fiscal year, mainly due to a decrease in direct employee costs.
Direct Employee Costs
As a technology company, CMG's largest area of expenditure is its people. Approximately 80% of the total operating expenses for the year ended March 31, 2017 related to direct employee costs, consistent with the same period of the previous fiscal year. Staffing levels in the current fiscal year were lower compared to the previous fiscal year. At March 31, 2017, CMG's full-time equivalent staff complement was 199 employees and consultants, down from 212 full-time equivalent employees and consultants at March 31, 2016, mainly due to the closure of the Venezuelan office and the reduction of the CoFlow development team. Direct employee costs decreased during the three months and year ended March 31, 2017, compared to the same periods of the previous fiscal year, due to lower bonuses, lower stock-based compensation expense and the closure of the Venezuelan office in May of 2016.
Other Corporate Costs
Other corporate costs remained flat during the three months ended March 31, 2017 and decreased by 2% during the year ended March 31, 2017, compared to the same periods of the previous fiscal year, mainly due to less travel for business and training and lower depreciation, partially offset by increased operating costs of the Colombian branch.
Research and Development
/T/
Three months ended March 31, 2017 2016 $ change % change ($ thousands) ---------------------------------------------------------------------------- ----------------------------------------------------------------------------Research and development (gross) 4,891 4,623 268 6% SR&ED credits (304) (415) 111 -27% ---------------------------------------------------------------------------- Research and development 4,587 4,208 379 9% ---------------------------------------------------------------------------- ----------------------------------------------------------------------------
Research and development as a % of total revenue 24% 22% ---------------------------------------------------------------------------- ----------------------------------------------------------------------------
Year ended March 31, 2017 2016 $ change % change ($ thousands) ---------------------------------------------------------------------------- ----------------------------------------------------------------------------
Research and development (gross) 17,842 18,366 (524) -3% SR&ED credits (1,419) (1,501) 82 -5% ---------------------------------------------------------------------------- Research and development 16,423 16,865 (442) -3% ---------------------------------------------------------------------------- ----------------------------------------------------------------------------
Research and development as a % of total revenue 22% 21% ---------------------------------------------------------------------------- ----------------------------------------------------------------------------
/T/
CMG maintains a belief that its strategy of growing long-term value for shareholders can only be achieved through continued investment in research and development. CMG works closely with its customers to provide solutions to complex problems related to proven and new advanced recovery processes.
The above research and development costs include $1.9 million and $6.0 million of costs for CoFlow for the three months and year ended March 31, 2017, respectively, (2016 - $1.5 million and $5.9 million, respectively). See discussion under "Commitments, Off Balance Sheet Items and Transactions with Related Parties".
Research and development costs (gross) increased by 6% during the three months ended March 31, 2017, compared to the same period of the previous fiscal year, as a result of the new agreement with our CoFlow partner Shell, under which CMG is responsible for a larger share of CoFlow costs starting January 1, 2017.
Share This:


