


 CDN NEWS |
  US NEWS


In the last paper, titled “Introduction to Black Powder Contamination”, the formation of Black PowderTM (black powder) contamination was discussed along with a general discussion about its facility impacts. It was discussed that black powder contamination is a highly prevalent form of contamination that exists in various degrees in most, if not all, hydrocarbon applications. It can be wet or dry and is comprised of varying types of ferrous and non-ferrous elements and compounds. Black powder particulates vary in size; in most situations, there are particularly high concentrations below 10 microns. In practice, its presence is often noted and accepted without clear resolution; this is often due to its small size and the lack of awareness about economic methods to remove it. In many cases, it is improperly sampled and analyzed and often referred to based on casual visual descriptions (ie. “black dirt” or “black sludge”) rather than rigorous compositional and particulate size analysis.
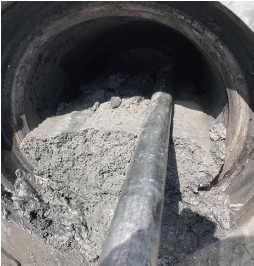
Figure 1: Black powder in a pipeline after pigging.
The topic of black powder composition was only generally reviewed in the “Introduction to Black Powder Contamination”. Its composition is variable; it depends on geographical location, subsurface formation elements and compounds, type of hydrocarbon, facility/ process type, introduced compounds/chemicals and other factors. The formation process, as it relates to composition, is reviewed below with real world examples.
Black powder generally refers to hydrocarbon contamination that includes both ferrous and non-ferrous particulate, however the relative proportions always differ. It is referred to as being “black” generally due to visual appearance, which is often black or dark gray in color; it can also be visibly brown or orange, or even lighter, approaching a beige color. The dark gray or black color is typically associated with iron sulfide compounds as well as magnetite. Other colors are associated with different compounds, such as iron oxides, which will lend a brown or orange color, or salt and sand, which will lend a lighter color to it.
This discussion focuses on black powder composition: its elemental and mineral makeup, particle sizes, and size distribution.
In summary, it is advocated that by properly capturing and analysing this contamination, its presence can be understood and addressed.

Figure 2: Black Powder from a condensate feedstock line.
Composition
While black powder is a pervasive and extensive type of contamination, many
operators and management teams are generally not familiar with it. The rationale for
understanding its detailed composition is manifold:
- to aid in developing an understanding about the formation mechanism(s) and how it can be eliminated before it develops (ie. root cause analysis);
- to determine where in a system the contamination is originating, and therefore how it can be addressed;
- to understand the potential impacts on equipment and facilities, and the level to which it needs to be addressed; and
- to aid in determining the most effective methods for black powder contamination removal once it has formed.
The iron sulfide component of black powder is associated with the presence of hydrogen sulfide (H2S) in a particular hydrocarbon system, although, it can be in minimal quantities as low as 1 ppm. The presence of H2S, in addition to water (H2O) and iron (Fe), will cause the formation of iron sulfide compounds. The H2O component can be in liquid or vapour form, such as humidity in a gas or liquid stream. For example in pipelines, a review of product specifications and tolerances allows for varying amounts of H2O in those pipelines in sediment and water specification (BS&W), and vapour content. The presence of Fe in hydrocarbon systems is expected due to the use of carbon steel in pipelines, above ground tankage, and various processing and handling facilities.
If H2S is not present in a system, iron sulfide will not be present in black powder. However, if oxygen (O2) is present, it will be a contributor to the formation of iron oxide compounds. Should iron sulfide (FeS) compounds be exposed to oxygen, particularly at high concentrations, FeS converts to iron oxide (FeO). This exothermic reaction releases sulfur, such as sulfur (S) and sulfur dioxide (SO2). The rapid exothermic conversion of FeS to FeO often happens when black powder is exposed to oxygen in the atmosphere, such as after pipeline pigging, causing smoldering (and fires). Carbon dioxide (CO2) is another contributing factor to FeS formation, such in scale formation in pipelines (passivating layers); CO2 is often found in the presence of H2S.
The non-ferrous compounds within black powder are numerous and variable. Elements such as manganese, copper, nickel, titanium, carbon, vanadium, magnesium, zinc, chromium, and others can exist in producing formations, be introduced by hydrocarbons and formation water, collect as a result of corrosion and abrasion of pipeline and facility materials, carryover from processes (ie. catalysts), and be introduced as broad spectrum chemicals and other processes. Chlorine, sodium, silica, phosphorous, silicon, and others are also often present.
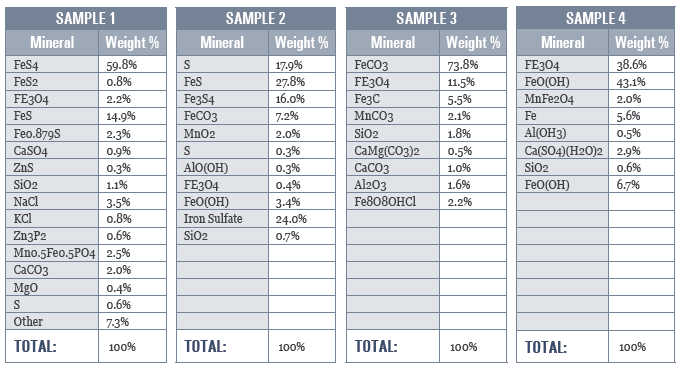
Figures 1-7 demonstrate 3rd party laboratory analysis reports of black powder collected from various hydrocarbon systems. In Figure 1, various black powder samples have been analyzed via x-ray diffraction (XRD) testing for compound and mineral composition.
Figure 3: Table of black powder constituents from various hyrdrocarbon systems.
In Figure 4, the black powder samples have been analyzed via energy dispersive spectroscopy (EDS) for purposes of determining elemental composition. Key contributing elements have been highlighted.
Figure 4: Elemental compositions of 2 black powder samples via EDS analysis.

As the data shows, Fe (including FeO and FeS compounds) is often a key component of black powder whether as a majority or minority compound. With each application, every sample is unique and requires proper analysis to understand compositional breakdown.
Particle Size & Distribution
Understanding particle size and the particle size distribution is critical in dealing with black powder contamination once it has formed, to address the following:
- the extent of contamination in a system and its potential to accumulate and impact operational activities;
- size of particulate and its potential to enter processes, sub-systems and final products;
- addressing the effectiveness and relative economics of various separation/filtration solutions; and
- ultimately determining the ‘right’ separation/filtration solution.
Black powder contamination can be distributed over a wide range of particles sizes, from above 500 microns to well below 1 micron. Often, samples show high particle concentrations below 10 microns in size, exceeding 50% of the total contamination. Further, up to 50% of black powder contamination can be at 5 microns or less; 30% of it can be at 1 micron or less. A couple of real-world examples will help to illustrate this.
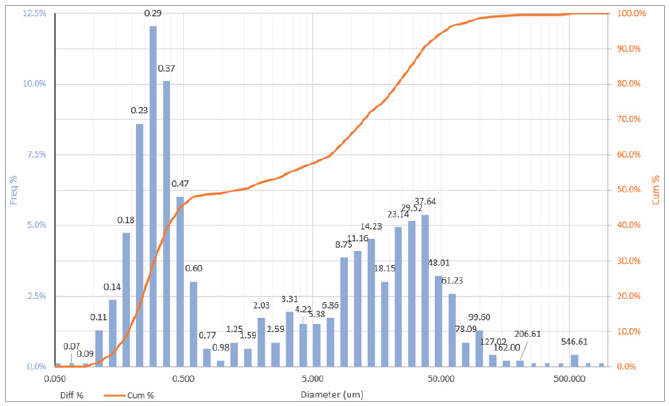
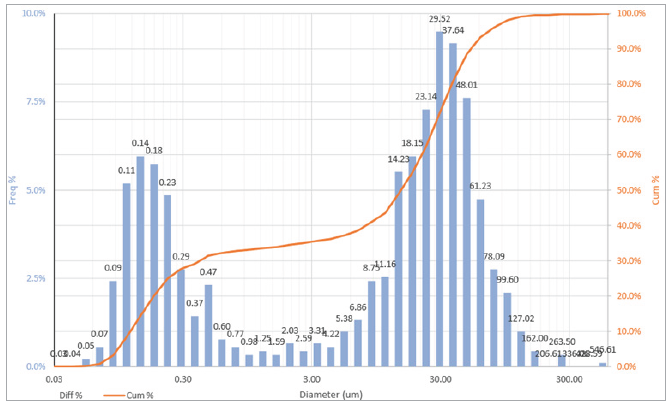
Figures 5 and 6 are typical particle size histograms from black powder contamination samples, both analyzed via SEM analysis (JEOL JSM 300LV). In Figure 5, the contamination sample was pulled from a pig trap at the terminus of an offshore natural gas pipeline. The P50 (median) and P75 values for the contamination size are 0.64 and 6.8 μm respectively, and the mean is 5.1 μm. In Figure 6, the P50 (median) and P75 values for the contamination size are 1.3 and 18.1 μm respectively, and the mean is 14.0 μm. 49% of the contamination was at or under 1 μm.
Figure 5: Particle size histogram of a black powder sample pulled from a natural gas pipeline pig trap via SEM analysis.
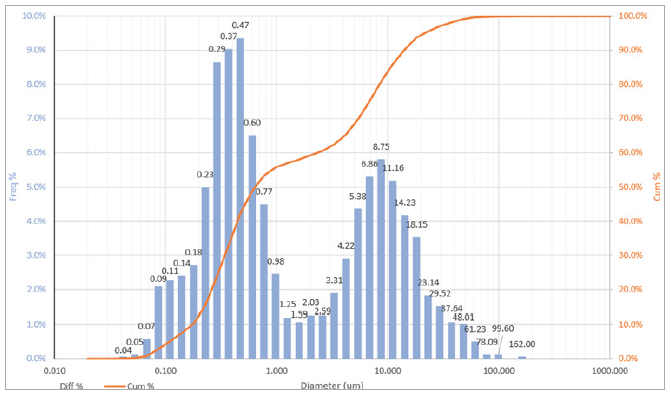
Figure 6: Particle size histogram of a black powder sample pulled from a natural gas pipeline pig trap via SEM analysis.
Additional examples further illustrate the contamination size range of black powder contamination in other applications. Figure 7, which is an amine sample pulled from a gas processing plant, had P50 (median) and P75 size values of 5.3 and 16.7 μm, respectively, with a mean of 12.8 μm. 30% of the contamination was under 1 μm. In Figure 8, which was pulled from a condensate sample, 33% of the contamination was under 1 μm in size; the P50 value was 14.9 μm and the mean was 22.0 μm.
Figure 7: Particle size histogram of a black powder sample pulled from a gas plant amine system via SEM analysis.

Figure 8: Particle size histogram of a black powder sample pulled from condensate via SEM analysis.
Others have reported similar numbers. Sherik1 reported 50% of contamination in a study of gas pipelines in Abu Dhabi that 50% of the black powder contamination was between 3 and 5 μm, while only 5% was in the 50 to 100 μm range. Mueller2 separately discusses wet and dry samples being analyzed in laboratory evaluations, with 81.6% of black powder samples being less than 1 μm. Pall Corp.3 also discusses particle size distributions for 2 Middle East natural gas pipelines with results largely in agreement with the numbers outlined above.
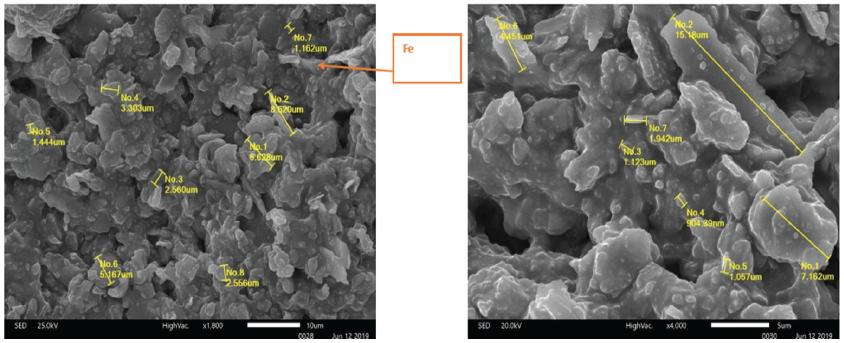
Figure 9: SEM microscopic images of black powder contamination samples.
The amount of public-domain literature discussing black powder contamination size and size distribution is minimal. Private reports are typically conducted by 3rd party laboratories on behalf of either operators or filtration companies; they are usually only available to the related parties. Understanding particle size and the particle size distribution allows operators to determine the extent of contamination in systems, and its’ potential operational impact.
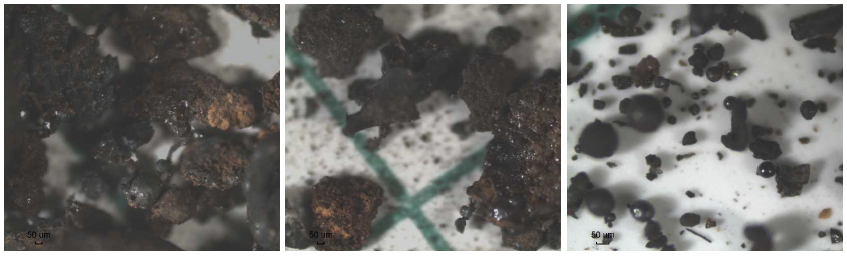
Figure 10: Microscopic images of a black powder sample pulled from a natural gas dispenser feedline via SEM.
Concluding Thoughts
Increased operator awareness about contamination is critical to extending equipment run times, minimizing equipment replacement, ensuring the longevity of critical systems, lowering operating costs, increasing facility and staff safety, lowering environmental impact, and ensuring higher quality products. It is advocated that operators:
- Increase their understanding of contamination, including particulate size and composition, by proper sampling and testing;
- Look further at the root cause of the contamination with the goal of eliminating it; and
- Challenge the status quo by considering all available options for removing the contamination once it is formed.

Figure 11: Y-strainer plugged off with black powder.
The human eye is only able to see particles down to 40 microns, so real time observation of its presence or impacts on equipment and processes cannot be directly observed. As such, it is imperative that operators focus their observations on both black powder accumulation and its impact on equipment and facilities. By effectively capturing this contamination and conducting the proper testing, operators will be able to understand it, then develop and formulate cost-effective solutions to deal with its presence.
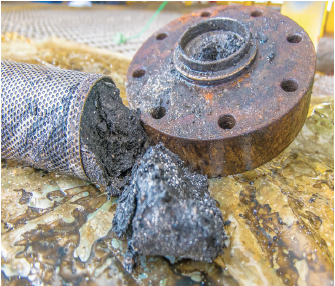
Figure 12: Conventional filter plugged off with black powder.
Figure 13: Disposed filter cartridge waste.
For more information, please visit: blackpowdersolutions.com or Click here to download the report
Sources
- “Managing Black Powder in Sales Gas Transmission Pipelines”, Saudi Aramco Journal of Technology,
Sherik & Lewis, 2008 - “Winning the War Against Black Powder”, Fred Mueller, unknown
- “Removal of Black Powder and Other Contaminants in LPG/LNG Furnace Feeds”, Pall Corporation,
Venkatadri & Brayden, 2015
Share This:


Canada’s Advantage as the World’s Demand for Plastic Continues to Grow