


 CDN NEWS |
  US NEWS








As Canada continues in its trade dispute with the United States, its dalliance with the European Union, and its efforts to boost investment, the reality remains that the fundamental issue is not market access but Canada’s long-term productivity malaise as measured by the decline in the growth rate of real per-person GDP. Despite being an open economy with low effective tariff rates and access to and integration with the largest and wealthiest market in the world, Canada’s productivity performance waned in recent decades.
Moreover, Canadian real per-person GDP declined relative to the U.S. in the 21st century. Against the U.S. is how we have always tended to measure ourselves. While Harold Adams Innis maintained that Canada and its institutions are fundamentally a product of Europe, our geography has meant sharing a continent with the U.S. with whom we have both cooperated and competed economically even in the days before Confederation.
The immediate aftermath of Confederation saw Canada mired in stagnation as the Great Depression of the 1870s affected the world. Afterwards, a program of economic nation-building via Prairie settlement and railroad building linked the manufacturers of the east with the resource producers of the west under the protection of the National Policy tariff wall. This saw an investment boom and rapidly growing real per-person GDP (as illustrated below). It’s noteworthy that from 1880 to the eve of the First World War, our real per-person GDP growth exceeded that of the U.S.
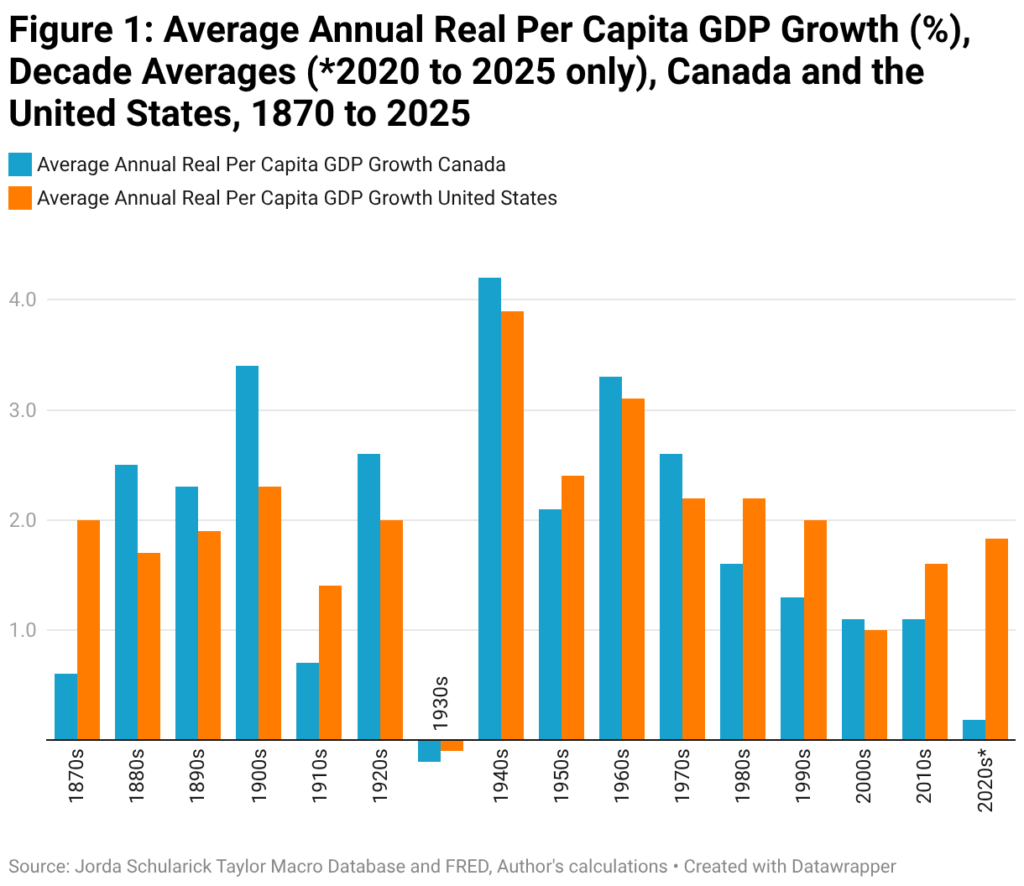
The First World War and the Great Depression were periods of poor real per-person GDP growth punctuated by the boom of the 1920s, which again saw Canadian growth rates surpass American. The Second World War saw average annual real per-person GDP growth top 4 per cent and this was followed by the high growth rates of the 1950s and 1960s. Those of the 1950s were muted only by the fact that this was an era of rapid population growth. However, since the 1960s, our average annual real per-person GDP growth has declined steadily with the 2020s the most dismal period since the Great Depression and our real per-person GDP growth eclipsed by the U.S.
While advanced economies saw a slowdown in productivity growth in the wake of the 1970s oil price shock, the Canadian decline is particularly noteworthy in comparison with the U.S. The era of Prairies settlement and the wheat boom saw Canadian real per-person GDP growth outperform the Americans. The 1960s and 1970s also saw Canadian growth outperform the U.S. While both countries saw a productivity decline after the 1960s, since 2000 the Americans appear to have reversed theirs. Despite our economy and export sector being increasingly linked to the American market first via the 1988 free trade agreement and then NAFTA and rising exports, we have generally not performed well when it comes to per-person income growth.
The reasons for weak Canadian productivity performance both current and historical are numerous and extensive. There’s relatively weaker investment in productivity enhancing capital investment, which has worsened during the age of information and communications technology. There’s the generally smaller Canadian market fractured by interprovincial trade barriers, which has restricted economies of scale. Then there’s the combination of large governments, cumbersome regulation, as well as oligopolies in transport, telecoms, agriculture, airlines, banking and energy, which have reduced competition, innovation and adoption of new technology. There’s the effect of high personal and business taxes, which has had incentive effects on investment, work effort and resource allocation.
Then during the post-2000 housing asset boom, the emphasis on residential investment rather than plant, machinery and equipment was augmented by the fact that the construction sector had some of the lowest labour productivity of all Canadian sectors. And of course, one can always blame reliance on our natural resource sector intensity, which when times are good dampens the incentive to innovate and when times are bad bemoans the lack of resources to innovate.



It’s not that Canada has stopped growing, it’s that Canada is growing at a much slower rate than its nearest and most important competitor (the U.S.). Canada seems to have settled into a comfortable low growth equilibrium despite all the supposed advantages being conferred over the last 50 years by increased access to and integration with the U.S. market and economy. Falling effective tariff rates in the wake of the Second World War and the General Agreement on Tariffs and Trade (GATT) and access to the large American market should have increased competitive pressures fostering both more innovation, investment and cost-reducing economies of scale. Indeed, one might have expected convergence of Canadian and American productivity levels. Yet paradoxically, Canada’s productivity slide relative to the U.S. coincides with the increasing integration of the two economies.
Figure 2 plots Canadian to U.S. real per capita GDP as a percent share from 1870 to 2025 and accompanies it with a weighted scatterplot smooth to illustrate longer term trend. It combines this with the effective Canadian tariff rate over the same time as well as denotes the three key events in the 20th century integration of the Canadian and U.S. economies: The Auto Pact (1965), the Free Trade Agreement (1988) and NAFTA (1994). Note that our effective tariff rate prior to World War II was seldom below ten percent but declined steadily afterwards.
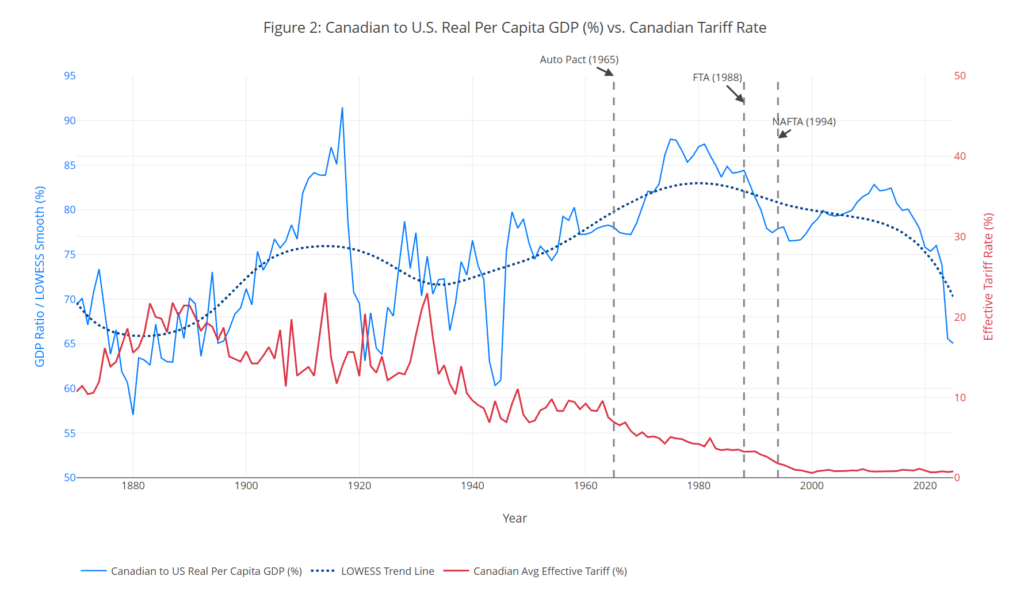
Canada’s real per-person GDP relative to the U.S. rose for the first century after Confederation. Canada’s real GDP closed the gap more rapidly from 1890 to the First World War and again from post-Second World War until the mid 1970s. However, somewhere between the signing of the Auto Pact and the first free trade agreement, Canada’s real GDP began to consistently grow more slowly than the U.S. From a height of nearly 90 per cent of U.S. real per-person GDP, it has now fallen to below 70 per cent.
There’s a rather large economic literature as to why increased integration and trade with a larger economy might paradoxically lead to divergence of per-person income and growth rates rather than convergence. Alwyn Young argued that under a free trade agreement between a large developed country with a higher stock of knowledge and a smaller less developed country, the less developed country would receive conventional gains from trade but the long-term dynamic implications were that the less developed country could experience falling technological progress and GDP growth compared to autarky. Of course, one might argue that Canada by mid-20th century was a highly developed economy, but then one might not guess that from the state of its national highway system compared to the U.S.
Devereux and Lapham maintained that in a world with two economies, under trade liberalization, the country with the higher stock of knowledge could increase its share of human capital in research and development while the other will systematically reduce its share with the end result being concentration of research and development (R&D) in the country with the initial advantage. While Canada has been able to innovate and conduct R&D, it has always borrowed technology and innovation from the U.S. and elsewhere, and under trade liberalization this practice may have worsened.
Of course, there are always counterpoints and Trefler finds that in the wake of the first free trade agreement, the Canadian industries that saw the largest tariff decreases did see industry-level labour productivity rise at comparable levels to those American industries receiving the largest tariff reductions. This of course raises the question as to why if productivity in affected Canadian industries did go up, it did not ultimately translate into higher rates of real per-person GDP growth. Where did the productivity gains go if not ultimately to raise our living standards?
The point of all this is as follows. Whether we renew a trade agreement with the U.S. and Mexico or craft a new one with the EU or China or India or CANZUK or anyone else, Canada’s productivity performance must be addressed. If the last 50 years have taught us anything, it’s that a free trade agreement and continuing to simply export as we always have is not enough to ensure our future standard of living.
Without resolving our interprovincial trade barriers, boosting our research, development and innovation and translating it into outcomes, making our tax system more competitive and less stifling of work and investment effort, and addressing the cozy oligopolistic nature of our markets, all the market access and trade in the world will apparently not reverse our productivity decline. Neither will simply boosting our infrastructure investment to move more exports to the world market. By not addressing the fundamental structural and institutional problems facing Canada’s economy that hamper reaping the benefits of markets and trade, we will continue to be the economic frog in a slow boiling global pot of water.
Share This:






















REALITY: Tariffs, Trade, Integration and Productivity—the Canadian Conundrum