


 CDN NEWS |
  US NEWS


Each week, XI Technologies scans its unique combination of enhanced industry data to provide trends and insights that have value for professionals doing business in the WCSB. If you’d like Wednesday Word to the Wise delivered directly to your inbox, subscribe here.
Like the Montney play XI covered in March, the Duvernay has seen its share of A&D activity as new players look for opportunities in this unconventional play. Today, we’ll draw on XI Technologies’ enriched industry data to offer a few perspectives as to what’s happening in the in the Duvernay play.
Ownership in Duvernay Assets
For this article, we’ll focus specifically on the North Duvernay centered around Fox Creek/Kaybob South.

Figure 1 – Heat map of North Duvernay showing production BOE/d.
Pulling a quick search of the Duvernay zone within the defined geographic area around Fox Creek/Kaybob South, we can quickly see that Chevron Canada Limited (Chevron) is the largest player. The ownership structure of this area is quite different from that of the southern area of the Duvernay play which is centered more around Red Deer/Lacombe. The top players in the Fox Creek are Chevron, Shell Canada Limited (Shell) (these assets are now owned by Crescent Point Energy) and ExxonMobil Canada Ltd (Exxon) versus Vesta Energy Ltd (Vesta), Artis Exploration Ltd (Artis) and Baytex Energy Corp (Baytex), so we can see that the large, multinational E&P companies have really dominated the Fox Creek Duvernay play.
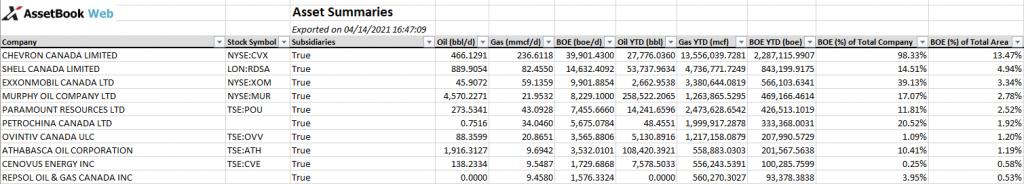
Click here for a spreadsheet of this data.
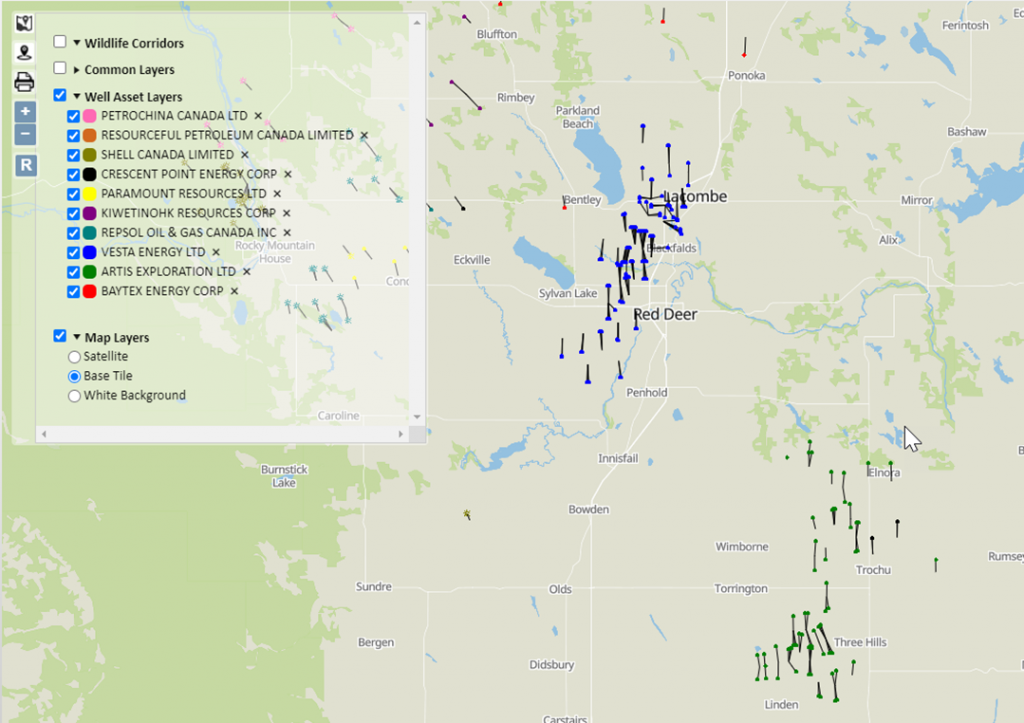
The map below shows wells owned/operated by the top 10 Duvernay players (based on current BOE/D) in the Fox Creek area.

For contrast, the map below describes the area south east. If you are interested in learning more about the ownership in this area, please contact XI for further details.
Production History of Duvernay Assets
Let’s investigate the North Duvernay play a little further. Looking at the vintage of this production, it’s confirmed that most activity in the Duvernay is relatively recent, with a good percentage of the production coming from 2018 or later. Look forward to a more in-depth look at North Duvernay drilling statistics later this month.
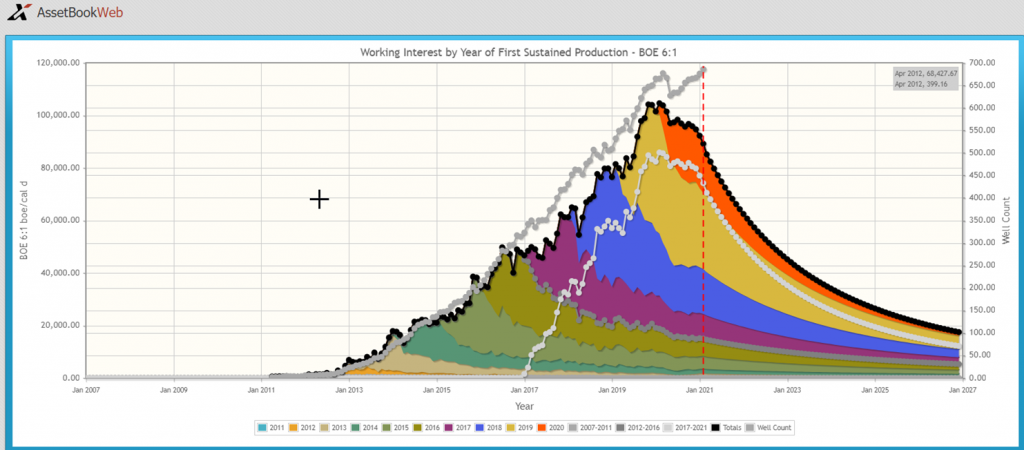
Looking at normalized yearly average production gives a sense of the change in the productivity of the play over the years.

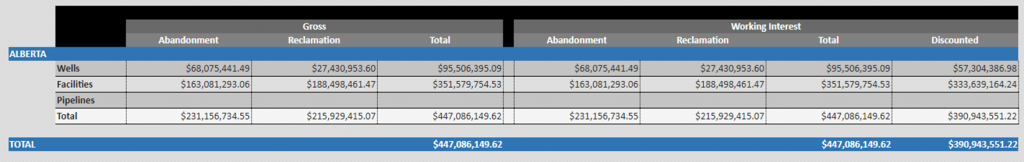
If companies are looking to acquire Duvernay assets, it is also important to look at liabilities among various acquisition opportunities to determine differences in future obligations. While the table below shows liabilities for the whole area, it is very simple to create a similar report for any company of interest.
If you would like to learn how you can re-create these workflows for any area in the WCSB, we invite you to attend an upcoming webinar: Analyzing the Duvernay on April 29.
If you’d like to learn more about how XI’s AssetSuite software can analyze regions throughout Western Canada, contact XI Technologies.
Share This:


PERSPECTIVE: Why Youth Awareness and Education About Energy Are So Important to Canada