


 CDN NEWS |
  US NEWS


Canadian producers are continuing to reduce venting and flaring volumes
By Yogi Schulz
Many environmentalists like to vilify oil and natural gas producers for supposedly doing little or nothing to address climate change. It must be more fun to vilify supposed planet-destroying mega-corporations than to highlight the unhelpful actions of billions of oil and gas consumers. Here’s a more balanced perspective.
The Alberta energy industry can be proud of the reduction in venting and flaring volumes that have been achieved over many years as illustrated by the chart below that is copied from the AER ST60B report for 2019. Conservation of solution natural gas reached an all-time high of 97.4% in 2018 while venting and flaring volumes reached an all-time low even though production volumes increased.
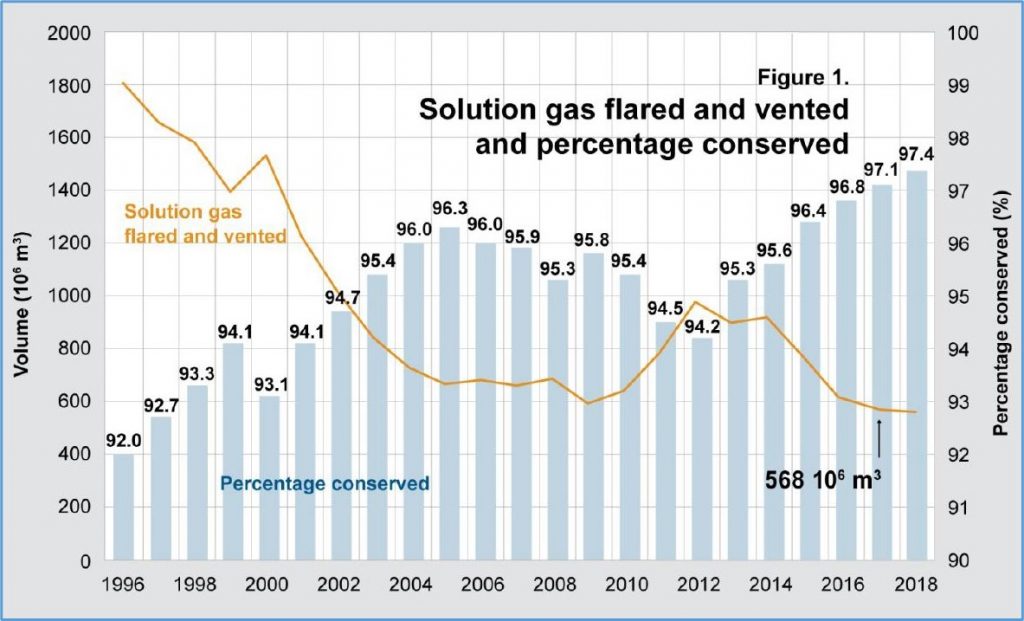
Unfortunately, similar data for other Canadian oil and natural gas producing regions are not available even though these regions all have regulations designed to reduce venting and flaring volumes.
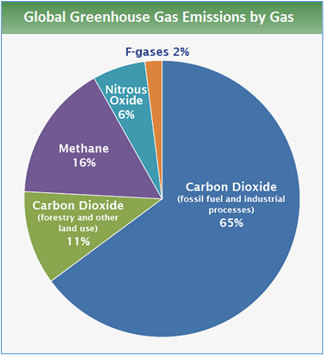
Conserving solution gas largely eliminates atmospheric pollution from oil and natural gas production operations. Failing to conserve solution gas means the volumes will be vented or flared. Venting volumes consist largely of methane and flaring volumes consist mostly of CO2. Methane and CO2 are the two gases that are the largest components of atmospheric greenhouse gases (GHG) as illustrated on this chart.
To compare Canada’s flaring performance to other countries, please read this article Canada’s flaring emissions down by 38% published by the Canadian Energy Centre.
Who generates GHG emissions?
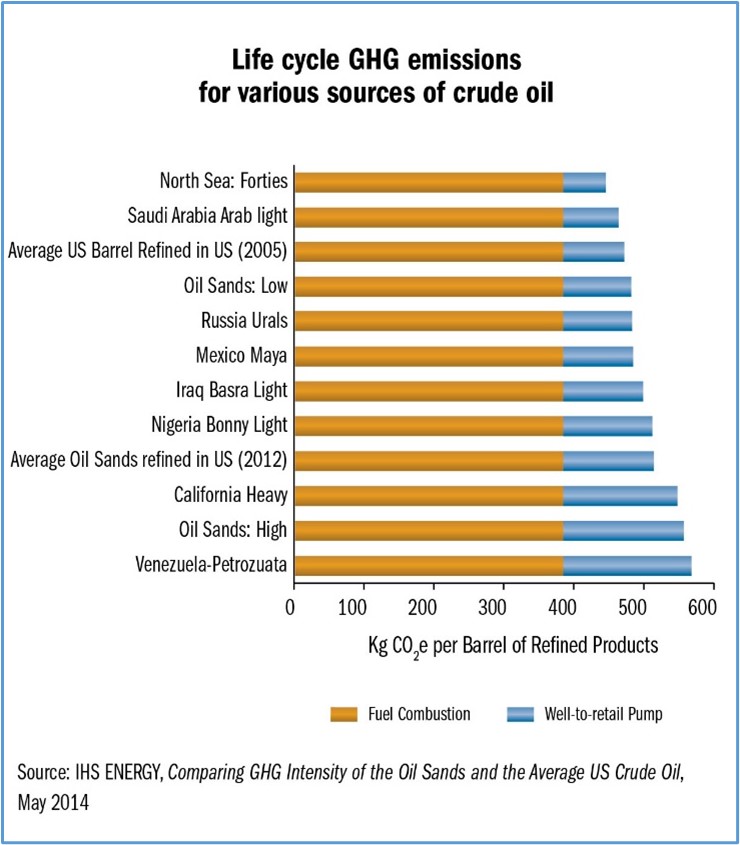
Oil and natural gas producers generate about 20% of GHG emissions during the production, refining, and distribution processes or Well-to-retail Pump. See chart at right. Consumers generate about 80% of GHG emissions from Fuel Combustion. If we want to be serious about reducing GHG, we must reduce per capita energy consumption. The best short-term responses to climate change are energy conservation that is achieved by:
- Driving less and using transit more.
- Buying hybrid or electric cars the next time we need to purchase a vehicle.
- Improving the energy efficiency of governments, businesses, and individuals.
- Encouraging those, who can use renewable energy generation and consumption, to actually do so.
This article challenges the environmentalists who criticize the environmental performance of the Canadian oil and natural gas industry by summarizing the:
- Progress that’s already been achieved.
- Plans for the near-term future.
- Opportunities that are being ignored.
Environmental progress and plans
The major oil and natural gas industry companies that continue to announce GHG emission reductions and plans for future years include:
- Enbridge Inc. – reduced GHG emissions by about 25% during the past three years.
- Suncor Energy Inc. – kept GHG emissions flat during the past three years while increasing production significantly; plans to reduce GHG emission intensity by 30% by 2030.
- Imperial Oil Ltd. – achieved a GHG emissions intensity reduction of 20% between 2013 and 2017; plans to reduce GHG emission intensity by 10% over the next five years.
- Canadian Natural Resources Ltd. – achieved a GHG emissions intensity reduction of 20% during the past 10 years; reduced GHG emissions by about 15% during the past five years.
- Cenovus Energy Inc. – reduced CO2 emissions intensity by about 30% from 2004 to 2019; plans to reduce GHG emissions intensity by 30% by 2030.
- TC Energy Corp. – kept GHG emissions flat during the past three years while increasing transportation volumes; reduced GHG emissions intensity by 20% during the past three years.
- Tourmaline Oil Corp. – kept GHG emissions flat from 2014 to 2017 while more than doubling production volumes.
- Seven Generations Energy Ltd. – led its peers with one of the lowest GHG emission intensities.
- Crescent Point Energy Corp. – reduced GHG emissions and intensity by about 20% during the past three years.; plans to reduce GHG emission intensity by 30% by 2025.
- ARC Resources Ltd. – reduced GHG emissions by 35% percent and GHG emission intensity by 45% during the past three years.
The Clean Resource Innovation Network (CRIN) is receiving huge funding to further reduce GHG emissions in the oil and natural gas industry:
- $100-million fund to be used to cut oilpatch emissions, fuel new product development – EnergyNow.
- Alberta’s government is spending $50 million from the industry-funded Technology Innovation and Emissions Reduction (TIER) system to create jobs, grow our clean-tech industry, and cut emissions. – Government of Alberta.
These plans to achieve further GHG emission reductions in the future are substantial. They are a huge change from the past when some Canadian oil and gas producers pointed to the low Canadian share of global venting and flaring volumes, very real technical difficulties, and added costs that undermine competitiveness as reasons for not taking more action.
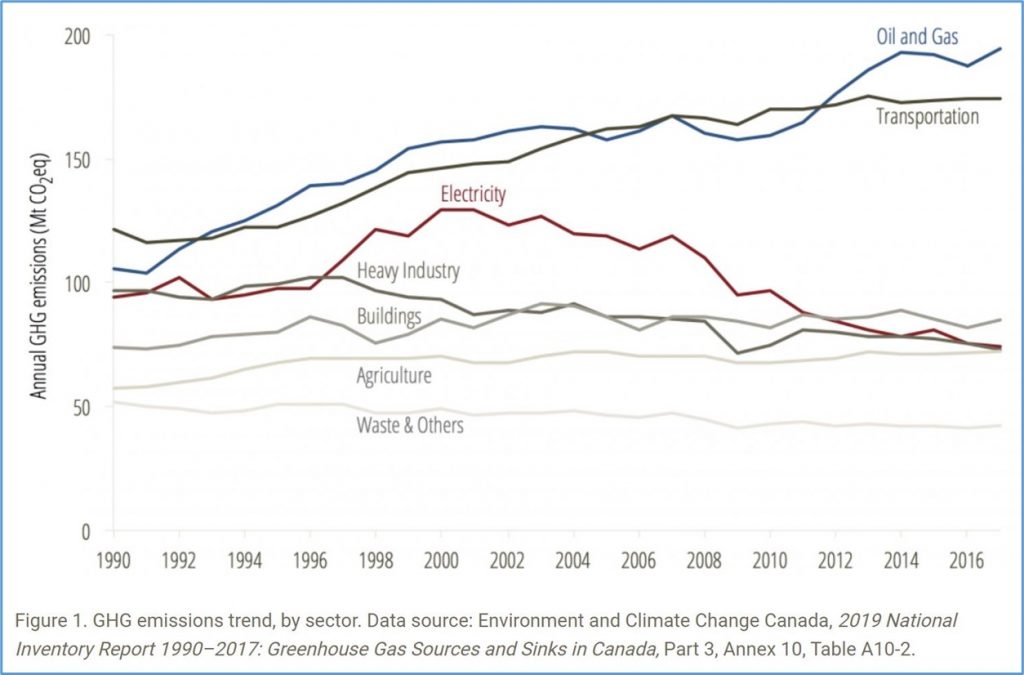
Continuing progress is needed because these venting and flaring volumes are the sources of most of the GHG emissions of the Canadian oil and natural gas industry. Further, the industry is the leading sector of the Canadian economy in terms of GHG emissions as illustrated by the chart below.
Reducing methane emissions from oil and gas production operations
Canada ranks favorably on the chart below that ranks countries by methane emission volume released by oil and gas production operations for 2016. Our oil and natural gas production is ranked about 5th in the world while our methane emissions are ranked 8th or 9th.


Many countries have joined the Global Methane Alliance to reduce methane emissions into the atmosphere from many sources including oil and gas production.
Most of the methane emissions can be eliminated through good production practices that call for:
- Solution natural gas from oil wells to be pipelined for sale where economically feasible.
- Uneconomical solution natural gas from oil wells to be flared. Flaring burns the methane to produce CO2. This burning reduces the environmental impact from 100% to 5%.
- Natural gas from gas wells to be pipelined for sale. It is flared only under emergency conditions that threaten to destroy the production facility.
Unfortunately, quite a few oil and gas producing countries do not follow good production practices. The impediments that preclude converting methane venting to sales or flaring include:
- Lack of return on capital and operating costs for a flaring facility.
- Lack of concern about environmental impacts.
- Wrongly believing that the environmental impact of methane venting is negligible.
Environmentalists and others can advance the cause of climate change by lobbying these countries to reduce their methane venting.
However, Alberta oil and natural gas producers also have many opportunities to replace methane venting with flaring. The yellow and blue areas shown on the map at right, which is copied from the AER ST60B report for 2019, offer the most opportunities. Whenever a methane venting volume is replaced by a flared volume, the associated GHG reduction is 95%.
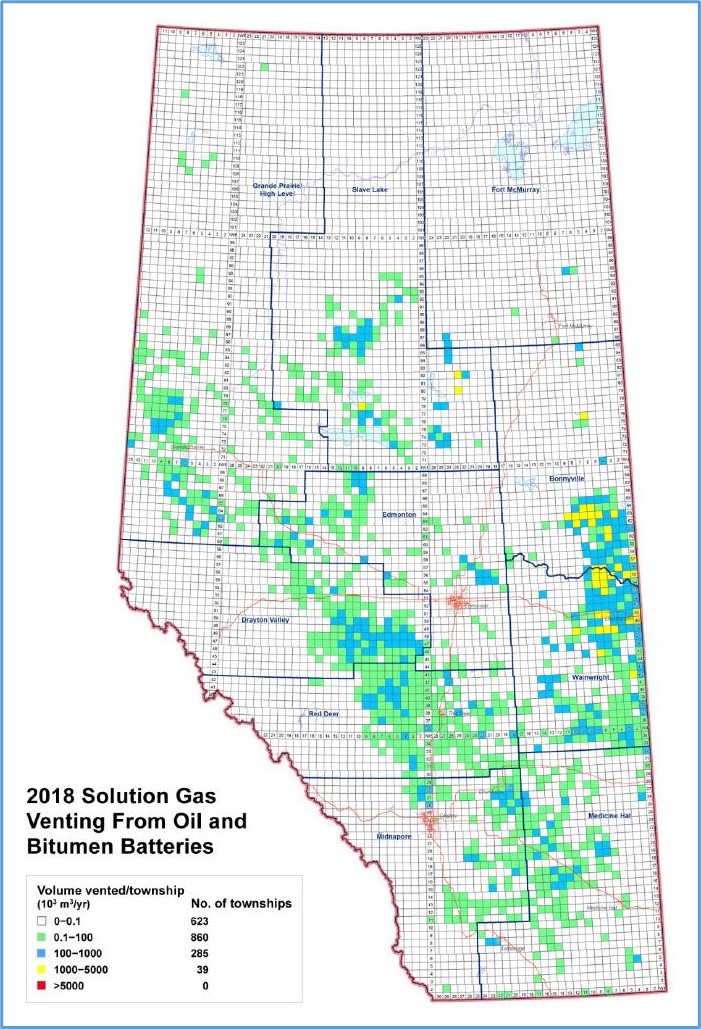
There are still producing locations in Alberta where small flare stacks can be installed at modest cost. Many dense producing areas exist in Alberta where volumes, that are currently vented, can be gathered and flared at modest cost. Reducing the minimum volume and cost of flare stacks is another opportunity that remains to be explored.
Reducing CO2 emissions from oil and gas production operations
Canada’s CO2 emission volumes, that arise mostly from flaring, compare favorably to other oil and gas producing countries during the five years from 2014 to 2018 shown on the chart below. Our oil and gas production is ranked about 5th in the world while our CO2 emissions are ranked 22nd.

However, many locations exist in Alberta where flared volumes can be gathered and consumed at a modest cost. See page 9 of the AER ST60B report for 2019 for a list of high-flaring volume gas plants. Whenever a vented or flared volume is consumed instead, the associated GHG reduction is 100%.
In Alberta vast rural gas networks, operated by 81 natural gas co-operatives, consume methane. In 2008, the County of Vermilion River won the Emerald Award for Climate Change for its gathering and consumer consumption of methane that would otherwise be vented or flared. There are more opportunities to supply currently vented or flared volumes to natural gas co-operatives for consumption.
The analysis of monthly data reported to Petrinex by Western Canadian oil and natural gas producers suggests under-reporting of venting and flaring volumes for thousands of wells. Correcting these volumes is an improvement opportunity for producers.
Conclusion
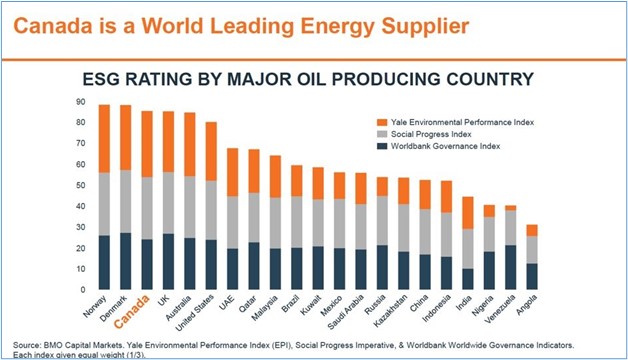
Canadian oil and natural gas are produced to the highest environmental, social, and governance (ESG) standards in the world as summarized by the chart below published by the Canadian Energy Centre. Canada’s low rates of GHG emissions from oil and natural gas production compared to other producing countries contributes to this high ESG achievement. Nonetheless many opportunities to improve further exist.
You may want to read more about the World Bank initiative Zero Routine Flaring by 2030. Here’s a summary of the characteristics of the main greenhouse gases.
Share This:


