


 CDN NEWS |
  US NEWS







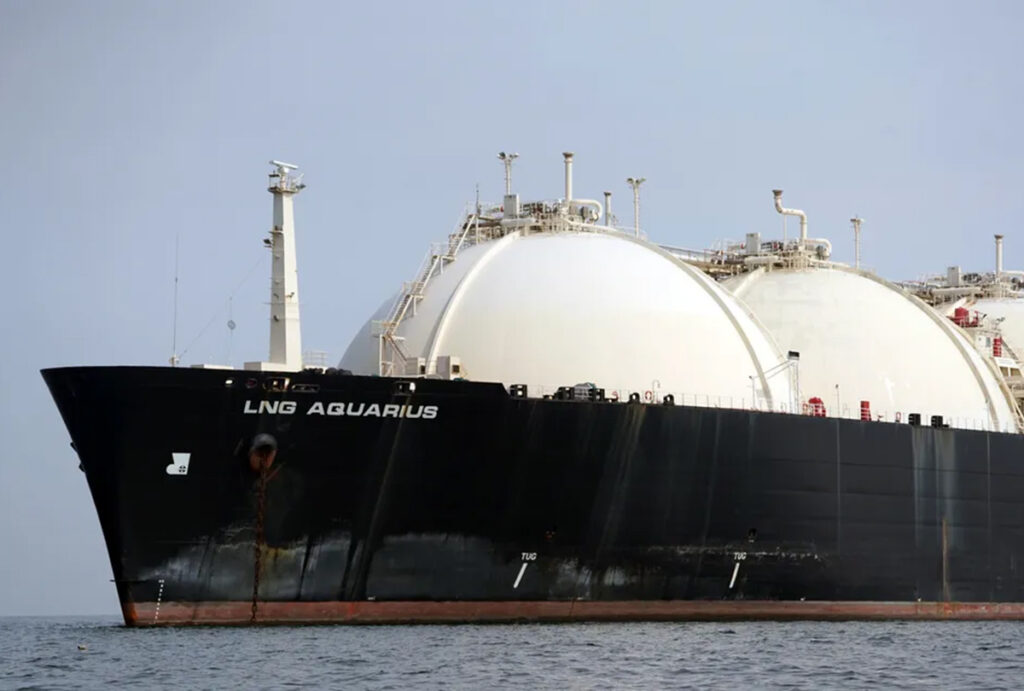
(Reuters) – Natural gas and LNG have emerged as the fossil fuel industry’s most important growth markets as demand for oil and coal comes under mounting pressure from electrification, efficiency gains and climate policies.
Governments and utilities are increasingly turning to gas to support rising electricity demand and provide reliable power alongside expanding renewable energy supplies, triggering a global wave of investment in gas-fired generation, pipelines and LNG export and import infrastructure.
Below are eight key charts that show which regions and countries are driving this growth.
POWER PLAY
Asia dominates the global landscape for gas-fired power generation capacity currently in operation and under construction, data from Global Energy Monitor (GEM) shows.
Asia’s roughly 950,000 megawatts (MW) of operational capacity compares with about 735,000 MW across the Americas, and far exceeds roughly 366,000 MW in Europe.
Asia has an additional 140,000 MW or so under construction, which is over three times more than is being built in any other region.
Among individual countries, the U.S. has the largest operating gas-fired capacity, with around 562,000 MW in operation, while China has the most capacity under construction.
THE PIPELINE PIPELINE
The Americas have by far the densest network of gas pipelines, with just under 490,000 kilometers (304,471 miles) currently operating.
That total far exceeds the roughly 281,000 km of pipelines in Asia and 262,680 km in Europe.



Asia, however, has the most pipeline capacity under construction, with nearly 56,000 km currently being built.
China has the largest pipeline buildout, with nearly 22,000 km being built, followed by India’s nearly 15,000 km.
LNG EXPORT FOOTPRINT
While the U.S. is the world’s top gas producer and has the largest existing liquefied natural gas (LNG) export capacity, Asia ranks first among regions, thanks to hefty export infrastructure stretching from the Middle East through Southeast Asia.
The U.S. also has the largest LNG export capacity under construction, with around 100 million metric tons of annual export capacity currently being built, GEM data shows.
LNG IMPORT GROWTH
Asia, the world’s top LNG-importing region, dominates the import infrastructure landscape, accounting for over 66% of existing import capacity and nearly 70% of import capacity under construction.
At the country level, Japan has the most existing import infrastructure, with 242 million tons of annual import capacity. But China has a sizeable lead in import capacity under construction, at 97 million tons.
Once built, energy infrastructure tends to endure.
The sheer volume of gas-fired generation, pipeline networks and LNG facilities already operating or under construction suggests that natural gas will remain a defining feature of the global energy landscape for years to come.
The opinions expressed here are those of the author, a columnist for Reuters.
Reporting by Gavin Maguire; Editing by Marguerita Choy
Share This:






















On The Verge: Energy Sector Primed for New Wave of Growth – ATB Economics