


 CDN NEWS |
  US NEWS


S&P Global’s latest analysis shows Canadian oil sands emissions intensity is down nearly a third since 2009. Here’s the difference between intensity and absolute emissions and why both numbers point to progress.
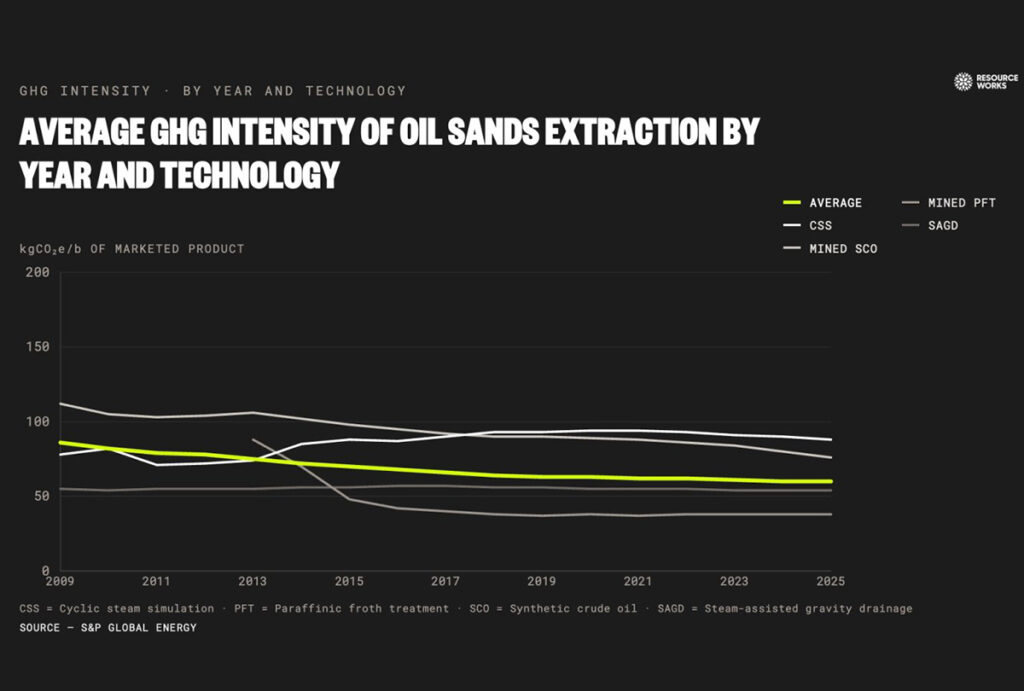
The headline from S&P Global Energy’s latest annual analysis, released today, is a story of progress that’s now 17 years deep: the carbon intensity of Canadian oil sands production keeps falling.
In 2025, the benchmark average GHG intensity dropped 2%, to 59 kilograms of carbon dioxide equivalent per barrel (kgCO2e/bbl). That’s the 13th straight year of decline. Since 2009, emissions intensity is down 31%—nearly one third—shaving close to 27 kilograms of CO2 off every barrel produced.
The numbers tell a bigger story: in a world that will keep using oil for years to come, the barrels meeting that demand are increasingly the ones getting cleaner.
Intensity vs. absolute: two numbers, two questions
Oil sands emissions coverage tends to blur two very different measures. Keep them apart and the picture gets clearer.
Emissions intensity is emissions per barrel—the carbon cost of producing one unit of oil. This is the 59 kgCO2e/bbl figure, and it has been steadily decreasing for over a decade.
Absolute emissions are the sector’s total greenhouse gas output. By S&P’s estimate, that reached about 89 million tonnes of CO2e in 2025, up 2% from 2024.
Intensity answers “how efficiently is each barrel produced?” Absolute answers “what is the total footprint?” The two are related, but they don’t necessarily move in lockstep. However, S&P’s analysis shows both numbers are moving in the right direction, and are clear indicators of how Canada’s oil sands industry continues to optimize and improve operations.
Why a 2% rise in emissions is also good news
Here’s the part that can get misconstrued. Yes, total emissions rose 2%. But production rose more than twice as fast.
Canadian oil sands output climbed by 150,000 barrels per day between 2024 and 2025, from roughly 3.35 million b/d to a record 3.5 million, an increase of about 4.5% (S&P’s own mid-2025 outlook pegged the year’s growth at close to 5%). Set the two figures side by side and the picture becomes clear: production up ~4.5%, emissions up 2%. The barrels grew at more than double the rate of the carbon.
These numbers prove the tangible emissions reduction progress the sector has made. S&P calculates that each incremental new barrel in 2025 carried an intensity of just 33 kgCO2e— just over half the 59 kg fleet average. The growth is coming from the cleanest barrels in the patch.


“As oil sands output has increased, emissions have been spread over more units pushing intensity lower, even as it also pushed absolute emissions higher, but at a slowing rate,”
Kevin Birn, Vice President, Head of Carbon Research, S&P Global Energy.
That is what optimization looks like in practice: more oil, proportionally less carbon, and is one of the many reasons why Canada’s oil production is increasingly recognized as a leader in responsible energy development. The world still consumes around 100 million barrels of oil a day, and will for years yet. When that demand is met by lower-intensity barrels, the same oil arrives with less carbon attached, which is the essence of the responsible-producer case: not whether the world uses oil, but whose oil it uses. It’s a case the International Energy Agency now makes as well: after years of urging Canada to stop, the IEA’s Fatih Birol has reversed course, calling Canadian energy a “golden opportunity” and wishing for “a few more Canadas” to anchor a reliable global energy supply.
What 59 kilograms actually looks like
A kilogram of CO2 is hard to picture, so let’s anchor it. Using the U.S. Environmental Protection Agency’s Greenhouse Gas Equivalencies Calculator, 59 kgCO2e is roughly equal to:
- 150 miles (about 240 km) of driving in an average gasoline passenger vehicle
- 6.6 gallons (25 litres) of gasoline burned
- About four and a half days of electricity use for an average North American home
- Roughly 4,750 smartphone charges.
That’s today’s carbon cost of producing one barrel and getting it to market. In 2009, that same barrel ran closer to 86 kilograms.
Why it keeps dropping
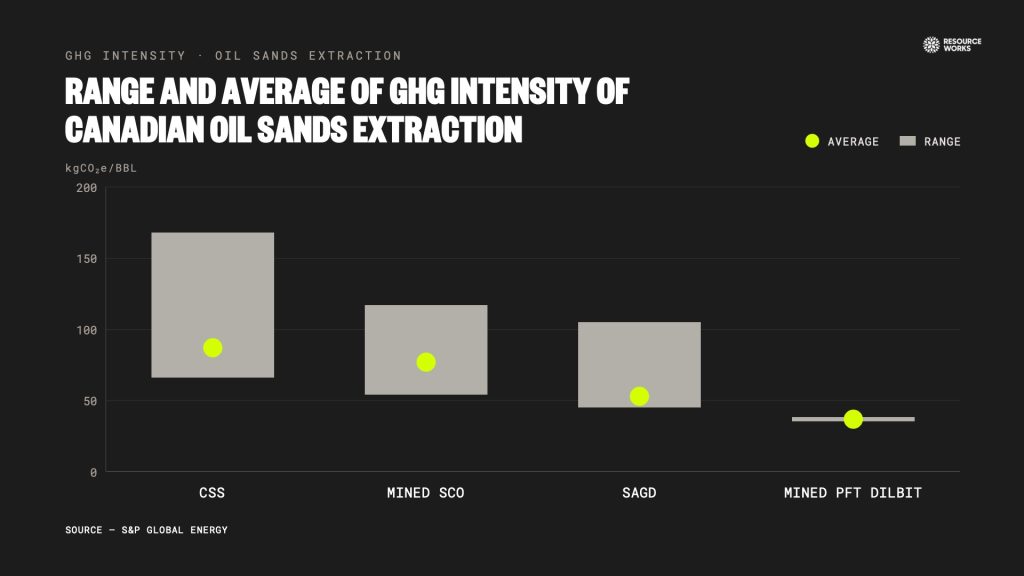
The gains are unglamorous and durable: better mining fleet optimization, waste-heat integration, predictive maintenance, and shorter maintenance turnarounds. Bigger one-off steps helped as well. For example, S&P cites the Quest carbon capture project (completed 2015) and Suncor’s coke boiler replacement (2024). And the production mix keeps shifting toward lower-intensity methods like steam-assisted gravity drainage (SAGD) and mined dilbit, pulling the average down further.
“The downward trajectory of oil sands emissions intensity is now a well-established, multi-decade trend. Ongoing optimization efforts to maximize output from existing facilities, which are much more capital efficient compared to new projects, has been a critical factor, and this is expected to continue.”
Kevin Birn, Vice President, Head of Carbon Research, S&P Global Energy.
The bottom line
Seventeen years of falling intensity is no accident, especially as global energy demand is on the rise. The fact that Canada’s oil sands are making production records along with significant emissions intensity reductions and an absolute emissions increase less than half the size of the production increase deserves accolades.
An honest caveat: if production accelerates sharply without more carbon capture, total emissions will keep climbing. But the efficiency trend is one of Canadian industry’s clearest, most consistent stories, and it is still pointing down. With more and more countries around the world looking to Canada for secure, reliable, responsibly produced energy this is welcome news. In a market increasingly defined by where energy comes from and how it’s made, a barrel that keeps getting cleaner is not just an environmental win, it’s a competitive edge.
Angela Wrigley is the Editorial and Digital Director of Resource Works.
Share This:


