


 CDN NEWS |
  US NEWS


![]()
Each week, XI Technologies scans its unique combination of enhanced industry data to provide trends and insights that have value for professionals doing business in the WCSB. If you’d like Word to the Wise delivered directly to your inbox, subscribe here.
In June of 2021, a BC Supreme Court judgment agreed with the 2015 claim that years of industrial development in the region violated the Treaty 8 rights of the Blueberry River First Nations. As of this January, the BC government and the Blueberry River First Nation have come to a historic agreement. This agreement will have certain implications for all new projects in northeastern BC, where several First Nations are signatories to Treaty 8. Blueberry River’s traditional territory is in the upper Peace River region of northeastern BC, representing about 38,000 square kilometres.
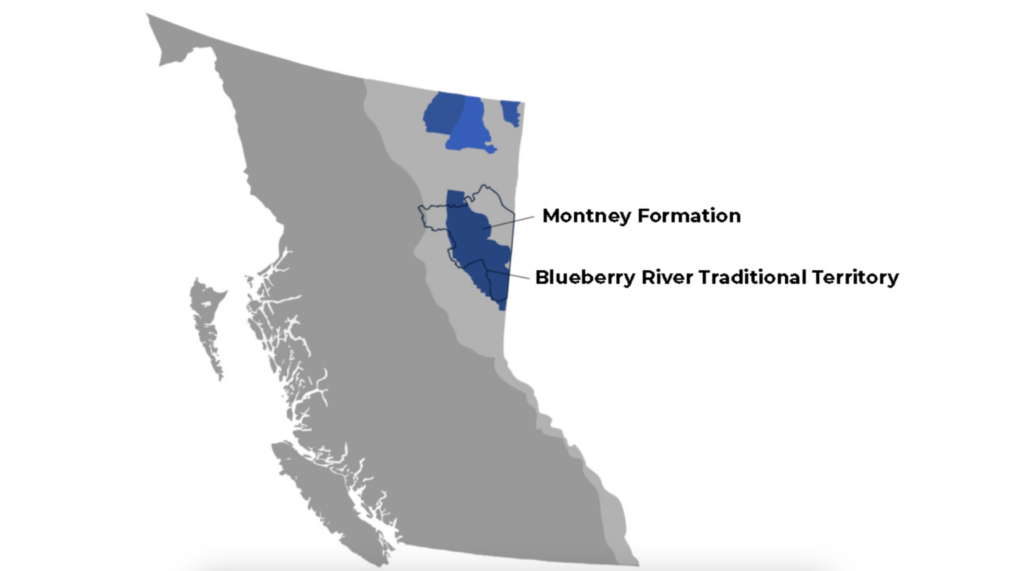
Figure 1 – Blueberry River Territory
Due to the increased interest in the area, both for its precedent-setting significance as well as implications for future development in the area, XI Technologies takes a closer look using our enriched industry data to offer a few insights as to what’s happening in the area from an oil and gas perspective.
Ownership of Blueberry River Assets
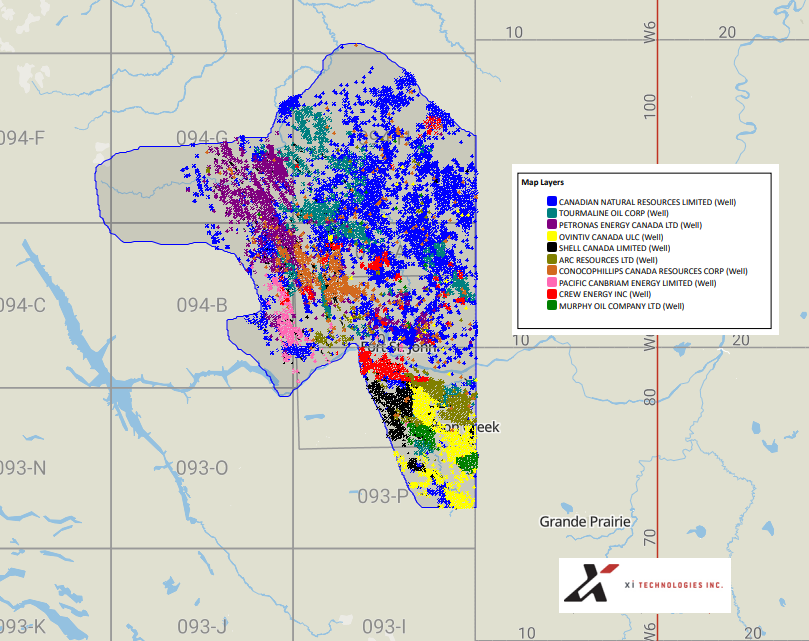
Figure 2 – Top Producing Companies in Blueberry River Claim Area
In Figure 2, we show the top producing companies in the Blueberry River claim area, as captured by XI’s AssetBook. Ranked by BOE, the biggest players in the area today are still Ovintiv, Tourmaline, ARC Resources, Canadian Natural Resources and Petronas Energy, with 96% of the total Production in this area coming from the Montney. (You can load our globally available search of the Approximate Blueberry Claim Area polygon to run the same search).
Click here to download a report of all companies with working interest in the area.
Expiring Lands
Looking ahead, here are the top companies with leases expiring in the upcoming year within the area and therefore those who will need to fully understand their ability to drill in this area to prove out those lands.
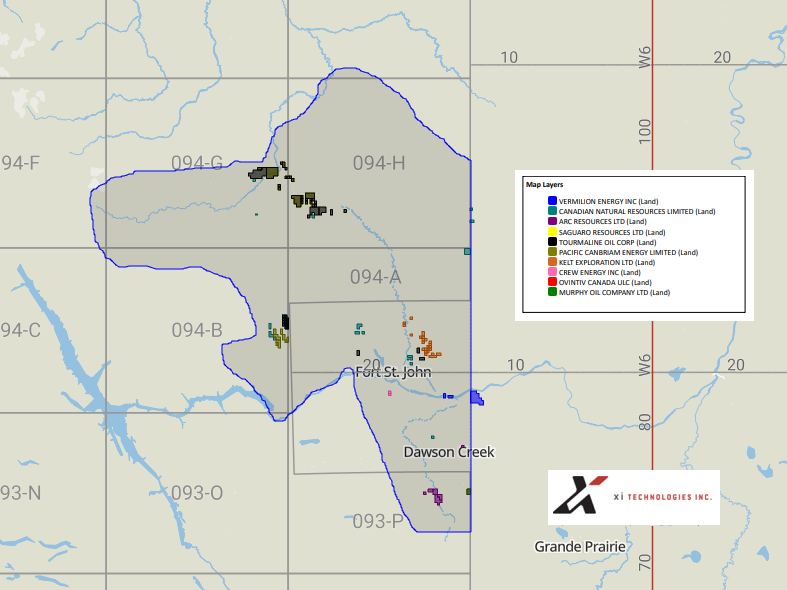
Figure 3 – Expiring Lands in the Area
Production history of Blueberry River assets
Let’s investigate the area a little further by examining production levels over time.
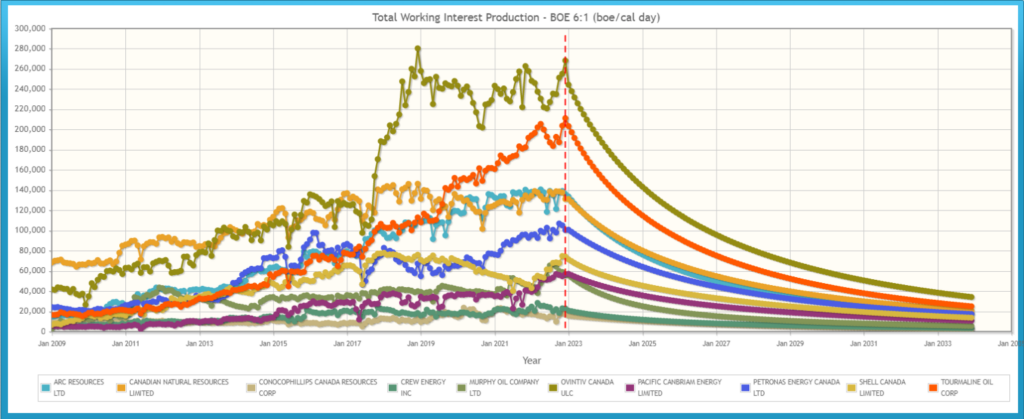
Figure 4 – Production History of Blueberry River Assets
As you can see, production has dramatically increased over the past few years, particularly for Ovintiv, and Tourmaline, as this area has become economically active.
Liabilities
With the new agreement and a $200 million restoration fund, there is going to be a large focus on cleaning up liabilities. There are approximately 3,800 inactive licenses in this area, with an associated liability cost of around $350 million (based on XI’s 2022 Cost Model).

Figure 5 – ARO Project Overview
Click here to download ARO Manager’s Project Overview Report.
Emissions
With the increase in production in 2018, there has also been a rise in fuel emissions. Emissions from stationary combustion (fuel) outweighs venting and flaring at about 9:1. You can see from the below graph, that the venting and flaring have remained steady over the past few years. Being a gas play, it is no surprise the region has a high gas conservation ratio of almost 99%. About half of the GHG emissions come from the top 20 emitters, and predominantly from large gas processing plants.
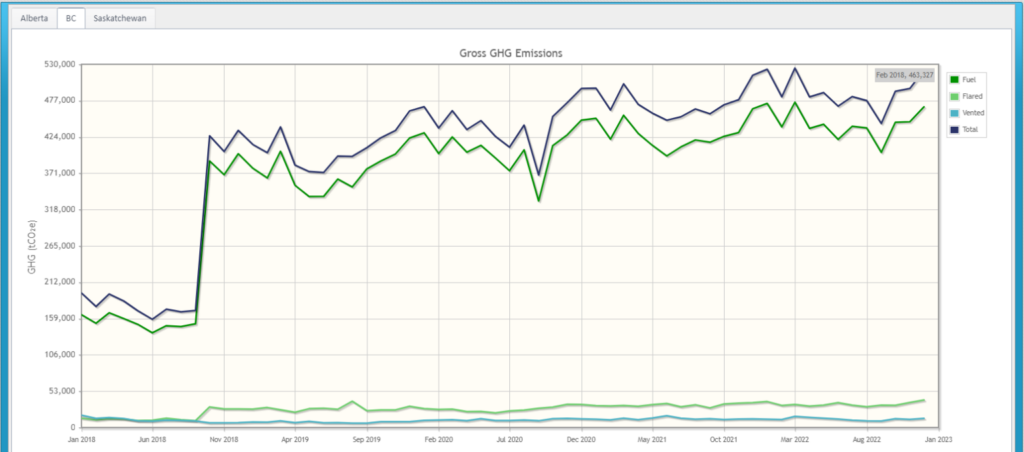
Figure 6 – Gross GHG Emissions
If you’d like to learn more about how XI’s AssetSuite software can analyze areas throughout Western Canada, visit our website or contact XI Technologies.
Share This:


