


 CDN NEWS |
  US NEWS


Canada’s oil and gas sector plays significant role fueling BC’s economy with jobs and economic benefits
Download the PDF here
Download the charts here
Overview
Canada’s oil and natural gas sector has had a positive impact on many parts of the Canadian economy, not only in Alberta and Saskatchewan where the industry is a relatively large proportion of the economy, but across the country. The economies of all the provinces, especially Ontario, Quebec, British Columbia, and Atlantic Canada, benefit economically from Canada’s oil and gas sector, particularly when it is healthy, but even in “slump” years such as 2017 when oil and gas prices were relatively depressed.
The impact of the oil and gas sector on other provinces’ GDP, jobs, output, exports, and other key economic sectors is a bit more difficult to determine, but is no less relevant to current discussions about the performance of the oil and gas sector.
In this CEC Fact Sheet, we examine the impact that the oil and gas sector has had on British Columbia’s economy. Two points to note:
- First, the analysis presented here includes not only the direct impact of Canada’s oil and gas sector on BC’s economy in nominal GDP, output, jobs, and exports, but the indirect impact that such activities have on other sectors in the province.
- Second, given that the largest proportion of oil and gas activity in Canada occurs in Alberta, we also profile the impact of Alberta’s purchases on various sectors of BC’s economy. For this measurement, we look at 2017 in isolation (the latest year for which these data are available).
- We also show the significant role Alberta plays in BC’s interprovincial and international trade flows.
Analysis One: The impact of the oil and gas sector on British Columbia’s economy
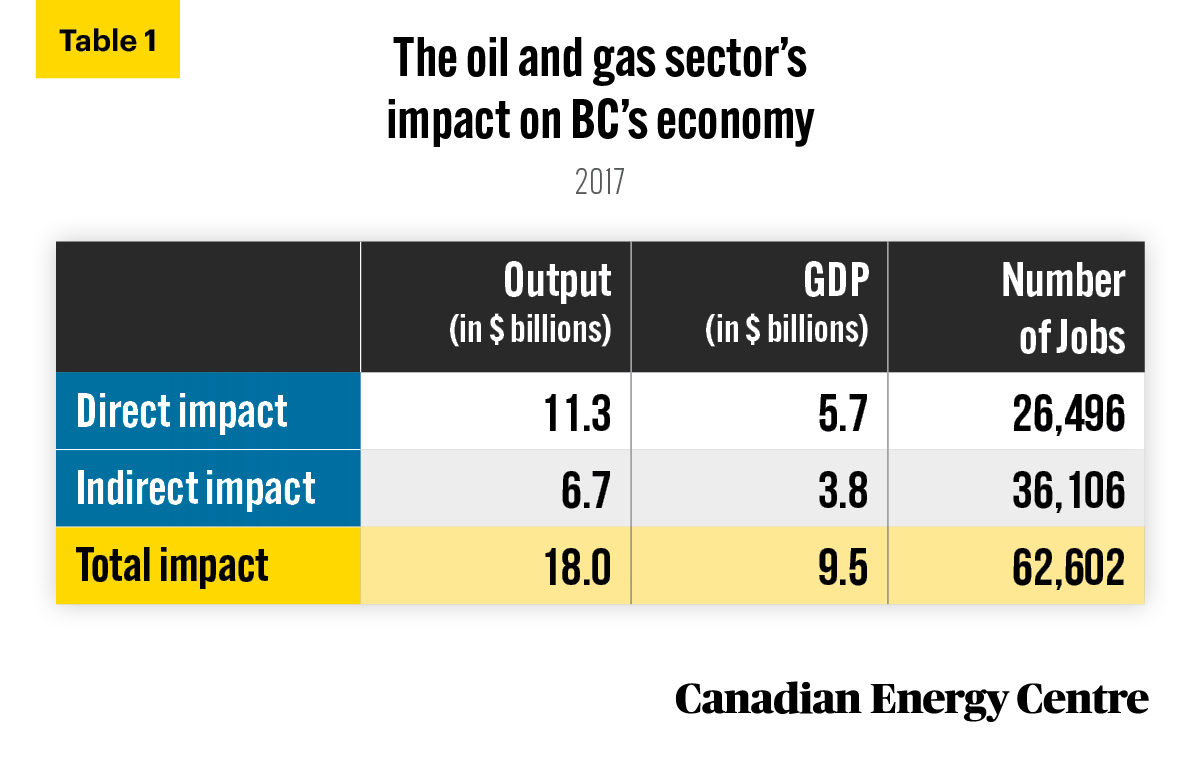
Using customized data from Statistics Canada¹ (see Table 1), in 2017 the oil and gas sector:
- was responsible for adding nearly $9.5 billion in nominal GDP to the BC economy;
- generated nearly $18.0 billion in outputs, consisting primarily of the value of goods and services produced by various sectors in the BC economy;
- supported over 62,000 direct and indirect jobs in BC’s economy;
- paid over $3.1 billion in wages and salaries to workers in BC.
1. For a discussion of Statistics Canada’s use of Input/Output models and equilibrium models, see the addendum in Fact Sheet #17. The latest available year for the customized data from Statistics Canada is 2017.
Source: Derived from Statistics Canada, Supply and Use tables, custom tabulation.
More than $5 billion impact from oil and gas on key BC industries
To examine the impact of the oil and gas sector on BC’s economy in more detail, consider that in 2017 the oil and gas sector purchased $5.6 billion worth of goods and services from other sectors in BC. The $5.6 billion in purchases of goods and services included
- $600 million from BC’s finance and insurance sector;
- $770 million from professional services; and
- over $2.8 billion from BC’s manufacturing sector.
Analysis Two: The value of Alberta’s purchases from BC
Given that the largest proportion of oil and gas activity in Canada occurs in Alberta, we have expanded the analysis to include all purchases by Alberta’s consumers, businesses, and governments of British Columbia’s goods and services — that is, we measure the value of Alberta’s interprovincial trade with BC.
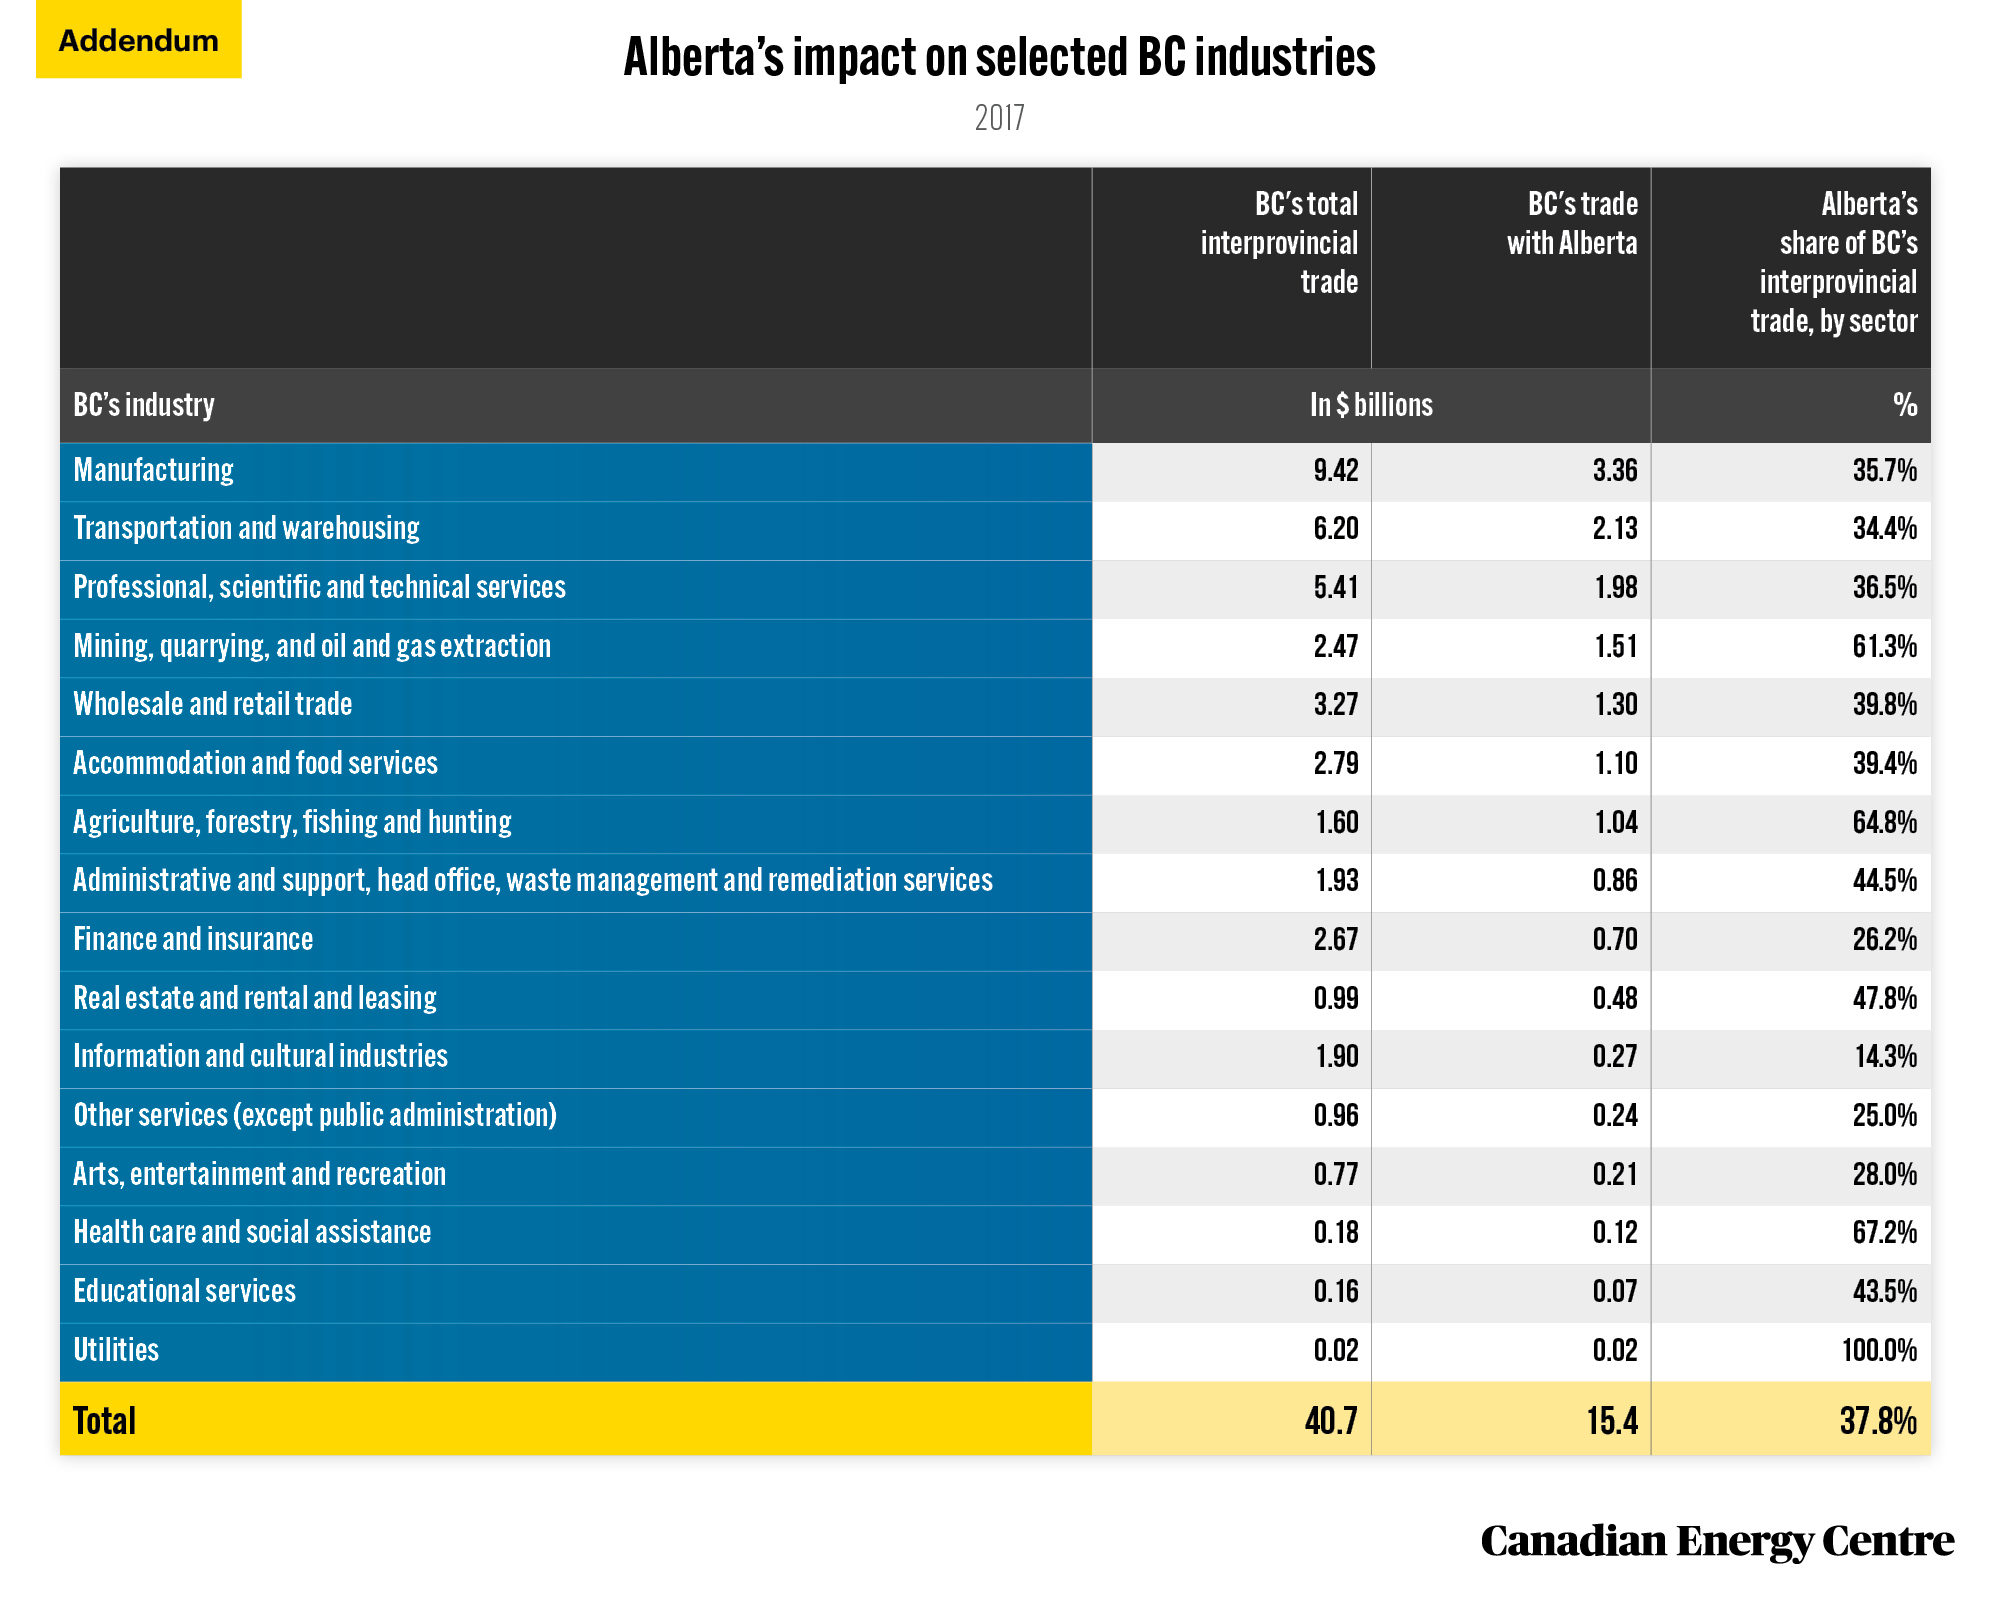
The impact of Alberta’s purchases on BC’s interprovincial trade in 2017: $15.4 billion
Albertans spent a substantial amount on British Columbia’s goods and services in 2017. The purchases include relatively small amounts ($20 million on utilities) to $700 million in finance and insurance services, to $1.1 billion in food and accommodation, $1.5 billion from mines and from oil and gas extraction, and nearly $3.4 billion from BC manufacturers. In total in 2017, interprovincial exports from BC to Alberta were worth $15.4 billion (see Addendum).
As a proportion of BC’s interprovincial exports from various industries, Alberta’s purchases accounted for nearly 36 per cent of its manufacturing sector, and over 61 per cent of its mining, oil, and natural gas sector.


Across all the interprovincial exports from all of BC’s sectors, Alberta-based consumers, businesses, and governments made an average of 37.8 per cent of purchases. That was significantly higher than Alberta’s 11.5 per cent proportion of Canada’s population (see Figure 1).
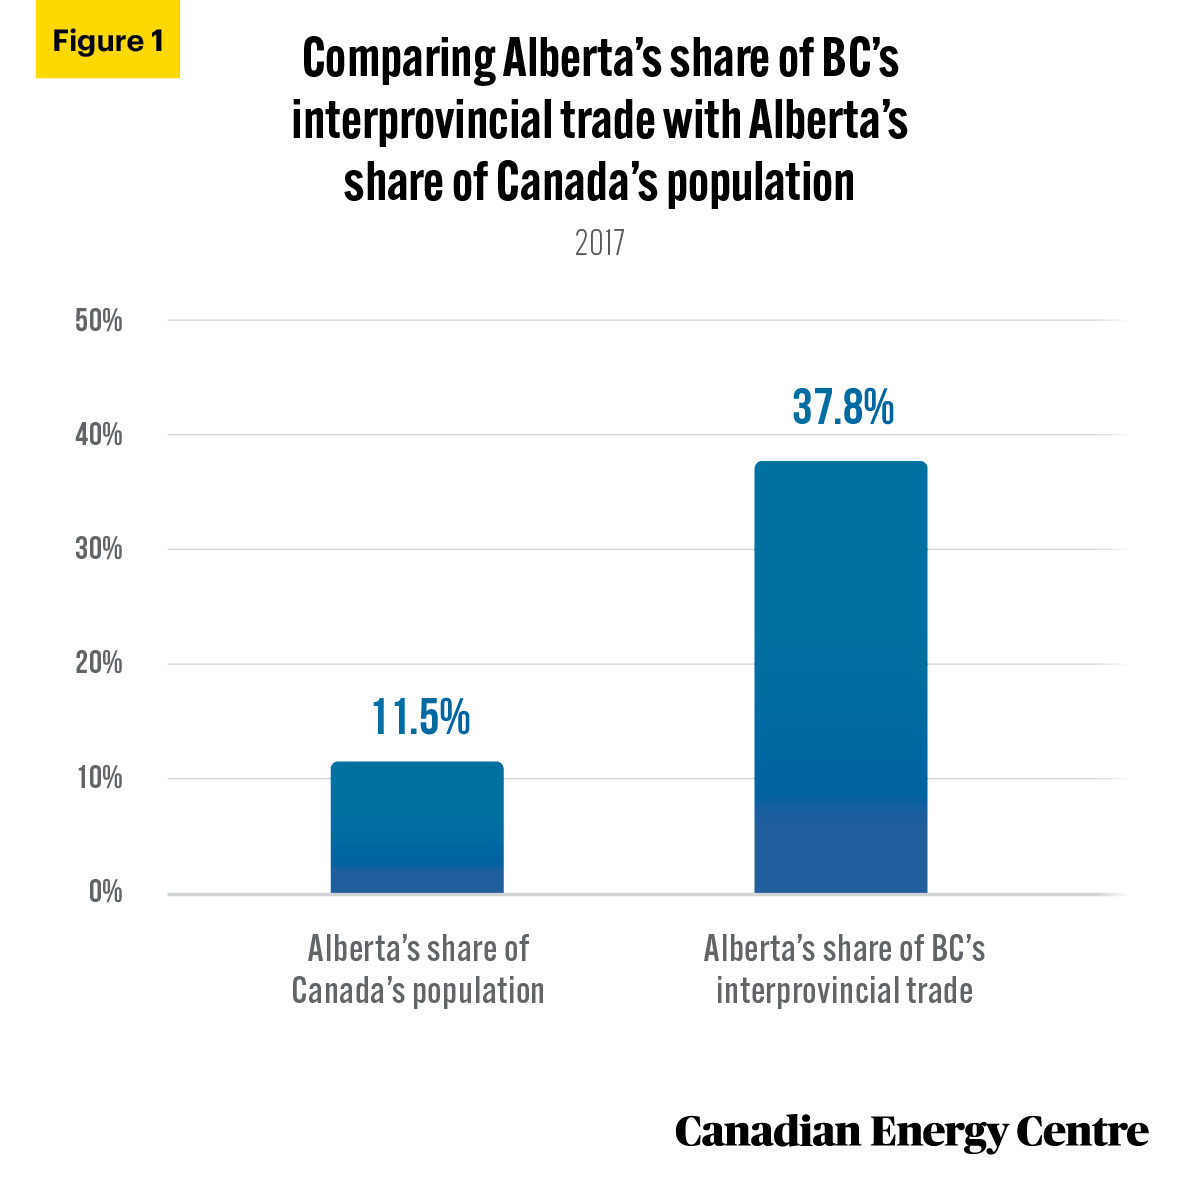
Sources: Statistics Canada, Table 12-10-0088-01; 2016 Census.
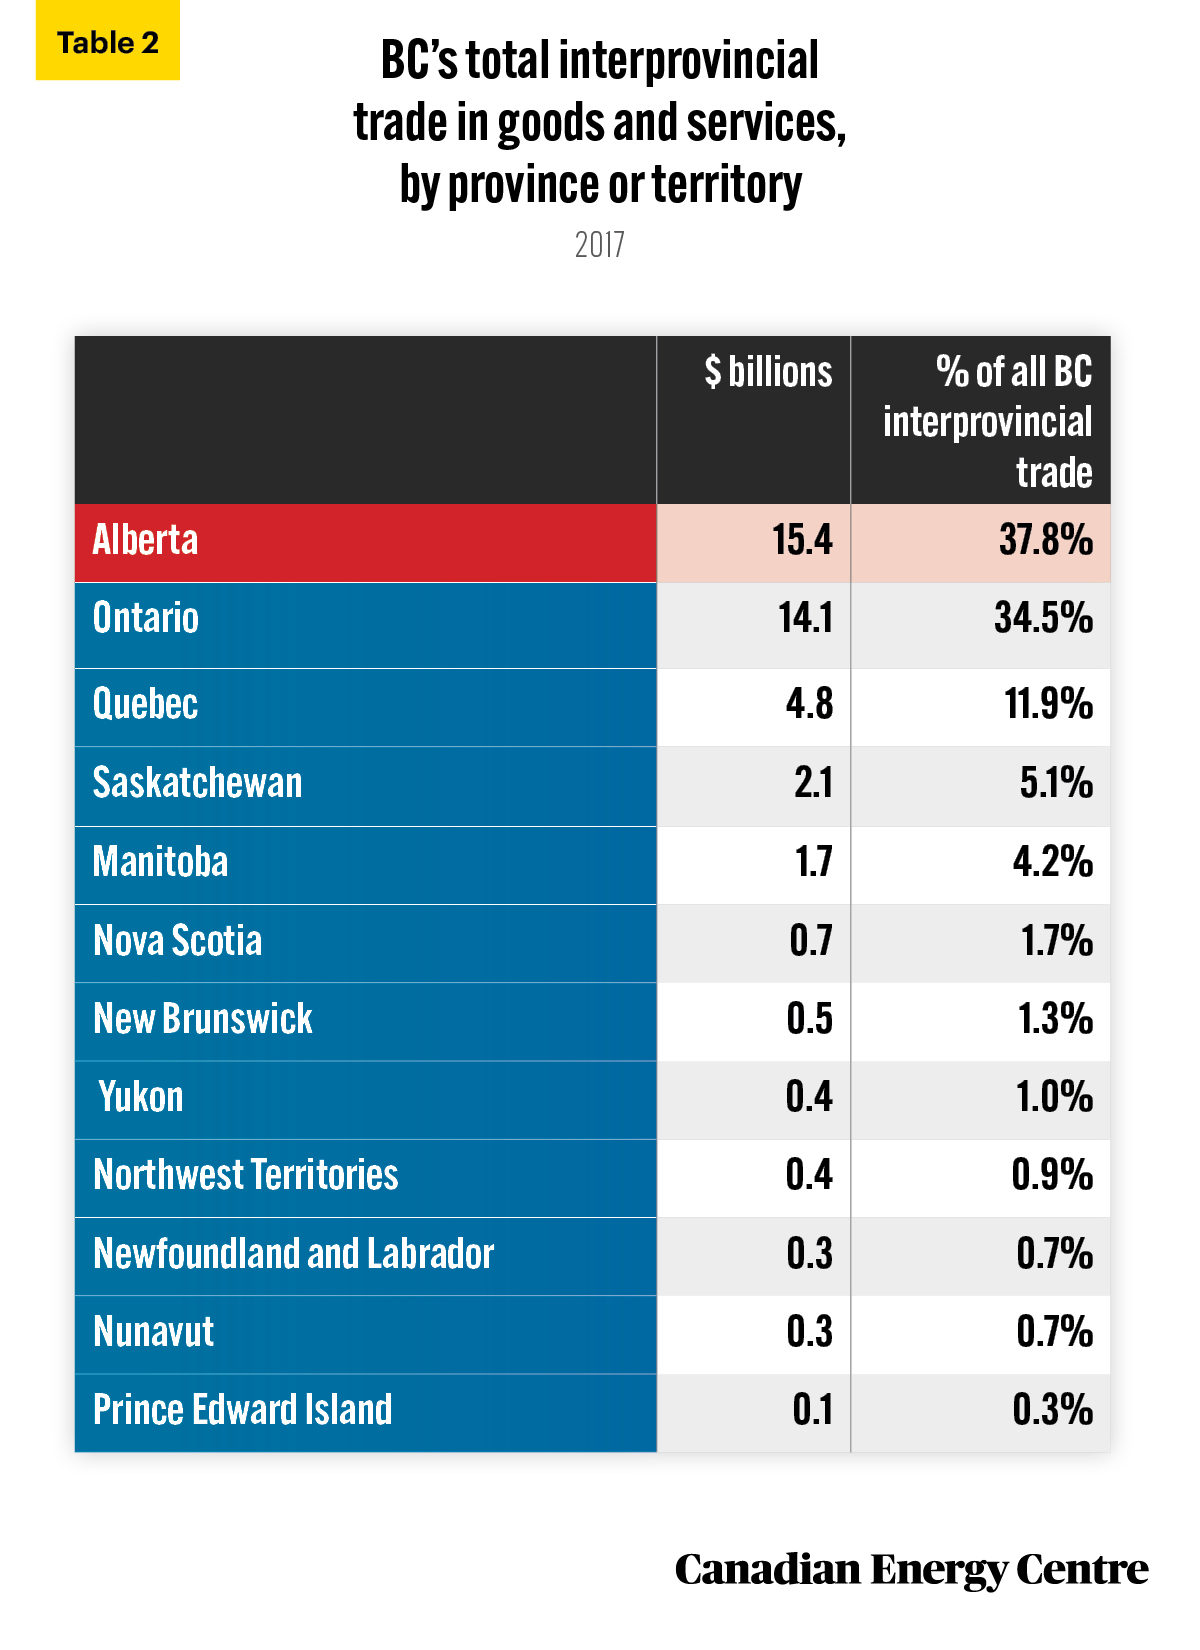
Alberta is BC’s biggest market for interprovincial trade (see Table 2 and Addendum). In 2017, BC’s trade with Alberta was worth $15.4 billion, or 37.8 per cent of all of British Columbia’s interprovincial trade. Ontario came second at $14.1 billion (34.5 per cent) and Quebec third at $4.8 billion (11.9 per cent).
Source: Statistics Canada, Table 12-10-0088-01.
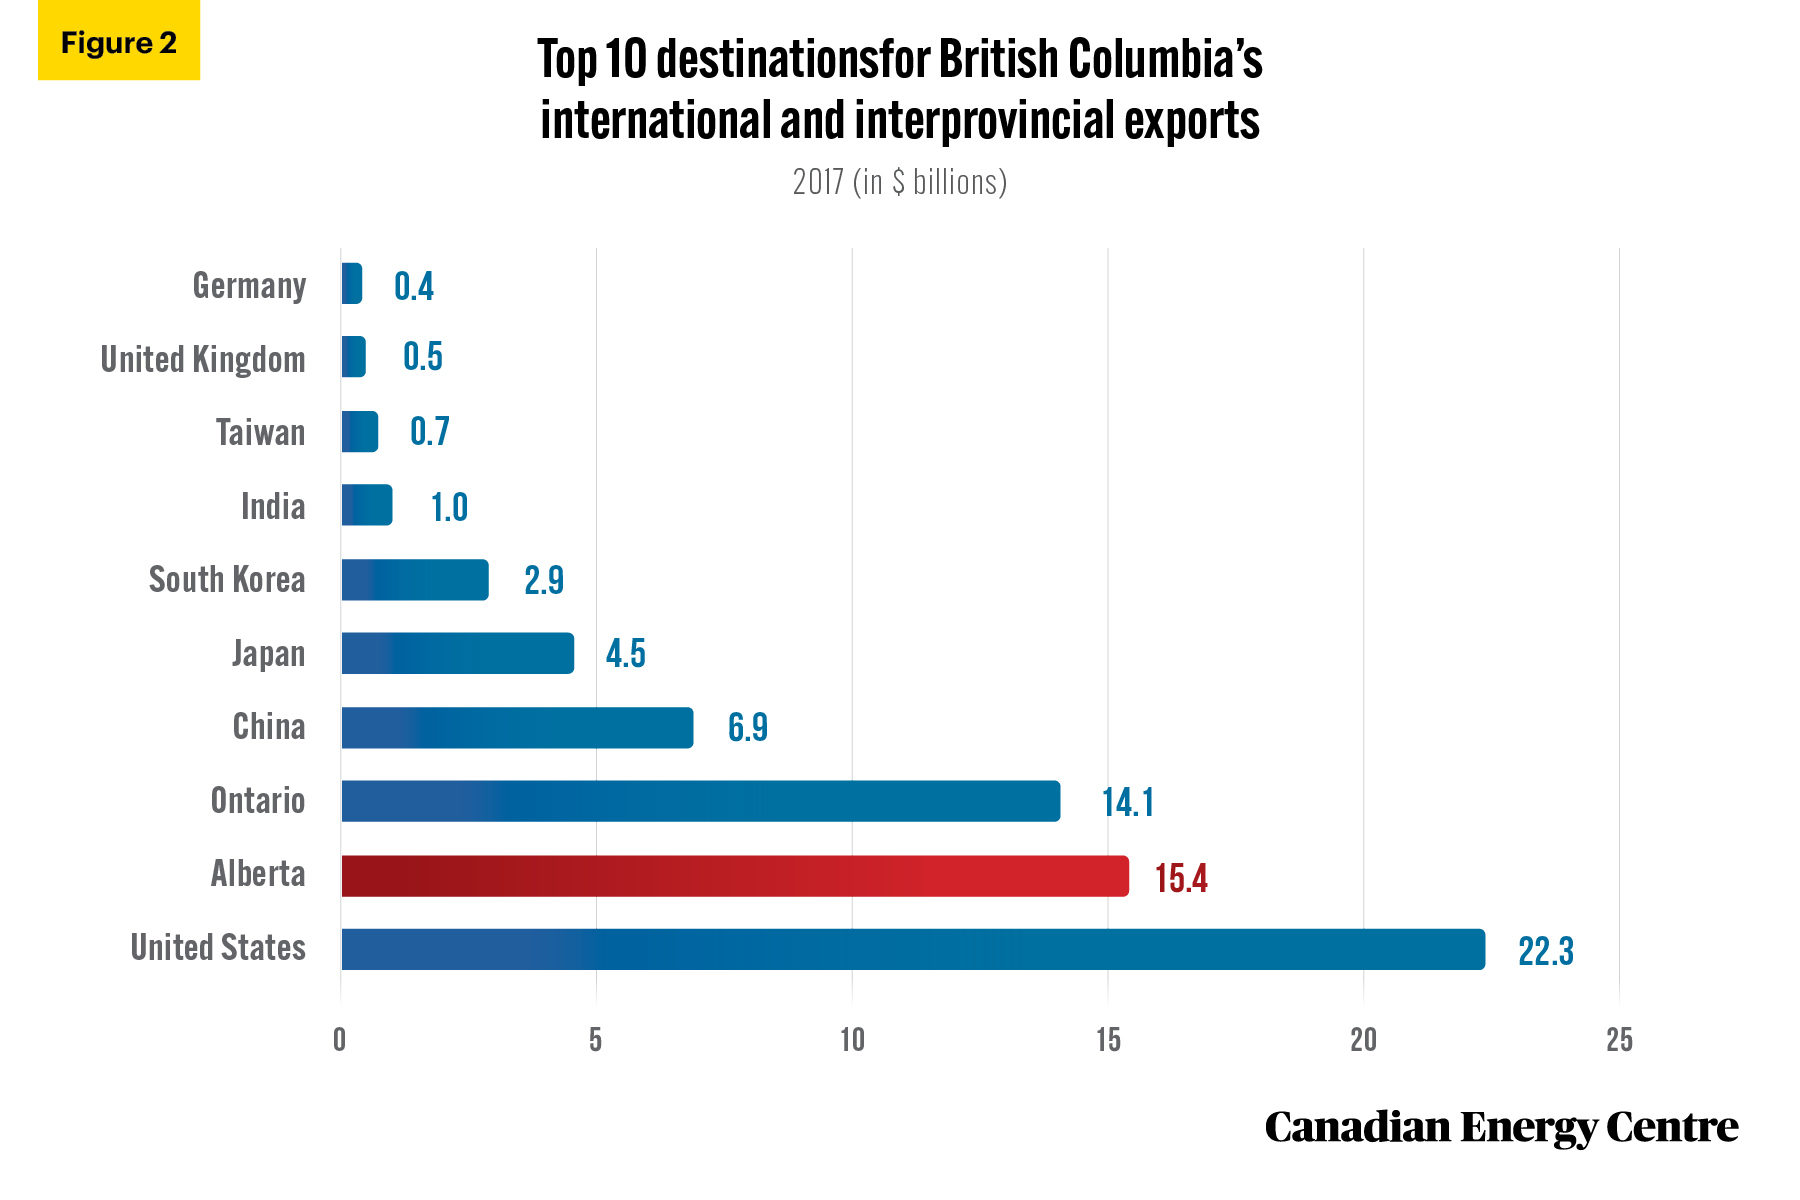
Alberta is British Columbia’s second largest export market after the United States
A look at BC’s international and interprovincial trade export data shows that at $15.4 billion in 2017, BC’s trade with Alberta was second behind only its trade with the United States (nearly $22.3 billion) and ahead of all other markets including Ontario ($14.1 billion), China ($6.9 billion), Japan ($4.5 billion), and South Korea ($2.9 billion) (see Figure 2).
Source: Government of Canada trade data online; and authors’ calculation derived from Statistics Canada, Table 12-10-0088-01.
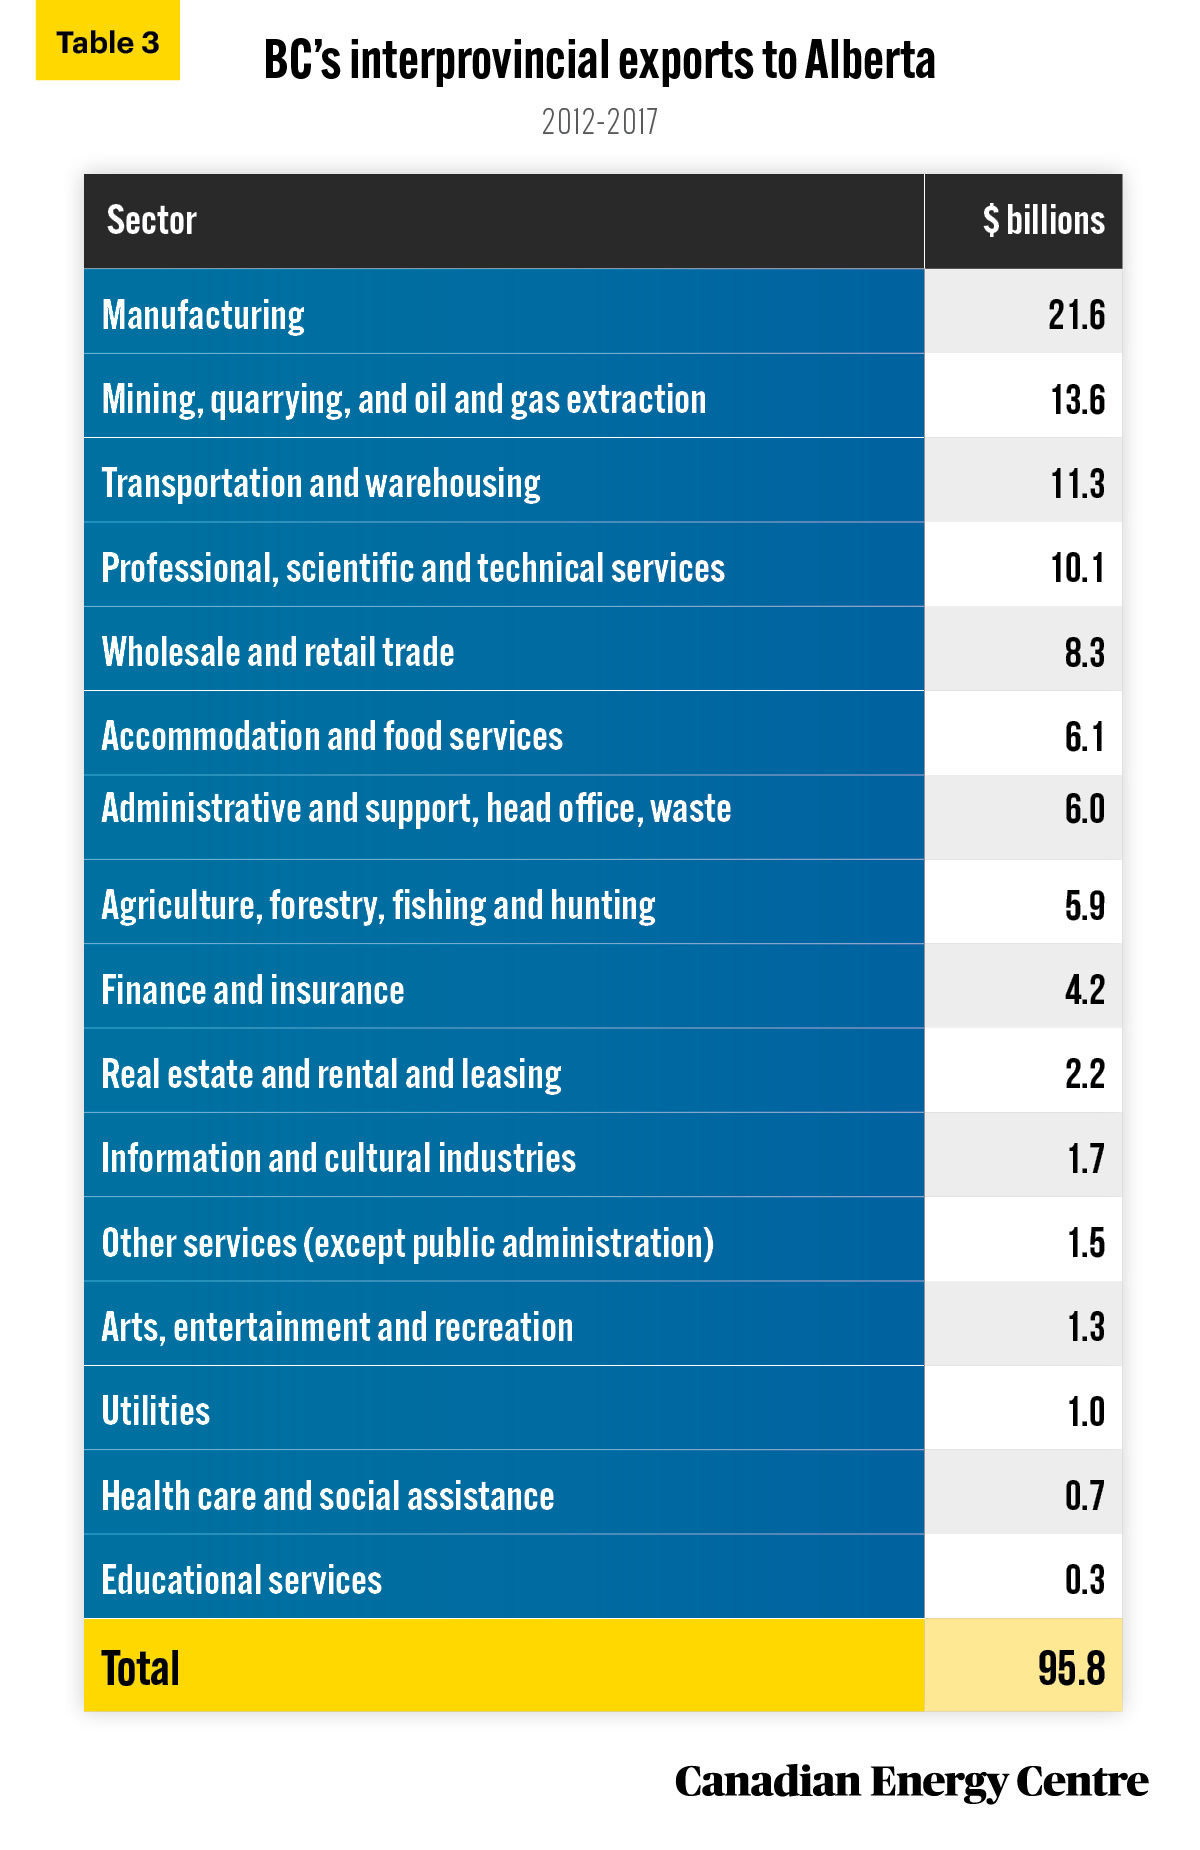
Alberta’s 2012-2017 impact on British Columbia’s interprovincial exports: $95.8 billion
Residents and local businesses from other provinces benefit when they supply Alberta with labour, goods, services, and technology. Between 2012 and 2017, Alberta imported nearly $96 billion worth of goods and services from British Columbia. This total included $21.6 billion in manufacturing, $6.1 billion in accommodation and food services, and $5.9 billion in agriculture and forestry (see Table 3).
Source: Authors’ calculations from Statistics Canada, Table 12-10-0088-01.
The takeaway
Canada’s oil and gas sector has a significant impact on BC’s export sectors, both direct and indirect, as does the purchase of goods and services by Alberta’s citizens, businesses, and governments in the province where the sector is concentrated. The oil and gas sector provides substantial economic benefits to BC in terms of GDP, jobs, output, and exports. In 2017 alone, the economic benefits included $9.5 billion in nominal GDP, $18.0 billion in outputs in the BC economy, 62,000 jobs, and over $3.1 billion in wages and salaries to workers in the province.
Addendum
Source: Authors’ calculation derived from Supply and Use Tables, Statistics Canada catalogue 15-602-x_2017.
Notes
This CEC Fact Sheet was compiled by Ven Venkatachalam and Mark Milke, formerly of the Canadian Energy Centre (www.canadianenergycentre.ca). All percentages in this report are calculated from the original data, which can run to multiple decimal points. They are not calculated using the rounded figures that may appear in charts and in the text, which are more reader friendly. Thus, calculations made from the rounded figures (and not the more precise source data) will differ from the more statistically precise percentages we arrive at using source data. The authors and the Canadian Energy Centre would like to thank and acknowledge the assistance of Philip Cross in reviewing the data and research for the initial edition of this Fact Sheet. Image credits: Nate Foong from Unsplash.com
References (All links live as of October 11, 2021)
Statistics Canada (2020), Supply and Use Tables, 2017: 15-602-X_2017 <https://bit.ly/2XHbDUe>; Statistics Canada (2021a), Supply and Use Tables, custom tabulation; Statistics Canada (2021b), Table 17-10-0057-01: Projected population, by projection scenario, age and sex, as of July <https://bit.ly/2W8bzfN>; Statistics Canada (2021c), Table 12-10-0088-01: Interprovincial and international trade flows, basic prices, summary level <https://bit.ly/3EN0aTR>; The American Petroleum Institute (July 2017), Impact of the Natural Gas and Oil Industry on the US Economy in 2015 <https://bit.ly/2EKrJTT>; Government of Canada, Trade Data Online (October 2021) <https://bit.ly/2EMswnj>.
Definitions
The oil and gas sector is defined as the sum of oil and gas extraction and oil and gas investment. Oil and gas extraction is defined by NAICS subsector 211. It comprises establishments primarily engaged in operating oil and gas field properties. Such activities may include exploration for crude petroleum and natural gas; drilling, completing, and equipping wells; and all other activities in the preparation of oil and gas up to the point of shipment from the producing property. This subsector includes the production of oil, the mining and extraction of oil from oil shale and oil sands, and the production of gas and hydrocarbon liquids through gasification. Oil and gas investment includes capital expenditures on construction, machinery and equipment, and exploration by the oil and gas extraction industry. GDP, or Gross Domestic Product, also referred to as gross value added at basic prices, is the sum of the market values, or prices, of all final goods and services produced in an economy. Output consists primarily of the value of goods and services produced by an industry. Jobs include employee jobs (full-time, part-time, and seasonal) and self-employed jobs. The direct impact of oil and gas extraction is the effects directly attributed to the industry’s production. The direct impact of oil and gas investment is the deliveries by domestic industries to satisfy capital expenditures by the oil and gas extraction industry. Direct impact is measured in terms of GDP, output, and jobs within the oil and gas sector. The indirect impact covers upstream economic activities associated with supplying intermediate inputs (the current expenditures on goods and services used in the production process) to the directly affected industries. The indirect impact is measured in terms of GDP, output, and jobs through the oil and gas sector supply chain, including other key sectors of an economy—in the case of this paper, British Columbia’s economy. We use the American Petroleum Institute definition of the oil and natural gas sector to quantify the goods and services purchased by the sector and the wages paid by the sector. The sector includes conventional oil and gas extraction and nonconventional oil extraction. Support activities for oil and gas extraction include oil and gas engineering construction, petroleum refineries, petroleum and coal product manufacturing (except petroleum refineries); petroleum product wholesaler-distributors, gasoline stations, crude oil and other pipeline transportation, and pipeline transportation of natural gas. The manufacturing sector includes food and non-alcoholic beverages; alcoholic beverages and tobacco products; textile products, clothing, and products of leather and similar materials; wood products; wood pulp, paper, paper products, and paper stock; printed products and services; refined petroleum products (except petrochemicals); chemical products; plastic and rubber products; non-metal mineral products; primary metal products; fabricated metal products; industrial machinery; computers and electronic products; electrical equipment, appliances, and components; transportation equipment; motor vehicle parts; furniture and related products; and other manufactured products.
Share This:


Canada’s Advantage as the World’s Demand for Plastic Continues to Grow