


 CDN NEWS |
  US NEWS


Canada’s record is even stronger when compared with the rise in oil and gas production
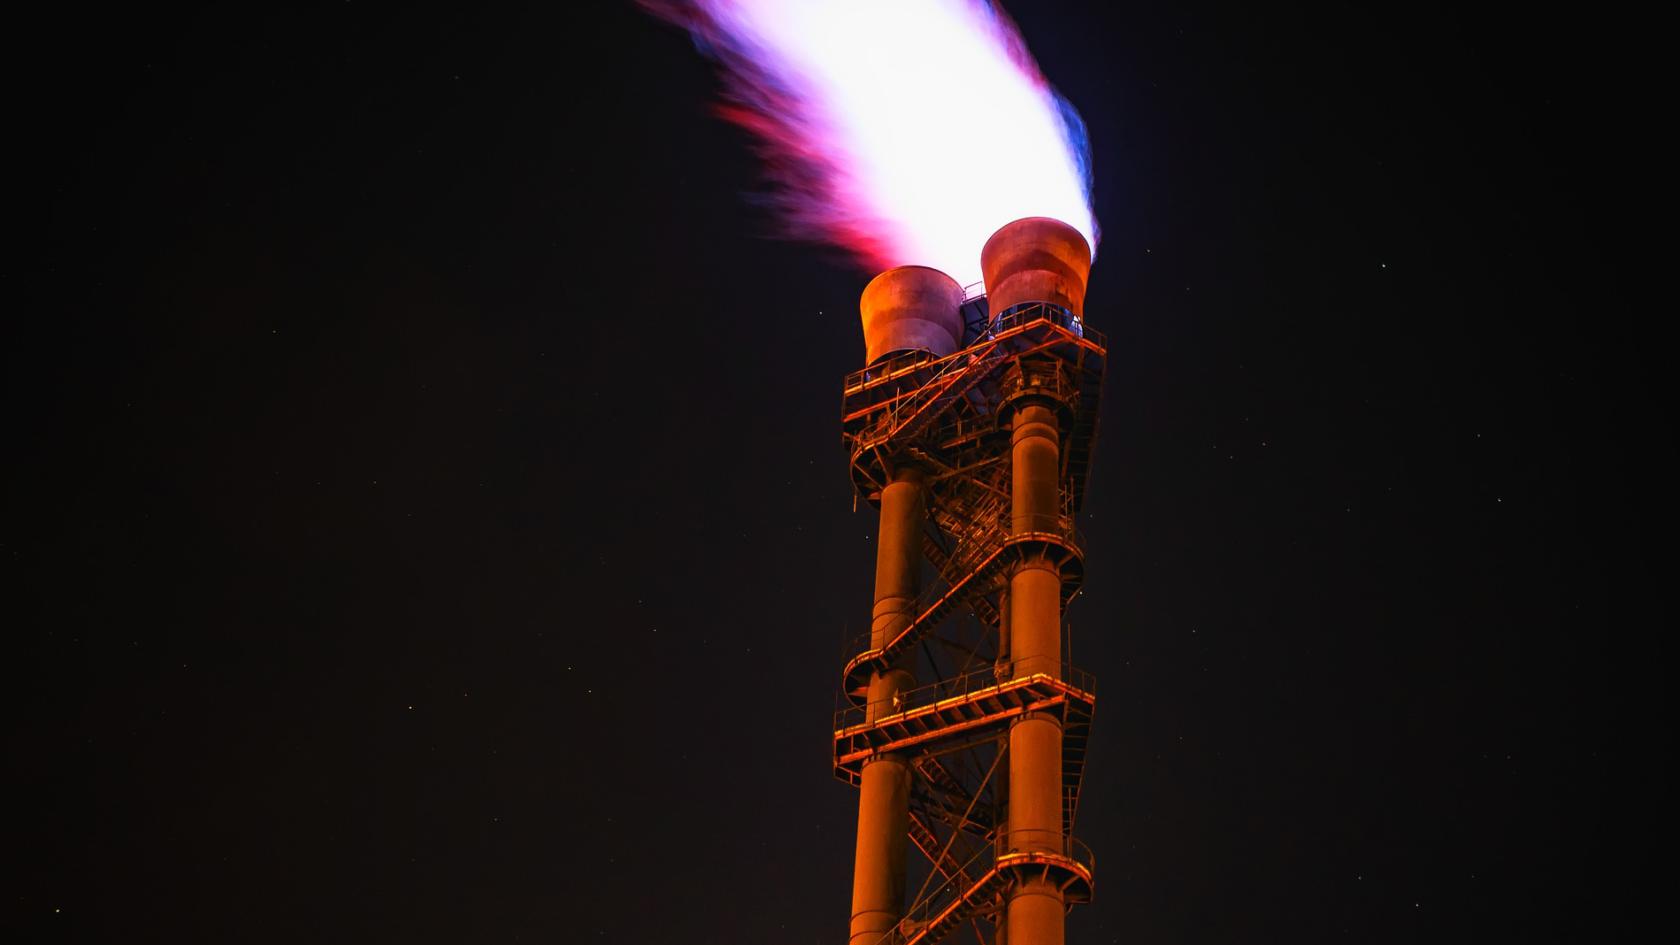
So why should anyone without a career in Canada’s oil and gas sector care about such a mundane industrial process?
One reason is because flaring produces greenhouse gases. Thus, in any debate over Canada’s role in global greenhouse gas emissions, it helps to grasp where Canada is at on this environmental measurement, especially given that Canada has one of the best records.
Some useful background: Natural gas flaring reached 150 billion cubic meters (bcm) annually in 2019, the latest year for which we have worldwide statistics. Canada’s share of that total was just 1.1 bcm or just 0.7 percent of worldwide flaring. In 2019, Canada recorded a 49 percent reduction in flaring compared with just five years previous, in 2014, when flaring volumes amounted to 2.1 bcm annually.
Canada is thus a small proportion of natural gas flaring worldwide. In comparison, the five countries that were the top GHG emitters through flaring (Russia, Iraq, the US, Iran, and Venezuela) accounted for 54 percent of global gas flaring in 2019.
At the very top in absolute terms was Russia, which recorded more flaring than any other country at 23.2 billion cubic metres in 2019. That was nearly five bcm, or 27 percent higher, than in 2014. Three other countries in the top five also recorded higher flaring volumes in 2019 relative to 2014: Iraq was up by 28 percent; the United States, higher by 53 percent; and Iran, up 13 percent. Venezuela’s flaring volumes dropped in real terms and percentage-wise, by four percent, as Venezuelan oil production was substantially reduced. (However, its flaring rose when measured per barrel, for oil.)


Of all thirty countries we measured from World Bank data, 14 countries flared more in 2019 relative to 2014, while 16 countries flared less. We noted the 53 percent increase in natural gas flaring in the United States. Two other countries recorded even more dramatic proportional increases: Syria, with a 140 percent rise in flaring emissions and Libya with a 77 percent rise.
Between 2014 and 2019, beyond Canada’s overall flaring reduction of 49 percent, the others with steep reductions included Kazakhstan (a 60 percent reduction); Indonesia (down 35 percent); Angola, down 33 percent; and Turkmenistan, also down 33 percent.
Canada’s record in reducing natural gas flaring by nearly half is even more impressive relative to the increases in oil and natural gas production during the same five-year period.
For instance, Canada’s oil and natural gas production rose by 25 percent and five percent respectively between 2014 and 2019, all the while pushing emissions down by 49 percent. The United Kingdom, which recorded similar production increases (27 percent more oil and five percent more natural gas), recorded just an 18 percent decrease in flaring.
There is one last statistic to be aware of. Let’s look at gas flaring per barrel of oil produced. By this measurement, the worst flaring performers were Argentina (up 34 percent), Syria (higher by 81 percent) and Venezuela (up by 173 percent).
In contrast, per barrel of oil produced, Brazil’s flaring was down 40 percent, Canada declined by 58 percent, and Kazakhstan’s flaring dropped 65 percent.
Mark Milke and Ven Venkatachalam are with the Canadian Energy Centre, an Alberta government corporation funded in part by carbon taxes. They are authors of International Comparisons of Gas Flaring, 2021 edition.
Share This:


