


 CDN NEWS |
  US NEWS








Each week, XI Technologies scans its unique combination of enhanced industry data to provide trends and insights that have value for professionals doing business in the WCSB. If you’d like to receive our Wednesday Word to the Wise in your inbox, subscribe here.
Last month, the Canadian Association of Energy Contractors (CAOEC) published an updated drilling forecast adjustment for 2022. Following a robust first quarter, they raised their forecast to 6,902 wells to be drilled this year, up 6.9 percent from its original forecast in November 2021. With this news, we thought we’d take a closer look at the drilling data available in OffsetAnalyst to get a sense of the drilling potential for the rest of 2022. To do so, we looked at data for well licenses issued in the last two years, as licenses can be the most telling signal of prospective drilling.
Note: This data includes wells with licenses dated between June 1, 2020, and May 30, 2022. Well counts are based on the number of distinct license numbers in the data set. Well statuses are derived from government definitions and assigned statuses.
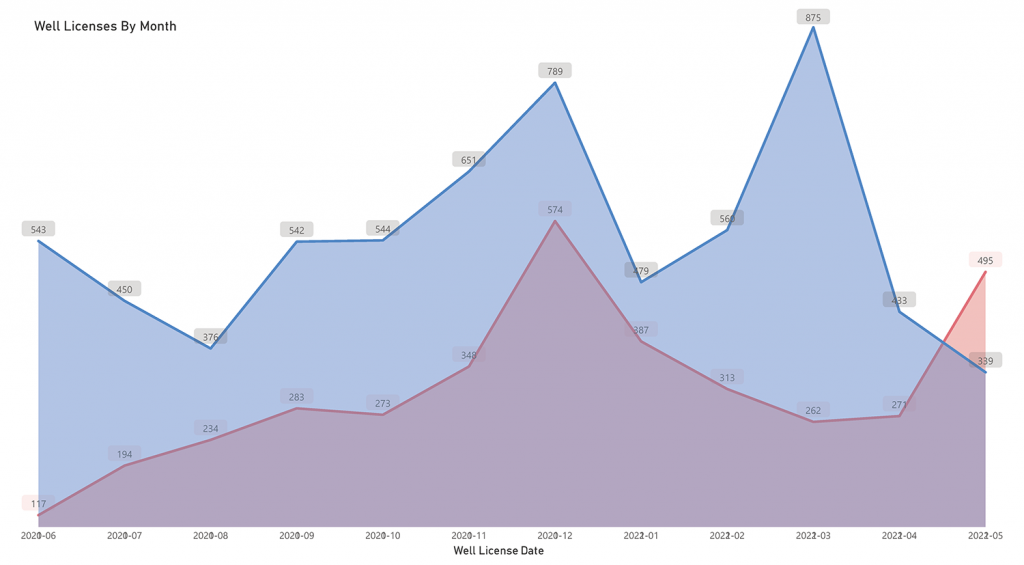
Monthly Well License Activity Comparison
The data below shows the comparison between well license activity from 2020-21 (red) to 2021-22 (blue). The increase is obvious throughout the past 12 months, especially with the recent peak in March 2022 compared to the corresponding slump in 2021.
Areas to Expect Drilling Activity
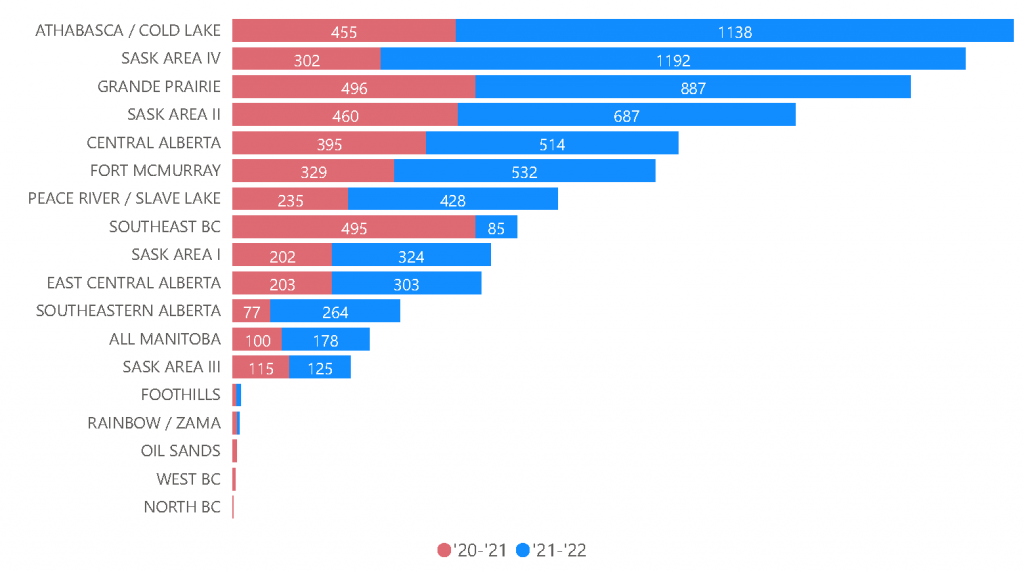
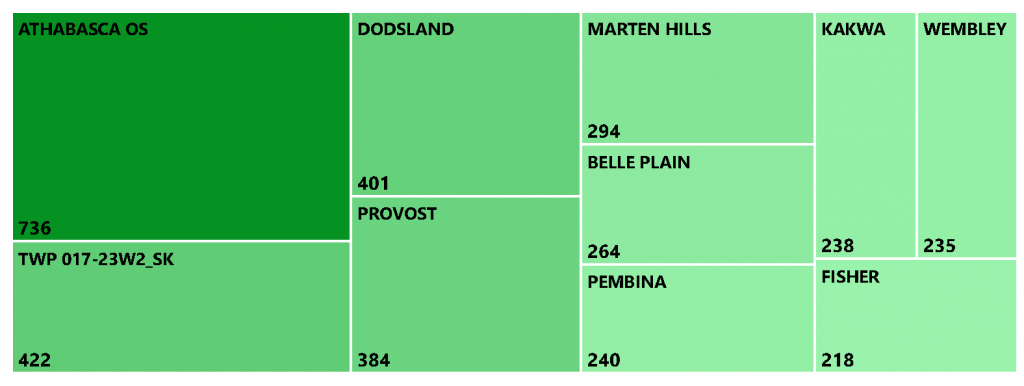
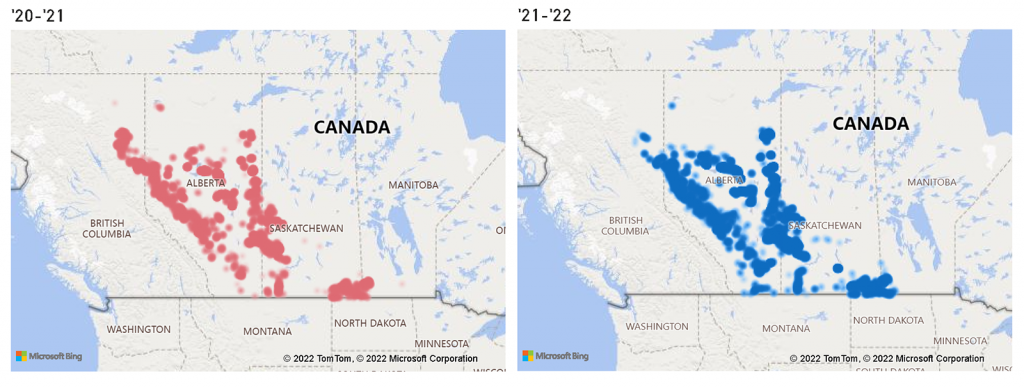
The data below shows where well licenses have been issued in the past two years, which tells us where to expect activity for the rest of the year.
Licenses by region
Top 10 fields
Concentration – Heat Maps
Companies to Watch
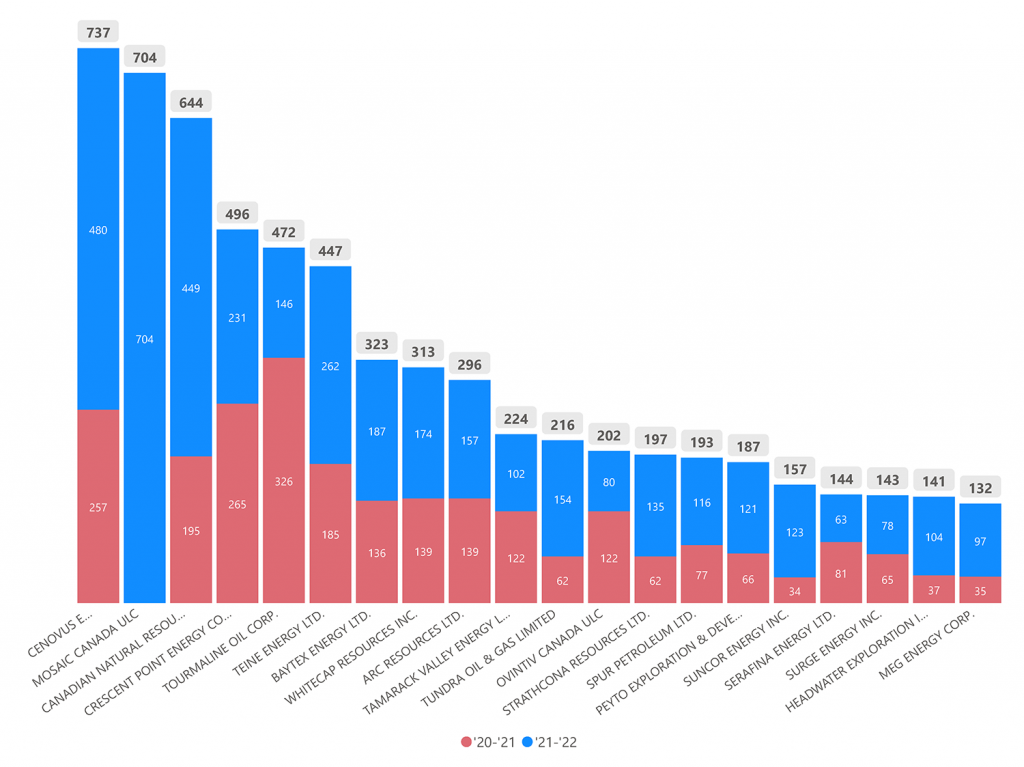
The data below charts the top 20 companies with well licenses in the past two years (red 2020-21, blue 2021-22). This should give us a sense of which companies are most likely to drill in 2022.
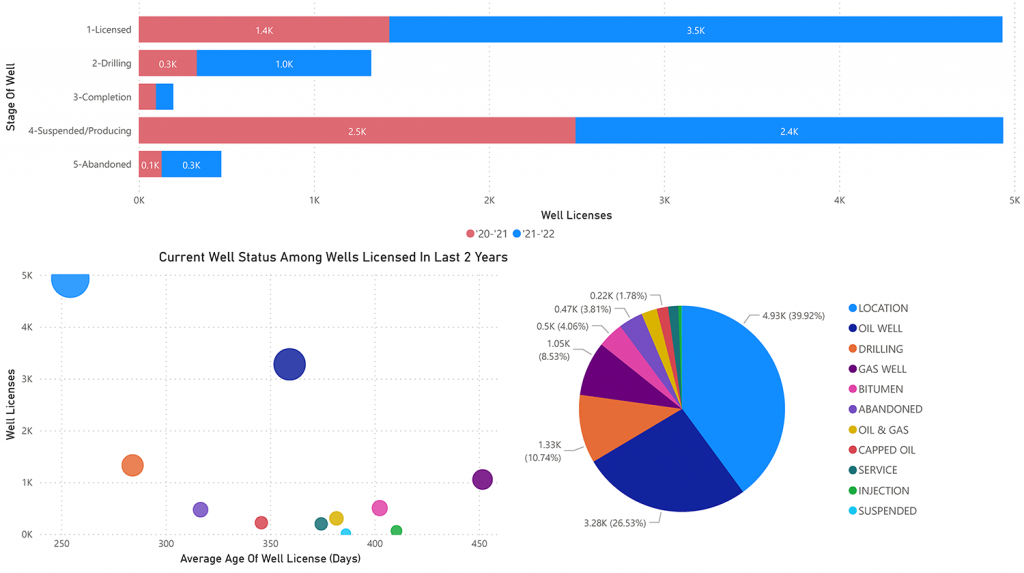
Current Status of Well Licenses Issued Since May 2020
Another strong indicator of future activity is to look at the recent licenses that have been drilled. The data below provides a brief rundown of the where in the lifecycle those wells are currently.
By viewing the available well license data, drillers can get a good sense of what the drilling forecast will be and how to best plan. Those looking for more robust drill research and planning data such as that found in this article can get it from XI Technologies’ OffsetAnalyst software, which you can learn more about by visiting this link or contacting us for more information. To read about how a client used XI’s Drill Research database to reduce their research time and amplify their informed decision-making, download our case study.
Share This:























OPINION: The Iran War Energy Crisis is Just Getting Started: Bousso