


 CDN NEWS |
  US NEWS


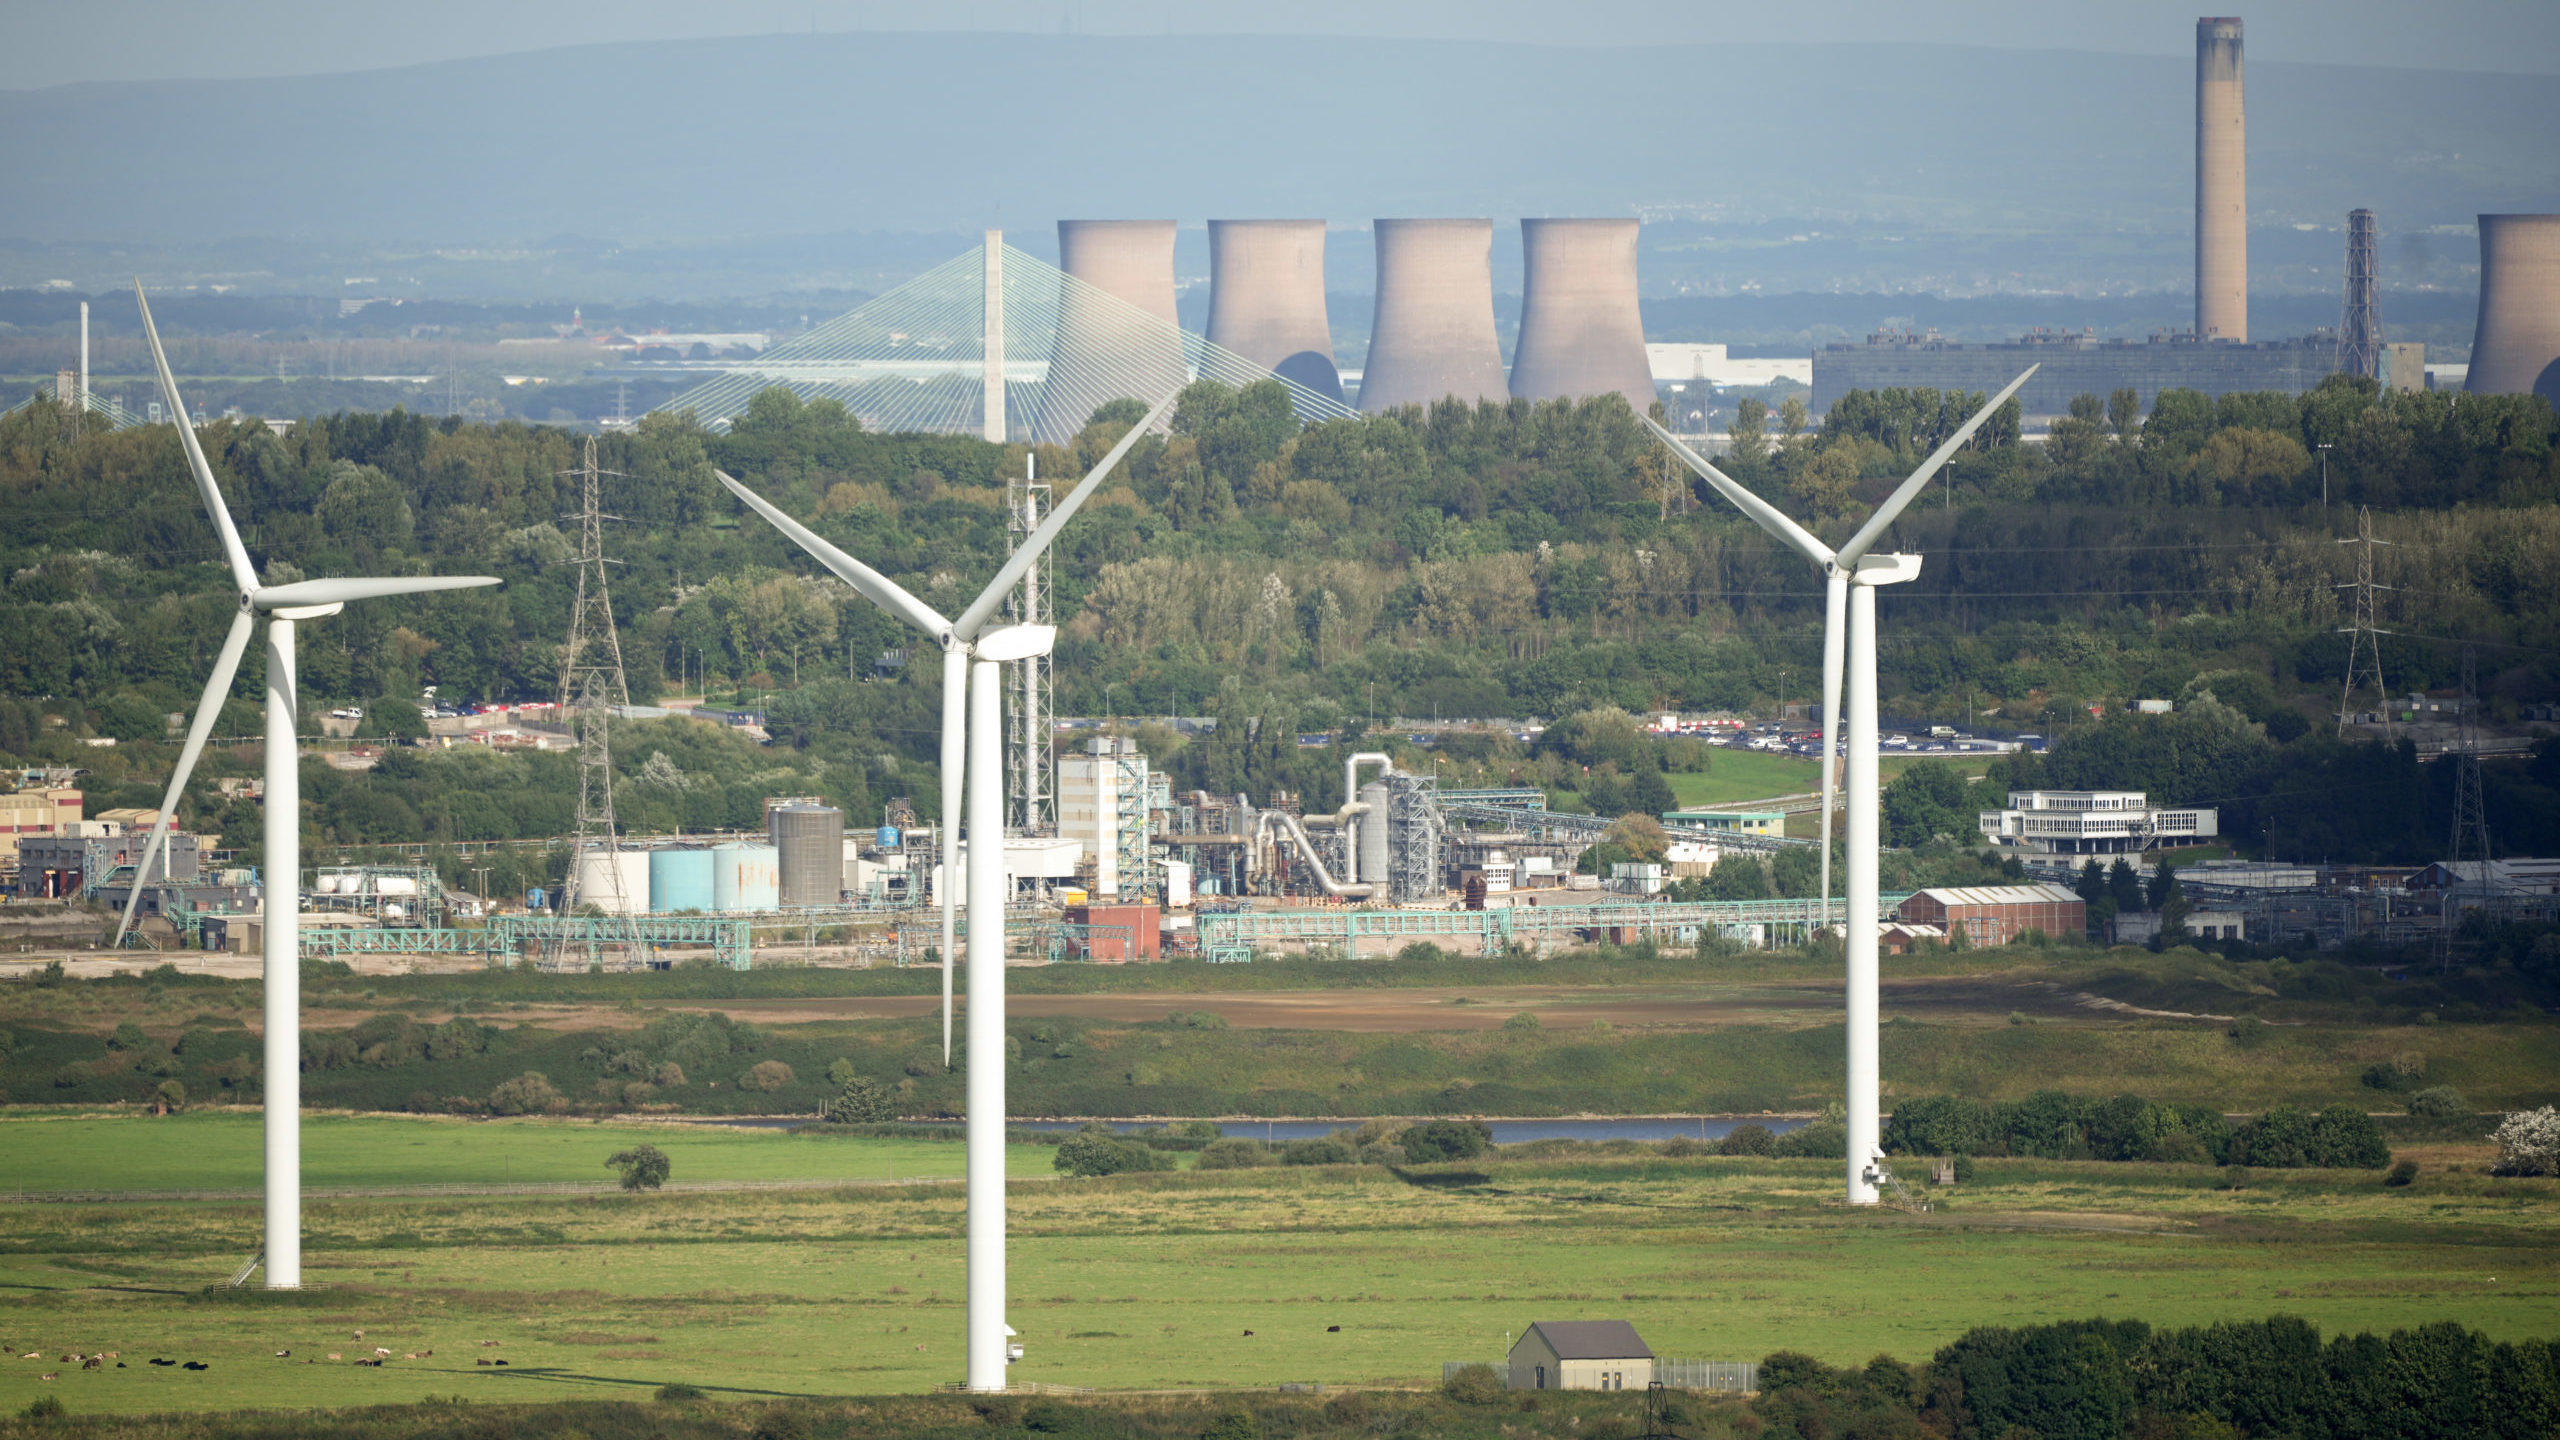
Europe’s electricity prices have soared as nations lean more heavily on renewables to replace fossil fuels
Download the PDF here
Download the charts here
Executive Summary
Poverty and energy are not often studied as linked concepts, but economic growth in developed and developing countries is partly dependent on the availability of reliable and affordable forms of energy for households and industries. In this study, we focus on energy poverty.
Energy poverty is defined as the “inability to attain socially and materially necessitated levels of domestic energy services” (Kyprianou, et al., 2019). Energy poverty can occur due to high energy costs or low incomes, or both. A useful example is Spain, where the recent rise in electricity prices is due to a perfect storm of reduced energy production from renewables combined with increased demand. As noted by one Spanish newspaper:
The price of energy has risen this month for all companies due to several factors. Because of the recent heavy storms and snowfall, there is less energy production from cheaper and renewable sources like wind and solar power. There is less supply. If you add that to the increased demand due to the colder temperatures, it causes the prices to increase. (Barcelona-Metropolitan, 2021.)
The problem of energy poverty affects tens of millions in Europe, with nearly 34 million Europeans unable to keep their homes adequately warm in 2018. Energy poverty is thus a significant challenge for the European Union (Bouzarovski and Thomson, 2020).
The change in European power generation: Renewables up and fossil fuels down
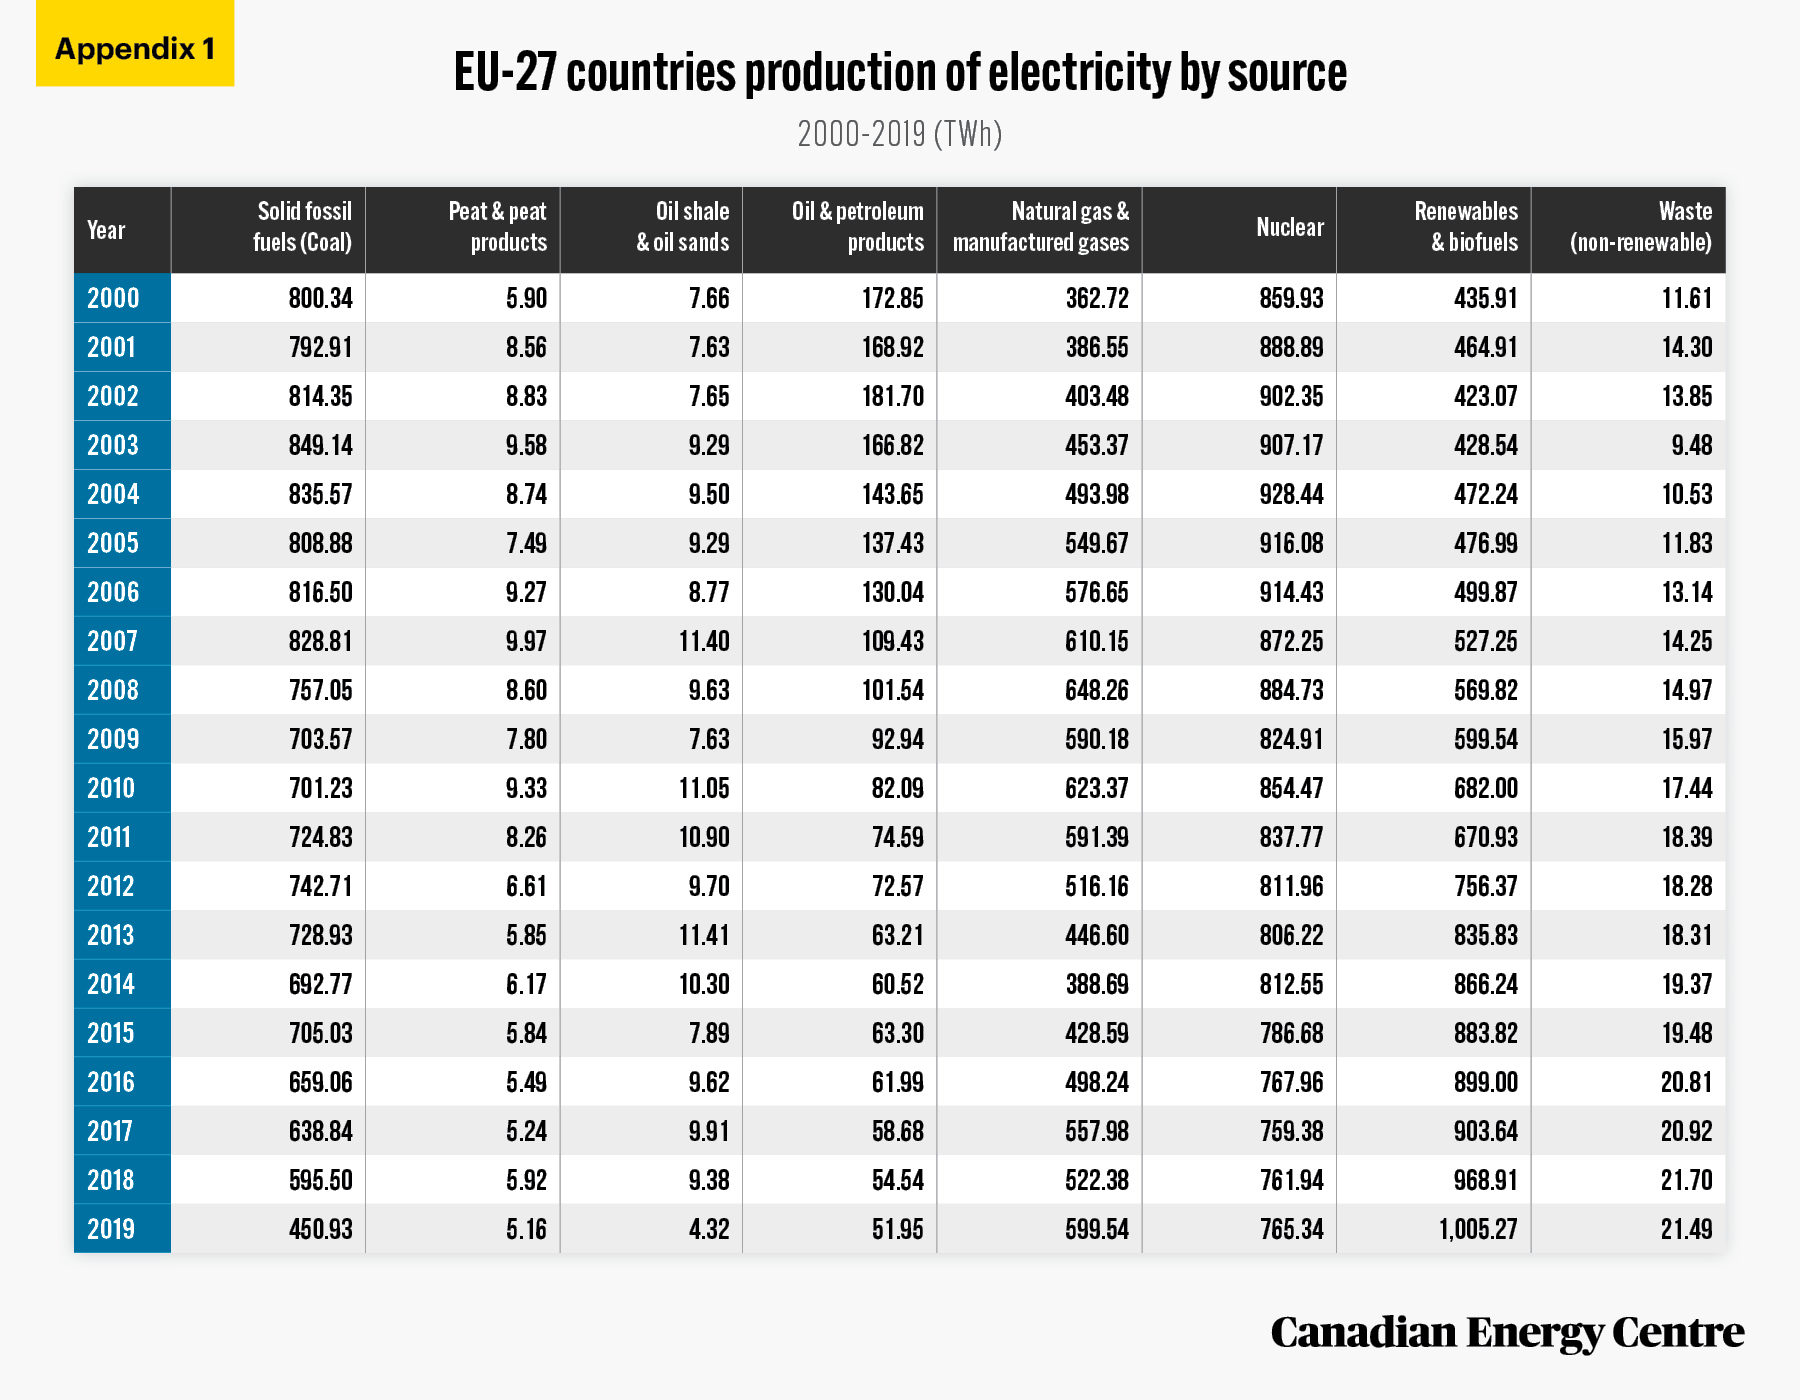
Between 2000 and 2019, renewable power generation in Europe has increased significantly with traditional coal-fired power declining, which in part explains higher power prices in recent years.
- In 2000, coal-fired electricity was responsible for 30.1 per cent of EU electricity with natural gas at 13.7 per cent, oil at 6.5 per cent, nuclear at 32.4 per cent, renewables at 16.4 per cent and “other” at 0.9 per cent.
- As of 2019, coal-fired electricity, was responsible for 15.5 per cent of EU electricity or half what it was 19 years earlier. Natural gas was higher at 20.6 per cent, oil was 1.8 per cent, nuclear at 26.4 per cent, and renewables more than doubled to 34.6 per cent while other sources accounted for 1.1 per cent of Europe’s electrical power (see Executive Summary Figure 1a).

Source: Author’s calculation from Eurostat Database (2021).
- Separated and totaled by fossil fuels, in 2000, 50.3 per cent of electricity in the EU was generated by fossil fuels and that declined to 38 per cent as of 2019. Renewables grew to 34.6 per cent of EU electricity production over the same period (see Executive Summary Figure 1b).

Source: Author’s calculation from Eurostat Database (2021).
The results on prices
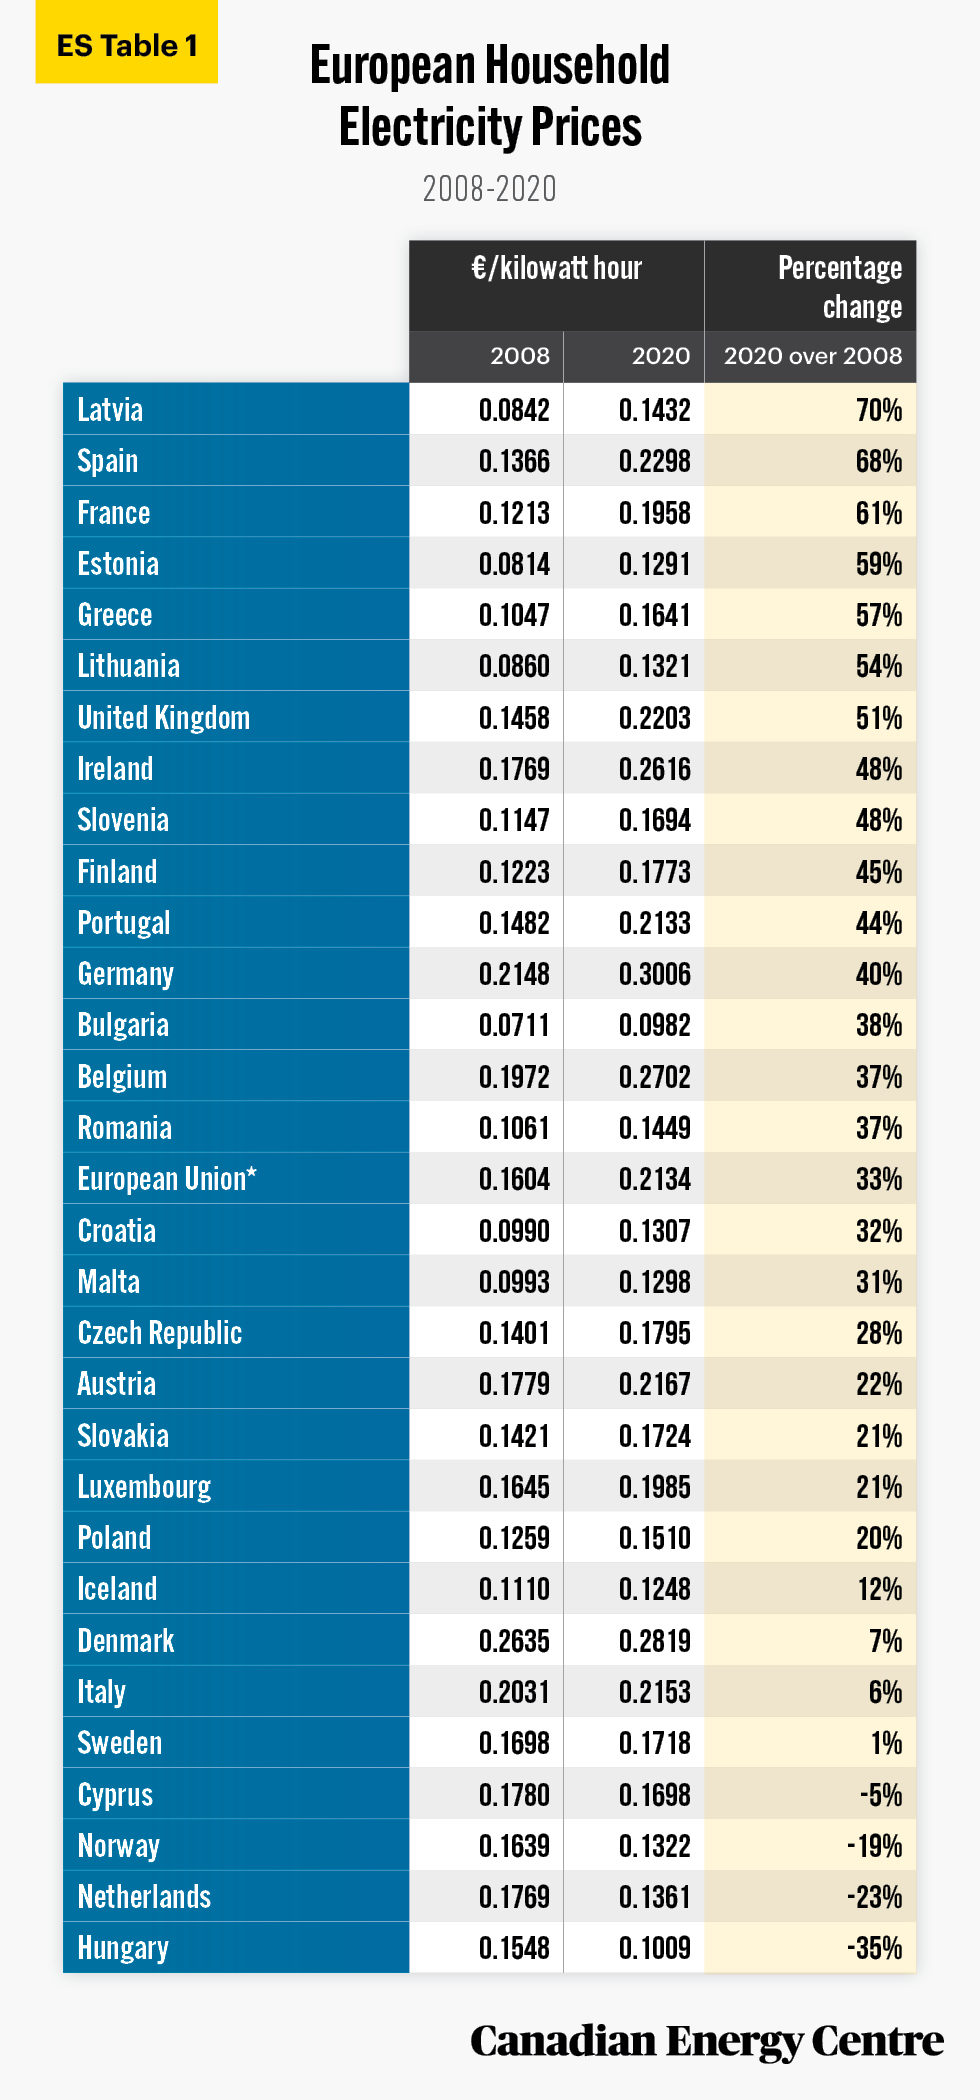
Electricity end-user prices for households differ significantly in the EU member states. Multiple factors influence electricity prices including domestic regulations, taxes, and the energy source used in electricity generation. The most significant rise in household electricity prices between 2008 and 2020 occurred in France (61% higher), Spain (68% higher) and Latvia (70% higher) (see Executive Summary Table 1)
Source: Author’s calculation from Eurostat Database (2021).
Energy poverty in Europe and the United Kingdom
The European Union measures energy poverty by using the indicator developed by EU Energy Poverty Observatory (EPOV). It provides four different primary indicators for energy poverty, of which two are based on self-reported experiences by household members. The other two are calculated using household income and/or energy expenditure data.
- Using household income and/or energy expenditure data,¹ European energy poverty indicators have not been updated since 2015, but in that year, the proportion of European Union households that faced energy poverty was 16 per cent, with the United Kingdom at 19 per cent.
- Using self-reporting data on utility bills and the ability to keep one’s house warm as a stand-alone indicator,² as of 2018, 6.8 per cent of people living in private households across the EU (30.3 million people) were unable to pay their utility bills, and 7.3 per cent EU households were unable to keep their house warm; the figures for the United Kingdom were 5.4 per cent for both indicators in 2018.
1. Calculated using household income and/or energy expenditure data refers to expenditure-based indicators -M/2: Absolute (equivalised) energy expenditure below half the national median. 2M: Share of (equivalised) energy expenditure (compared to equivalised disposable income) above twice the national median.
2. Self reported / consensual-based indicators: Ability to keep home adequately warm. This EU survey asked households if they could afford to keep their home adequately warm. The self-reporting on arrears concerned utility bills and if in the most recent twelve months, if the household ha been in arrears, i.e., had been unable to pay the utility bills (heating, electricity, gas, water, etc.) of the main dwelling on time due to financial difficulties.
Our estimates of Europe’s high-cost electricity
Given the European Union’s self-reporting of some energy poverty measurements, we have designed an alternate measurement. Our measurement tracks the increase in European electricity costs by country, compared with the increase in median household income. The measurement is for 2008 to 2020 for electricity costs and for 2008 to 2019 for household median income.
Given that European countries vary widely in median household income, in part because of communism in the 20th century, its collapse, and how many central and eastern European countries were in effect “starting over” in the 1990s, we have divided European countries into those with less than €15,000 in median household income in 2008, and those with more than €15,000 in median household income in 2008.
This is because we would expect, for example, median household income growth in Poland (€4,154 in 2008) and Romania (€1,954 in 2008) to easily outpace any growth in electricity prices in the years examined because those countries (and others) started with very low median household incomes.
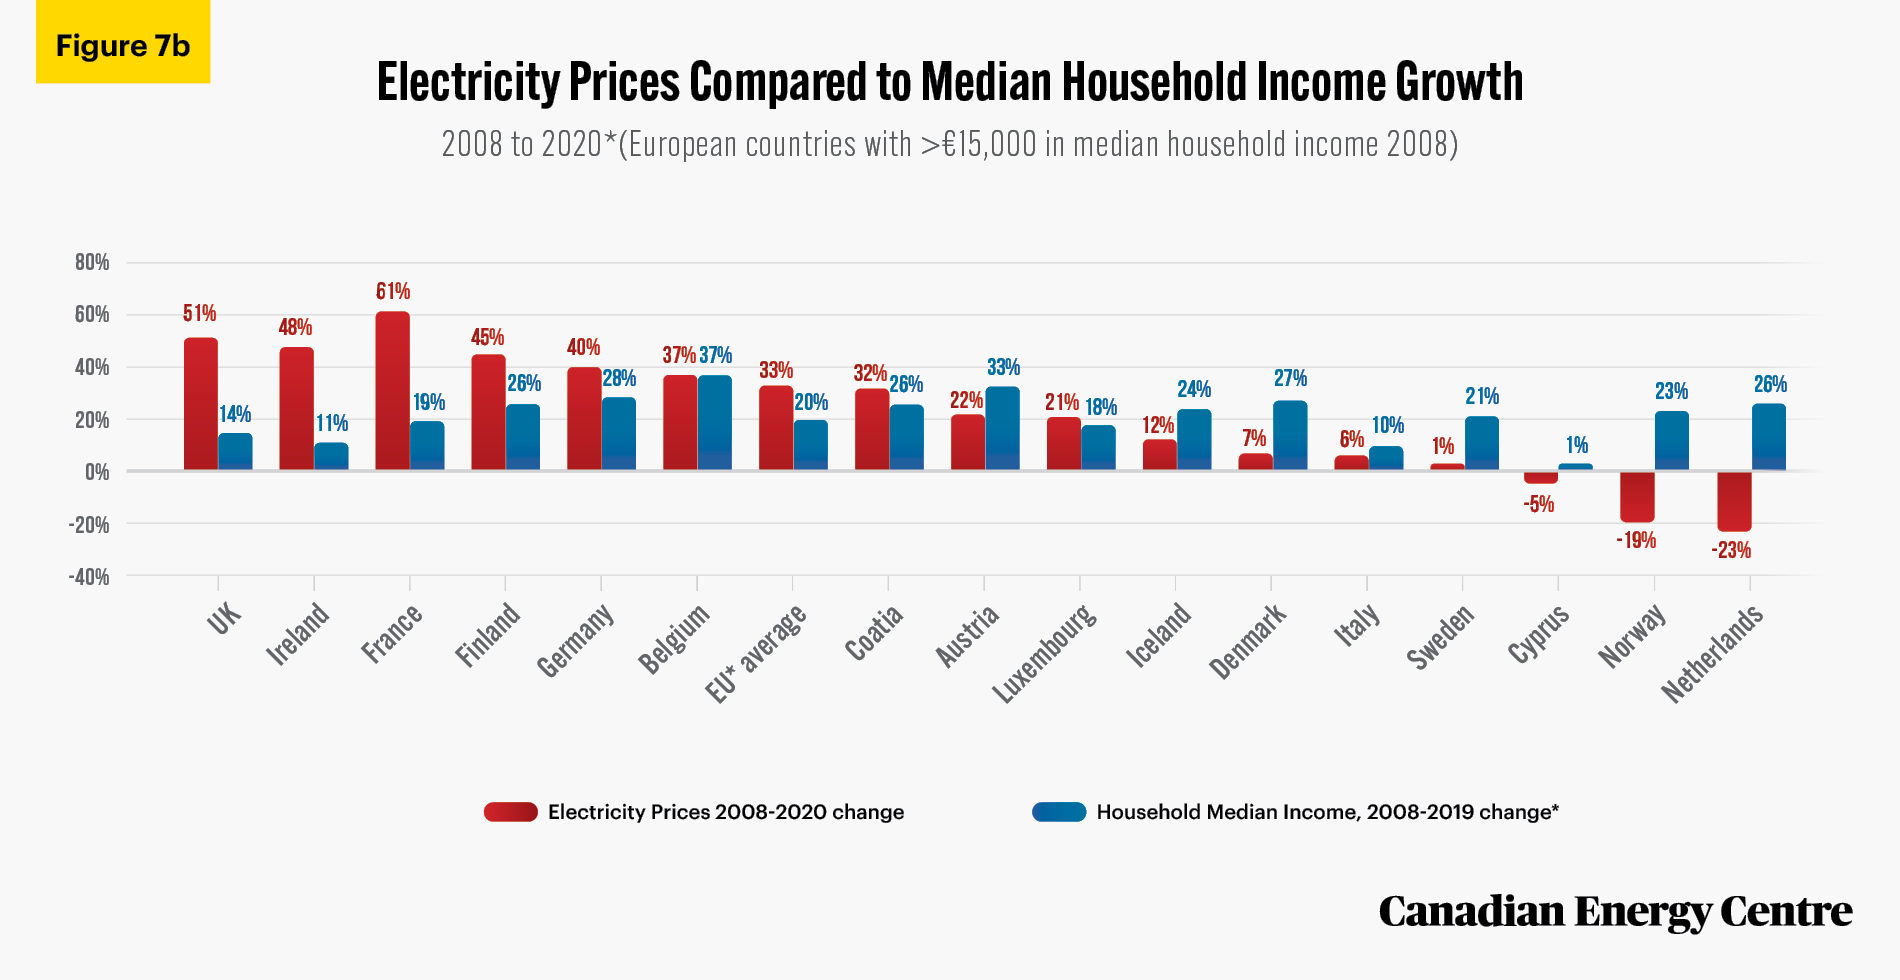
Conversely, those with already high median household incomes in 2008 such as the United Kingdom (€18,766) and Ireland (€22,995) would be unlikely to see as dramatic a rise in incomes, given they were already developed economies. That means any rise in electricity prices beyond household median income growth could be more difficult for households to finance.
UK and Ireland see 51% and 48% rise in power bills with marginal increases in median income
The data in fact shows exactly that for many European countries for the 2008 to 2019/2020 period. For example:
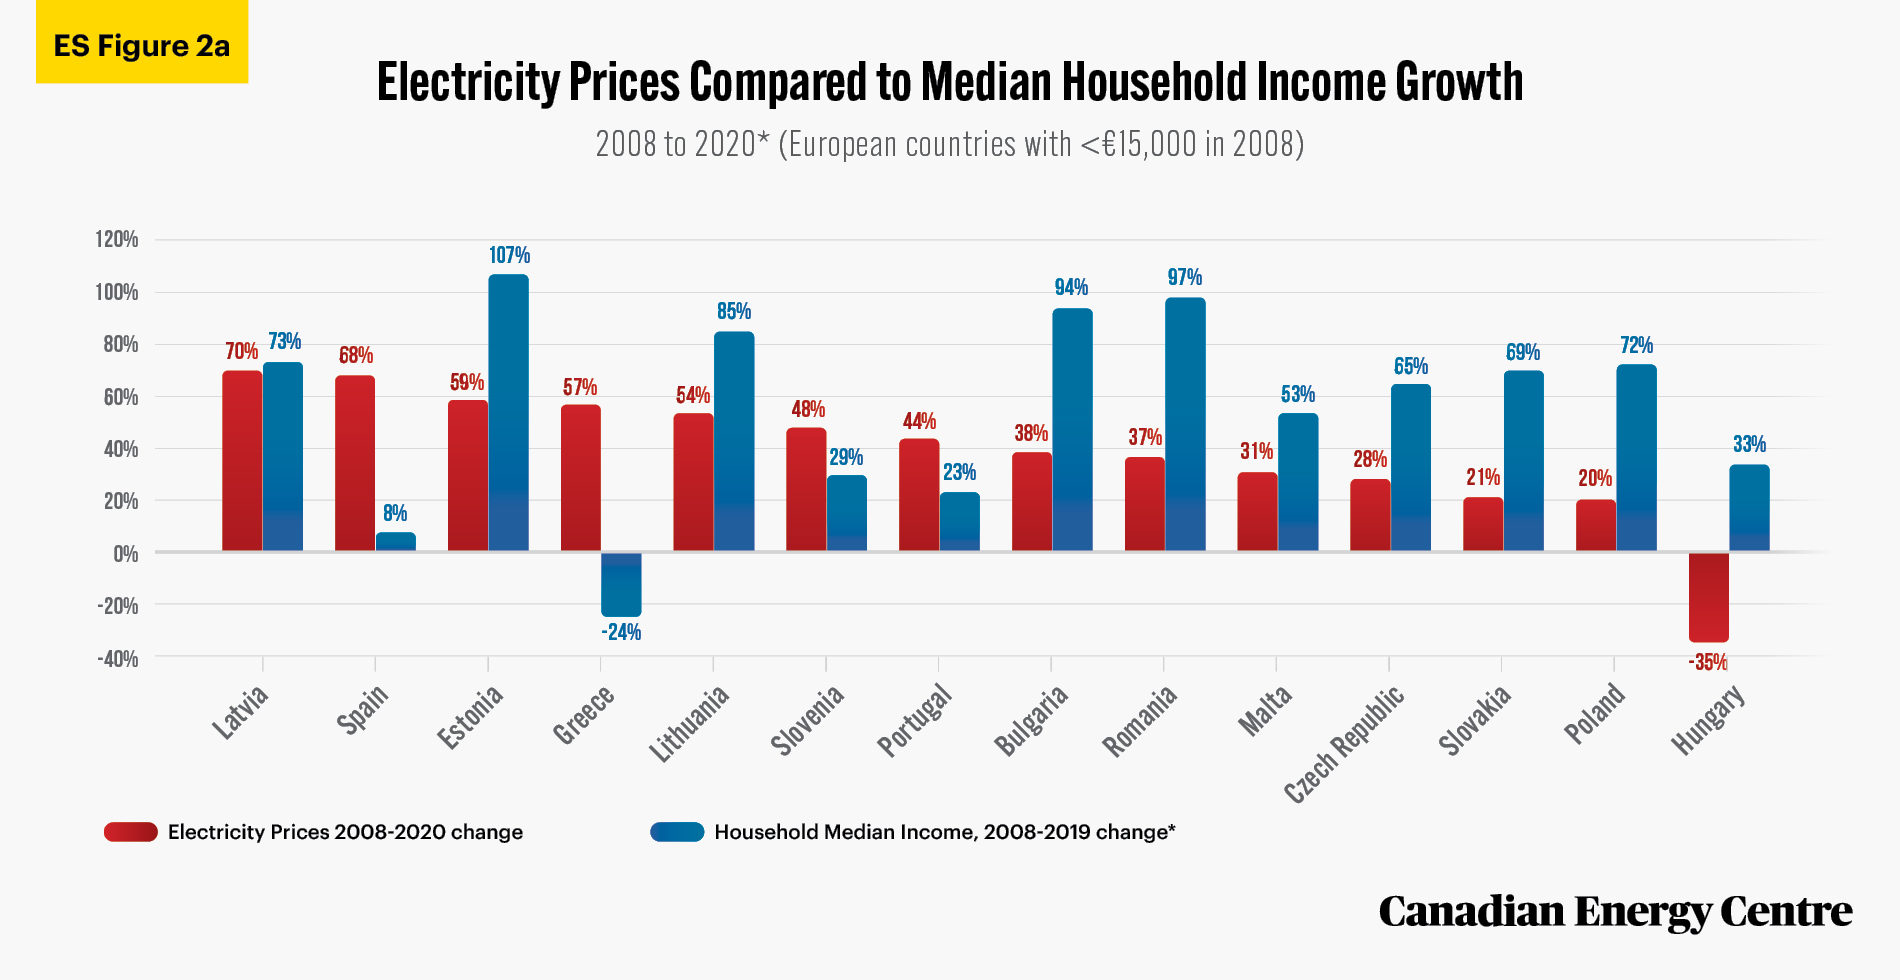
• Electricity prices in Poland rose by 20 per cent but household median income increased by 72 per cent, thus making the rise in power prices manageable. The same was true of many other nations with low median household income in 2008: Bulgaria, Romania, the Czech Republic, and Slovakia (see Executive Summary Figure 2a).
Source: Authors’ calculation from Eurostat database.
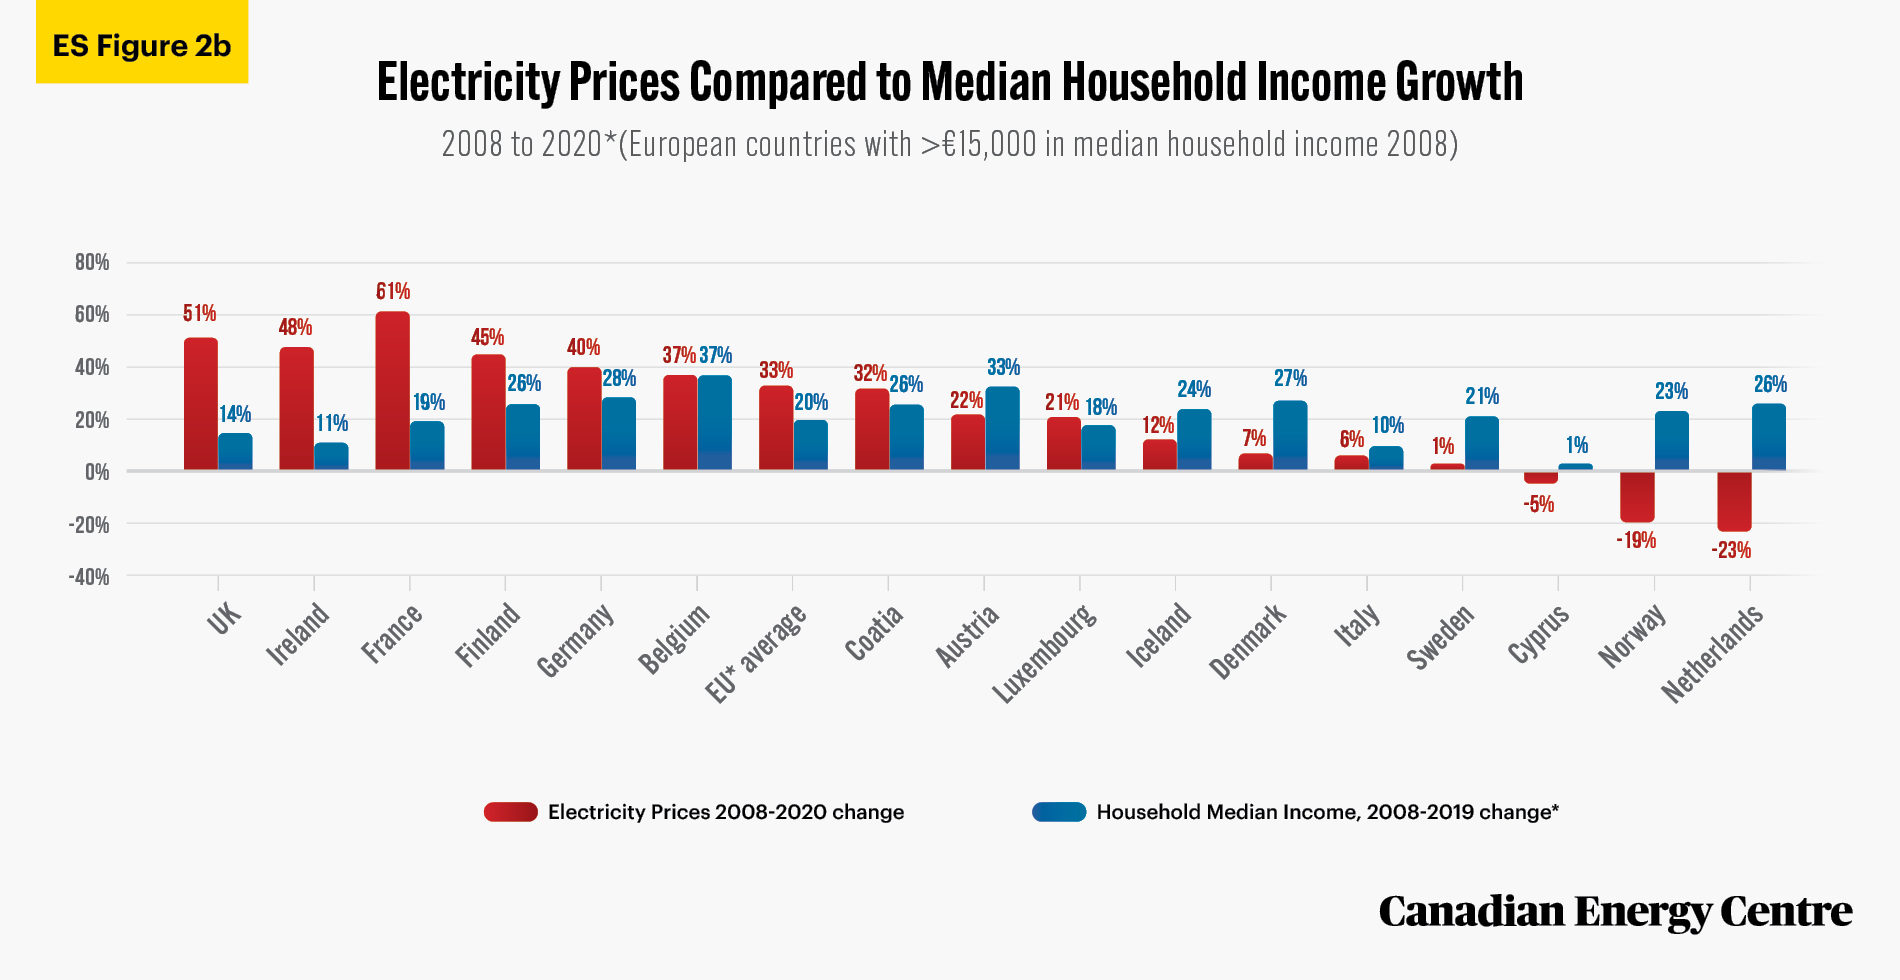
- In contrast, in the United Kingdom and Ireland, electricity prices soared by 51 per cent and 48 per cent, respectively while household median income rose by just four per cent and one per cent, respectively (see Executive Summary Figure 2b). That split between significantly higher power bills and an almost status-quo reality on median household incomes helps explain why some European (or United Kingdom) households have found it increasingly difficult to pay their utility bills.
- The most challenging combination though is where a country already had low median household income in 2008 and saw little income growth over the next 11 years, but experienced a dramatic rise in the cost of power. This was the case for Spain, where electricity prices soared by 68 per cent between 2008 and 2020 with median household income rising by just eight per cent (by 2019) (see Executive Summary Figure 2a).
Source: Authors’ calculation from Eurostat database.
Energy transition issues
At the core of the European Union’s high power prices is a swift energy transition framework that has not taken into account the reality that not all energy sources contain the same energy density, and nor are they as reliable.
To understand why, consider the insights from one of the world’s leading experts on energy transitions, University of Manitoba professor of the environment (emeritus) Vaclav Smil, who has noted that “the reality of energy density (that is, how much energy can be extracted from a unit of raw material) in various forms of energy sources (be they oil, natural gas, coal, wind, solar and others) must be accounted for as part of any assumed transition” (Smil, 2017).
In 2018, Science magazine cited Smil’s point that energy transitions are normally transitions away from “relatively weak, unwieldy energy sources for those that pack a more concentrated punch” (Voosen, 2018). Similarly, as Smil wrote in 2020, “Designing hypothetical roadmaps outlining complete elimination of fossil carbon from the global energy supply by 2050 is nothing but an exercise in wishful thinking that ignores fundamental physical realities.” In other words, before abandoning something as a source of energy, we must consider how little (or much) of that source it takes to produce the outcomes we need (Smil, 2020).
Lessons from Europe for Canada
The core question is what lessons might be in store for Canada given that substantial changes are proposed on everything from how Canadians might heat their homes (more electrification) to higher carbon taxes and other policy, regulatory and legislative changes that discourage the consumption of hydrocarbons. There is much discussion about “transitions” to new energy sources, but few studies consider details on what consumers might be forced to spend in efforts to transition. This is best visible in Europe, where households increasingly face challenges in financing basic energy needs due to the increased cost of electricity and other forms of energy.
Introduction: Energy Scarcity, Poverty and Transitions
Energy transitions
This paper explores the cost of attempts to order up energy transitions in Europe and the impact of the same on household energy costs, with the unintended consequence that is now evident: increasing energy poverty across many countries in Europe. This has obvious relevance to Canada where a transition not only from coal but also natural gas and oil and to electrification via renewables is assumed possible. As readers will note, the impact of the energy transition on retail prices of electricity is not uniform. It differs by country and is in part influenced by policy decisions and regulatory frameworks.
At the core of the European Union’s high power prices is a rushed transition framework that has not taken into account the reality that not all energy sources contain the same density, and nor are they as reliable.
To understand why, consider the insights from one of the world’s leading experts on energy transitions, University of Manitoba professor of the environment (emeritus) Vaclav Smil, who has noted that “the reality of energy density (that is, how much energy can be extracted from a unit of raw material) in various forms of energy sources (be they oil, natural gas, coal, wind, solar and others) must be accounted for as part of any assumed transition” (Smil, 2017).
In 2018, Science magazine cited Smil’s point that energy transitions are normally transitions away from “relatively weak, unwieldy energy sources for those that pack a more concentrated punch.” Instead, as Smil also remarked, trying to reverse that practical attention to energy density by moving to all-renewable sources of energy could require countries, to use his words from Science, to “devote 100 or even 1000 times more land area to energy production than today… [which] could have enormous negative impacts on agriculture, biodiversity, and environmental quality” (Voosen, 2018).
Similarly, as Smil wrote in 2020, “Designing hypothetical roadmaps outlining complete elimination of fossil carbon from the global energy supply by 2050 is nothing but an exercise in wishful thinking that ignores fundamental physical realities.” In other words, before abandoning something as a source of energy, we must consider how little (or much) of that source it takes to produce the outcomes we need (Smil, 2020).
Energy scarcity and poverty
Poverty and energy are not often studied as linked concepts, but economic growth in developed and developing countries is partly dependent on the availability of reliable and affordable forms of energy for households and industries. Thus, both energy scarcity and energy poverty matter, though in this study we will examine the latter problem.
Briefly, energy poverty is defined as the “inability to attain socially and materially necessitated levels of domestic energy services” (Kyprianou et al., 2019). This can occur due to high energy cost or low incomes, or both.
A variety of statistics exist to give some sense of the problem. The International Energy Agency (IEA) estimates that close to 770 million people worldwide lack access to electricity (IEA, 2020). That is a problem of energy scarcity. However, in developed countries, energy is normally widely available but becoming increasingly expensive. Thus, consumers in wealthier countries have access to electricity — albeit not without interruptions due to brownouts and blackouts — but face higher electricity costs due the to transition away from affordable fossil fuels. As the European Union notes:
[A]dequate warmth, cooling, lighting, and energy to power appliances are essential services that underpin a decent standard of living and health. Access to energy services is essential for social inclusion (European Union, 2020a).
This has consequences. Recent protests in Europe (BBC, 2021), where consumers and governments from Spain to the United Kingdom grapple with rising electricity costs, have placed the twin issues of reliable and affordable energy into focus. One example is the recent rise in electricity prices in Spain as noted by the Spanish newspaper, Barcelona-Metropolitan (2021):
The price of energy has risen this month for all companies due to several factors. Because of the recent heavy storms and snowfall, there is less energy production from cheaper and renewable sources like wind and solar power. There is less supply. If you add that to the increased demand due to the colder temperatures, it causes the prices to increase.
The United Kingdom was the first country to identify and develop a policy to tackle energy poverty. (Thomson et.al.,2017). In North America, studies have found that as a percentage of incomes, poor households spend four times as much on utilities compared to higher-income cohorts. The low-income family spends 8.1 per cent of their income on energy costs on average, compared to 2.3 per cent for non-low-income households (Drehobl, et al., 2020). In Europe, with nearly 34 million citizens unable to keep their homes adequately warm in 2018, energy poverty is a significant challenge (Bouzarovski and Thomson, 2020).
Overview of the European Union Electricity Market
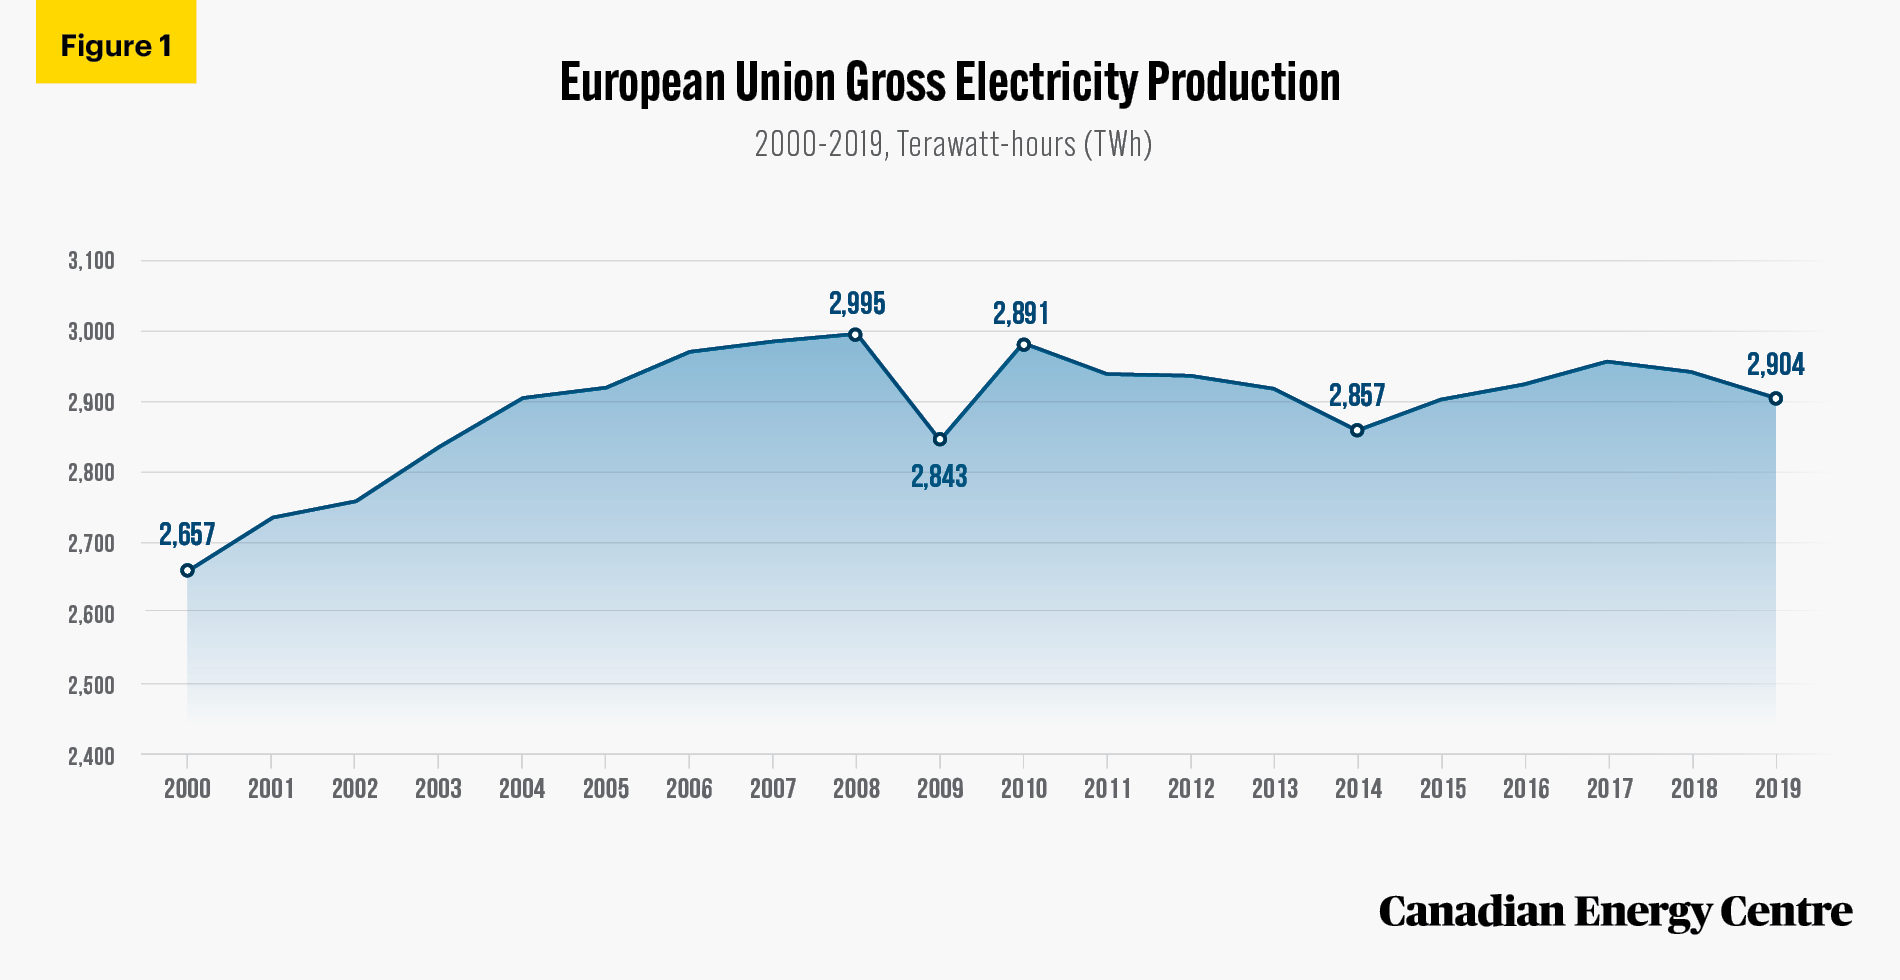
The European Union (EU) is composed of 27 countries, with a population of approximately 450 million and a GDP of US$15.6 trillion in 2019 (World Bank, undated). Gross electricity production³ in Europe increased from 2,657-terawatt hours (TWh) in 2000 to a high of 2,995 TWh in 2008, decreasing during the Great Recession but recovering thereafter to reach 2,904 TWh in 2019 (see Figure 1), the latest year for which data is available.
3. Electricity is produced as a primary or secondary product in power plants. The total amount of electricity produced is referred to as gross electricity production.
Source: Eurostat Database (2021).
The change in European power generation: Renewables up and fossil fuels down
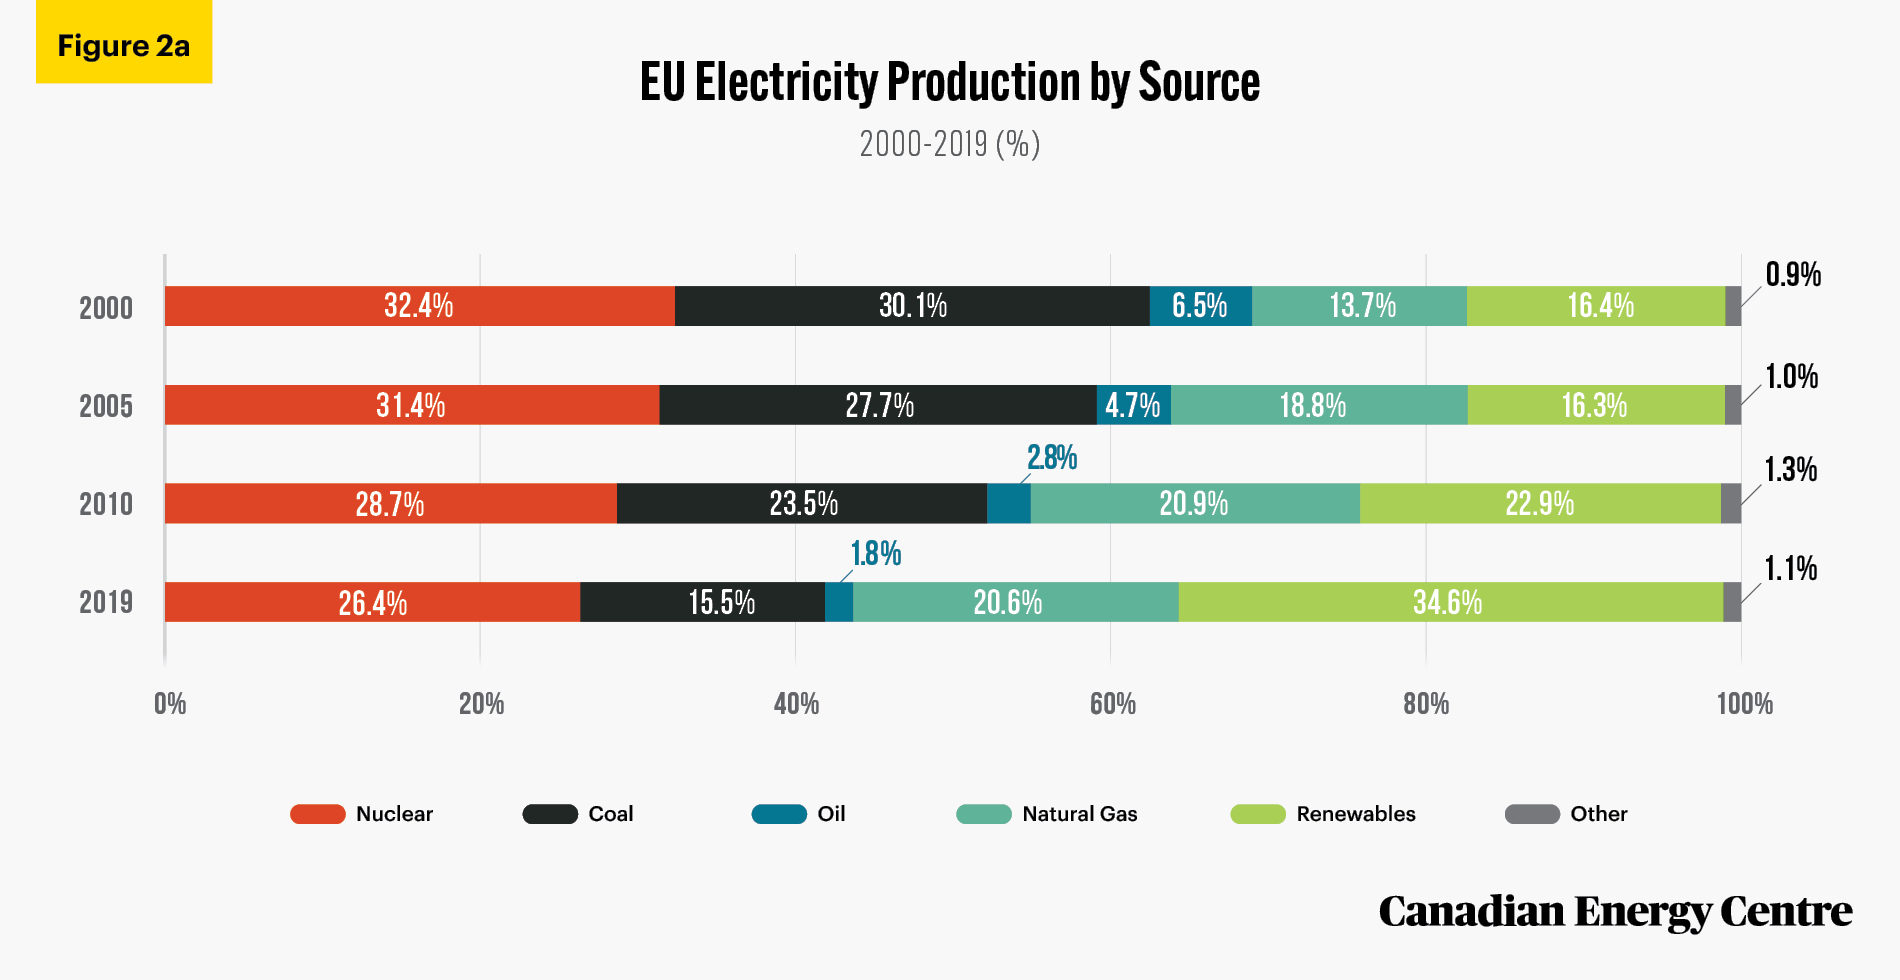
In 2000, coal-fired electricity was responsible for 30.1 per cent of EU electricity, with natural gas at 13.7 per cent, oil at 6.5 per cent, nuclear at 32.4 per cent, renewables at 16.4 per cent and “other” at 0.9 per cent. As of 2019, coal-fired electricity was responsible for 15.5 per cent of EU electricity, or half what it was 19 years earlier. Natural gas was higher at 20.6 per cent, oil was 1.8 per cent, nuclear at 26.4 per cent, and renewables more than doubled to 34.6 per cent while other sources accounted for 1.1 per cent of Europe’s electrical power (see Figure 2a).
Source: Author’s calculation from Eurostat Database (2021).
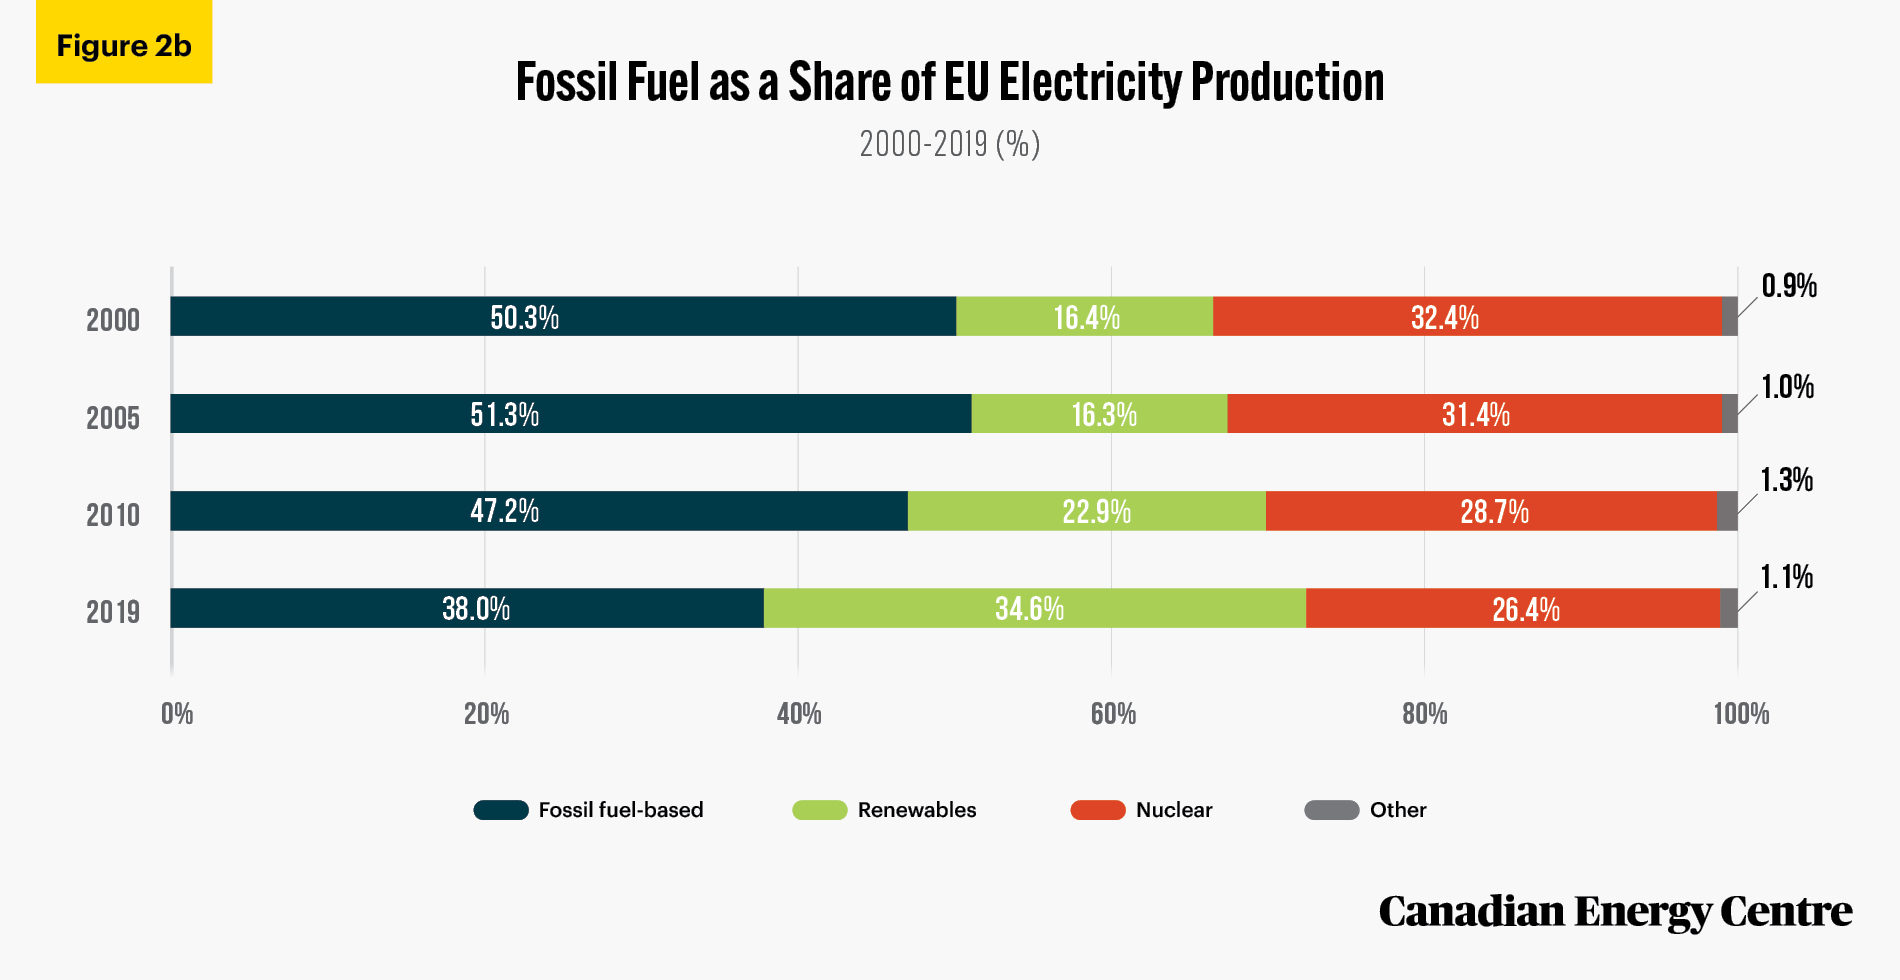
Separated and totaled by fossil fuels, in 2000, 50.3 per cent of the electricity in the EU was generated by fossil fuels, and that declined to 38 per cent as of 2019. The share of renewables in EU electricity production more than doubled to 34.6 per cent (see Figure 2b).
Source: Author’s calculation from Eurostat Database (2021).
Consumption in the EU Electricity Market by Sector
Consumption in the EU electricity market by sector
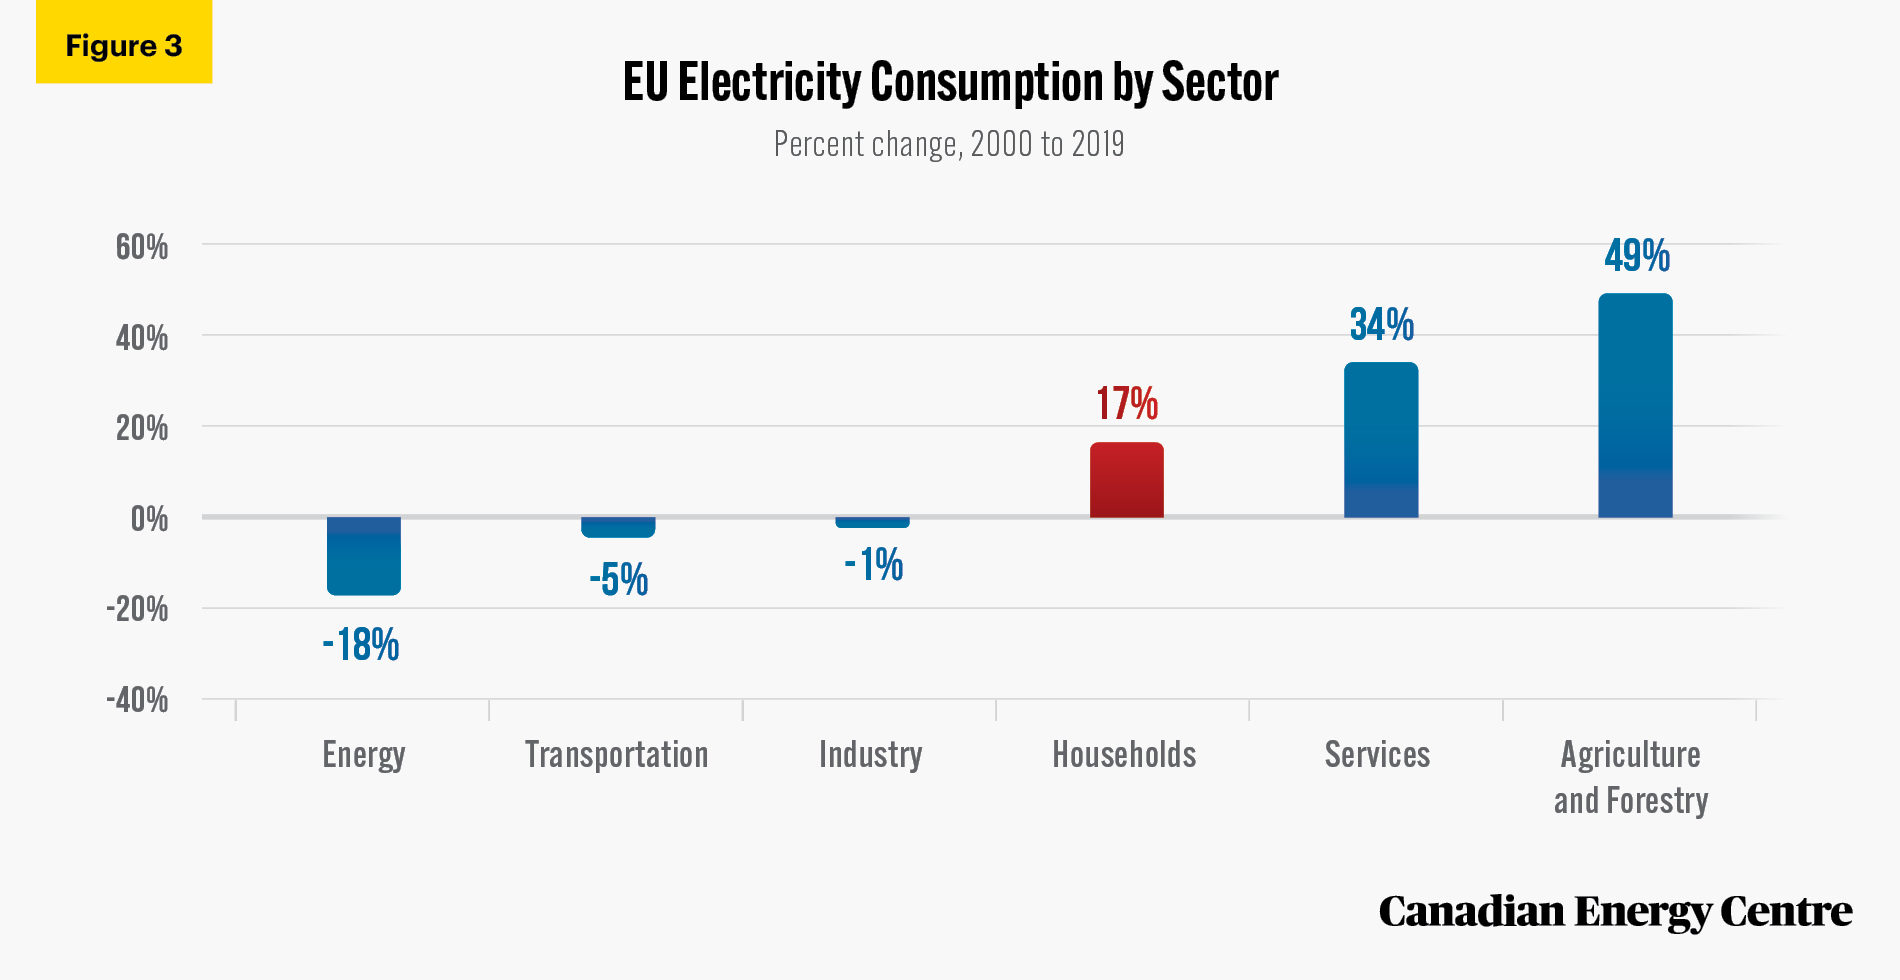
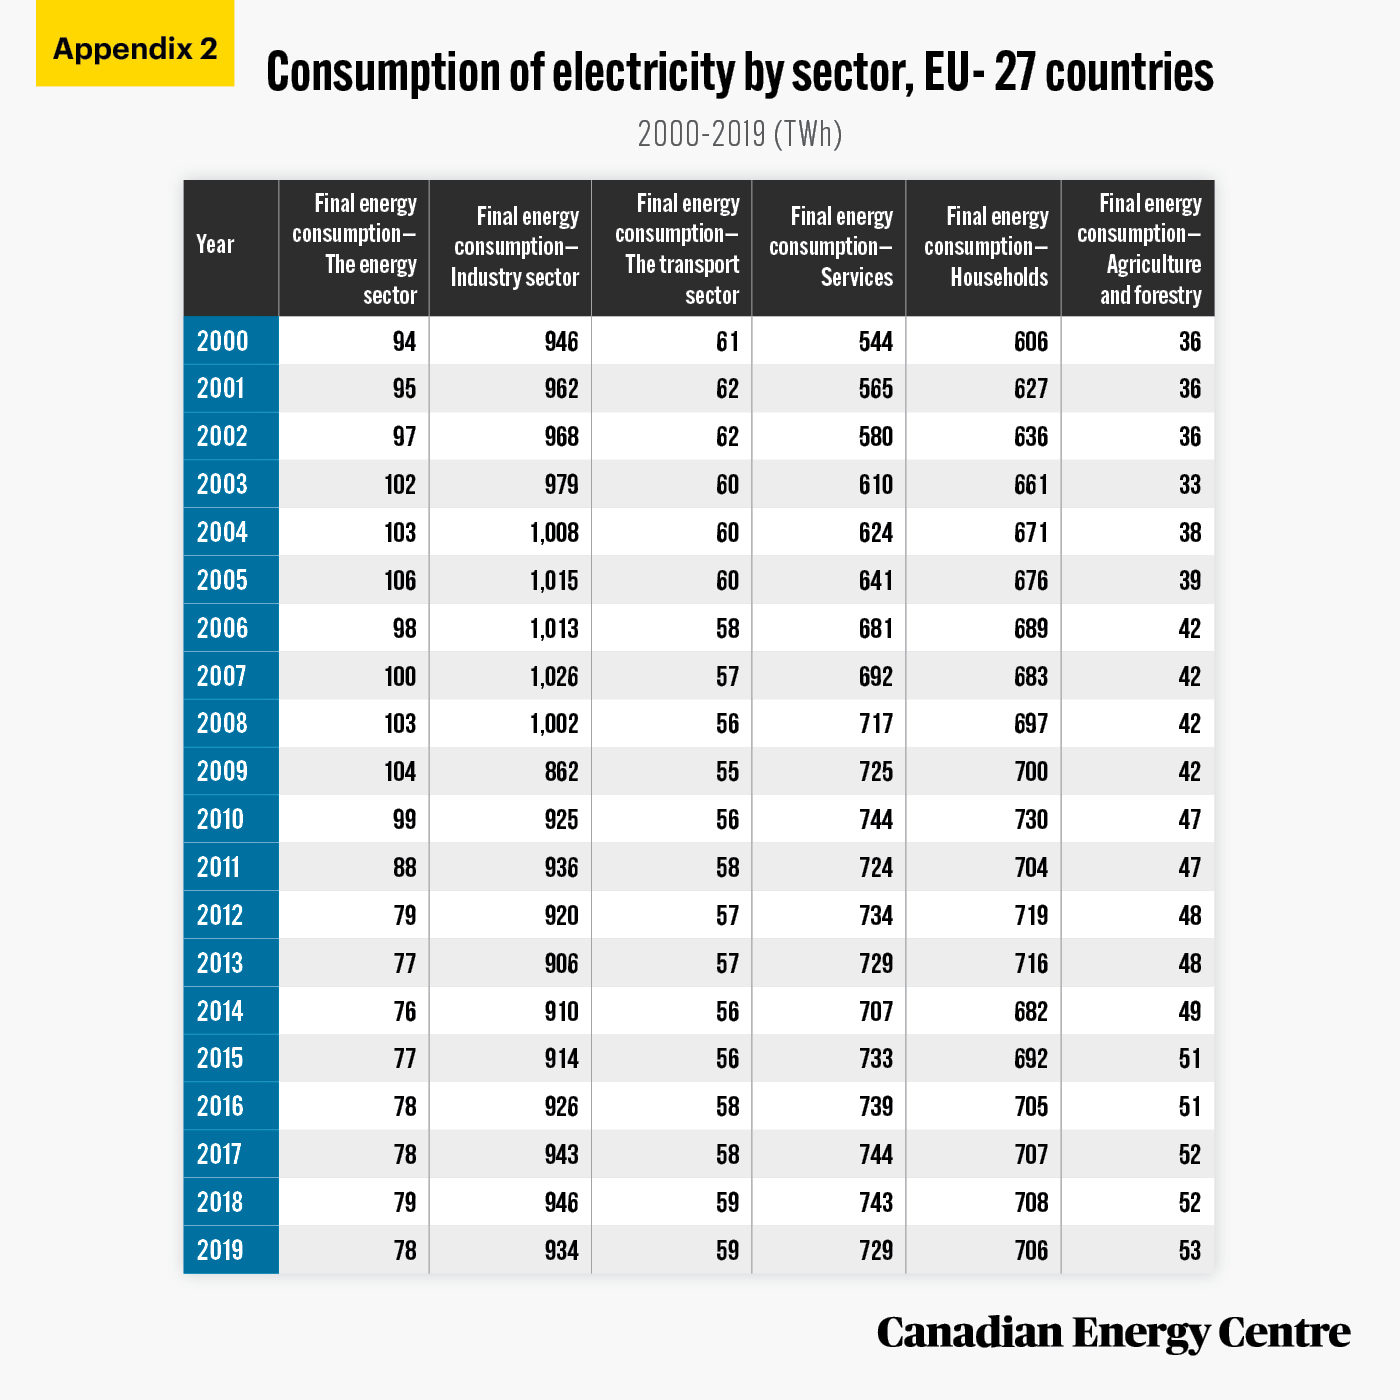
Electricity consumption in the European Union between 2000 and 2019 decreased in the energy, transportation and industry sectors, while rising in households, services and in agriculture/forestry (see Figure 3).
Source: Author’s calculation from Eurostat Database (2021).
Breaking down European household electricity consumption by country
The household sector’s electricity consumption increased by 17 per cent between 2000 and 2019 (see Figure 3). Household electricity consumption in absolute terms increased in many countries in the EU with most recording double-digit growth, except Germany (minus three per cent), the United Kingdom (minus seven per cent) and Belgium (minus 22 per cent) (see Figure 4).
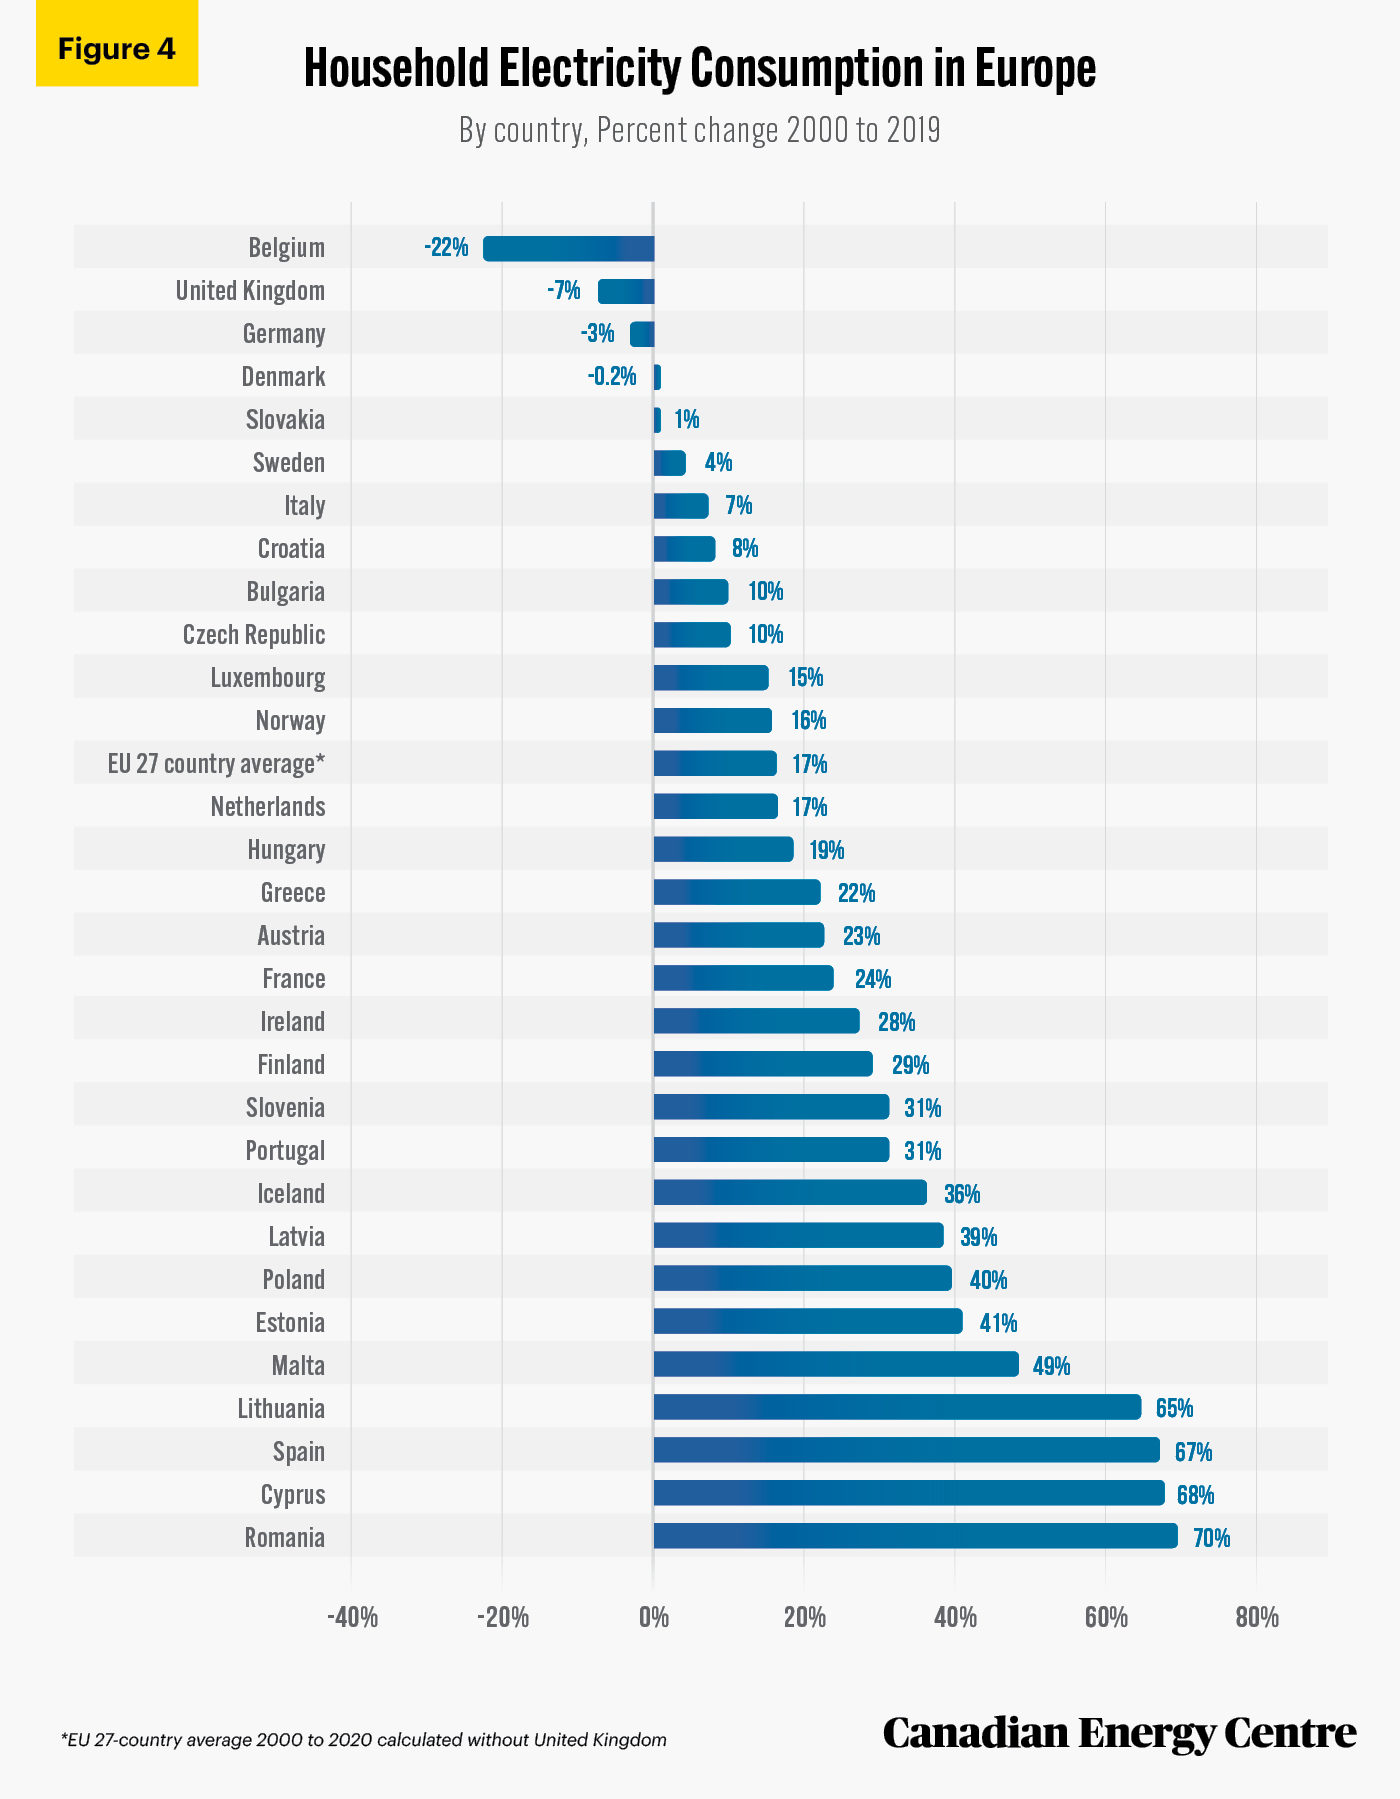
Source: Author’s calculation from Eurostat Database (2021).
European household electricity consumption per capita
Electricity consumption per capita was highest in Norway, at 7.5 MWh per capita. The electricity consumption per capita in Europe has varied extensively among countries. It was 1.5 MWh per capita for Germany and for France it was 2.4 MWh per capita (see figure 5).
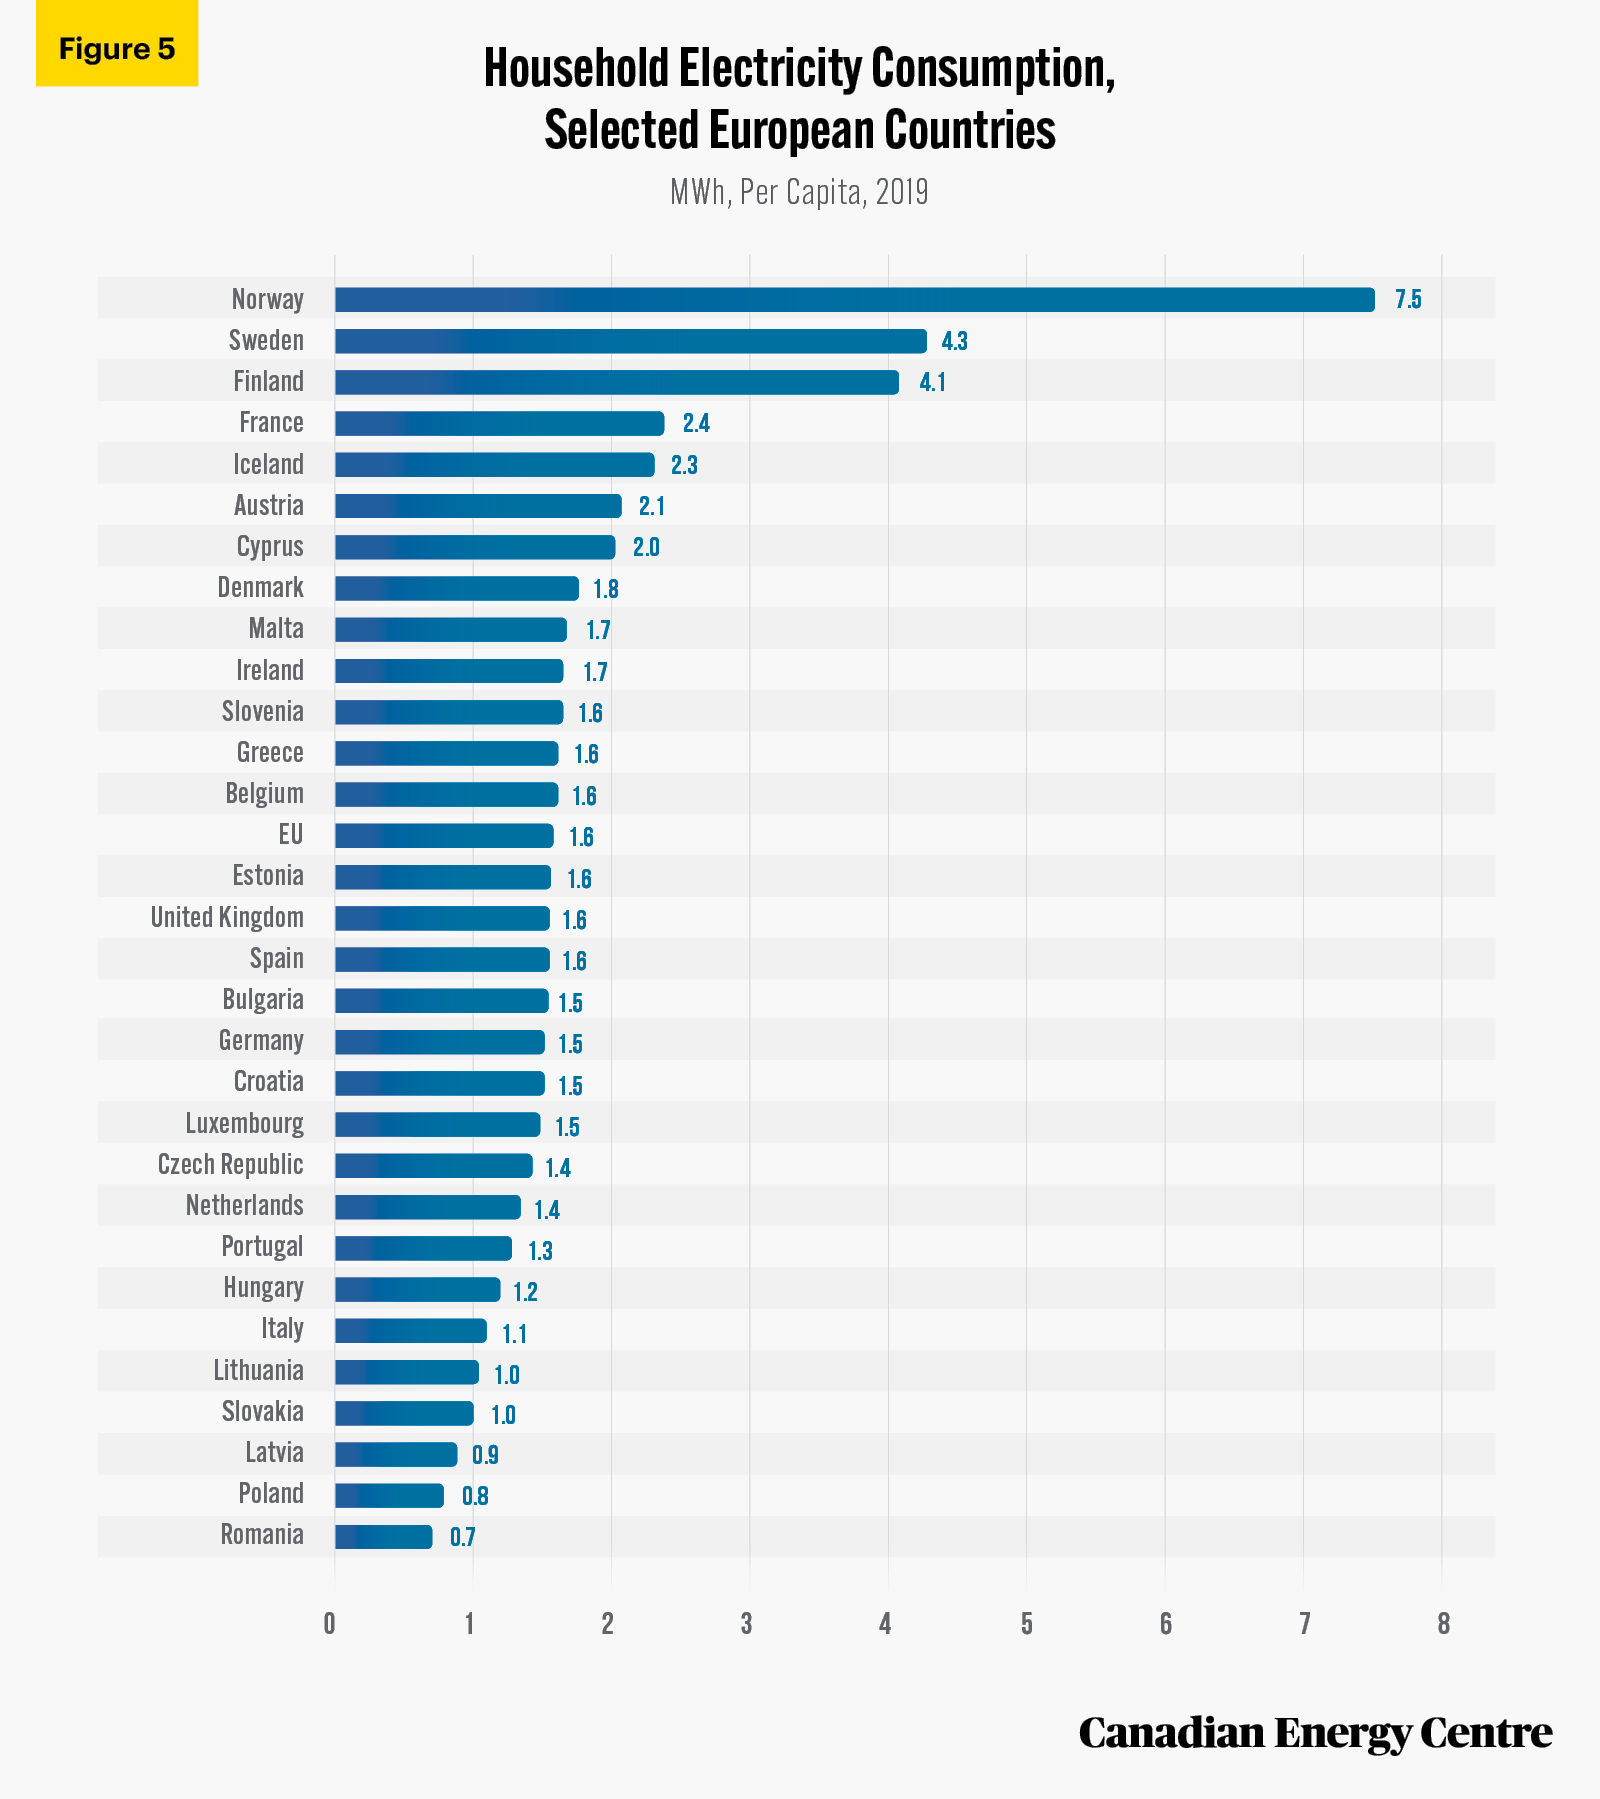
Source: Eurostat Database (2021).
Household Electricity Prices in EU Member States
Electricity end-user prices for households⁴ differ significantly in the EU member states. Multiple factors influence electricity prices including domestic regulations, taxes, and the energy source used in electricity generation.
- Environmental taxes and renewable levies on households matter to electricity prices in European countries. In 2019, environmental taxes paid by families ranged from €1/MWh in Luxembourg to €118/MWh in Denmark. Renewable levies range from €3/MWh in Sweden to €67/ MWh in Germany (European Commission, 2020b).
- Germany has the highest household prices due to its renewable surcharge (also called EEG surcharge), which consumers pay on their electricity bills to support renewable energy (Wettengel, 2019).
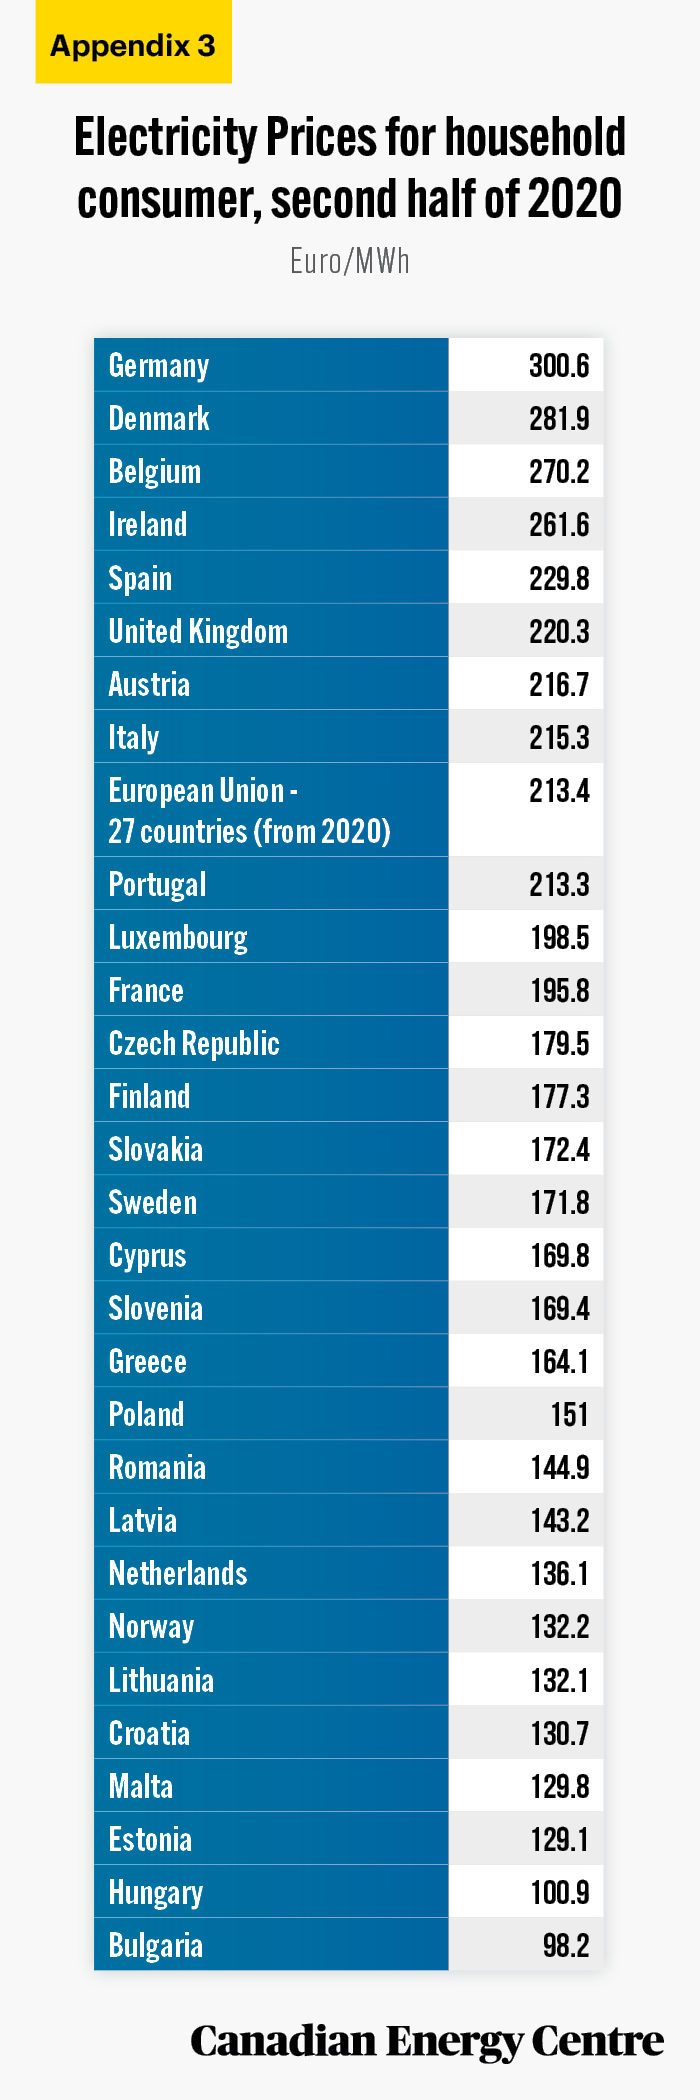
- In 2020⁵, a household user in Germany was paying the highest rate at €301 (which includes taxes levies), followed by Denmark €282 and Belgium €270. Household users in Hungary (€101) and Bulgaria (€98) were paying the least (see Appendix 3). Thus, prices in Germany are three times what they are in Bulgaria.
- According to the European Commission (2020c): “An average household in the EU27 paid €25 /MWh in renewable taxes in 2019. This figure equals 29 per cent of the taxes and levies component and 12 per cent of the total average EU price. The average amount of renewable taxes paid by households in the EU27 rose by 153 per cent since 2010.”
Unsurprisingly, given the various levies and taxes as well as the change in the source for electricity (less fossil fuel-fired electricity and more renewables), prices have been steadily increasing in Europe over the 2008-2020 period (the earliest and latest years for which data is available). Since 2010, household electricity prices increased by 2.3 per cent on average annually, while overall consumer prices increased by 1.4 per cent per year in the EU 27 countries. In other words, electricity prices increased by a greater rate than the consumer price index (European Commission 2020c). Of note, the most significant jump in household electricity prices between 2008 and 2020 occurred in France (61 per cent higher), Spain (68 per cent higher) and Latvia (70 per cent higher). The EU average increase was 33 per cent (see Table 1).
4. The EU defines household consumers in the EU-27, as medium-sized consumers with an annual consumption between 2,500 kWh and 5,000 kWh.
5. Annual prices calculated based on prices in the last six months of 2020

Source: Author’s calculation from Eurostat Database (2021).
Canada-Europe comparisons
European countries have significantly higher household electricity prices than other countries (and this is before the rise in the fall of 2021). For example, household electricity prices in Canada are one-third of what households pay in Germany (see Figure 6).
Source: Eurostat Database (2021).
Energy Poverty in Europe
In recent years, energy poverty has become a challenge for European Union member countries, and each member country reports on energy poverty (Bouzarovski and Thomson, 2020).
Energy poverty can be measured by using various indicators.
- Expenditure based approach – household energy costs measured against absolute or relative thresholds, i.e., incomes;
- Consensual approach – self-reported assessments of indoor housing conditions, i.e., the ability to keep a home warm; and
- Direct measurement- where the level of energy services (heating) achieved in the home is compared with a set standard (Thomson et al., 2017).
The European Union measures energy poverty by using the indicator developed by EU Energy Poverty Observatory (EPOV). It provides four different primary indicators for energy poverty.
Two are based on self-reported experiences of limited access to energy services:

- The share of a country’s population in arrears on their utility bills; and
- The proportion of a country’s population unable to keep their homes adequately warm.
Two are calculated using household income and/or energy expenditure data:
- The proportion of households whose absolute energy expenditures are half the national median share of absolute energy expenditures, knows as the “M/2” indicator”; and
- The proportion of households whose absolute energy expenditures are twice the national median share of absolute energy expenditures, knows as the “2M indicator.” We label this a “consumers facing a high share of energy costs.”
Observing the “2M indicator” in 2015, the latest year for available data, the EU estimates that 16 per cent of EU households face a high share of energy costs (see Table 2). In countries such as Germany and the United Kingdom, the proportion of households facing a high share of energy costs was 17 per cent and 19 per cent respectively in 2015, the most recent year for which this EU calculation was constructed.

Source: EU Energy Poverty Observatory (undated).
Another look at EU energy poverty: Behind on utilities/unable to keep the house warm
Using utility bills and the ability to keep one’s house warm as a stand-alone indicator, as of 2018, 6.8 per cent of people living in private households across the EU (30.3 million people) were unable to pay their utility bills, and 7.3 per cent EU households were unable to keep their dwelling warm. The figures for the United Kingdom were 5.4 per cent for both indicators in 2018 (EU Energy Poverty Observatory, undated). Readers should note that the EU estimates are not “watertight” as they are self-reported (see Table 3).
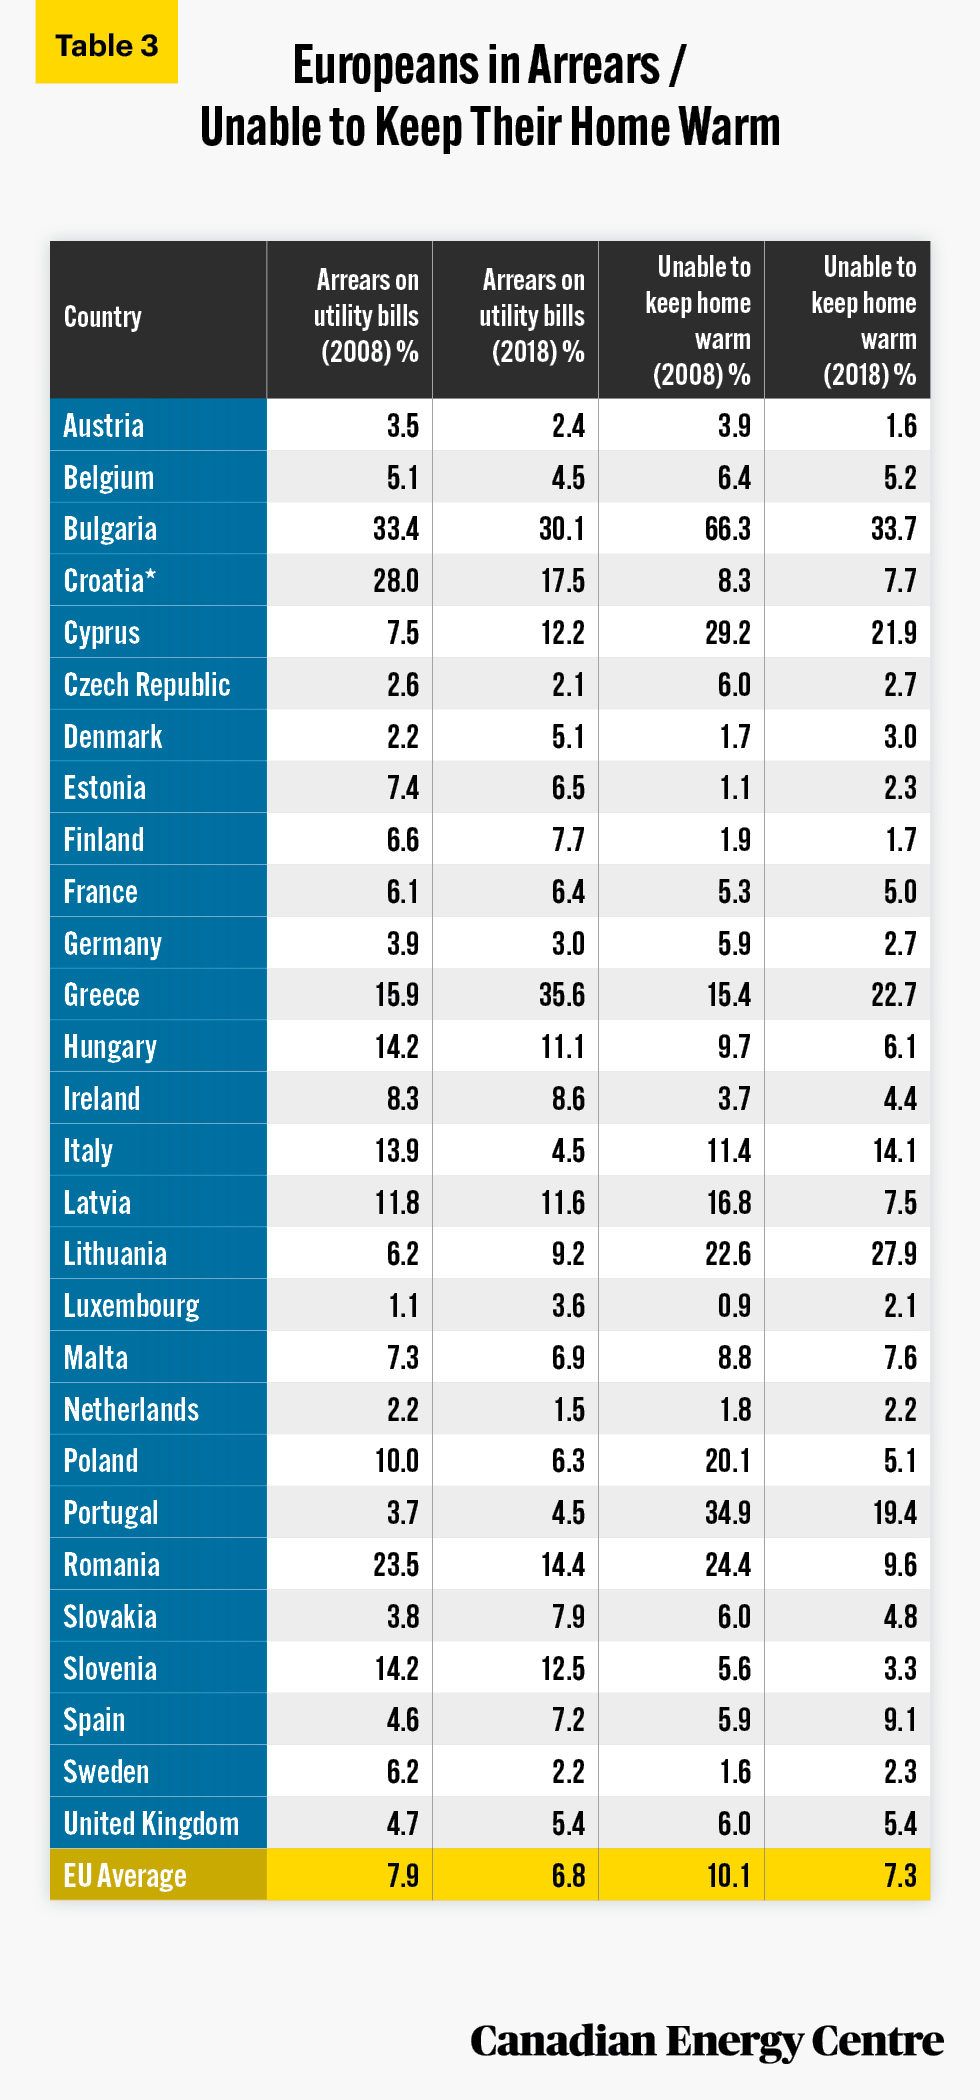
Source: Bouzarovski and Thomson (2020).
Our estimates of Europe’s high-cost electricity
Given the European Union’s self-reporting of energy poverty, we have designed an alternate measurement.
Our measurement tracks the increase in European electricity costs by country and compares it with the increase in median household income. The measurement is for 2008 to 2020 for electricity costs and for 2008 to 2019 for household median income (2019 is the most recent year for which a full set of median household income data is available).⁶
Given that European countries vary widely in median household income, in part because of communism in the 20th century, its collapse, and how many central and eastern European countries were in effect “starting over” in the 1990s, we have divided European countries into those with less than €15,000 in median household income in 2008, and those with more than €15,000 in median household income in 2008.
This is because we would expect, for example, median household income growth in Poland (€4,154 in 2008) and Romania (€1,954 in 2008) to easily outpace any growth in electricity prices in the years examined because those countries (and others) started with very low median household incomes.
Conversely, those with already high median household incomes in 2008 such as the United Kingdom (€18,766) and Ireland (€22,995) would be unlikely to see as dramatic rise in incomes, given they were already mature economies. That means any rise in electricity prices beyond household median income growth could be more difficult for households to finance.
The data in fact shows exactly that for many European countries for the 2008 to 2019/2020 period. For example:
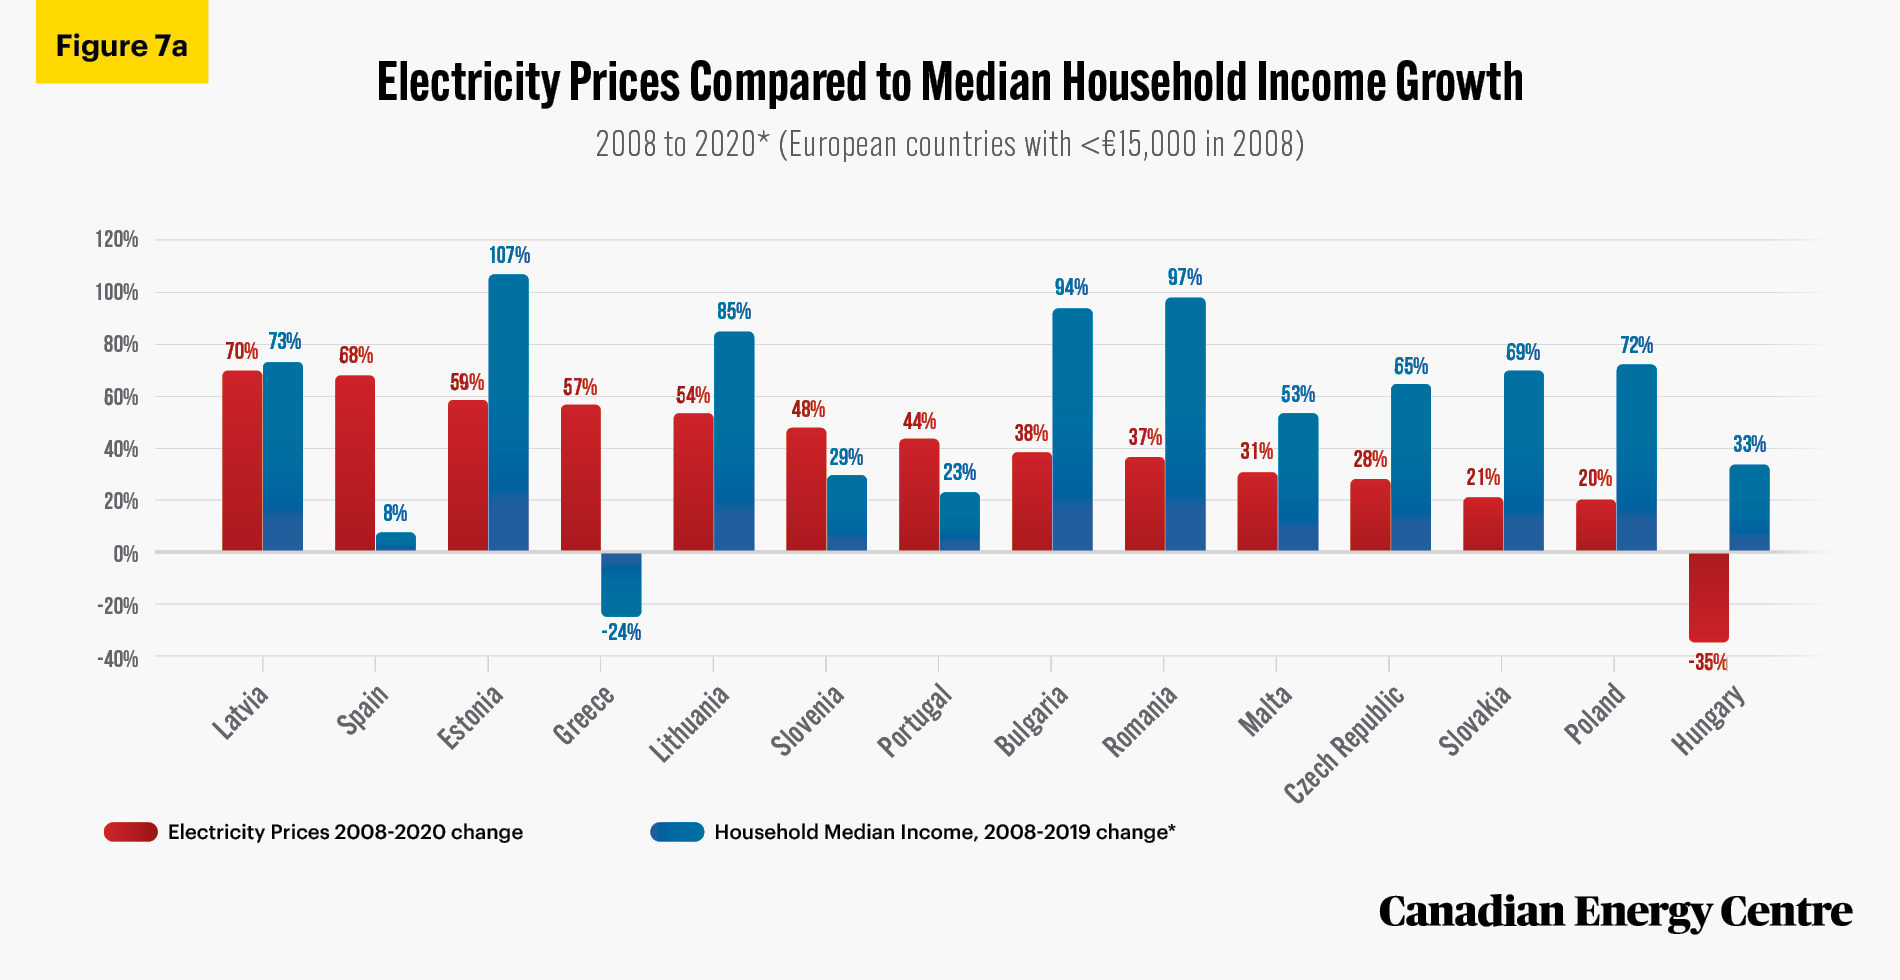
- Electricity prices in Poland rose by 20 per cent but household median income increased by 72 per cent, thus making the rise in power prices manageable. The same was true of many other nations with low median household income in 2008: Bulgaria, Romania, the Czech Republic, and Slovakia (see Figure 7a).
6. There is only a marginal difference between 2019 incomes and 2020 incomes, where available in the latter case. For example, Sweden’s median het household income was €24,490 in 2019 and €24,710 in 2020.
Source: Bouzarovski and Thomson (2020).
- In contrast, in the United Kingdom and Ireland (see Figure 7b), electricity prices soared by 51 per cent and 48 per cent, respectively while household median income rose by just four per cent and one per cent, respectively. That split between significantly higher power bills and an almost status-quo reality on median household incomes helps explain why some European (or United Kingdom) households have found it increasingly difficult to pay their utility bills.
- The most challenging combination though is where a country already had low median household income in 2008, and then saw little income growth over the next 11 years, but experienced a dramatic rise in the cost of power at the same time. This was the case for Spain, where electricity prices soared by 68 per cent between 2008 and 2020 with median household income rising by just eight per cent (by 2019) (see Figure 7a).
Source: Authors’ calculation from Eurostat database.
Conclusion: Lessons from Europe for Canada
The core question is what lessons Canadian policymakers might glean from Europe, given that substantial changes are proposed in Canada on everything from how Canadians might heat their homes (more electrification) to higher carbon taxes and other policy, regulatory and legislative changes that discourage the consumption of hydrocarbons. This has obvious relevance to Canada, where a transition not only from coal and oil but also from natural gas is considered viable by some, with consequences for the electricity grid. The notion that all electrification in Canada via renewables is possible can have unintended consequences for Canadian households across provinces. As readers will note, the impact of the energy transition on retail prices of electricity in Europe is not uniform; it differs by country and can be influenced by policy decisions and regulatory frameworks. However, European and United Kingdom attempts to move away from affordable and reliable sources of electricity production and its subsequent impact on household electricity prices holds cautionary lessons for Canada.
Appendices
Source: Eurostat Database (2021).
Source: Eurostat Database (2021).
Source: Eurostat Database (2021).
References
BBC (2021). Spain targets energy firms as European bills surge. Spain targets energy firms as European bills surge.<https://bbc.in/3m7Zz73>.
Bednar, D.J and Reames, T.G. (2020). “Recognition of and response to energy poverty in the United States”, Nat Energy 5: 432–439. <https://go.nature.com/3kYF9xG>.
Bouzarovski, Stefan and Saska Petrova (2015). “A global perspective on domestic energy deprivation: Overcoming the energy poverty–fuel poverty binary”. Energy Research and Social Science 10:31-40. <https://bit.ly/3zWL9LX>.
Bouzarovski, Stefan et al. (2020). “Towards an inclusive energy transition in the European Union: Confronting energy poverty amidst a global crisis.” Third pan-EU energy poverty report of the EU Energy Poverty Observatory: Luxembourg: Publications Office of the European Union, 2020. <https://bit.ly/2XUE8Ok>.
BBC (2021). Spain targets energy firms as European bills surge. Spain targets energy firms as European bills surge. <https://bbc.in/3m7Zz73>.
Drehobl, Ariel, et al. (2020).” How High are Household Energy Burdens?”, Washington, DC: American Council for an Energy-Efficient Economy, <https://bit.ly/2WjO5o0>.
European Commission (undated). Eurostat Database. <https://bit.ly/3uhrvZw>.
EU Energy Poverty Observatory (undated). Indicators and Data. <https://bit.ly/3kKsr5L>.
European Union (EU) (October 14, 2020a). Commission Recommendation on energy poverty. 2020/1563. <https://bit.ly/3icx0UI>.
European Commission (2020b). Energy prices and costs in Europe, COM (2020/ 951) Brussels. <https://bit.ly/3CO11C4>.
European Commission (2020c). Energy prices and costs in Europe, COM (2020/ SWD 951). Commission staff working documents. <https://bit.ly/3AM3wEk>.
IEA (2020). SDG7: Data and Projections, IEA, Paris. <https://bit.ly/3ANgHFb>.
IEA (2021). IEA World Energy Statistics (database). <https://bit.ly/34nYWOF>.
Kyprianou, I., et. al. (2019). “Energy poverty policies and measures in 5 EU countries: A comparative study”, Energy and Buildings, 196:46-60.
Office of the Auditor General of Ontario (2015a). Summaries of Value-For-Money Audits. Annual Report. <https://bit.ly/3cxAQlS>.
Office of the Auditor General of Ontario (2015b). Section 3.05: Electricity Power System Planning. Annual Report. <https://bit.ly/2VOoUW9>.
Ontario (2019a). Bill 87, Fixing the Hydro Mess Act, 2019. <https://bit.ly/3ut8uDu>.
Ontario (2019b). Budget 2019. <https://bit.ly/3uvbj7o>.
Ontario (2020). Budget 2020. <https://bit.ly/2WtI5cr>.
Smil, Vaclav (2017). Energy: A Beginner’s Guide, 2nd Edition. One World.
Smil, Vaclav (2020). What We Need to Know about the Pace of Decarbonization. Johnson Shoyama Graduate School of Public Policy, University of Saskatchewan. <https://bit.ly/3c02HO7>.
Sparks, Tori (January 27, 2021), Why Did Spain’s Electricity Prices Suddenly Increase, Barcelona-Metropolitan. <https://bit.ly/2WgiKCv>.
Thomson, Harriet, et.al. (2017). Rethinking the measurement of energy poverty in Europe: A critical analysis of indicators and data. Indoor and Built Environment. 26(7):879-901. <https://bit.ly/3G5k0up>.
Voosen, Paul (2018). Meet Vaclav Smil, the Man Who Has Quietly Shaped How the World Thinks about Energy. Science. <https://bit.ly/3f5eTPl>.
Wettengel, Julian (15 October 2019). “Germany’s renewables levy rises slightly in 2020”, Clean Energy Wire. <https://bit.ly/3uiOXG7>.
World Bank (n.d.) Database. <https://bit.ly/3od7wuj>.
CEC Research Briefs
Canadian Energy Centre (CEC) Research Briefs are contextual explanations of data as they relate to Canadian energy. They are statistical analyses released periodically to provide context on energy issues for investors, policymakers, and the public. The source of profiled data depends on the specific issue. All percentages in this report are calculated from the original data, which can run to multiple decimal points. They are not calculated using the rounded figures that may appear in charts and in the text, which are more reader friendly. Thus, calculations made from the rounded figures (and not the more precise source data) will differ from the more statistically precise percentages we arrive at using the original data sources.
About the authors
This CEC Research Brief was compiled by Ven Venkatachalam, Senior Research Analyst at the Canadian Energy Centre and Mark Milke, Executive Director of Research for the Canadian Energy Centre.
Acknowledgments and Notes
The authors and the Canadian Energy Centre would like to thank and acknowledge the assistance of two anonymous reviewers. Note that for Executive Summary Figure 2, Figure 7b and Appendix 3, EU 27-country averages between 2008 and 2020 were calculated without the United Kingdom.
Sernius, Lalesh Aldarwish, Kaique Rocha, Daria Shevtsova, Jeffrey Czum, Max Vakhtbovych, Golnar Sabzpoush Rashidi, Ryunosuke Kikuno
Share This:


