


 CDN NEWS |
  US NEWS


As populations and economies grow in developing nations, oil and gas will remain vital energy source
Follow CEC on Facebook CEC Facebook
Follow CEC on Twitter CEC Twitter
Download the PDF here
Download the charts here
Executive Summary
When policymakers around the world consider energy needs over the next three decades, it is useful for them to examine two populous and growing regions, Africa and Asia. To that end, this Canadian Energy Centre Research Brief contains a quantitative analysis of the demand for oil and gas in in the largest economies of Africa and Asia over the last three decades. It also shows past and projected population growth in those economies.
Since 1990, the twin factors of population growth and economic development were clearly evident in Africa and Asia and led the economies there to greatly increase their use of oil and gas. Specifically, industry’s use of oil and gas as a primary energy source increased significantly between 1990 and 2018 with demand in both continents also driven by growing urbanization and expanded transportation networks.
- The 10 largest African economies increased their collective GDP from $346 billion in 1990 to $1.8 trillion in 2019. In Asia, the GDP of the top 10 economies rose from $4.6 trillion in 1990 to $27.8 trillion in 2019.
- That economic growth required energy. Between 1990 and 2018, the total annual consumption of oil and natural gas reached 219 million tonnes of oil equivalent (Mtoe) in 2018, an increase of 177 per cent from 79 Mtoe in 1990. In Asia, the annual consumption of oil and gas reached 2,179 Mtoe in 2018, increasing 189 per cent.
- Both Asia and Africa are expected to see significant population growth over the next three decades. Africa’s population is forecast to double with 1.3 billion more people added to that continent by 2050 for a total of 2.6 billion, while Asia’s population will grow by 950 million people or 21 per cent between 2019 and 2050 and reach 5.5 billion people by 2050.
Source: World Bank (2021) and UN (2021).
The relevance of energy density: Oil, natural gas, and alternatives
This Research Brief comes at a critical juncture as the media, politicians, and policymakers speculate about the demise of oil and natural gas. However, as the research highlights, the demand for oil and gas in the various sectors of the African and Asian economies has increased considerably in the last 30 years—and is expected to drive the growth in energy demand in the future.
Of additional relevance to this discussion is the potential of other energy sources to replace oil and natural gas. On the issue of technological feasibility—i.e., energy density, and any assumed energy source transitions, and as energy transition expert University of Manitoba professor of the environment (emeritus) Vaclav Smil has noted, “the reality of energy density in various forms of energy sources (be they oil, natural gas, coal, wind, solar and others) must be accounted for as part of any assumed transition”(Smil, 2017).
Perhaps the best way to grasp energy density or power density is the description offered by Science in a 2018 interview with Professor Smil by Paul Voosen:
In the past, humanity has typically adopted energy sources that have greater “power density,” packing more punch per gram and requiring less land to produce. Renewables (green), however, are lower in density than fossil fuels (brown). That means a move to renewables could vastly increase the world’s energy production footprint, barring a vast expansion of nuclear power. Or expressed another way, as Smil remarked in the same interview, ignoring energy density by moving to allrenewable sources of energy could require countries to, “devote 100 or even 1000 times more land area to energy production than today… [which] could have enormous negative impacts on agriculture, biodiversity, and environmental quality” (Voosen, 2018).
In short, it should not be assumed that the population and economic growth already observed in Africa and Asia can somehow be magically delinked from oil and natural gas. The growing economies of Africa and Asia will be hardpressed to find energy sources as efficient for their needs as oil and gas.
Introduction
The International Energy Agency recently pleaded with governments and energy firms to immediately halt all new oil and natural gas exploration investment (IEA, 2021a). However, this dramatic call for the end of oil and natural gas exploration—and then production and consumption—is wildly unrealistic. The largest economies in Africa and Asia currently depend on oil and gas as their primary energy source. Any call for disinvestment will adversely affect Africa and Asia’s economic development as their countries emerge from the COVID-induced recession.
Economic facts here are relevant:
- Both the population and economies of Africa and Asia have grown rapidly in the last three decades with a concurrent growth in energy demand.
- In the near future, and after contracting 2.1 per cent in 2020, real GDP in Africa is projected to grow by 3.4 per cent in 2021 and 4.6 per cent in 2022 (African Development Bank Group, 2021). Meanwhile, after contracting 0.2 per cent in 2020, the Asian economy is forecast to grow by 7.3 per cent in 2021 and 5.3 per cent in 2022 (Asian Development Bank, 2021).
There has been significant discussion among policymakers and others about the role of oil and gas as a source of energy. This Research Brief will not focus on that debate, but will review the growth in the demand for oil and gas in Africa and Asia between 1990 and 2018. The latest data for oil and gas demand are available up to 2018, so our analysis ends in that year. Also relevant to forecasts or scenarios for the future of oil and gas demand around the world is population growth, economic development, and urbanization, which in both Africa and Asia have been rapid and extensive, resulting in an increased demand for oil and gas in all sectors of their economies.
GDP Growth in Largest African and Asian Economies
Between 1990 and 2019, the Gross Domestic Product (GDP) of the emerging economies in Africa and Asia combined has been, on average, above four per cent (IMF, 2021). The 10 largest African economies have increased their collective GDP from $346 billion in 1990 to $1.8 trillion in 2019.¹
They include:
- Nigeria, which grew from $54 billion to $448 billion;
- South Africa, which grew from $116 billion to $351 billion; and
- Egypt, which grew from $43 billion to $303 billion (see Figure 1).
1. Note that all dollar figures in this report are U.S. dollars.
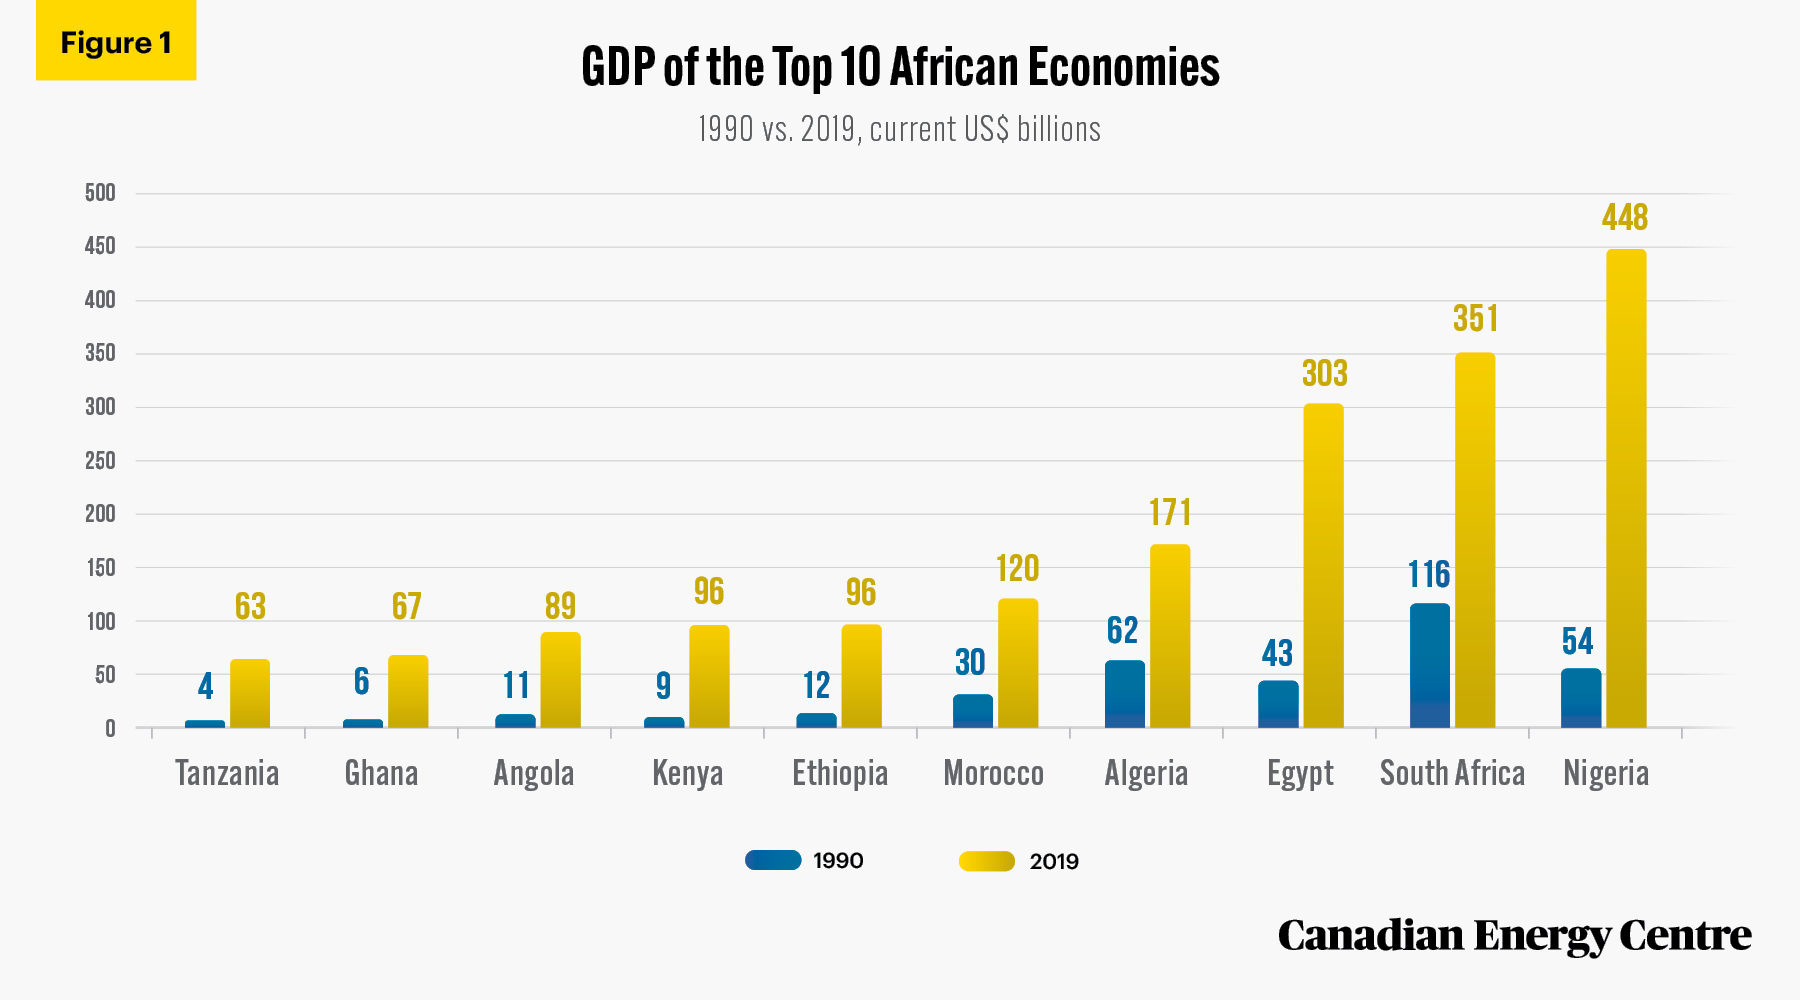
Source: World Bank (2021).
In Asia, the leading 10 economies increased their GDP from $4.6 trillion to $27.8 trillion between 1990 and 2019. They include:
- China, which grew from $361 billion to $14.3 trillion;
- Japan, which grew from $3.1 trillion to $5.1 trillion; and,
- India, which grew from $321 billion to $2.9 trillion (see Figure 2).
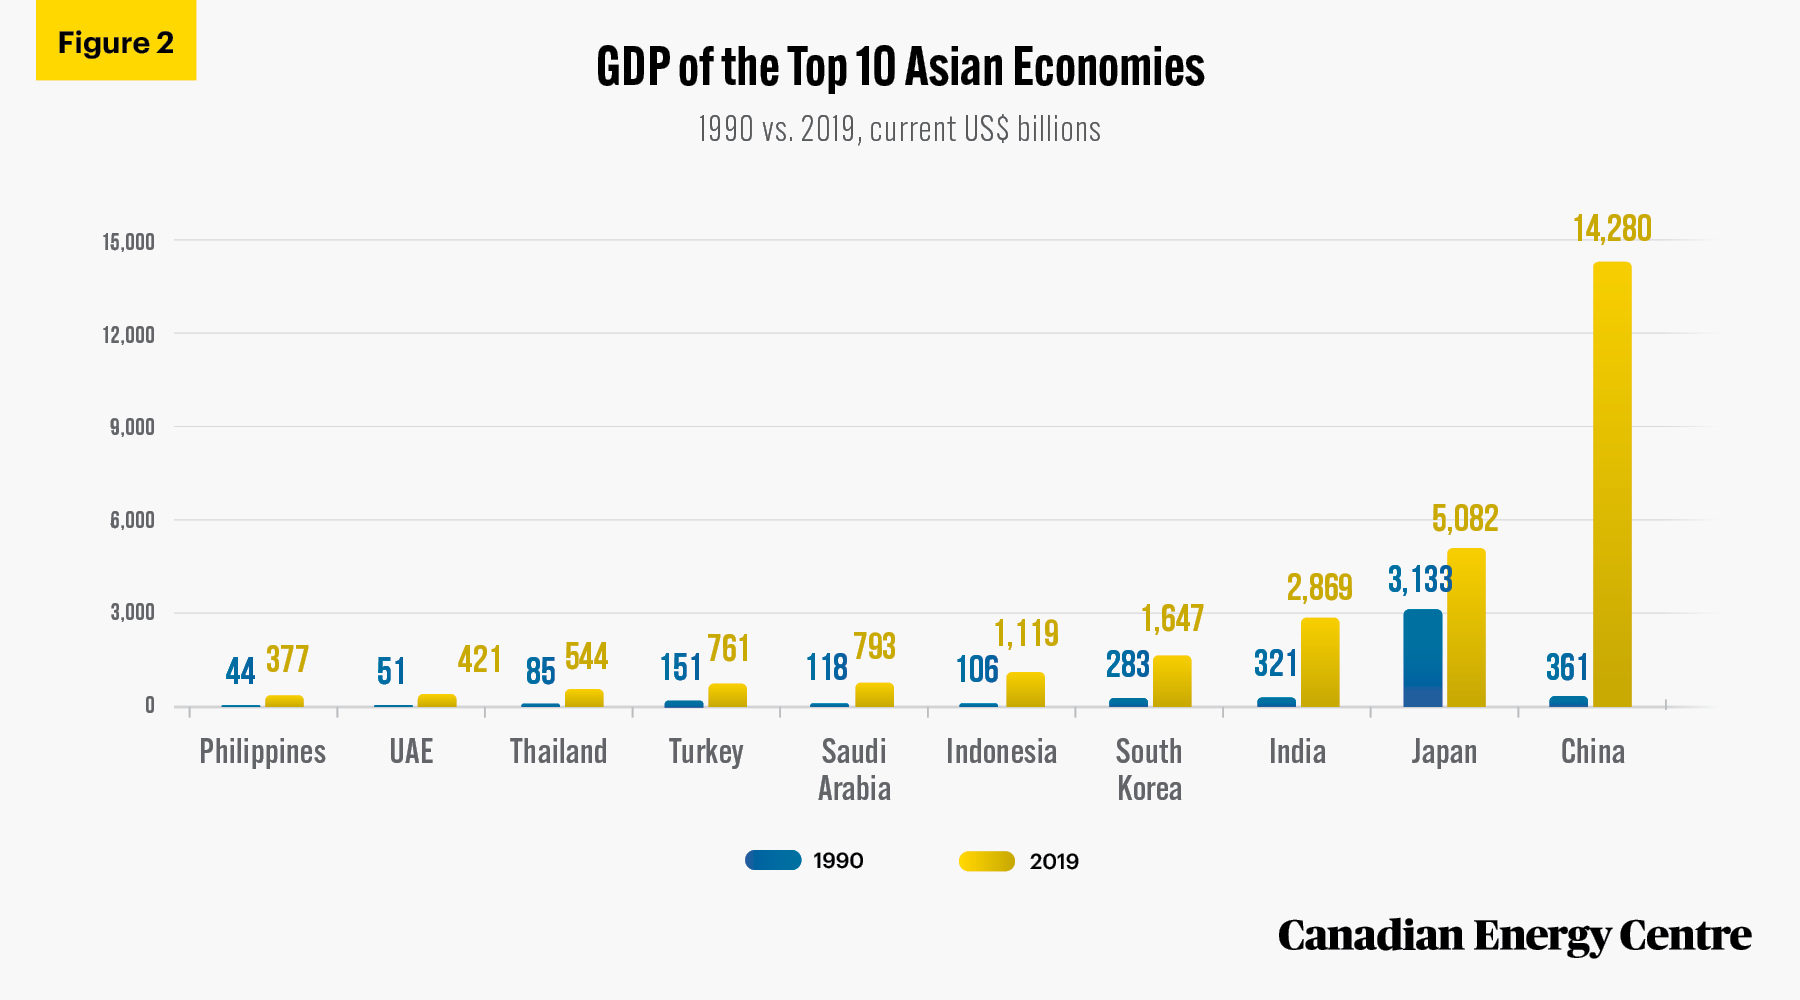
Source: World Bank (2021).
Population Growth in Africa and Asia
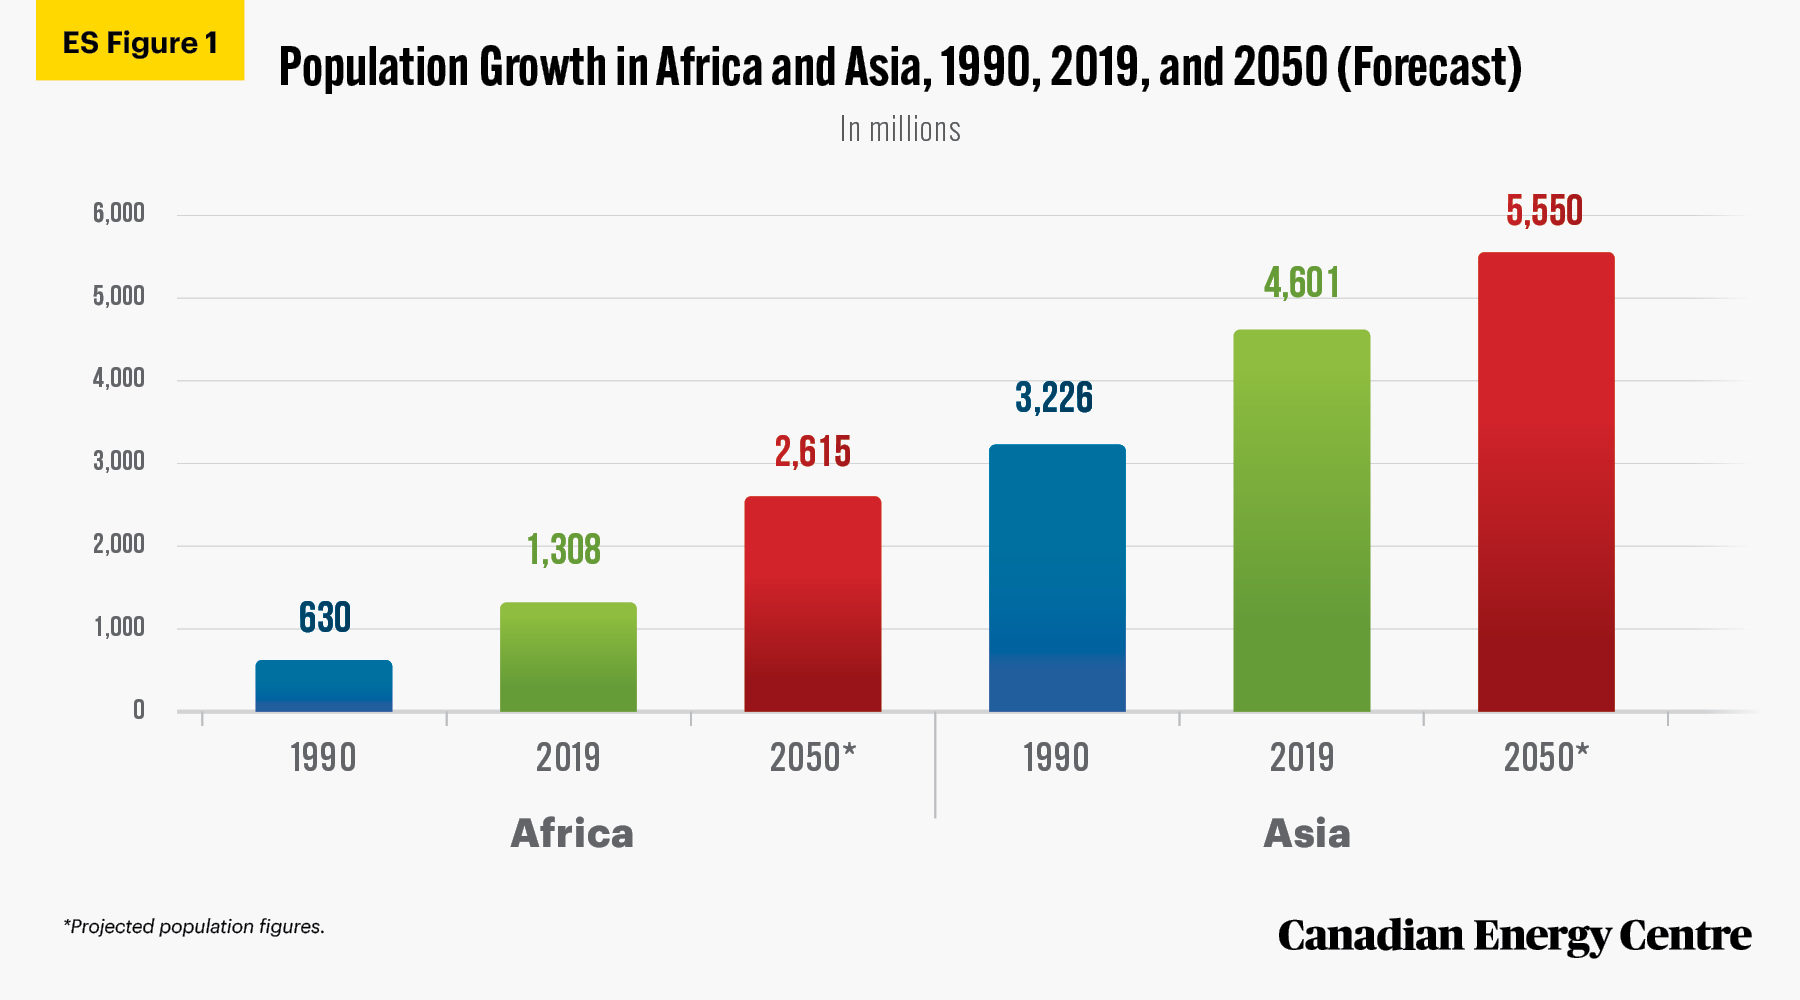
Population growth has been explosive in Africa, where the population has doubled from 630 million in 1990 to 1.3 billion in 2019. In Asia, the population increase was less steep than in Africa, but rose from 3.2 billion to 4.6 billion, or by 1.4 billion people (43 per cent), by 2019.
Both Asia and Africa are expected to see their populations grow over the next three decades. Africa’s population is forecast to again double, and add 1.3 billion more people in 2050 for a total of 2.6 billion. Asia’s population is forecast to grow by 950 million people between 2019 and 2050, or 21 per cent more for a total population of 5.5 billion (see Figure 3).
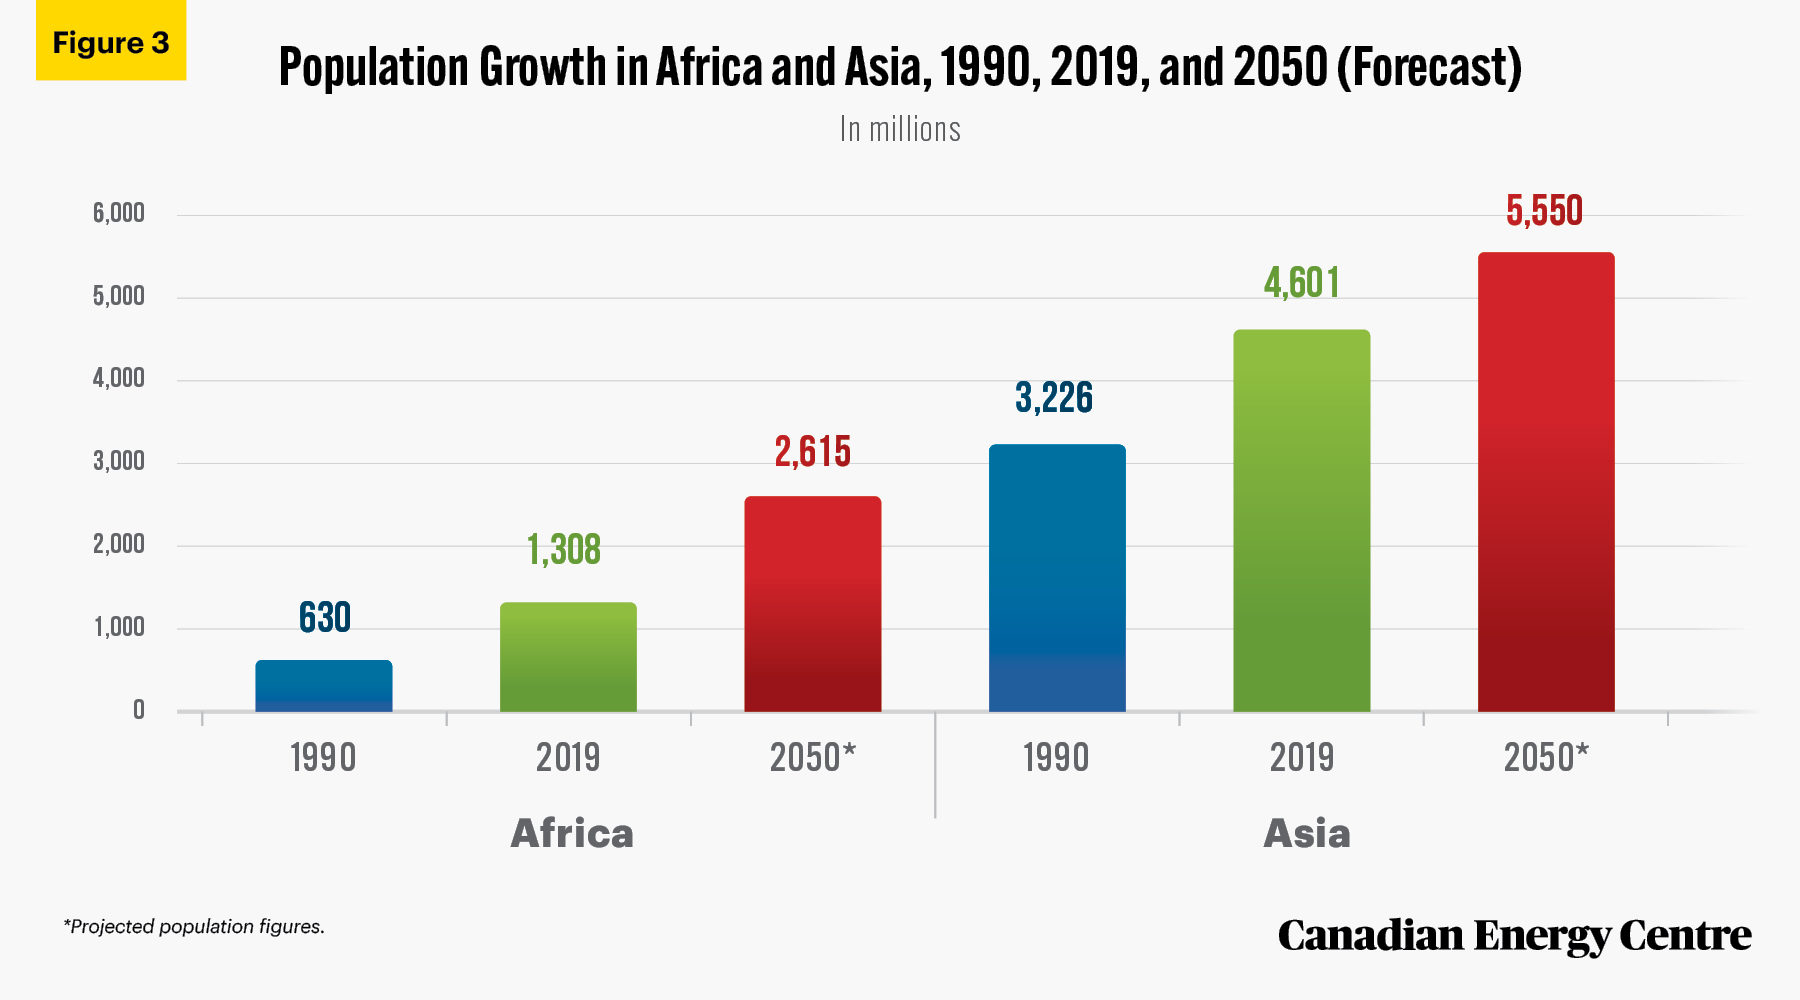
Source: World Bank (2021) and UN (2021).
Population growth by country
Between 2019 and 2050, the populations of the three largest countries (not economies) in Africa are forecast to grow as follows:
- Nigeria: 129 per cent to reach 400 million people;
- Ethiopia: 111 per cent to reach 237 million people; and
- Egypt: 78 per cent to reach 179 million.
In Asia, between 2019 and 2050, the populations of the three largest countries are forecast to grow as follows:
- China: 23 per cent to 1.5 billion people;
- India: 32 per cent to 1.8 billion people; and
- Indonesia: 34 per cent to 362 million people.
Given the anticipated overall increase in the populations of Africa (by 1.3 billion people or 100 per cent higher) and Asia (by 900 million people or 21 per cent higher) by 2050, energy demand on the two continents will also increase significantly.
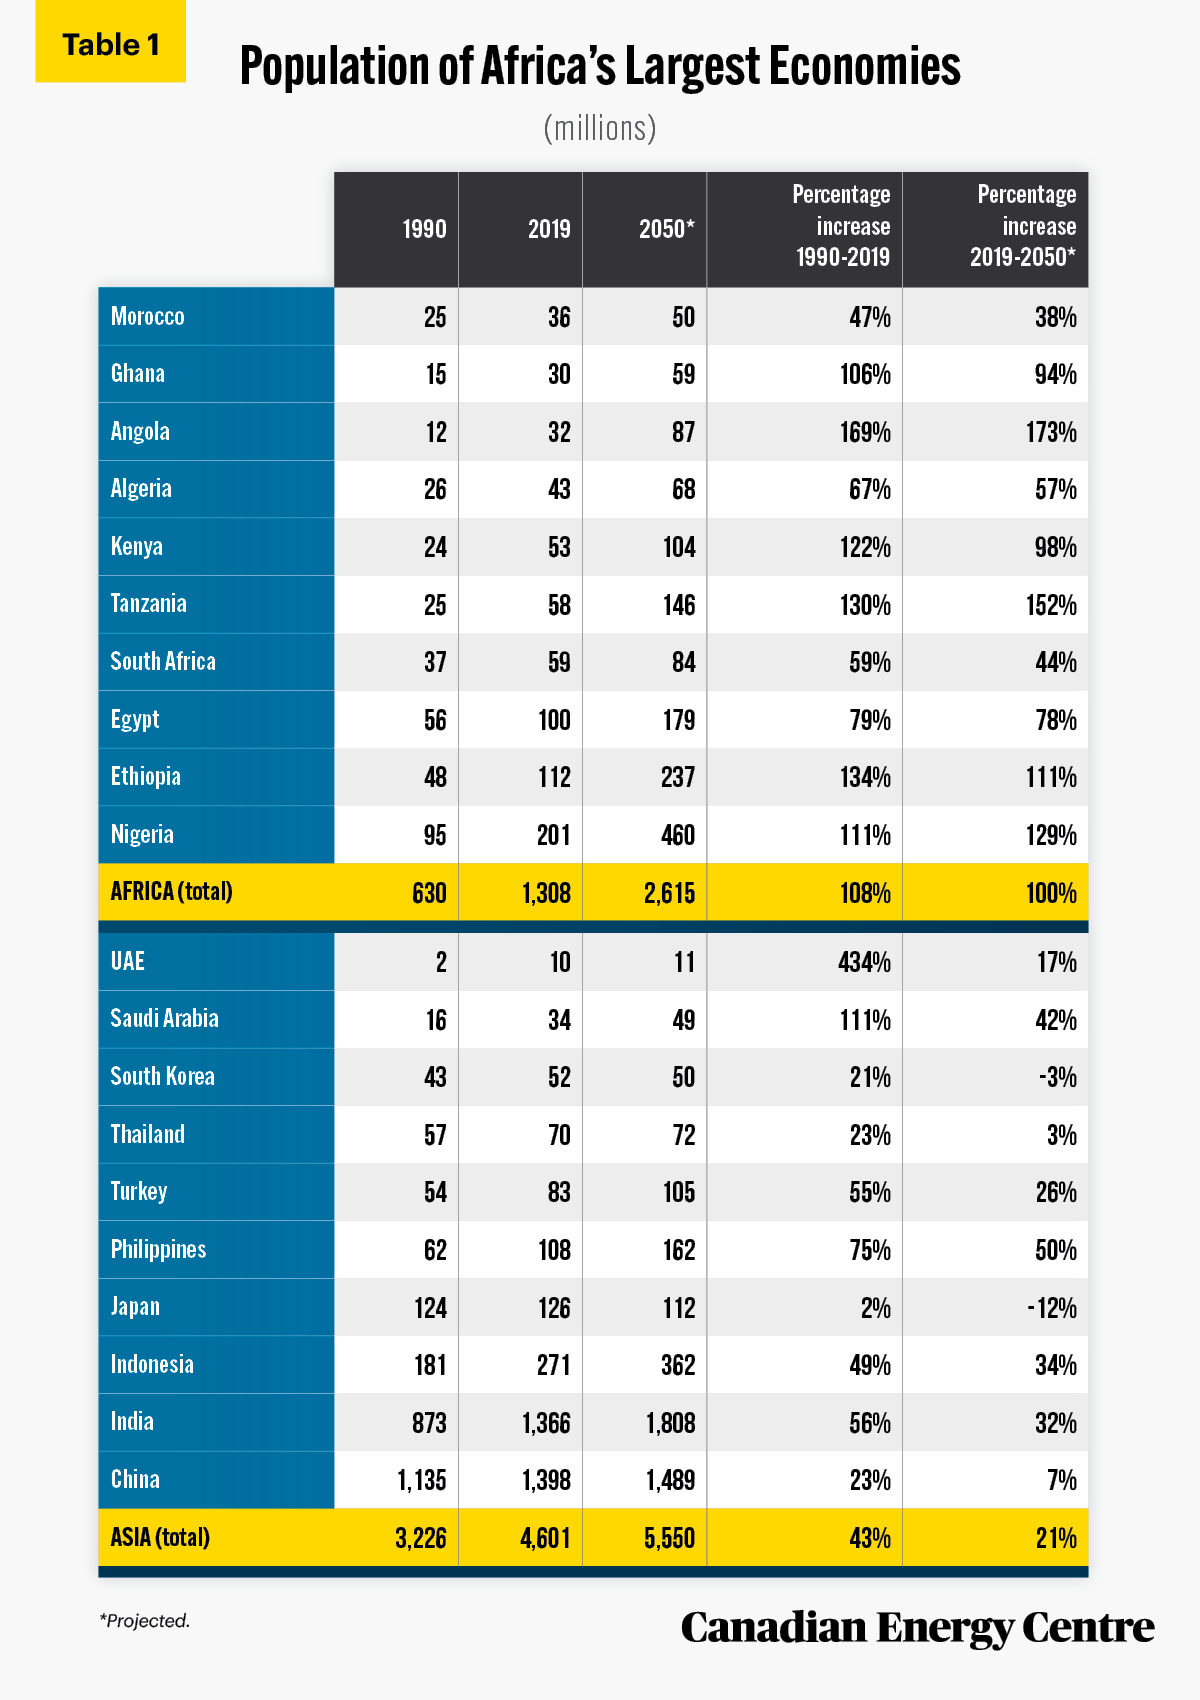
Source: World Bank (2021) and UN (2021).
Historical Oil and Gas Consumption in the Largest Economies of Africa and Asia
In 1990, Africa’s consumption of oil was 70.5 Mtoe (million tonnes of oil equivalent). By 2018, demand had increased to 170 Mtoe, a jump of 143 per cent. The increase was driven by economic growth and the subsequent increased consumption of oil and gas by the industrial and transportation sectors in countries across Africa (see Table 2).
In Asia, oil demand was primarily driven by China and India. Consumption of oil in Asia increased from 626 Mtoe in 1990 to 1,605 Mtoe in 2018, a jump of 156 per cent between 1990 and 2018. Countries such as the Philippines, Thailand, and Indonesia also saw their oil consumption increase between 1990 and 2018 (see Table 2).
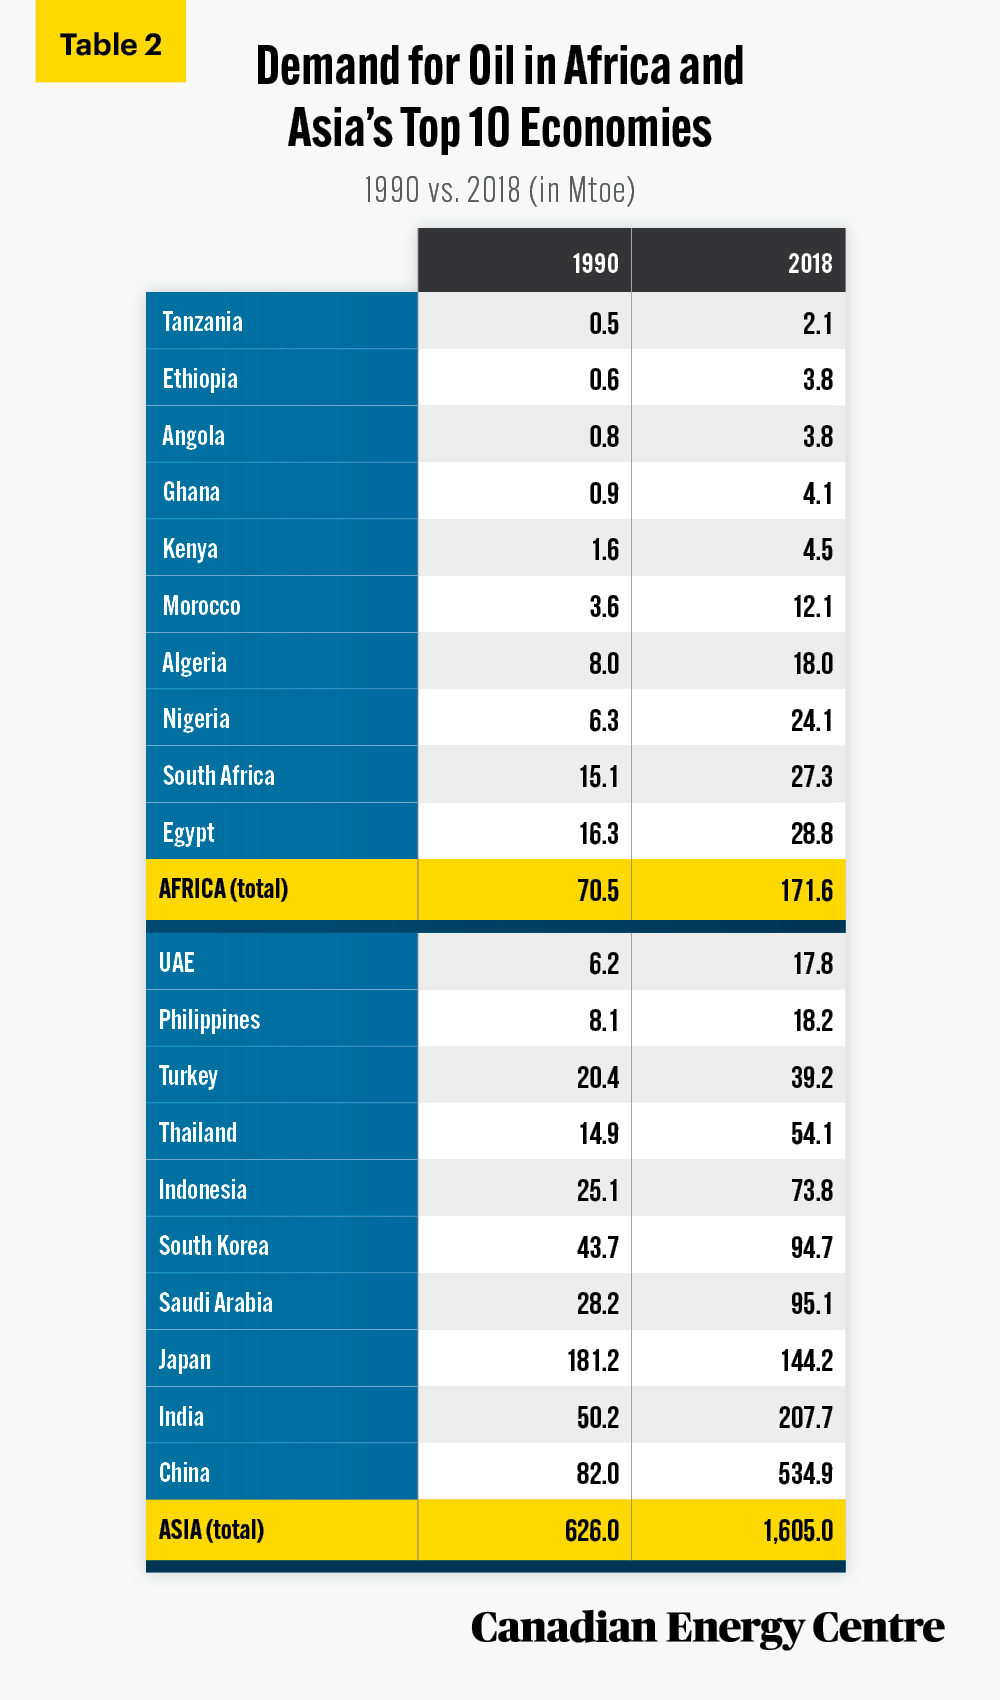
Source: IEA (2021b).
Oil consumption in the largest three economies, 1990 to 2018
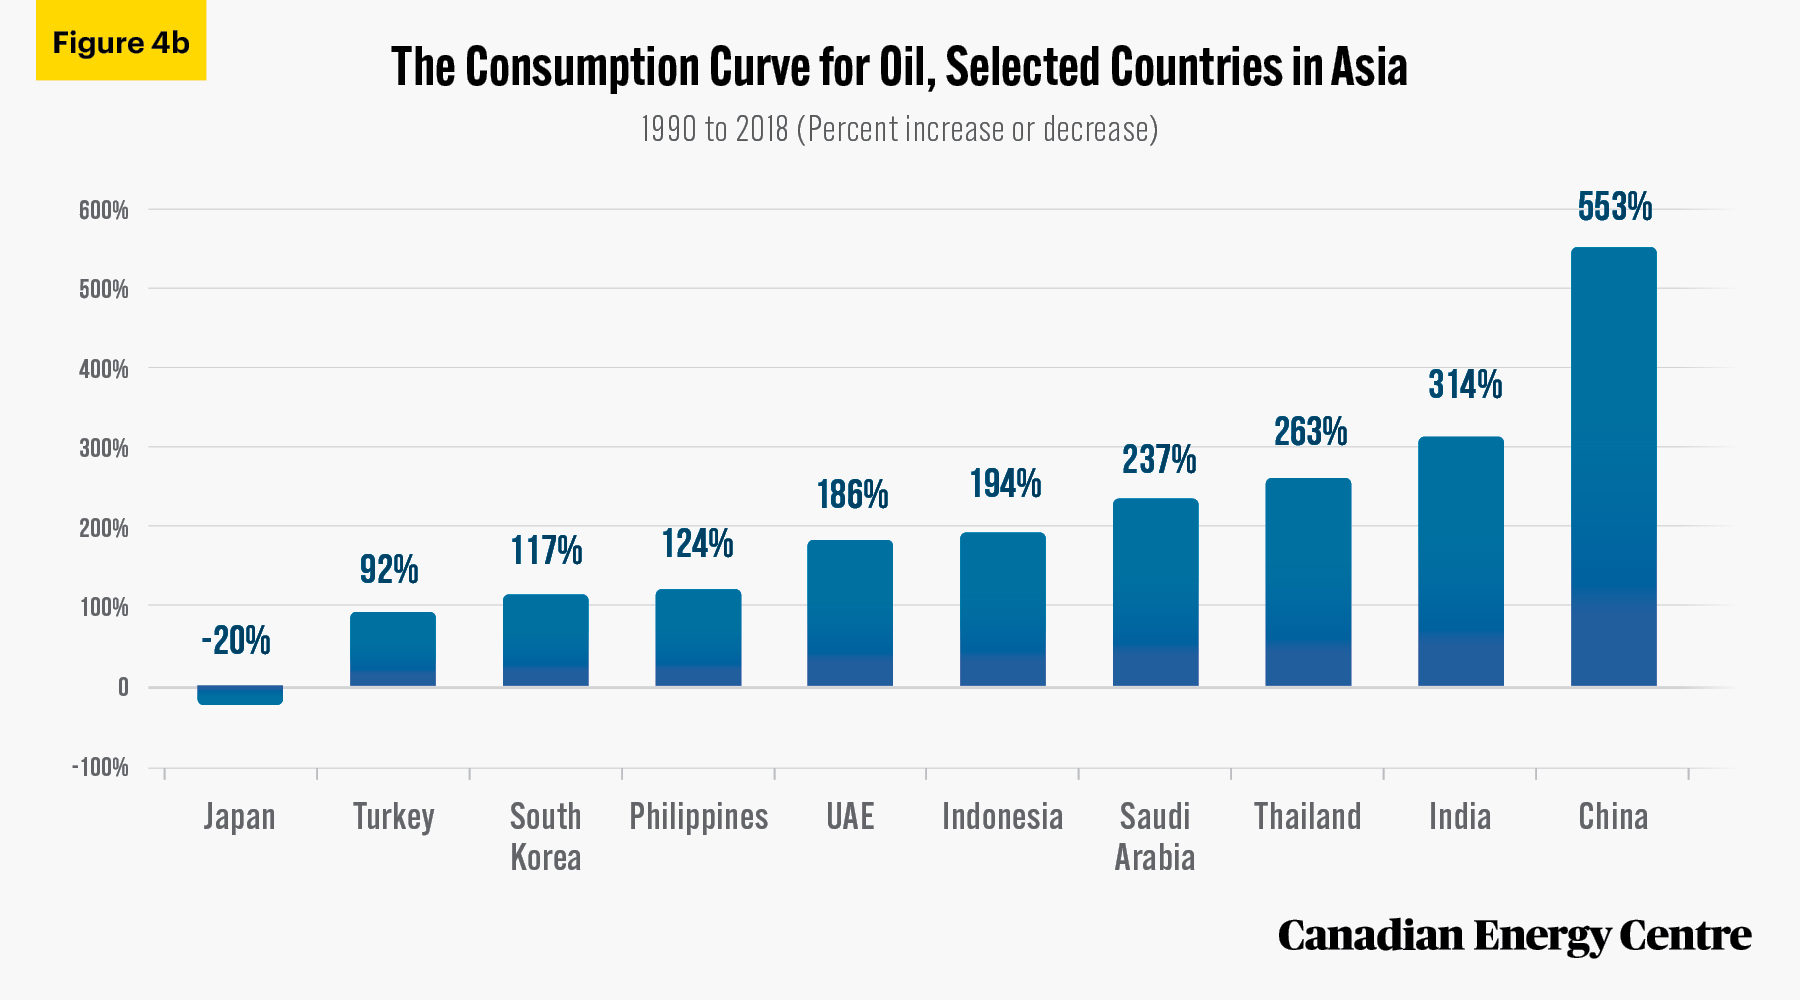
The largest African and Asian economies significantly increased their oil consumption between 1990 and 2018 (see Figure 4a and 4b)². They include :
- Ethiopia: from 0.6 Mtoe to 3.8 Mtoe, or 489 per cent higher;
- Tanzania: from 0.5 Mtoe to 2.1 Mtoe, or 358 per cent higher;
- Ghana: from 0.9 Mtoe to 4.1 Mtoe, or 356 per cent higher;
- China: from 82 Mtoe to 535 Mtoe, or 553 per cent higher;
- India: from 50 Mtoe to 208 Mtoe, or 314 per cent higher; and
- Thailand: from 14.9 Mtoe to 54.1 Mtoe, or 263 per cent higher.
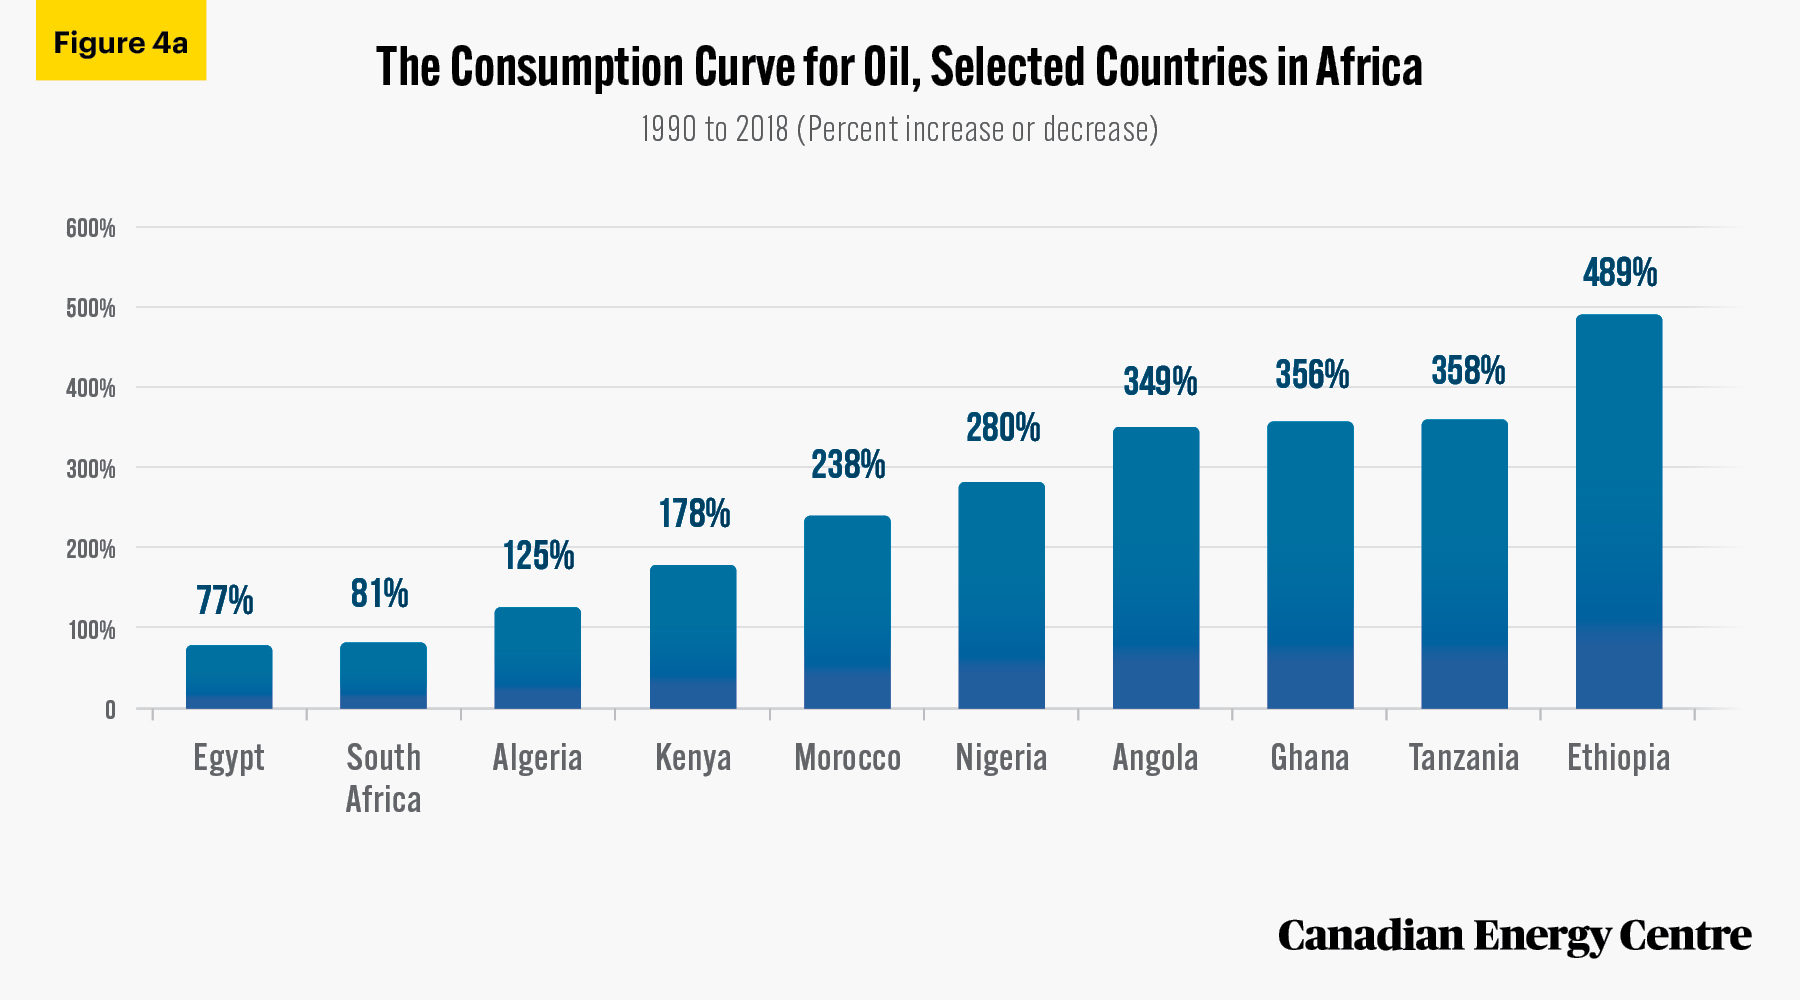
Source: IEA (2021b) and calculation by authors.
Source: IEA (2021b) and calculation by authors.
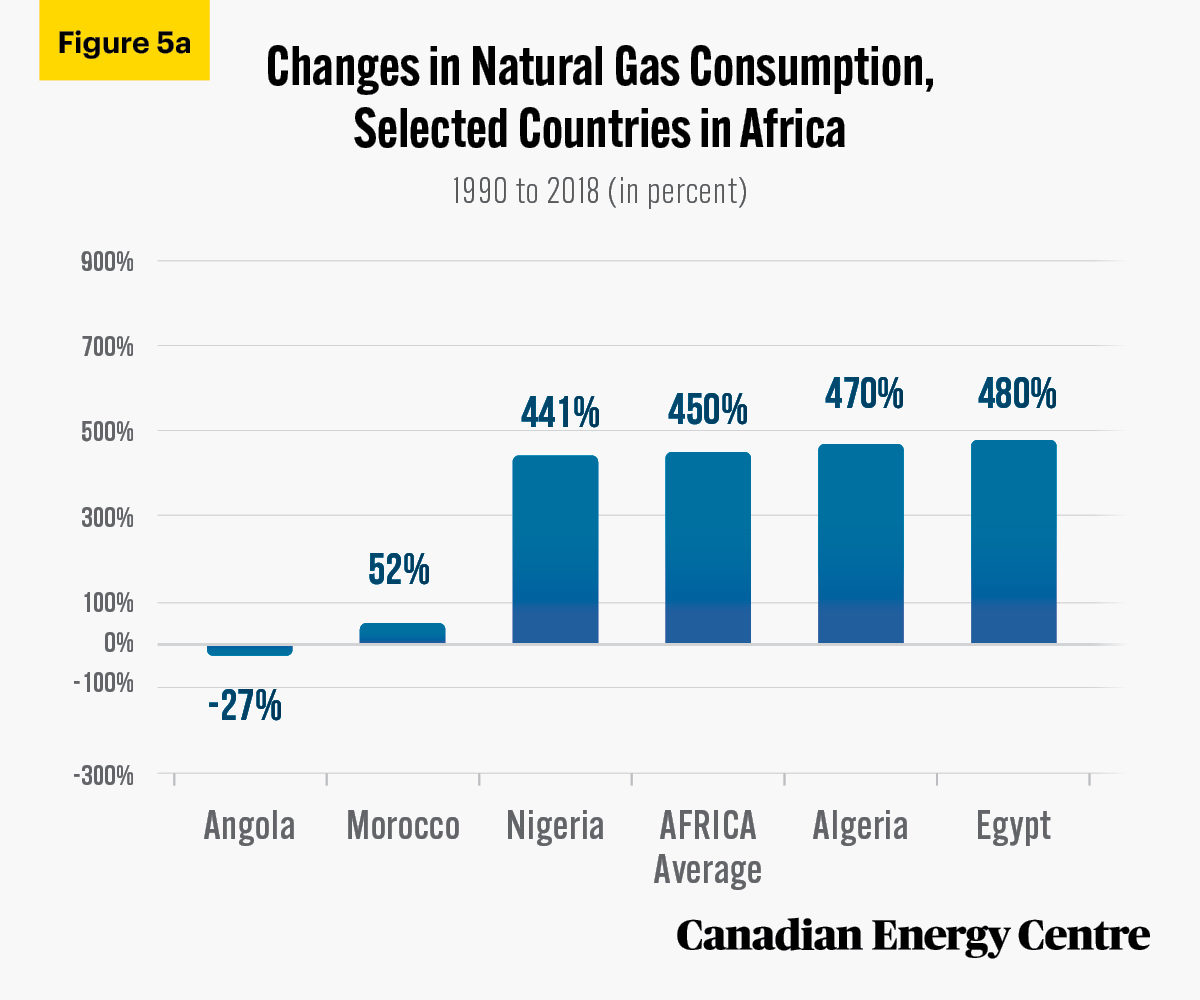
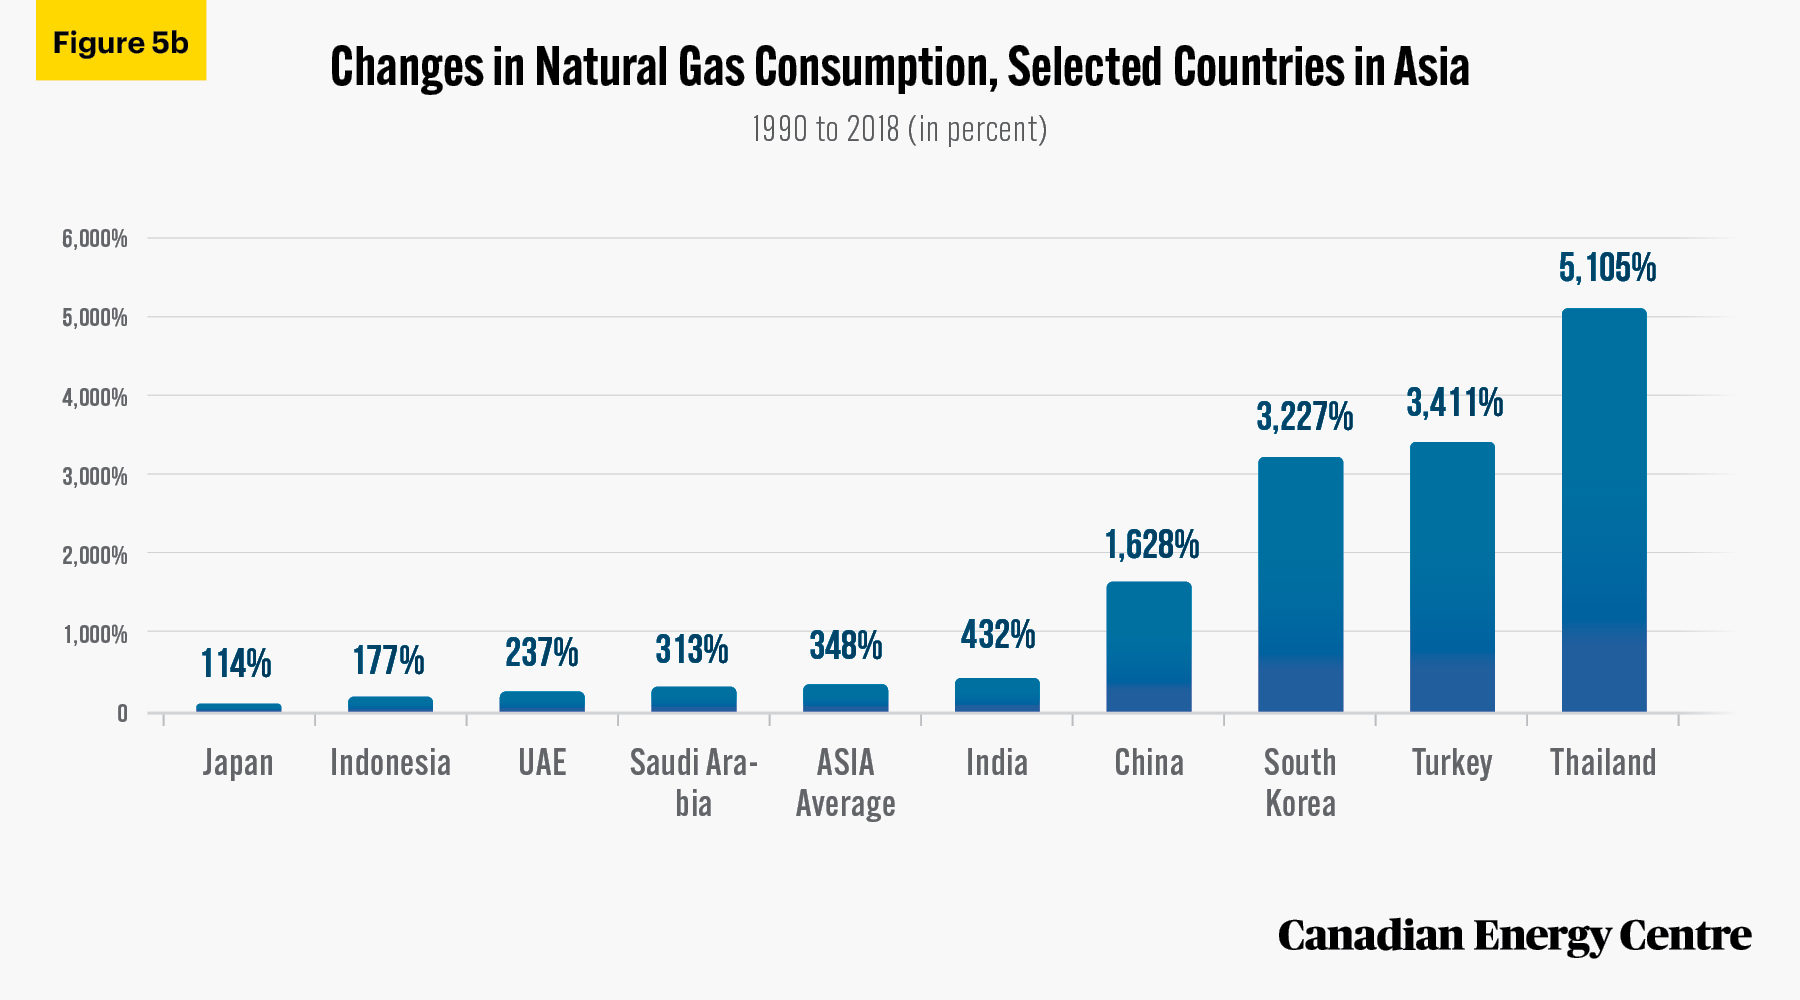
Natural gas consumption in Africa and Asia
Africa’s natural gas consumption in 2018 was 47.2 Mtoe,³ a jump of 450 per cent from 8.6 Mtoe in 1990. Asia’s consumption of natural gas increased from 128 Mtoe in 1990 to 574 Mtoe in 2018, a surge of 348 per cent. In 2018, Nigeria, Egypt, and Algeria were the largest consumers of natural gas in Africa while China, India, and the UAE were the leading consumers of natural gas in Asia. Most African and Asian economies increased their gas consumption significantly between 1990 and 2018 with those in the Asian economies showed the largest percentage increase (Figure 5a and 5b).
2. For ease of comparison, data have been rounded to nearest whole numbers. Data and percentage calculations are derived from original Mtoe data, including decimal points, and are rounded. Percentage calculations based on the rounded data figures (i.e., in Table 2) will result in different percentages.
3. The general conversion factor for converting from Mtoe to MBtu is 3.968 x 10⁷.
Source: IEA (2021b) and calculation by authors.
Source: IEA (2021b) and calculation by authors.
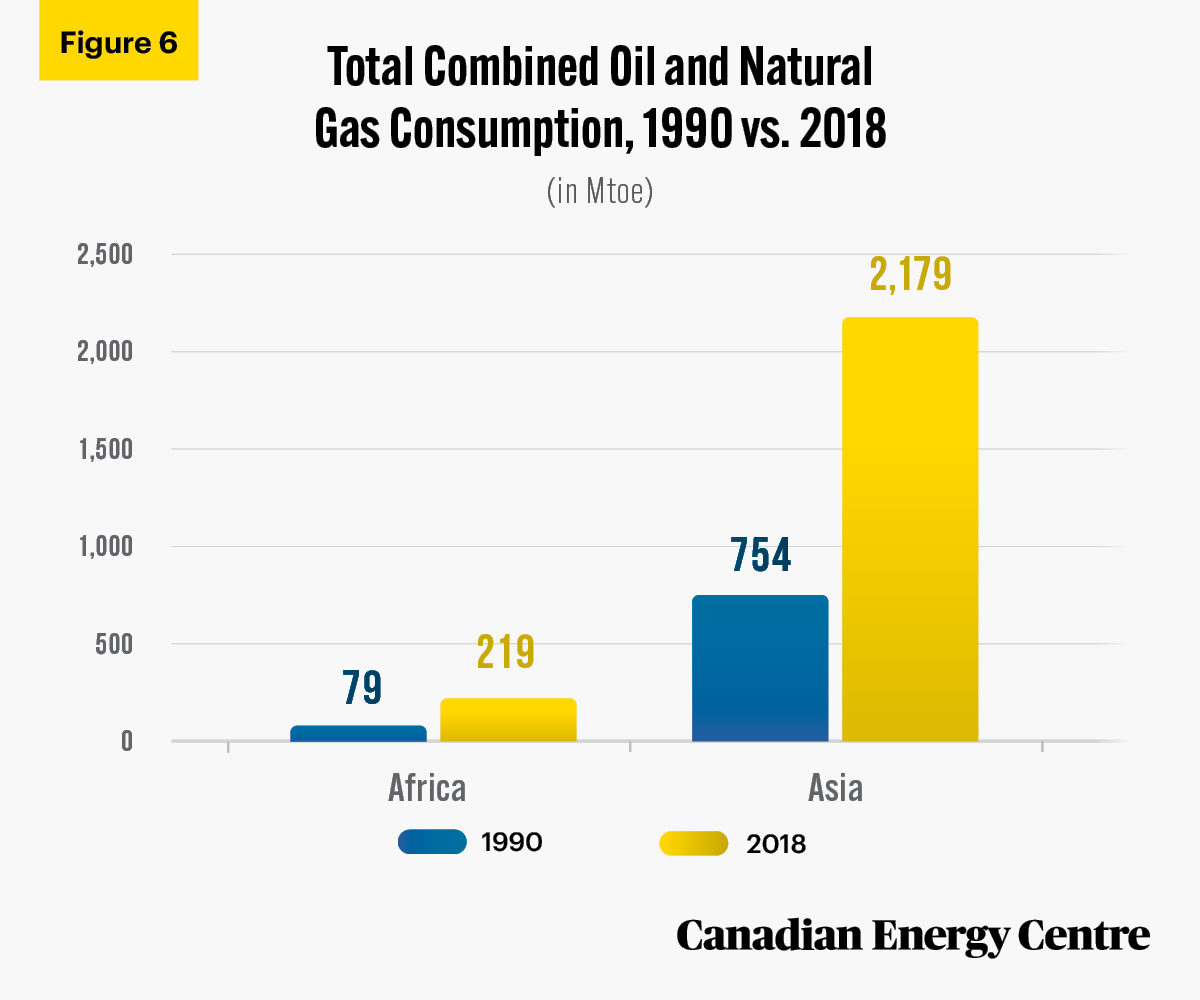
Oil and natural gas consumption by sector in Africa and Asia
Between 1990 and 2018, the combined consumption of oil and gas⁴ reached 219 Mtoe in 2018, an increase of 177 per cent from 79 Mtoe in 1990. In Asia, the combined consumption of oil and gas was 2,179 Mtoe in 2018, an increase of 189 per cent from 754 Mtoe in 1990 (see Figure 6).
4. Combined consumption of oil and gas is the sum of the consumption in the end-use sectors and for non-energy use.
Source: IEA (2021b) and calculations by authors.
Oil and gas consumption in Africa, by sector
African countries significantly increased their oil and gas consumption between 1990 and 2018 in various sectors (see Table 3 and Figure 7). They include:
- Africa’s commercial and public service sector increased their use of oil and gas by 377 per cent from 0.4 Mtoe to 2.1 Mtoe;
- Africa’s agricultural and forestry demand increased from 1.9 Mtoe to 4.6 Mtoe or 144 per cent higher; and
- Demand from Africa’s residential sector increased from 11.1 Mtoe to 26 Mtoe, or 134 per cent higher.
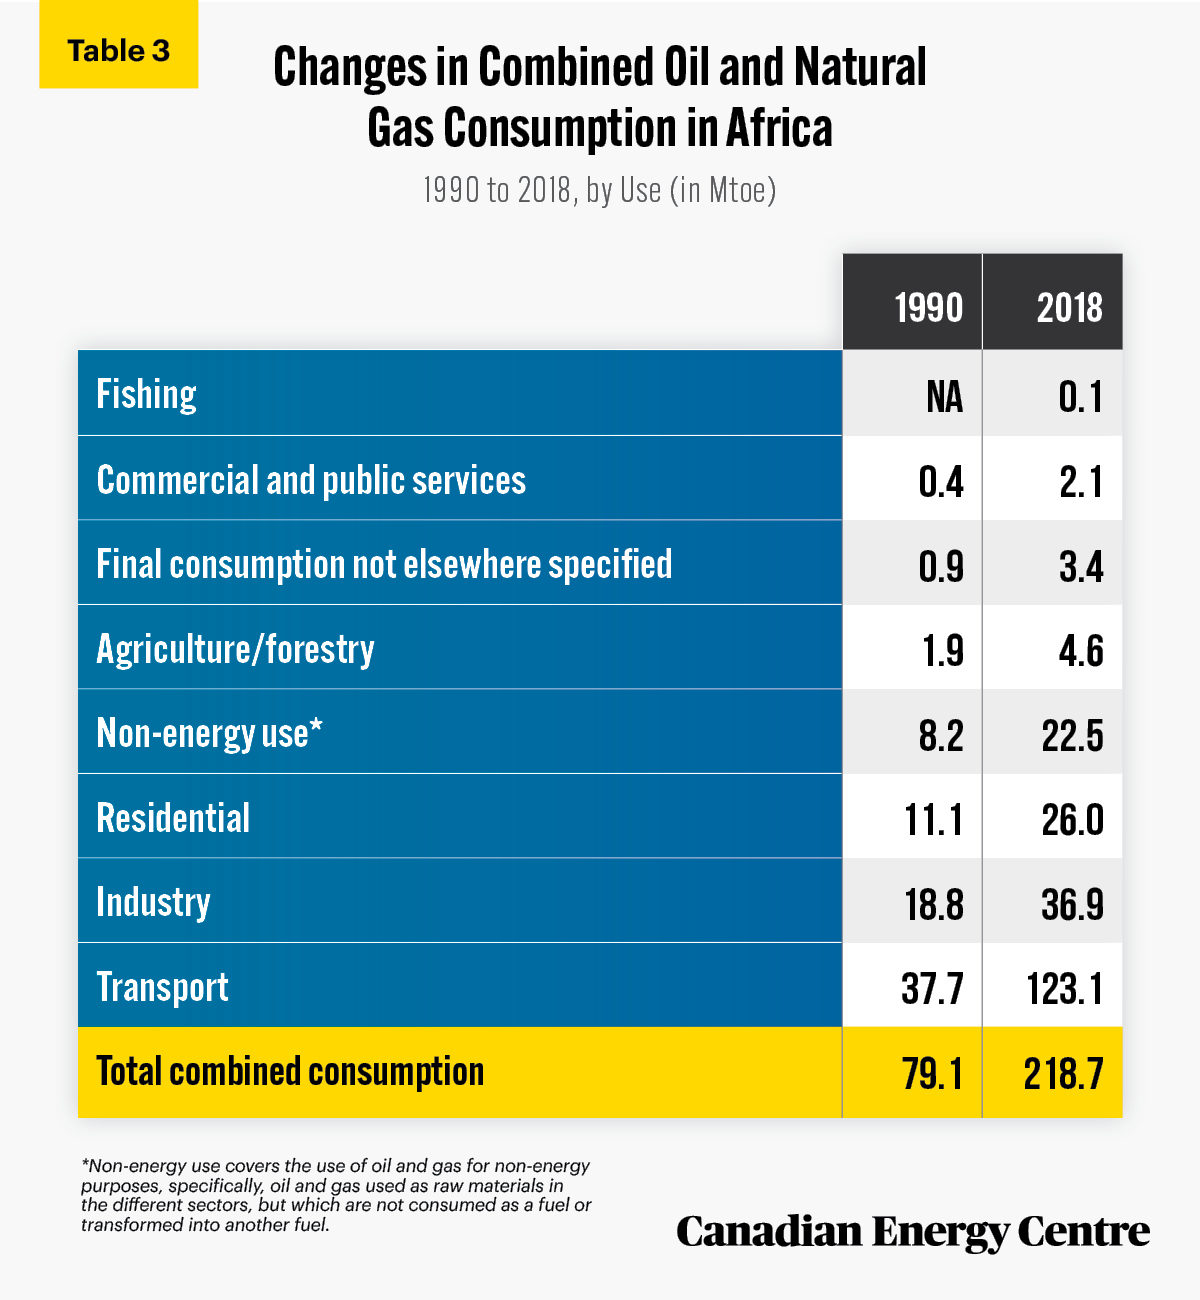
Source: IEA (2021b).
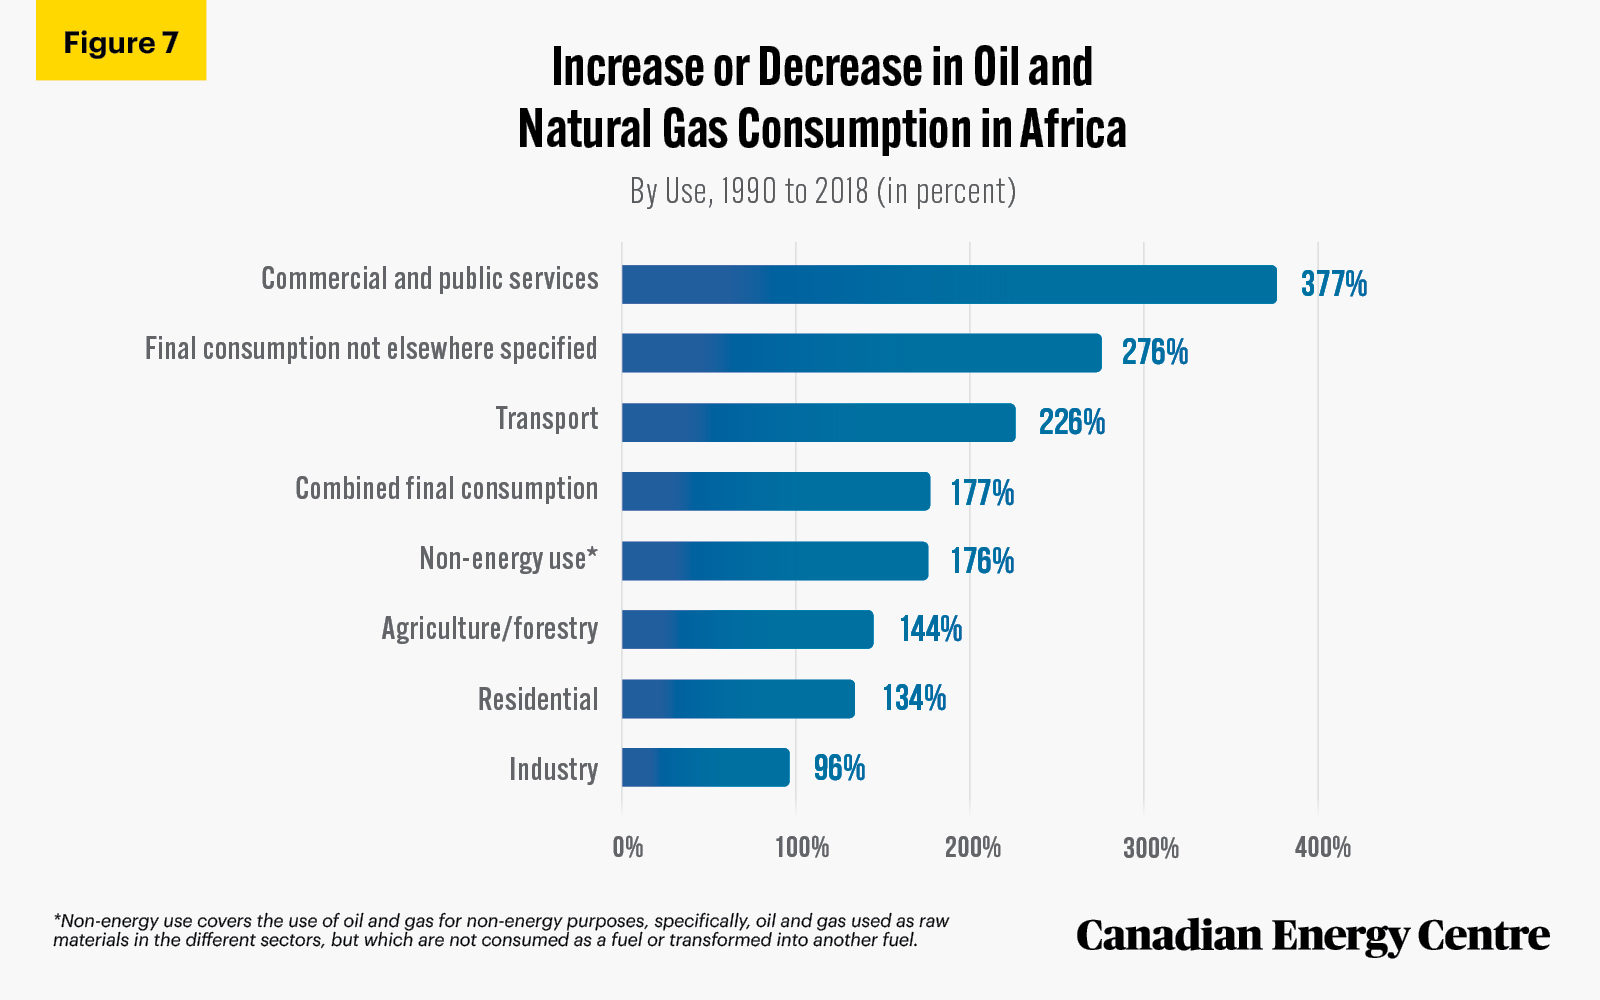
Source: IEA (2021b) and calculations by authors.
Oil and gas consumption in Asia, by sector
Consumption of oil and gas in Asia rose between 37 per cent and 276 per cent (excluding fishing, which fell by 14 per cent) across various sectors between 1990 and 2018 (see Table 4 and Figure 8). The breakdown by sector is as follows:
- Asia’s oil and gas use in the fishing sector decreased by 14 per cent from 3.9 Mtoe to 3.3 Mtoe;
- Asia’s agricultural oil and gas consumption increased from 37 Mtoe to 50.6 Mtoe, or 37 per cent higher; and
- Demand for oil and gas in Asia’s residential sector increased from 77.3 Mtoe to 257.7 Mtoe, or 233 per cent higher between 1990 and 2018.
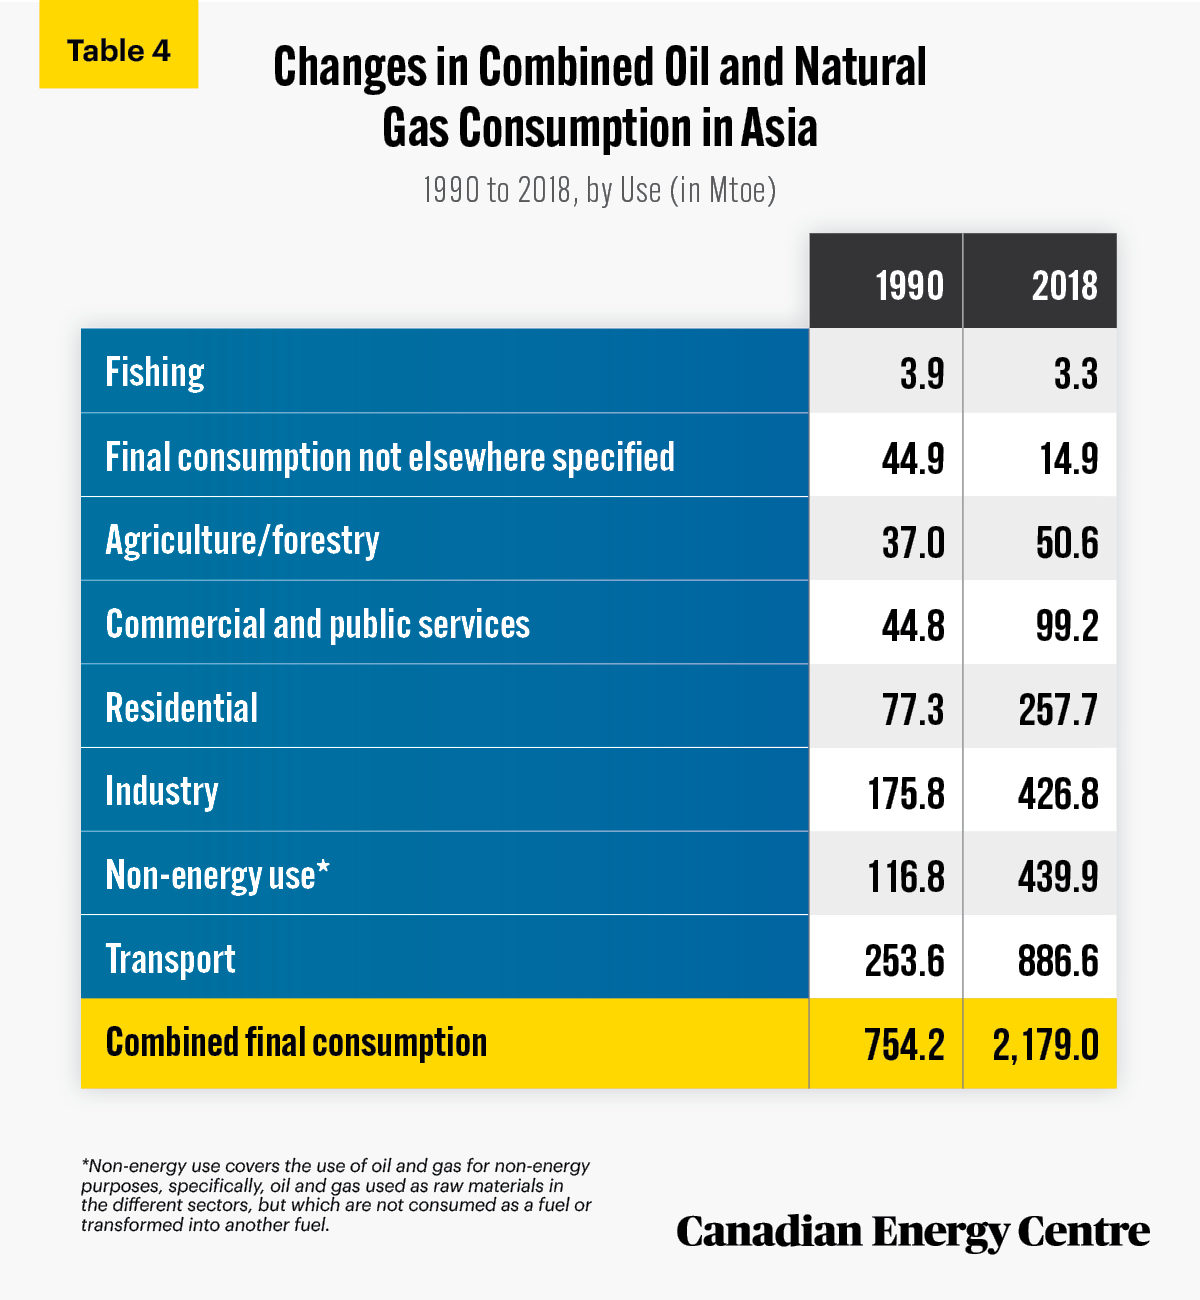
Source: IEA (2021b).
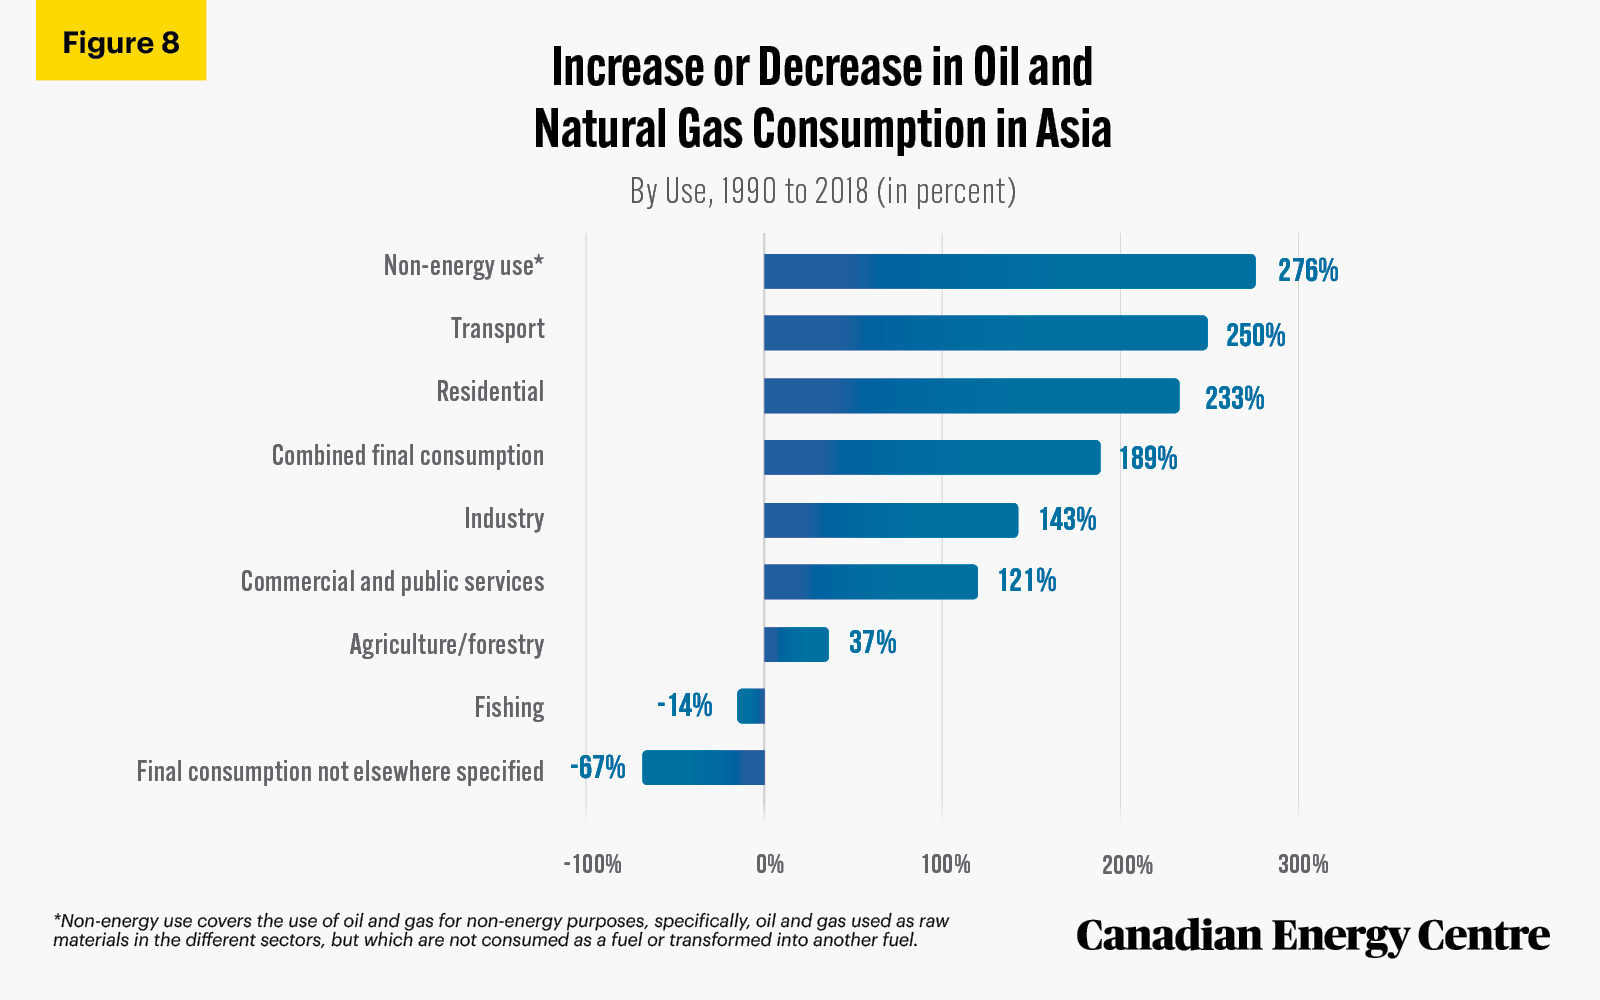
Source: IEA (2021b), and calculation by authors.
Oil and gas consumption in industry in African and Asia: Totals
Industry’s consumption of oil and gas in Asia increased from nearly 176 Mtoe in 1990 to reach almost 427 Mtoe in 2018. In Africa, the industrial use of oil and gas increased from 37.7 Mtoe to 123.1 Mtoe between 1990 and 2018 (see Figure 9).
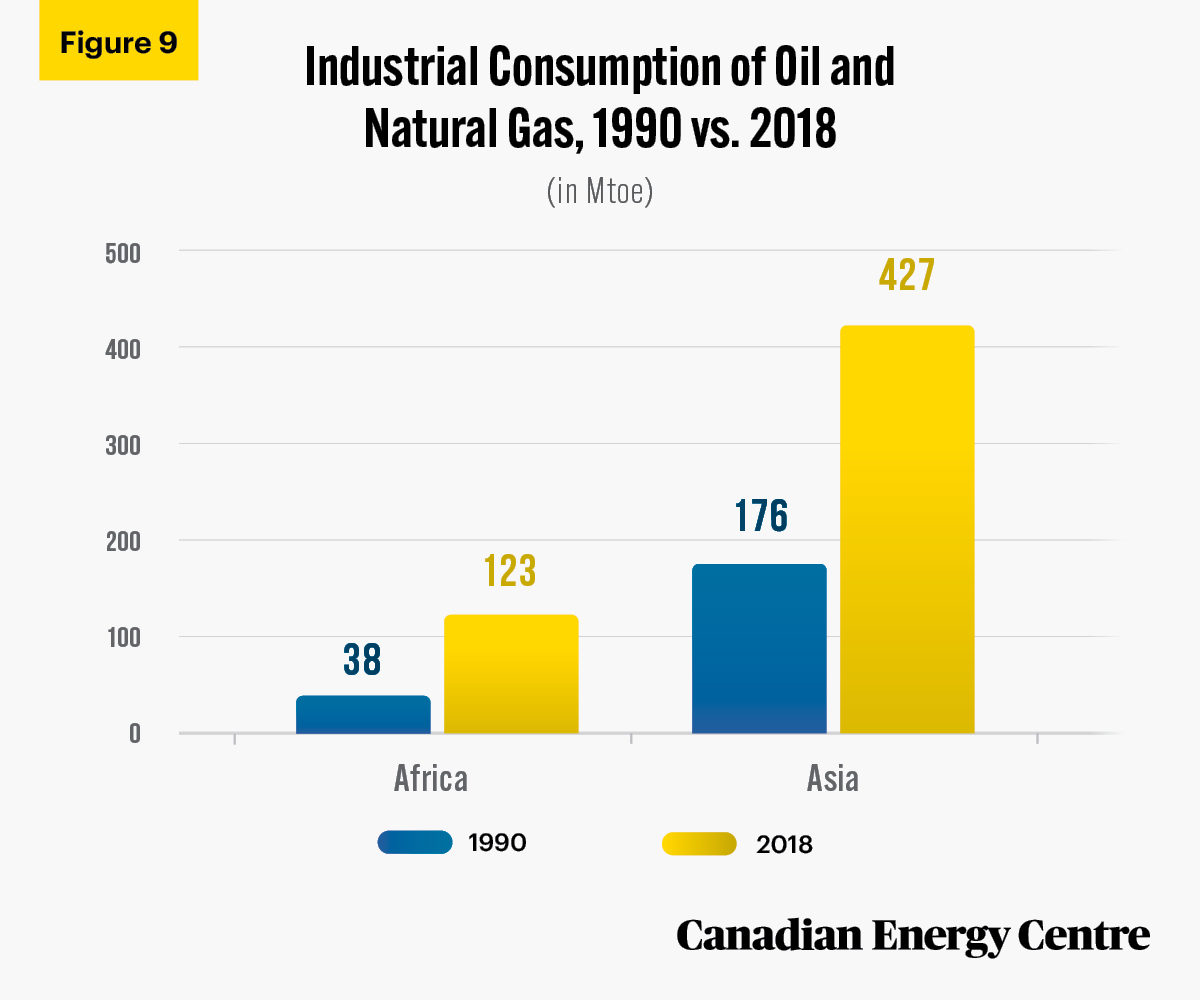
Source: IEA (2021b) and calculations by authors.
The construction and industrial subsectors
The construction and industrial subsectors in Africa and Asia increased their consumption of oil and gas between 1990 and 2018.
In Africa, the increases were as follows:
- Chemical and petrochemical: From 1.0 Mtoe in 1990 to 1.8 Mtoe in 2018, or 80 per cent higher;
- Construction: From 0.8 Mtoe to 2.4 Mtoe, or 209 per cent higher;
- Iron and steel: From 0.3 Mtoe to 2.6 Mtoe, or 745 per cent higher; and
- Non-metallic minerals⁵: From 0.05 Mtoe in 1990 to 4.9 Mtoe in 2018, or 9,957 per cent higher.
In Asia, the following are the key changes in oil and gas consumption in the various sub-sectors between 1990 and 2018:
- Food and tobacco: From 6.2 Mtoe in 1990 to 12.7 Mtoe in 2018, or 106 per cent higher;
- Construction: From 6.4 Mtoe to 13.8 Mtoe, or 115 per cent higher;
- Machinery: From 9.0 Mtoe to 14.3 Mtoe, or 59 per cent higher;
- Iron and steel: From 13.3 Mtoe to 20.1 Mtoe, or 51 per cent higher;
- Non-metallic minerals: From 15.5 Mtoe to 39.9 Mtoe, or 157 per cent higher; and
- Chemicals and petrochemicals: From 28.9 Mtoe to 86.0 Mtoe, or 197 higher.
5. Industry producing goods such as glass, ceramic, cement, etc.
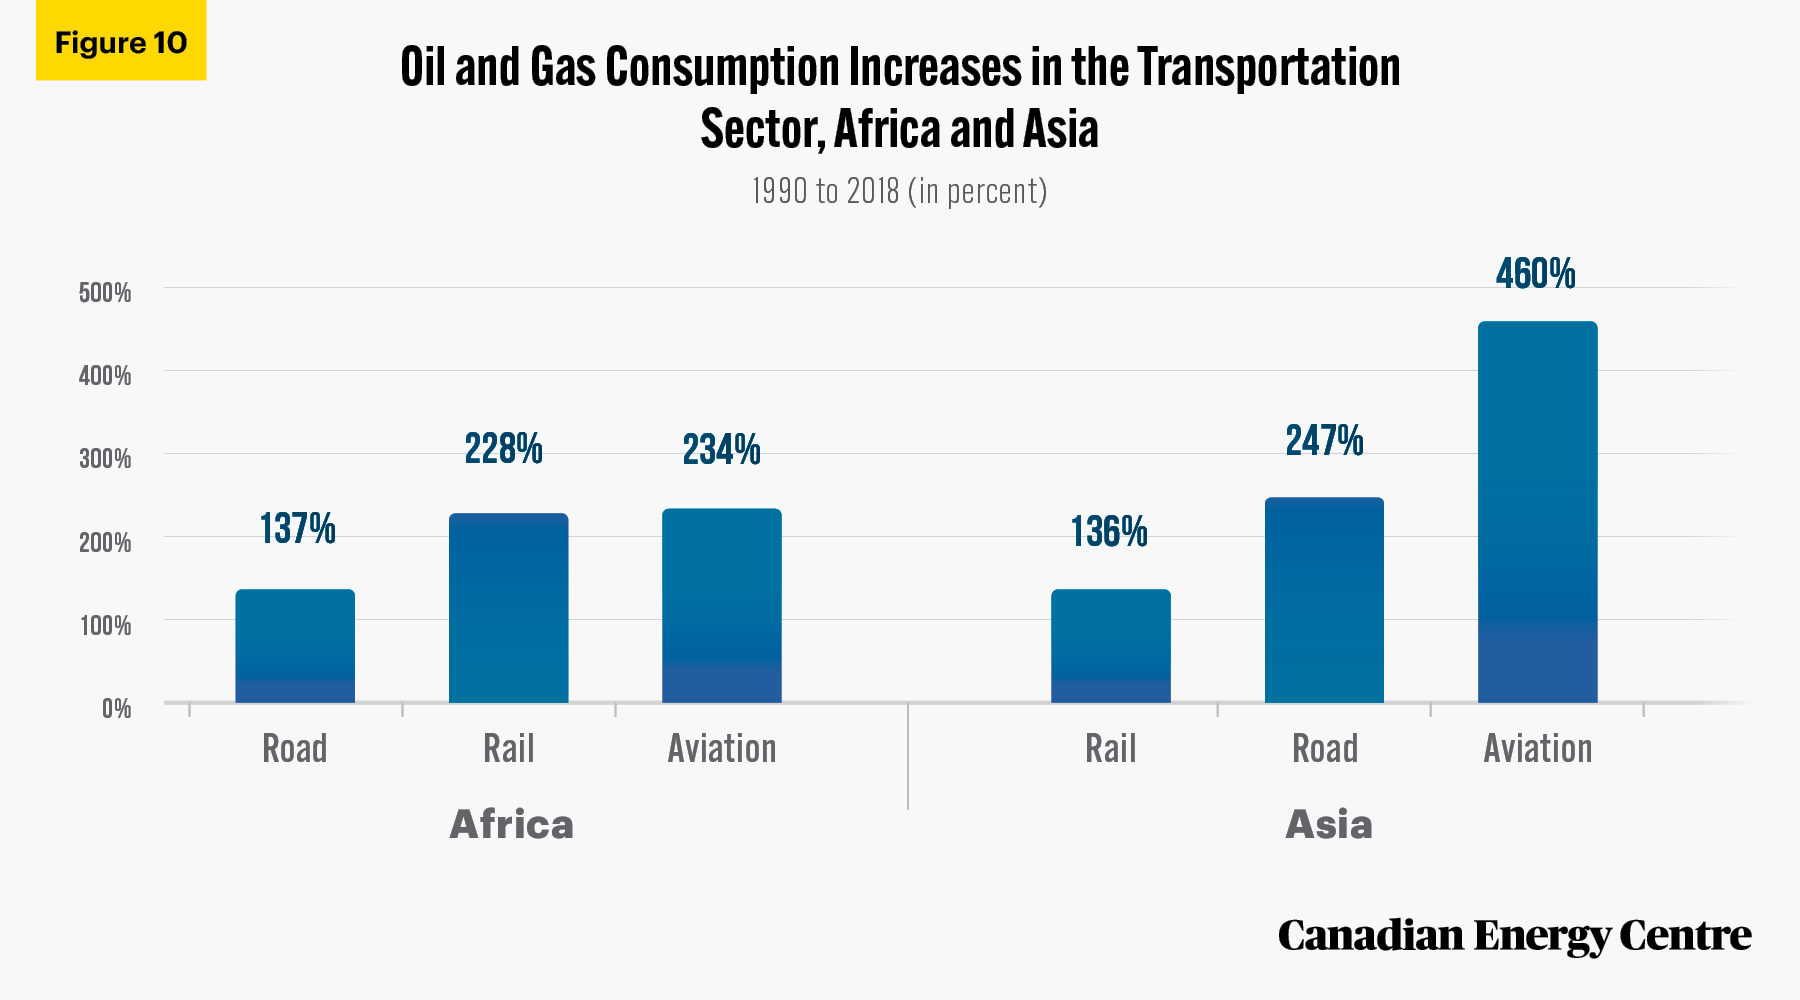
Demand by the transportation sector in Africa and Asia for oil and gas
Oil and gas use by road, aviation, and rail transportation increased significantly in Asia and Africa between 1990 and 2018 (see Figure 10). The rise in oil and gas consumption ranged from a 136 per cent increase by the rail transport subsector in Asia and a 137 per cent increase by the road transportation subsector in Africa to a 460 per cent increase by the aviation subsector in Asia.
Africa, Asia, and the call for a halt to oil and gas investment
Some observers might assert that the reality of past growth in oil and gas consumption in Africa and Asia is no guarantee that the trend will continue in the future. That is one possible outcome. However, key energy-using countries around the world such as Japan have indicated that they do not agree with the IEA’s call to cease oil and gas investment. Consider three major oil-consuming nations in Asia and some relevant statements, facts and forecasts.
- Japan’s Ministry of Economy has noted that Japan does not plan to stop oil, natural gas, and coal investment: “Japan needs to protect its energy security including a stable supply of electricity, so we will balance this with our goal of becoming carbon neutral by 2050” (Sonali and Obayashi, 2021).
- China’s demand for oil and natural gas is set to increase in the coming decades; the country is not yet near peak oil demand. Moreover, one state-owned Chinese oil and gas company alone is forecast to spend US$37 billion in capital expenditures in 2021 (Bloomberg, 2021).
- In India, the demand for oil is forecast to grow at a compounded annual growth rate of 4.2 per cent from the base year of 2017 and extending to 2040 (Invest India, n.d.).
Source: IEA (2021b) and calculation by authors.
Energy facts
Despite the above realities, in its May 2021 report the International Energy Agency asserted that no new investment in oil and natural gas exploration is required. However, this call for a dramatic end to oil and natural gas exploration—and then their production and consumption — must be placed in some context. As the report itself points out, at present some 700 million people in the world do not have access to electricity and 2.6 billion people do not have access to energy to cook a meal. Thus, given that billions of people are without electricity and other forms of energy to meet their basic daily requirements, the world needs and will likely attract more investment in the energy sector, including in oil and natural gas exploration and extraction, not less.

Despite the emphasis on investment in new forms of energy sources, including from the IEA, many policymakers often overlook core realties including whether transitional forms of energy are technologically feasible at present and, if not, what the results of drastic actions to curb fossil fuels would mean in practice. Those advocating for a transition from fossil fuels to wind, solar, and other renewables must consider the concept of energy density before trying to implement such goals.
Energy density facts
To understand why energy density matters, consider one of the world’s leading experts on energy transitions, University of Manitoba professor of the environment (emeritus) Vaclav Smil, who in his book, Energy, describes what energy is: “By far, the most common definition of energy is ‘the capacity for doing work’” (Smil, 2017). Smil then notes that the full implication of this seemingly simple statement “becomes clear only when you go beyond thinking about work as mechanical exertion—in physics terms, energy transferred through application of force over a distance, in common terms a labor to be performed….” In other words, before abandoning something as a source of energy—which is the call from many advocates and policymakers today—we must consider how little (or much) of that source it takes to produce the outcomes we need.
On the issue of technological feasibility, Smil has pointed out that “the reality of energy density in various forms of energy sources (be they oil, natural gas, coal, wind, solar and others) must be accounted for as part of any assumed transition” (Smil, 2017). In 2018, Science magazine (Voosen, 2018) cited Smil’s finding that energy transitions are normally transitions away from “relatively weak, unwieldy energy sources for those that pack a more concentrated punch.”
Perhaps the best way to grasp energy density or power density is the description Science offered in that same interview:
In the past, humanity has typically adopted energy sources that have greater “power density,” packing more punch per gram and requiring less land to produce. Renewables (green), however, are lower in density than fossil fuels (brown). That means a move to renewables could vastly increase the world’s energy production footprint, barring a vast expansion of nuclear power. (Voosen, 2018)
Instead, what we’re seeing in current attempts to transition away from fossil fuels does the opposite, or as Smil also remarked in 2018, trying to reverse that practical attention to energy density by moving to all-renewable sources of energy could require countries to, in the paraphrase of his words from Science, “devote 100 or even 1000 times more land area to energy production than today… [which] could have enormous negative impacts on agriculture, biodiversity, and environmental quality.”
Similarly, as Smil wrote for the University of Saskatchewan’s Johnson Shoyama School of Public Policy in 2020, “Designing hypothetical roadmaps outlining complete elimination of fossil carbon from the global energy supply by 2050 is nothing but an exercise in wishful thinking that ignores fundamental physical realities” (Smil, 2020).
Conclusion
Oil and gas are important energy sources for developed and developing economies worldwide, including in Asia and Africa. In the last three decades the total annual consumption of oil and gas in Africa and Asia rose from 833 Mtoe in 1990 to 2,397 Mtoe in 2018, an increase of 188 per cent. The growth in both the populations and the economies of those continents have led to a significant increase in oil and gas consumption.
Africa’s population is forecast to double in the next 30 years to reach 2.6 billion people, and Asia will increase its population by 1 billion in the same period. In the coming decades, given population growth, energy demands, and the reality of energy density, oil and gas will be a vital energy source for the economies of those two regions, despite the aspirations of the IEA and other policymakers.
References
African Development Bank Group (2021). African Economic Outlook 2021 (April). <https://bit.ly/2SyW5iX>.
Asian Development Bank Group (2021). Developing Asia’s Economic Outlook (April). <https://bit.ly/3h3NwpI>.
Bloomberg (February 9, 2021), China Needs to Hit Peak Oil Long Before It Reaches Net-Zero Emissions <https://bloom.bg/344fz15>.
IEA (2021a). Net Zero by 2050. <https://bit.ly/3dnjiMo>.
IEA (2021b). IEA World Energy Statistics (database). <https://bit.ly/34nYWOF>.
Invest India (n.d.), Snapshot: World’s Fastest-Growing Energy Market <https://bit.ly/3hLjrw2>.
International Monetary Fund [IMF] (2021). World Economic Outlook: Managing Divergent Recoveries (April). <https://bit.ly/2UnchUV>.
Murtaugh, Dan and Krystal Chia (March 25, 2021), The Oil Industry’s Biggest Spending Driller Is Now in China, Bloomberg <https://bit.ly/3wiIk6e>
Smil, (2017). Energy: A Beginner’s Guide, 2nd Edition. One World.
Smil, (2020). What We Need to Know about the Pace of Decarbonization. Johnson Shoyama Graduate School of Public Policy, University of Saskatchewan. <https://bit.ly/3c02HO7>.
Sonali, Paul and Yuka Obayashi (May 20, 2021), Asia Snubs IEA’s Call to Stop New Fossil Fuel Investments, Globe and Mail <https://tgam.ca/3ueXrMR>.
United Nations [UN] (2021). 2019 Revision of World Population Prospects. <https://bit.ly/36bEReF>.
Voosen, Paul (March 21, 2018). Meet Vaclav Smil, the Man Who Has Quietly Shaped How the World Thinks about Energy. Science. <https://bit.ly/3f5eTPl>.
World Bank (2021). Open Data. <https://bit.ly/3AnXcDi>.
CEC Research Briefs
Canadian Energy Centre (CEC) Research Briefs are contextual explanations of data as they relate to Canadian energy data. They are statistical analyses released periodically to provide context on energy issues for investors, policymakers, and the public. The source of profiled data depends on the specific issue. All percentages in this report are calculated from the original data, which can run to multiple decimal points. They are not calculated using the rounded figures that may appear in charts and in the text, which are more reader friendly. Thus, calculations made from the rounded figures (and not the more precise source data) will differ from the more statistically precise percentages we arrive at using the original data sources.
About the authors
This CEC Research Brief was compiled by Ven Venkatachalam, Senior Research Analyst, and Mark Milke, Executive Director of Research, Canadian Energy Centre.
Acknowledgments
The authors and the Canadian Energy Centre would like to thank and acknowledge the assistance of anonymous reviewer, Philp Cross and Dennis Sundgaard for review of this paper.
Creative Commons Copyright
Research and data from the Canadian Energy Centre (CEC) is available for public usage under creative commons copyright terms with attribution to the Canadian Energy Centre. Attribution and specific restrictions on usage including non-commercial use only and no changes to material should follow guidelines enunciated by Creative Commons here: Attribution-NonCommercial-NoDerivs CC BY-NC-ND.
Photo Credits
Scott Webb, Zhang Kaiyv, Blue Ox Studio, Ethan Brooke, Tom Fisk, Oscar Chan, Pixabay, Yuri Kim, Markus Winkler, Darshak Pandya, Markus Distelrath, Mathia P.R. Reding.
Share This:


