


 CDN NEWS |
  US NEWS


Five democratic G20 nations rely heavily on oil imports deemed to be ‘Not Free’
Download the PDF here
Download the charts here
Overview
This Research Brief analyzes 10 of the 13 free countries in the G20 and their dependency on what we categorize as “tyranny” oil and natural gas. That is, we examine nations listed as “Not Free” by the Washington, DC-based think tank, Freedom House, which has ranked nations worldwide on their degree of freedom since 1973.¹ We then use these rankings to determine which countries within the G20 are “Free” and how much of their imported oil and natural gas comes from countries that are not free.
Background
The G20 is a forum for cooperation among 19 countries plus the European Union. It describes itself as including developed and developing countries. The G20 also notes that its member countries “represent around 80 per cent of the world’s economic output, two-thirds of global population and three-quarters of international trade.”
In normal (non-pandemic) years, G20 leaders would meet in one of the member countries (the hosting country changes annually) to discuss financial and socioeconomic issues. In 2020, Saudi Arabia is the host for the virtual November 20-21 G20 leaders’ summit.
Counting only the countries within the G20 (i.e., not including the European Union) and using Freedom House rankings as a guide:²
- Thirteen countries are ranked as Free: Argentina, Australia, Brazil, Canada, France, Germany, India, Italy, Japan, South Africa, South Korea, the United Kingdom, and the United States;
- Two are ranked as Partly Free: Indonesia and Mexico; and
- Four are ranked as Not Free: China, Russia, Saudi Arabia, and Turkey.
Tyrannies, energy production, and exports
The use of the word “tyranny” in this Research Brief is a nod to the dictionary definition where one categorization of tyranny is “oppressive power,” especially “oppressive power exerted by government.” In essence, “not free” and “tyranny,” while not always interchangeable, overlap enough for our purposes:
- to give readers a sense of where oil and natural gas production occurs;
- under what type of regime; and,
- the degree of dependency on tyranny oil and natural gas by the free countries in the G20.
The “Free,” “Partly Free,” and “Not Free” Freedom House designations are paired with International Energy Agency (IEA) data on oil and natural gas imports for 10 of the 13 free countries to arrive at a measurement of their dependency on tyranny oil and natural gas.
This matters for a variety of reasons. As we found in our May Fact Sheet, The Tyranny Index for Oil and Gas, the data show that there has been a shift: dictatorial and authoritarian countries are capturing an ever-higher proportion of oil and natural gas exports. The result of this shift is that the money consumers pay for oil and natural gas is increasingly being directed to Not Free regimes that can then use the revenues to suppress their own people and/or flow those substantial revenues to regime leaders. This is the case in Russia,³ Saudi
Arabia,⁴ and Venezuela,⁵ among others.
In other instances, Not Free regimes can dramatically manipulate prices for oil and natural gas on the world market beyond what would occur in a normal economic “boom” or “bust” cycle. This dynamic was obvious in late February 2020 when Saudi Arabia’s energy ministry directed Saudi Aramco to raise production significantly and thus flood the world market with oil.⁶ Also, as Sergey Sukhankin pointed out in a 2020 paper for the University of Calgary’s School of Public Policy,
In 2016, Russia and Saudi Arabia agreed to cooperate in managing oil prices through the OPEC+ agreement. Their partnership deepened to the extent that the Kremlin excused some of Saudi Arabia’s recent dirty deeds, while the Saudis began making overtures to draw the Russians away from Iran in the Middle East. That came to an end after Russia rejected OPEC’s proposal to cut production by 1.5 million barrels per day…. In March, Igor Sechin, president of Rosneft, convinced President Vladimir Putin that if Russia could keep oil prices below $40 a barrel for an extended period, U.S. shale oil would no longer be economically attractive and the Americans would lose market share. Further, Russia knew that the coronavirus pandemic would suppress demand for oil, and prices would fall. An agreement with OPEC would have been an unwarranted favour to that organization. (Sukhankin, 2020)
Russia and natural gas
In addition to the potential harm from autocracies and tyrannies with undue influence over what would otherwise be a market product price, Not Free regimes can directly wield significant power over the supply of oil and natural gas exported to vulnerable populations. This occurred in 2009 when Russia cut the natural gas it was supplying to Ukraine in mid-winter over a pricing dispute.
Not Free regimes can also exert influence on relatively healthy democracies, or at least constrict their possible future policy and advocacy positions on critical matters. Germany, for instance, is now debating the danger of being over-reliance on imports of Russian natural gas (Kramer 2020), a reliance that will soon increase as the Nord Stream 2 natural gas pipeline is completed and becomes fully functional. This debate became especially acute after the August 2020 poisoning of Russian Opposition leader Alexei Navalny, which German Chancellor Angela Merkel, among others, blamed on the Kremlin (Der Spiegel, 2020, and NPR, 2020).
The head of Germany’s parliamentary committee on foreign affairs, Norbert Röttgen, urged the cancellation of Nord Stream 2, noting that “We need to respond with the only language that Putin understands, the language of natural gas” (Kramer 2020). Poland’s foreign minister Konrad Szymanski also cited the poisoning as a reason why Nord Stream 2 must be abandoned, arguing that the new natural gas pipeline “will make the European Union economically dependent on Russia and undermine our ability to take decisive steps against this type of malign behavior” (Szymanski, 2020).
The case for measuring the potential dependency of free countries on autocratic regimes and their behaviour is anchored in reality. It is thus worth measuring the degree to which free countries risk their own present and future freedom of action on multiple files — diplomatic, economic, strategic, and other. Their actions can be influenced, constrained, and even partly corrupted by the degree to which they are dependent on a basic necessity for the modern economy, i.e., imported energy, and specifically, imported oil and natural gas.
Ranking free countries in the G20 on tyranny oil and natural gas dependency
This section combines Freedom House rankings with data for oil and natural gas imports for 13 free G20 countries. Note that data are available for all 13 countries for natural gas imports but only for nine countries for crude oil imports. To measure the dependency on tyranny oil and natural gas, we
- track oil and natural gas self-sufficiency by country, i.e., how dependent a country is on imports versus its own oil and natural gas production;
- track the imports to each of the free countries by country of origin, i.e., where the oil and natural gas originates—Russia and Saudi Arabia, or Canada and the United States, for example;
- check the import countries against the Freedom House 2020 Index to determine the dependency of various free G20 countries (the 13) on tyranny oil and tyranny natural gas.
Oil and natural gas self-sufficiency by country
We begin by measuring oil and natural gas “self-sufficiency” by country (see Table 1). We determine self-sufficiency for both oil and natural gas by calculating oil production divided by “TES,” which is then expressed as a percentage. In everyday language, we calculate how much of a nation’s domestic needs are met by domestic and/or imported oil and natural gas.⁷
For example (see Table 1), Australia produces 319 per cent of the natural gas it needs for domestic purposes. In contrast, Germany is highly dependent on foreign oil and foreign natural gas, producing only 3 and 6 per cent respectively of its domestic consumption needs (IEA, 2019).
We do not assert that “self-sufficiency” is in and of itself a desirable concept. Such a term can be read as an endorsement of protectionism.⁸ This research brief does not argue for protectionism but notes the geopolitical realities of power, including that exercised by autocracies, and the possible danger that free G20 nations—and other free countries—face in being over reliant on those autocracies.
Table 1 shows that self-sufficiency in oil and natural gas ranges from as low as 1 per cent (oil) and 0 per cent (natural gas) for South Korea and France to 253 per cent for Canada (self-sufficient in oil), and 319 per cent for Australia (self-sufficient in natural gas).
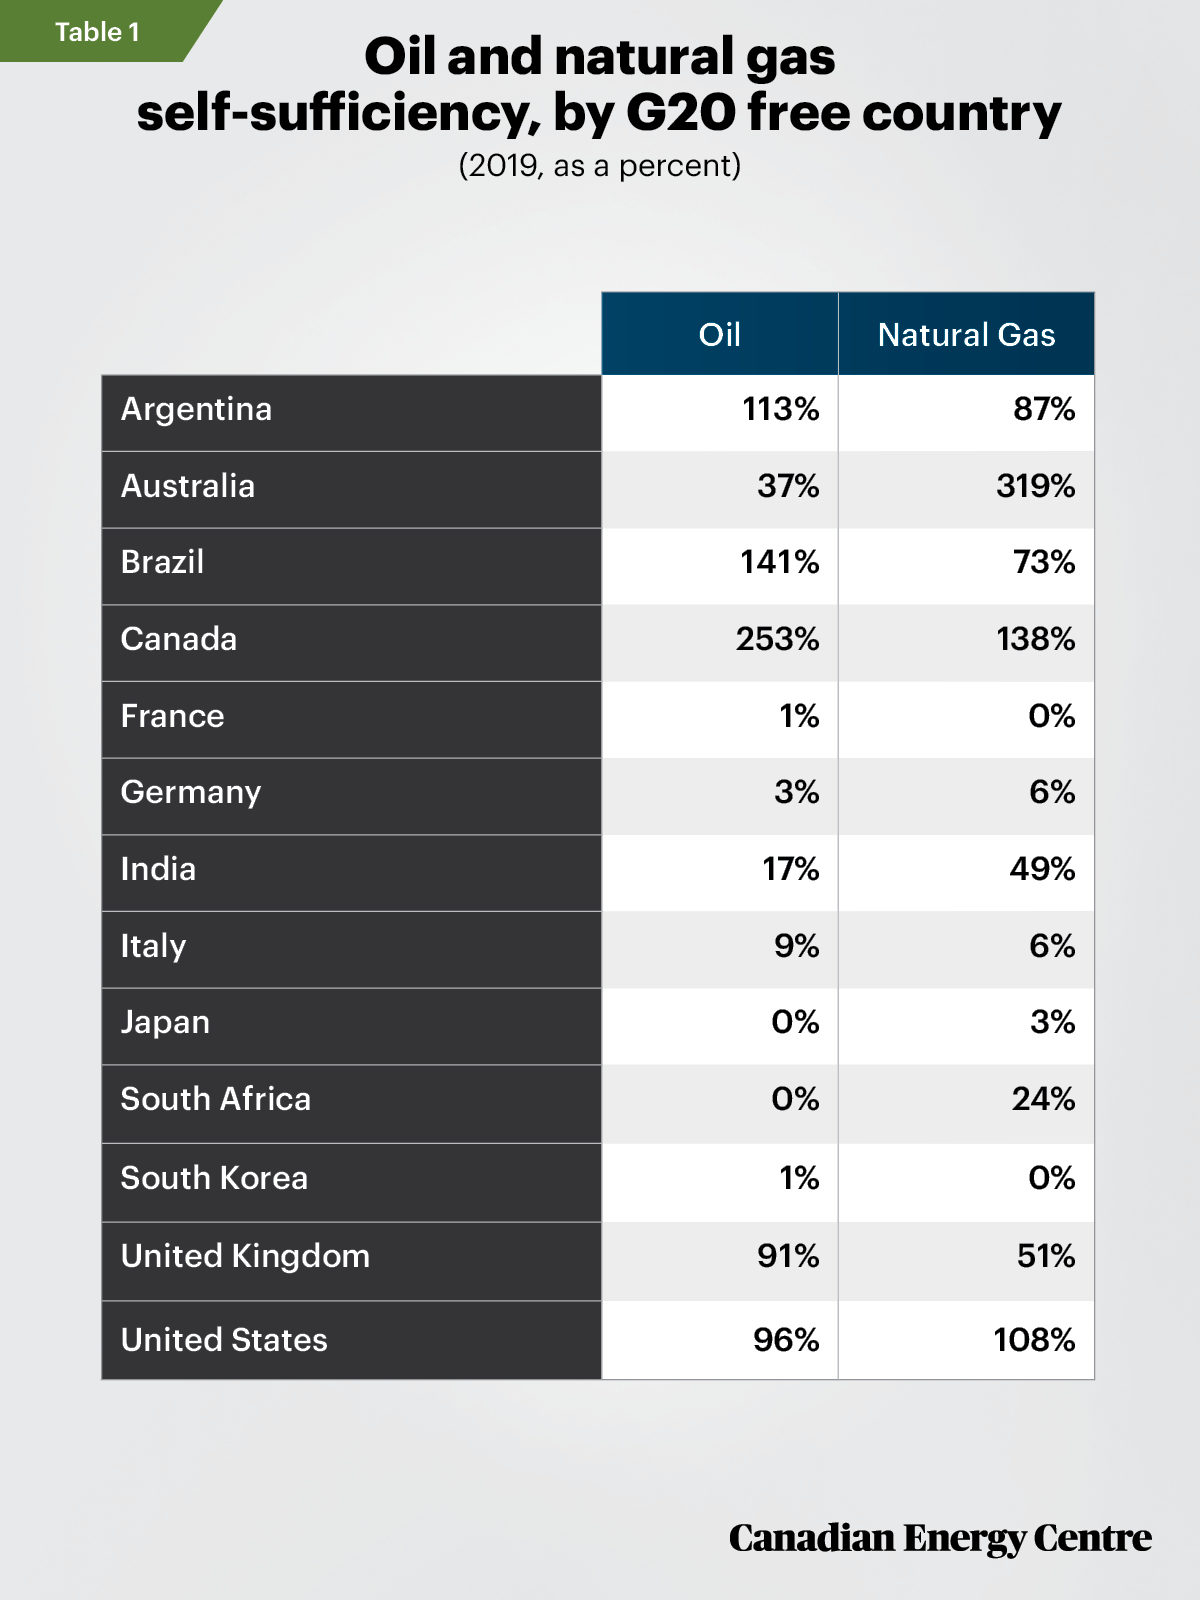
Source: International Energy Agency (2019).
Oil and natural gas import measurements
Volume of oil and natural gas imports
Table 2 measures the volume of all imports of oil and natural gas (in 1,000 kilotonnes for oil and in million cubic metres for natural gas) (see Table 2). Imports of oil for the G13 countries that are classified as free range from 17,245 kt for Australia to 335,158 kt for the United States. Import volumes of natural gas range from a low of 3,691 Mcm (million cubic metres) for South Africa to a high of 105,034 Mcm for Japan, with Germany at nearly the same level, 102,509 Mcm.⁹
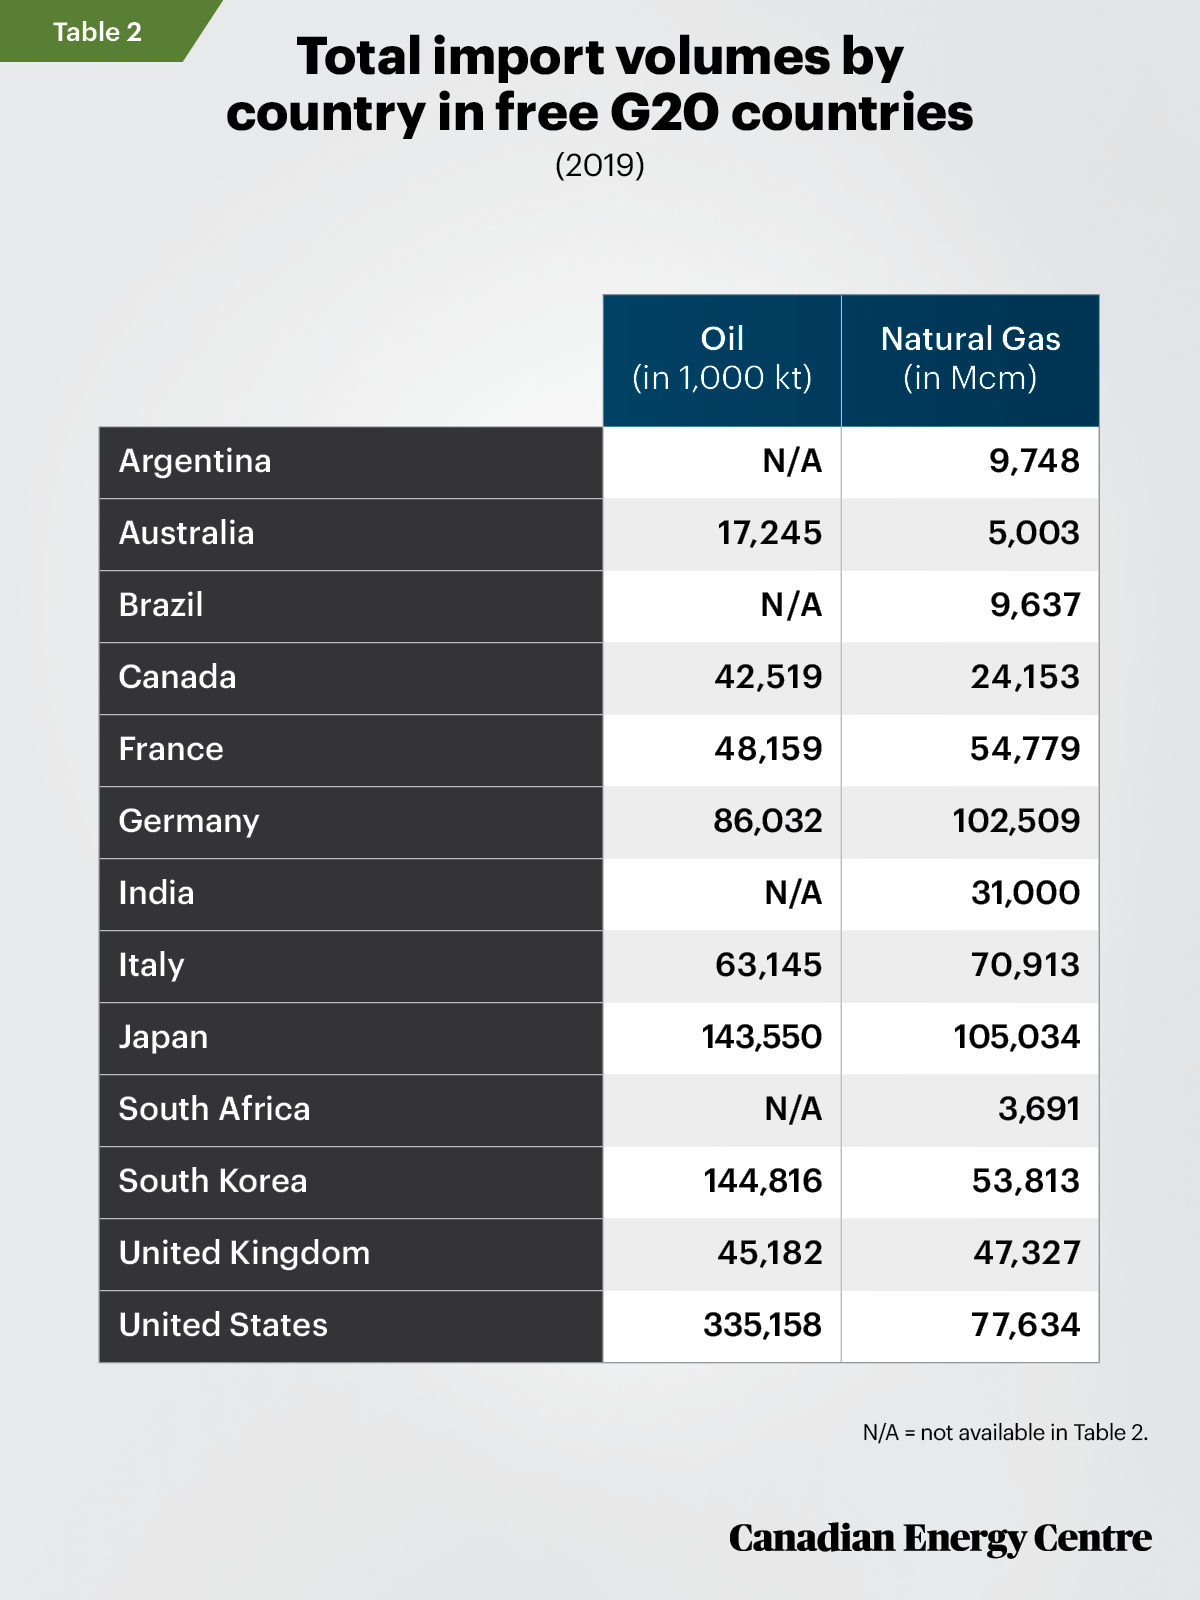
Sources: International Energy Agency (2019) and Freedom House (2020).
Oil and natural gas imports measured in US dollars: $716 billion in 2019
Table 3 indicates the value of oil and natural gas imports by country, in US dollars. Argentina, which banned oil imports in 2020, imported just $200 million worth of oil in 2019, while imports to the United States amounted to over $132 billion that year, the highest of the 13 free G20 countries. Imports of natural gas ranged from just $100 million for Australia to nearly $45 billion for Japan. Again, only the 13 free G20 countries were measured here. In total, the 13 free G20 countries imported $533.4 billion worth of oil and $182.3 billion worth of natural gas 2019—just under $716 billion in total.
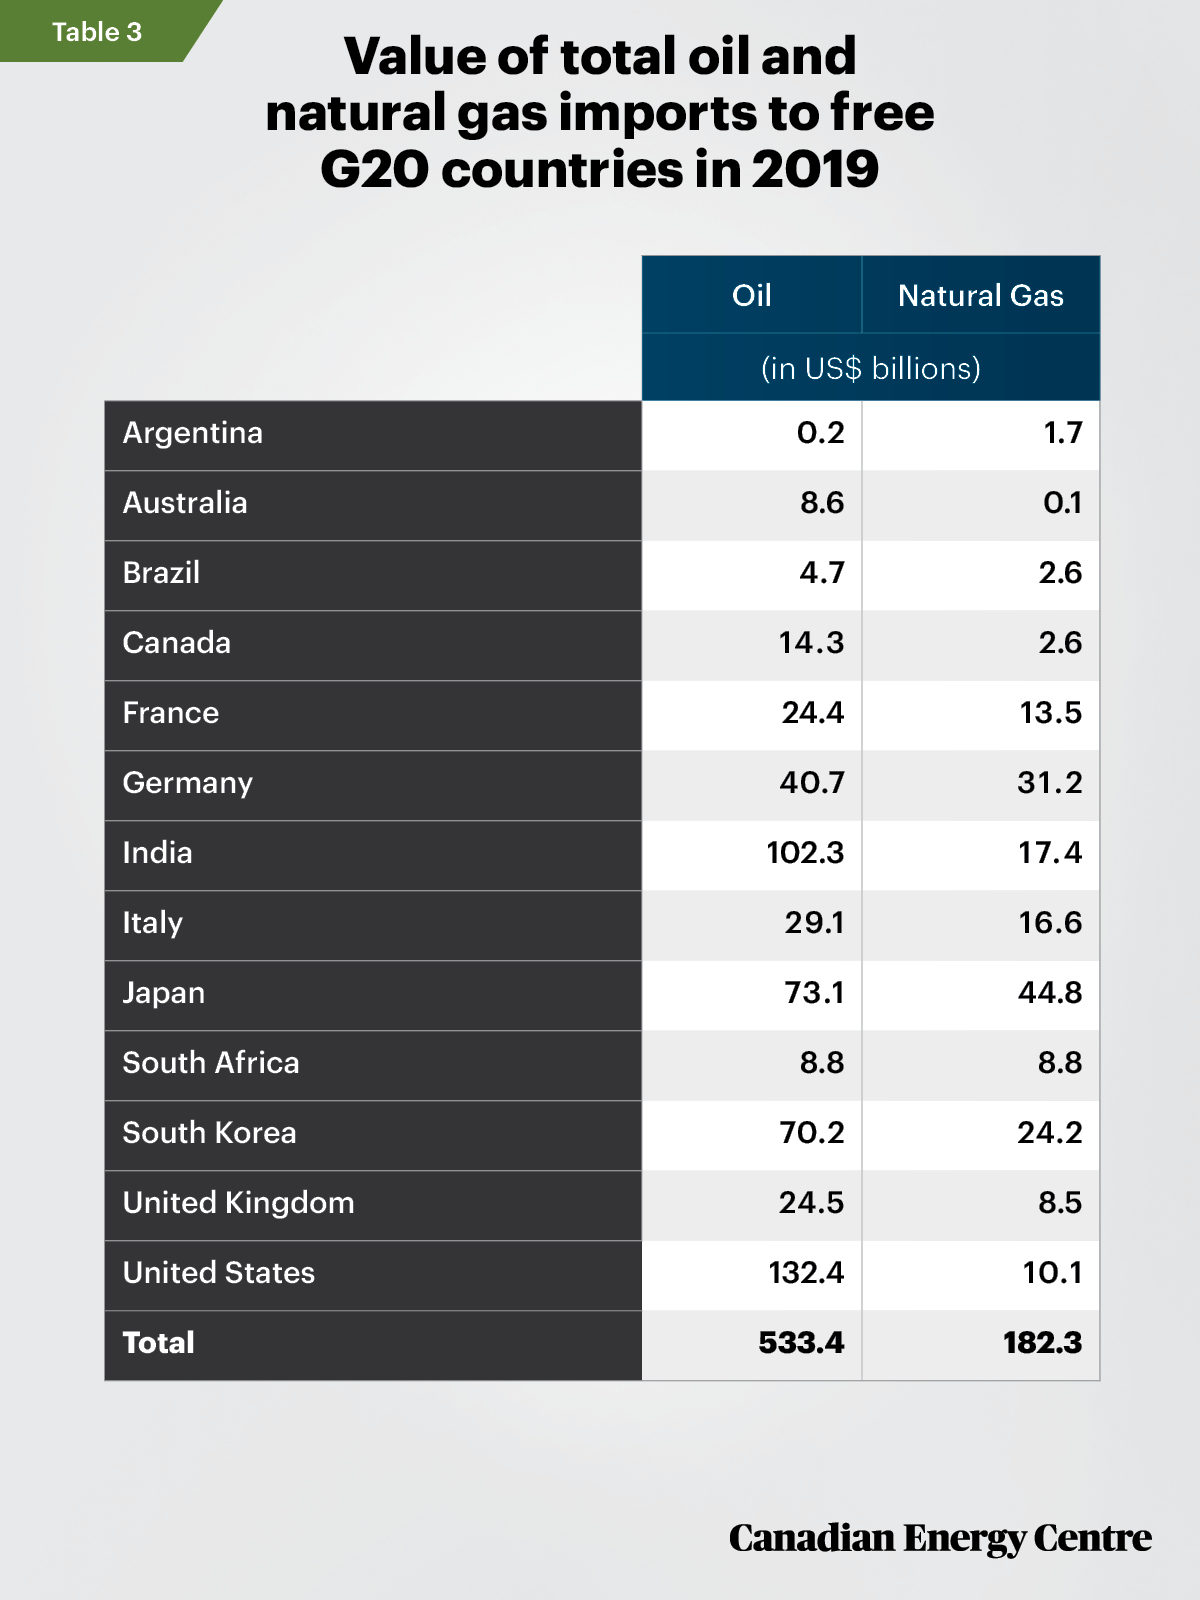
Source: International Trade Centre (undated).
Free countries and their dependency on tyranny oil and natural gas
A focus on 10 free G20 countries
Thirteen G20 nations are ranked as free by Freedom House, but the data vary on the quantities of oil and natural gas they import (as opposed to US dollar amounts, as in Table 3).
To better focus on major G20 countries that are democracies and are categorized as free by Freedom House, and that are potentially dependent on tyranny oil and natural gas, we thus have set the following parameters for the data analyses:
- Natural gas: The free country must have imported at least 10 billion cubic metres of gas in 2019. On this measurement, this excludes Argentina, Australia, Brazil, and South Africa.
- Oil: Because consistent quantity measurements of oil imports are not available for Argentina, Brazil, South Africa, and India, they are excluded from oil analyses.
The result is that this Research Brief measures 10 free G20 countries for one of, or both, oil and natural gas imports by volume: Australia, Canada, France, Germany, India, Italy, Japan, South Korea, the United Kingdom and the United States.
Oil imports and tyranny dependency
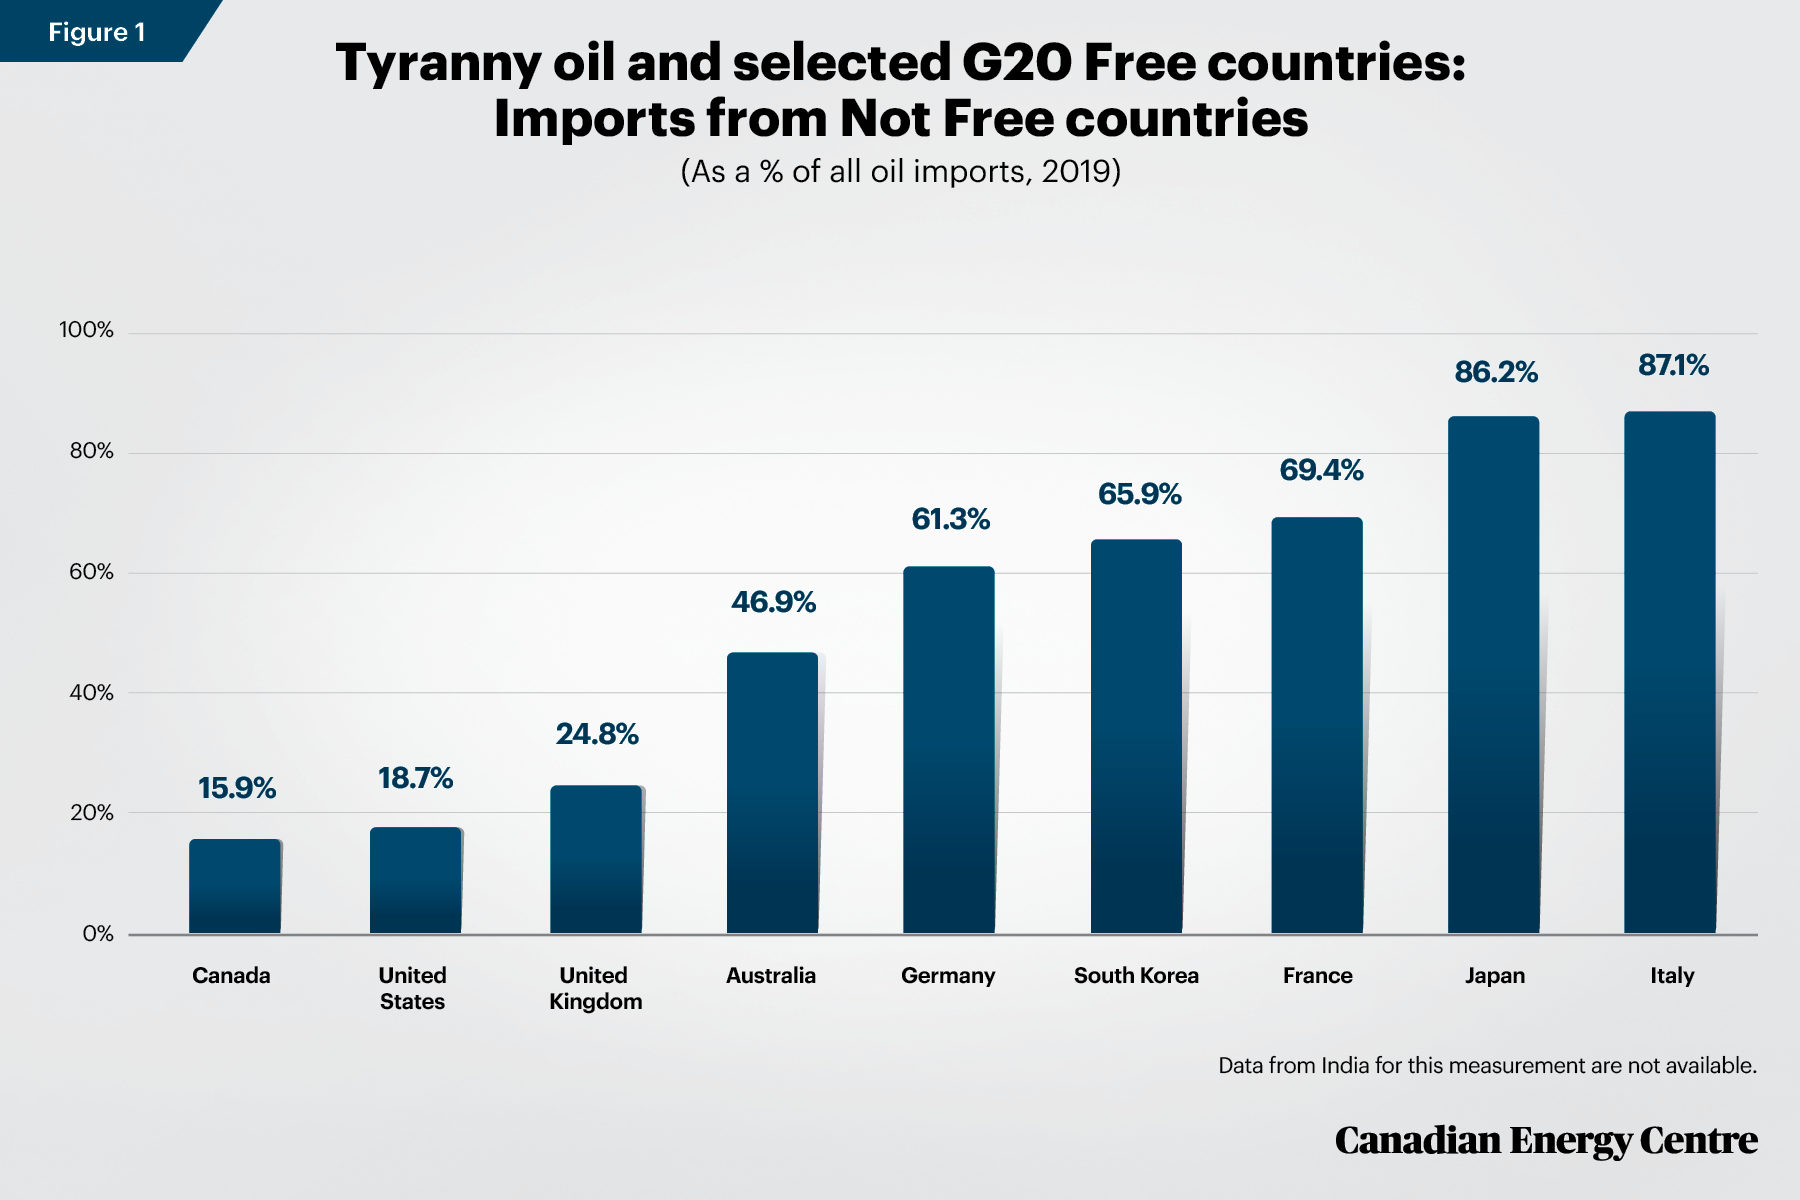
Among the 10 free G20 countries now profiled (see Figure 1), data on oil imports was not available for India. This section uses the Freedom House categories (Free, Partly Free, Not Free) to show the dependency ratio by country on Not Free oil, i.e., oil produced in tyrannies or autocracies as a percentage of all oil imports in the remaining 9 countries. The data show that
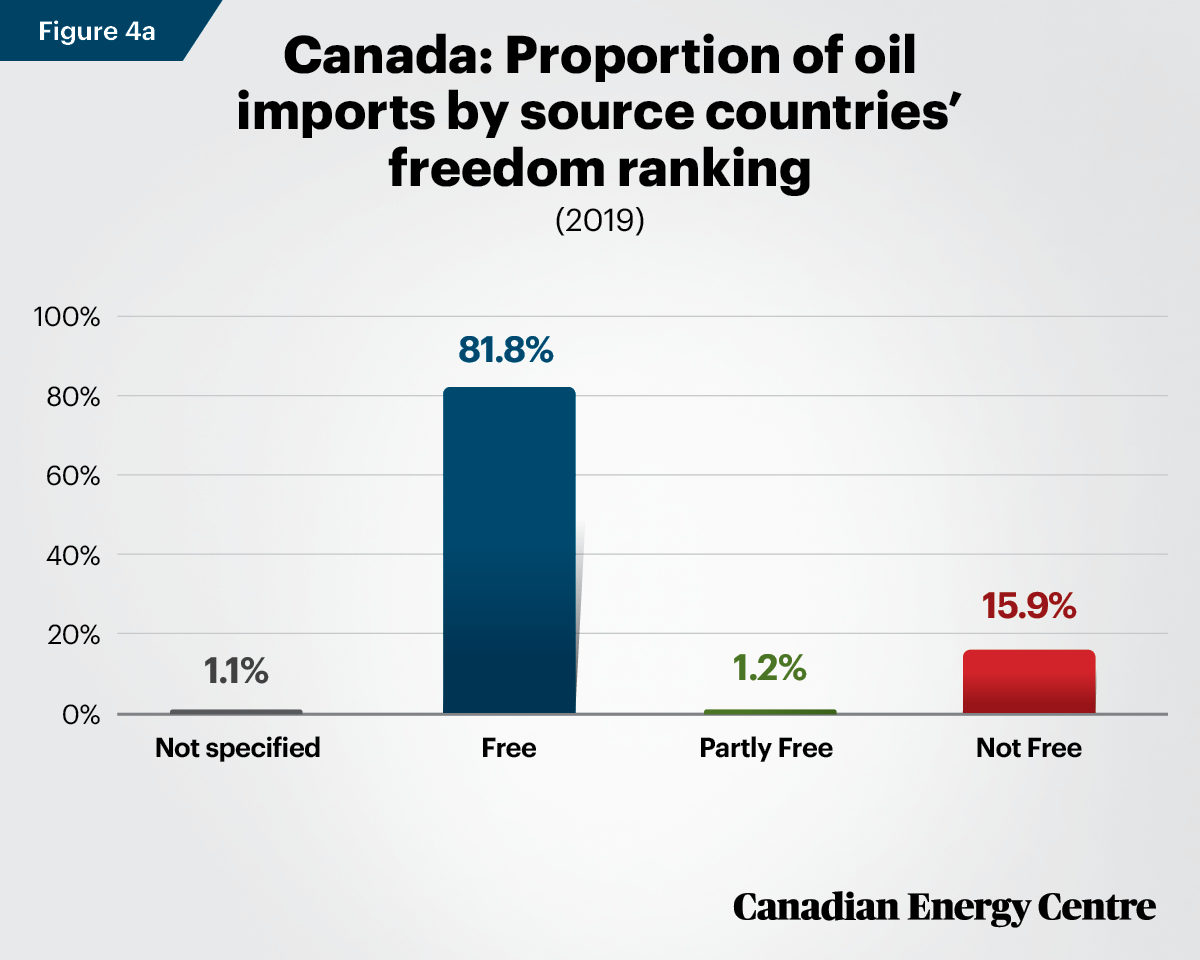
- Canada was the least dependent on tyranny oil as a proportion of all imports, with just under 16 per cent of its oil coming from countries that Freedom House categorized as Not Free.
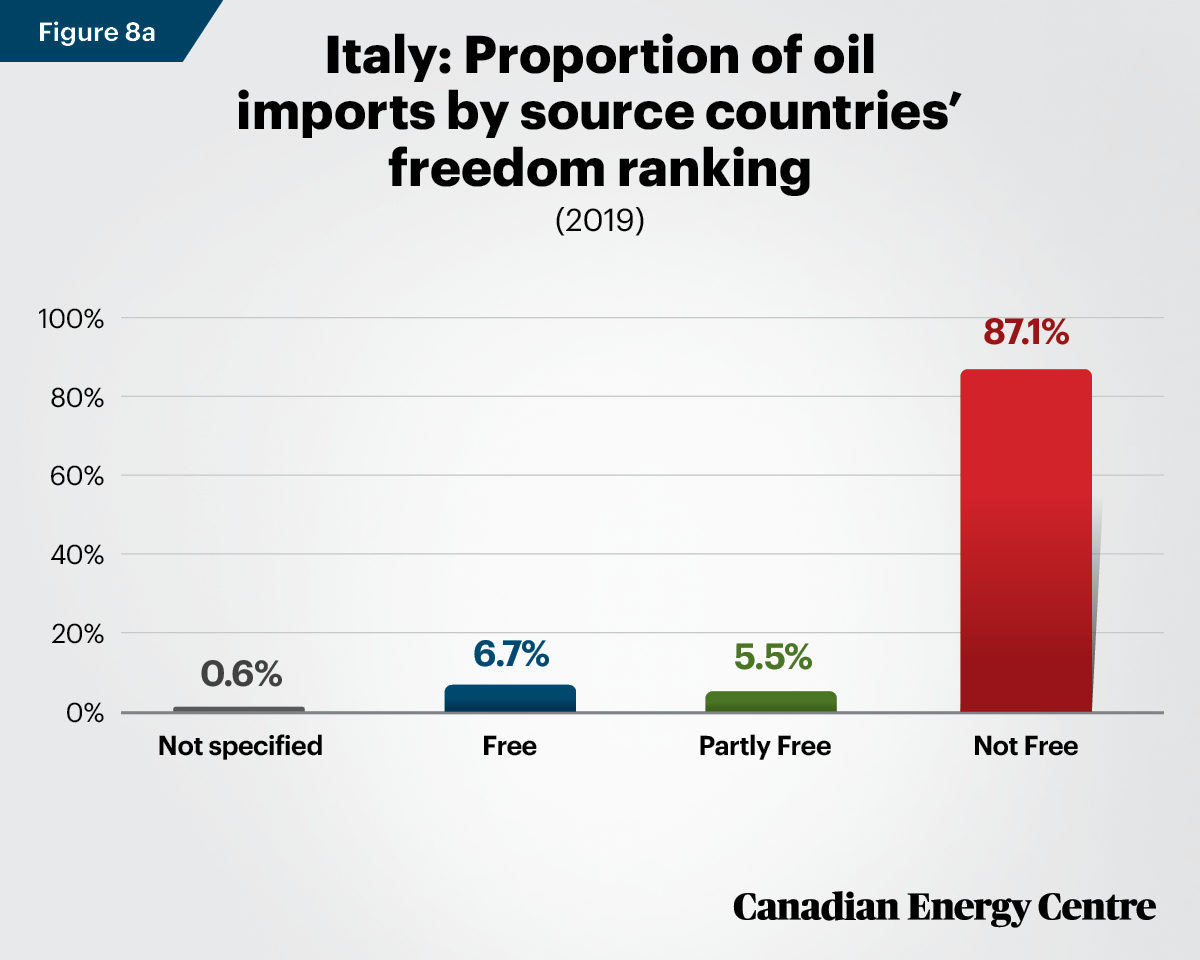
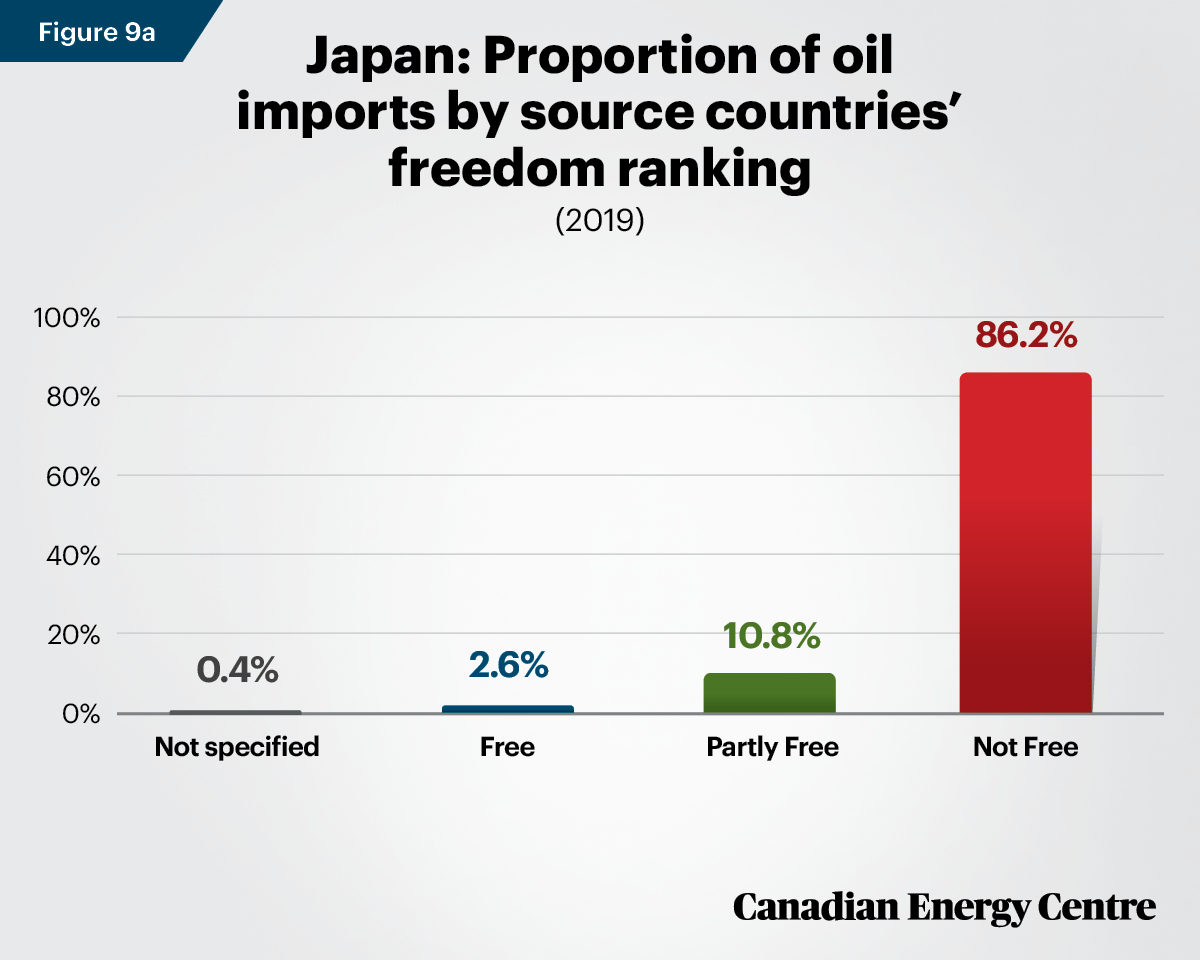
- Japan (over 86 per cent) and Italy (over 87 per cent) were the most dependent on tyranny oil and fully five of the nine countries measured here were dependent on tyrannies or autocracies for more than 50 per cent of their oil imports in 2019.
Sources: International Energy Agency (2019) and Freedom House (2020).
Natural gas imports and tyranny dependency
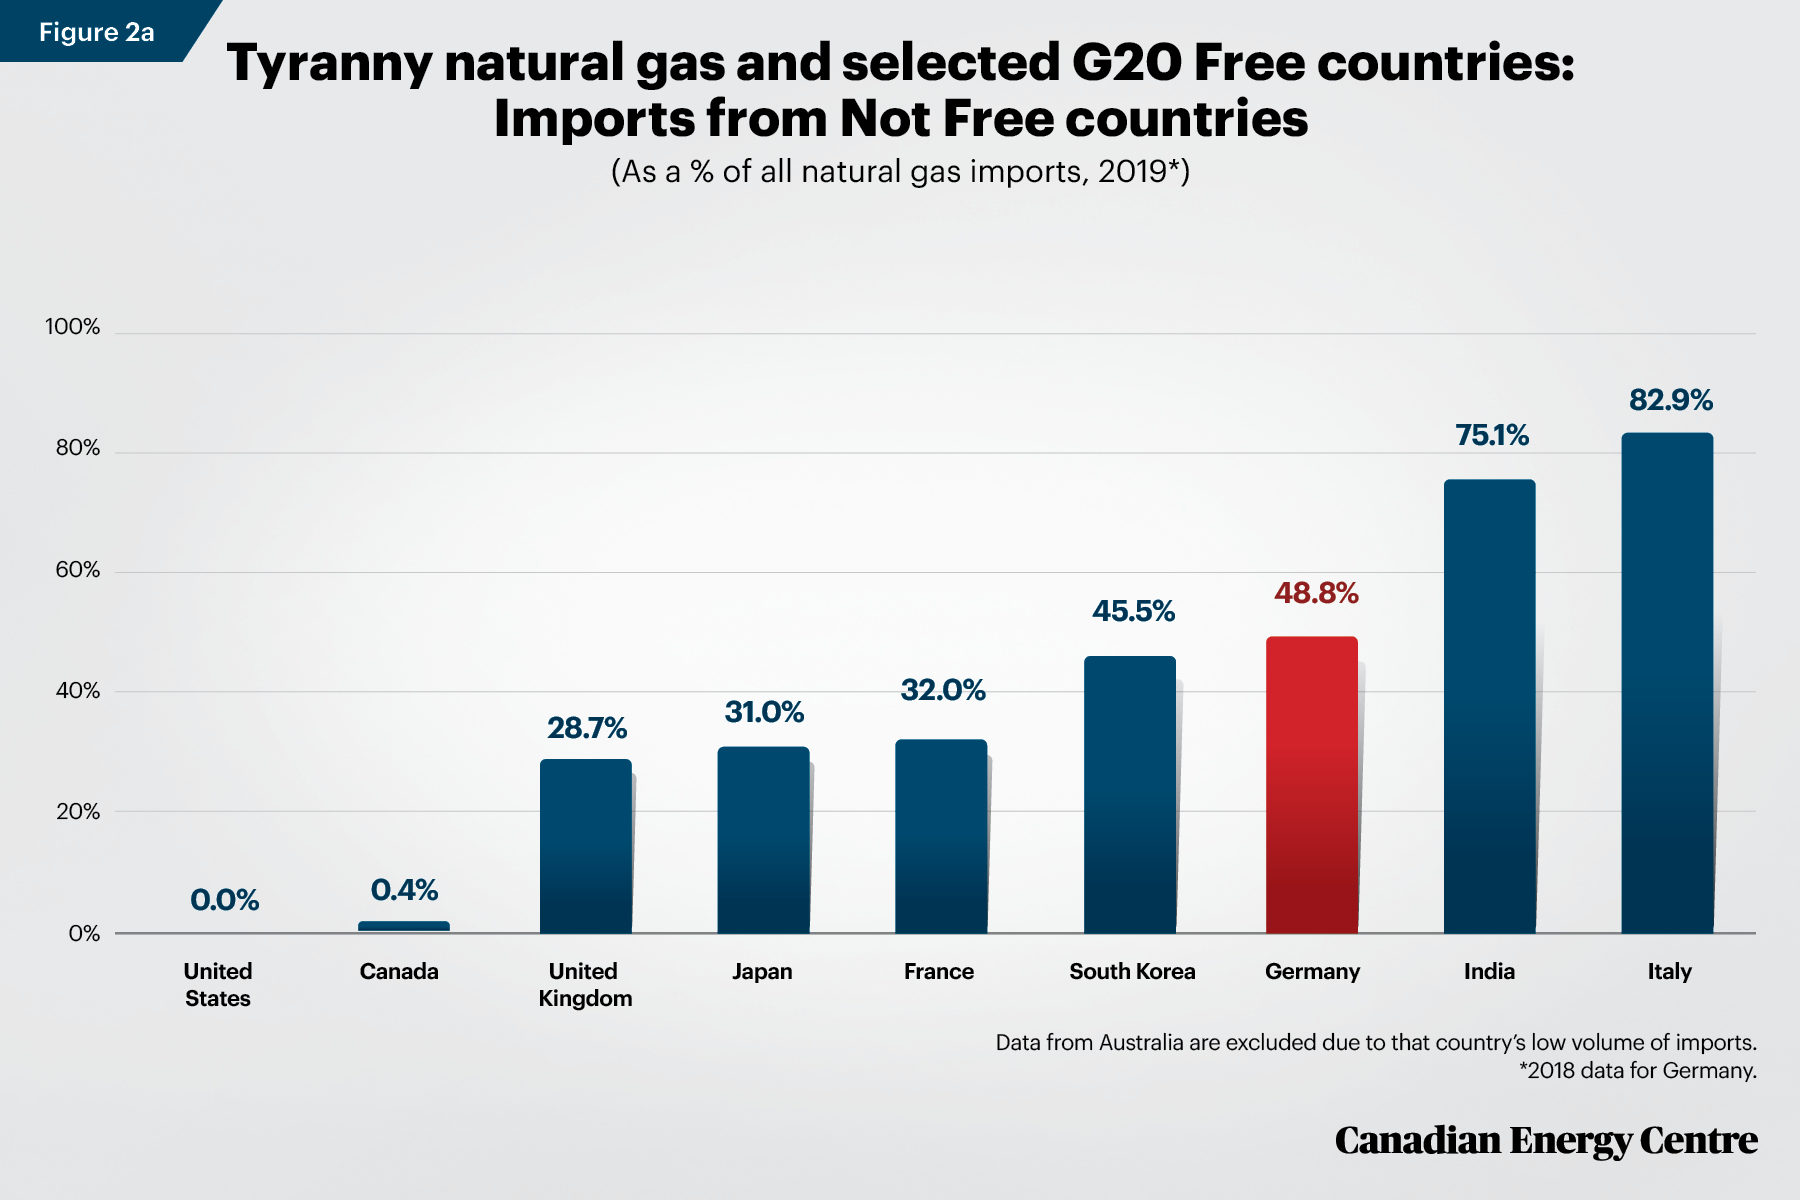
Among the 10 free G20 countries profiled (see Figure 2a), we excluded Australia given its low volume of natural gas imports. This section again uses the Freedom House categories (Free, Partly Free, Not Free) to show the dependency ratio by country on Not Free natural gas, i.e., natural gas produced in tyrannies or autocracies as a percentage of total natural gas imports in the remaining 9 countries. The data show that:
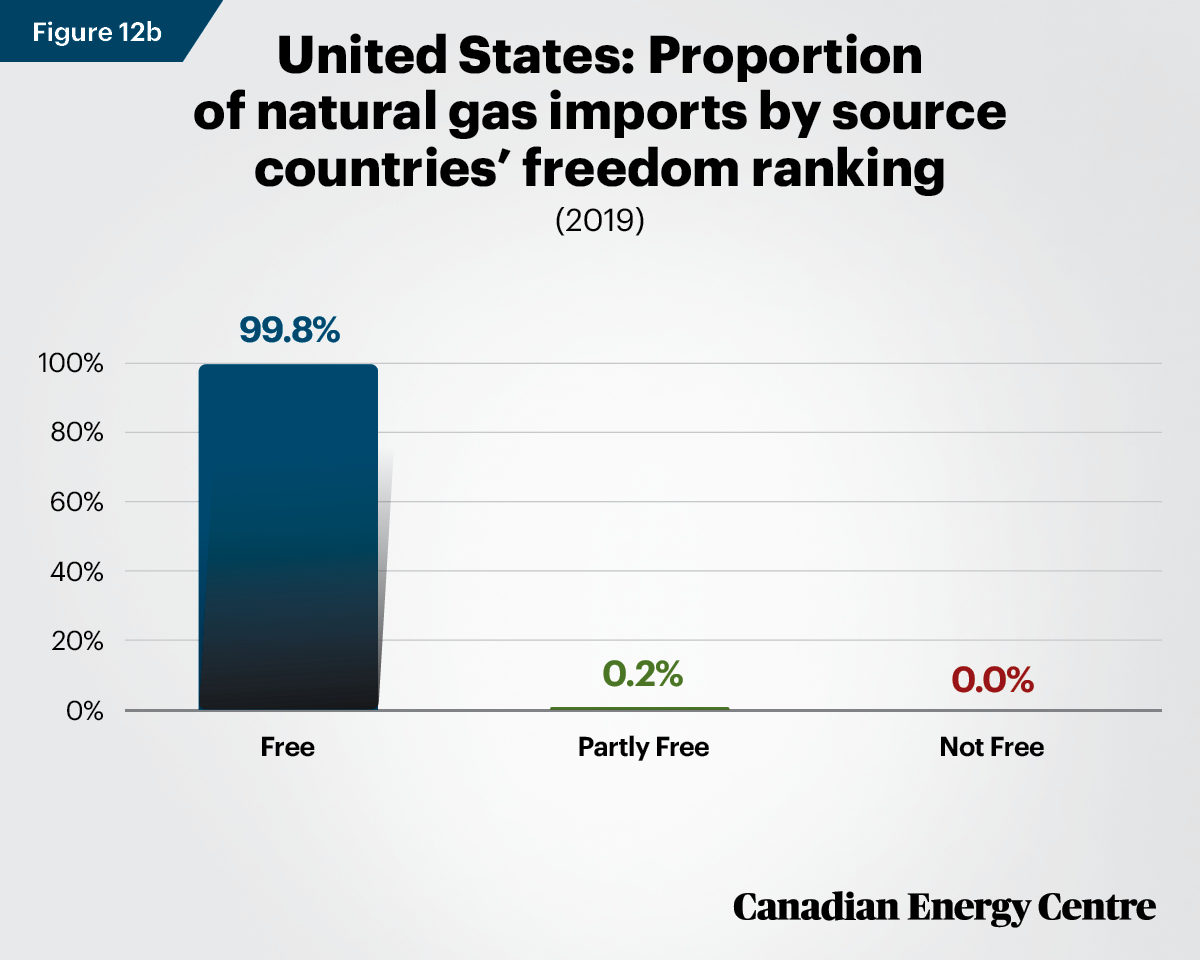
- None of the natural gas imported into the United States came from an autocracy or tyranny.
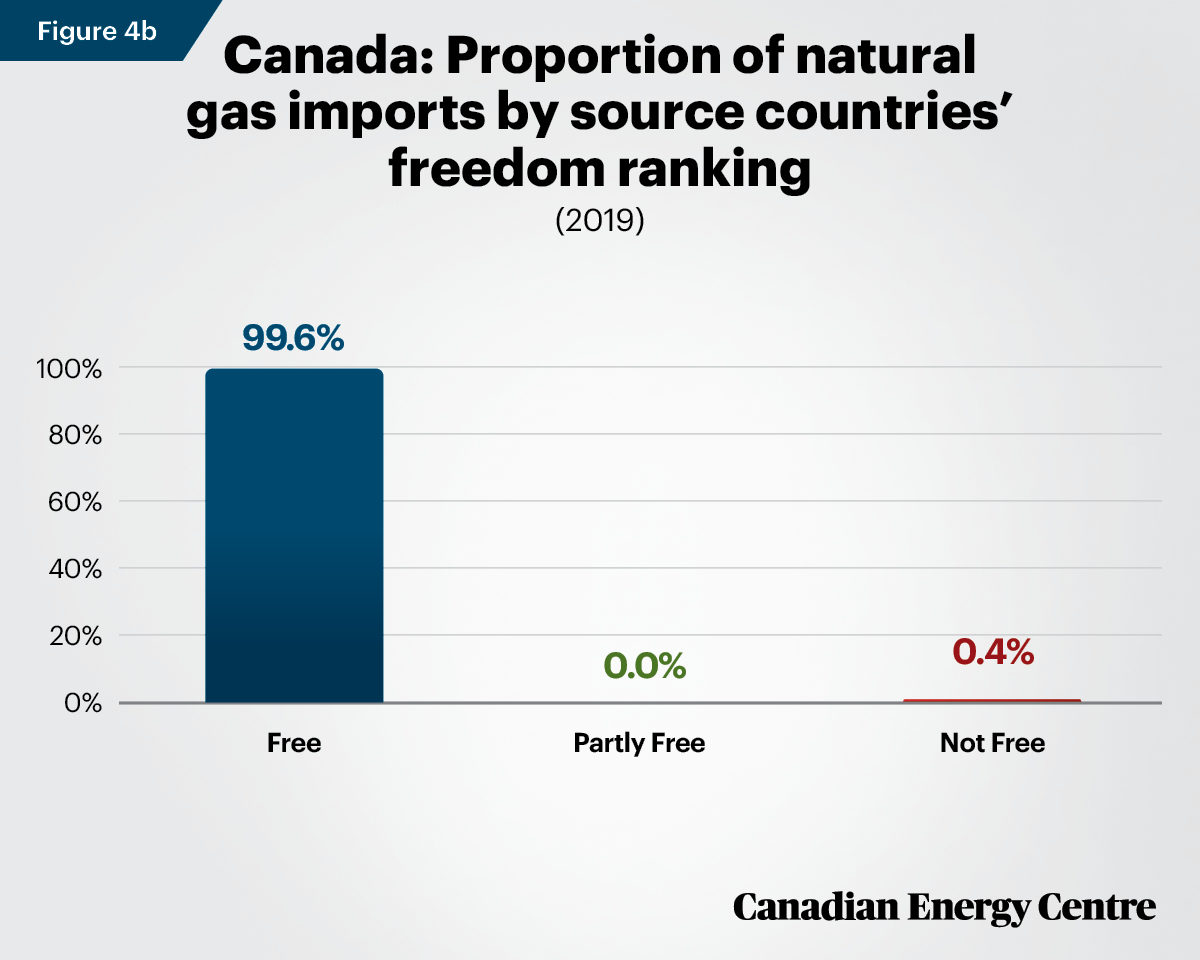
- Just 0.4 per cent of Canada’s natural gas imports came from a Not Free country (Angola supplied 91 million cubic metres of the 24,153 Mcm Canada imported in 2019).
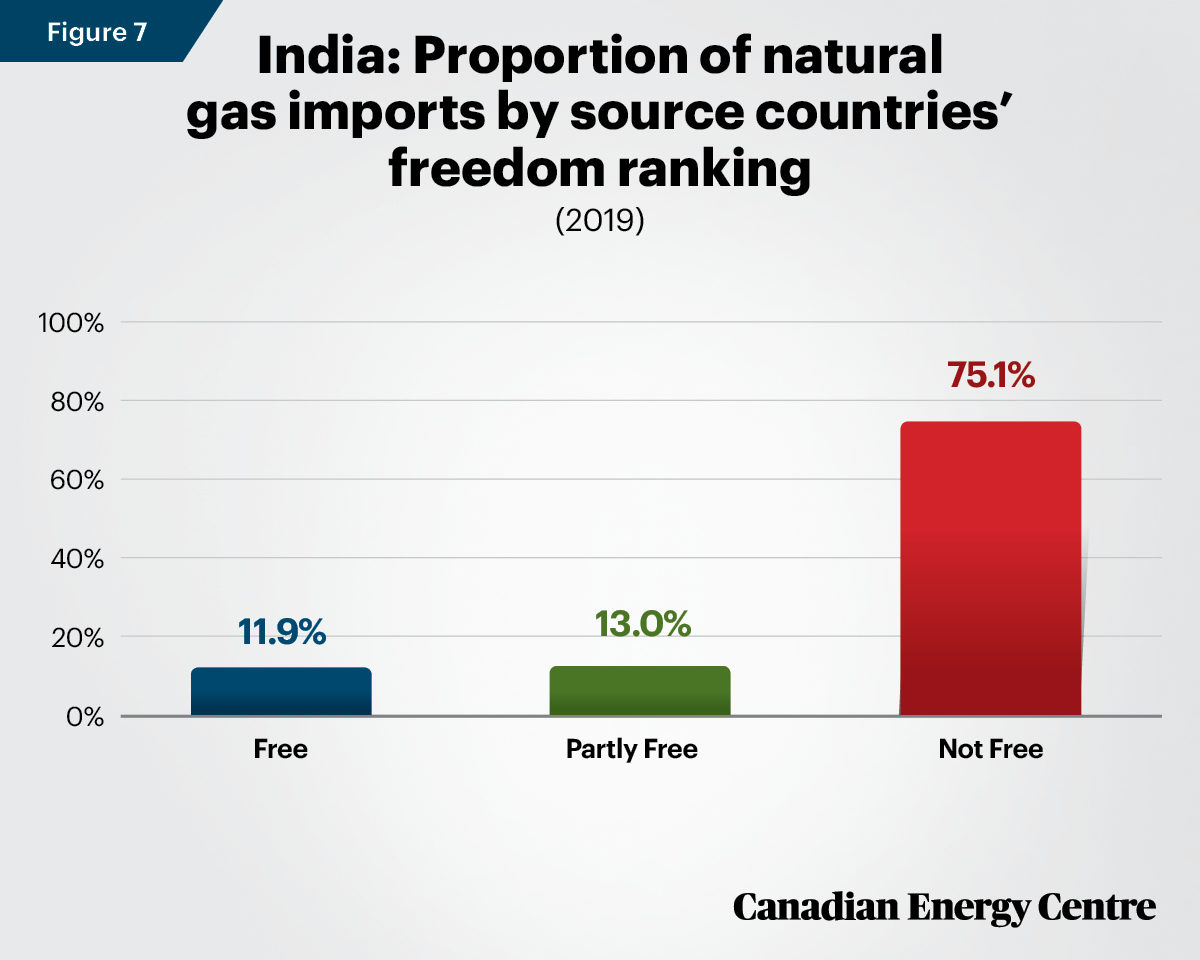
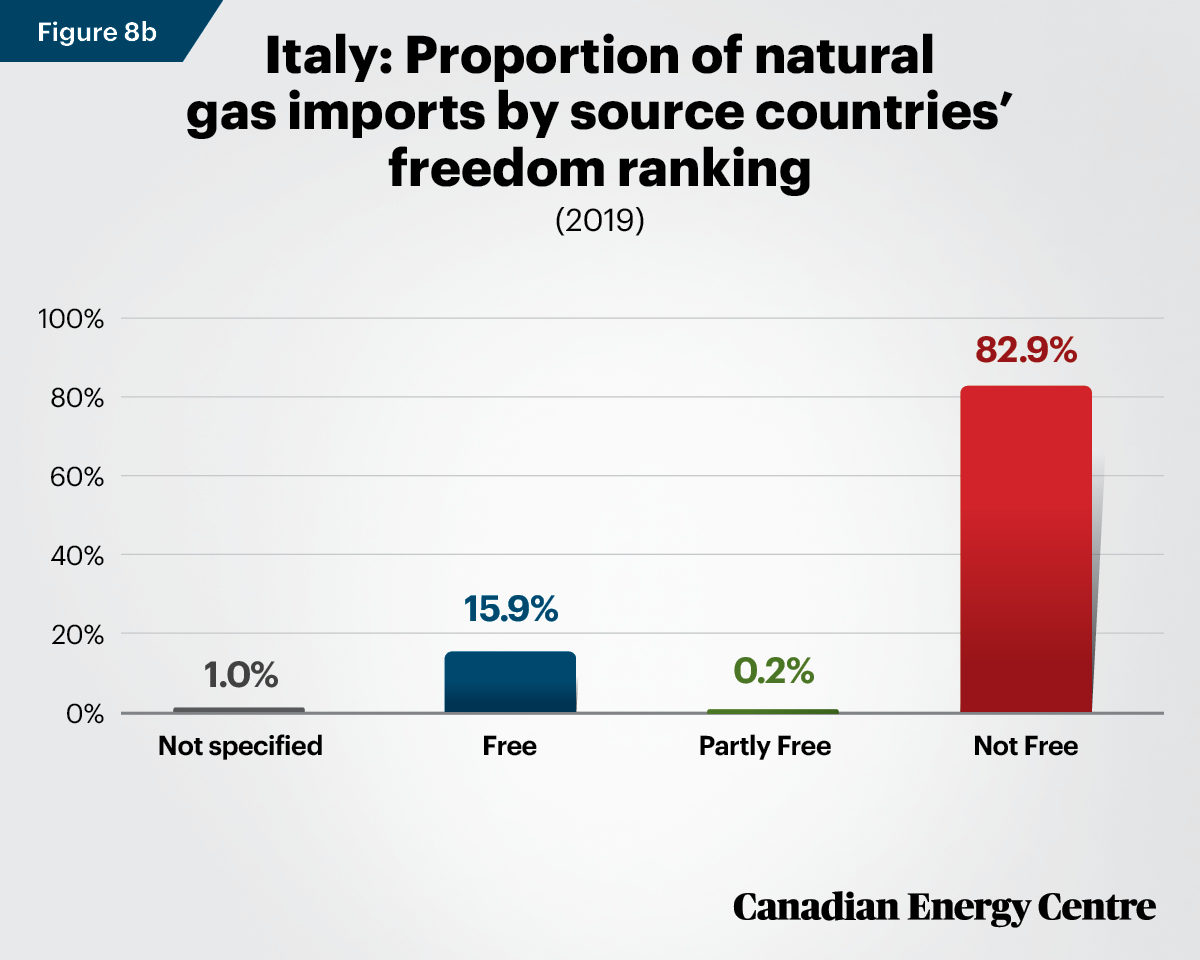
- India (at just above 75 per cent), and Italy (almost 83 per cent) were the most dependent on tyranny natural gas as a proportion of natural gas imports.
Sources: International Energy Agency (2019) and Freedom House (2020).
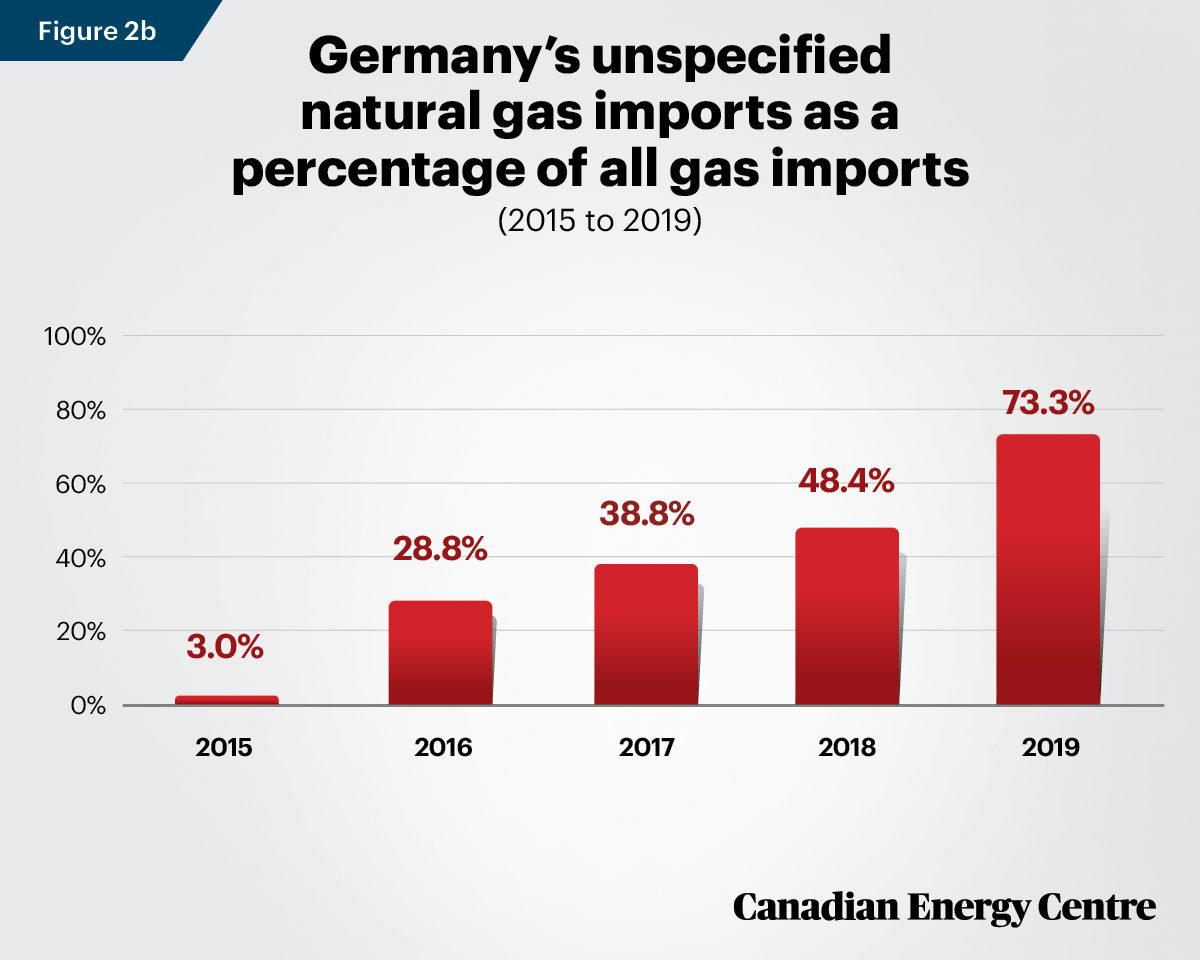
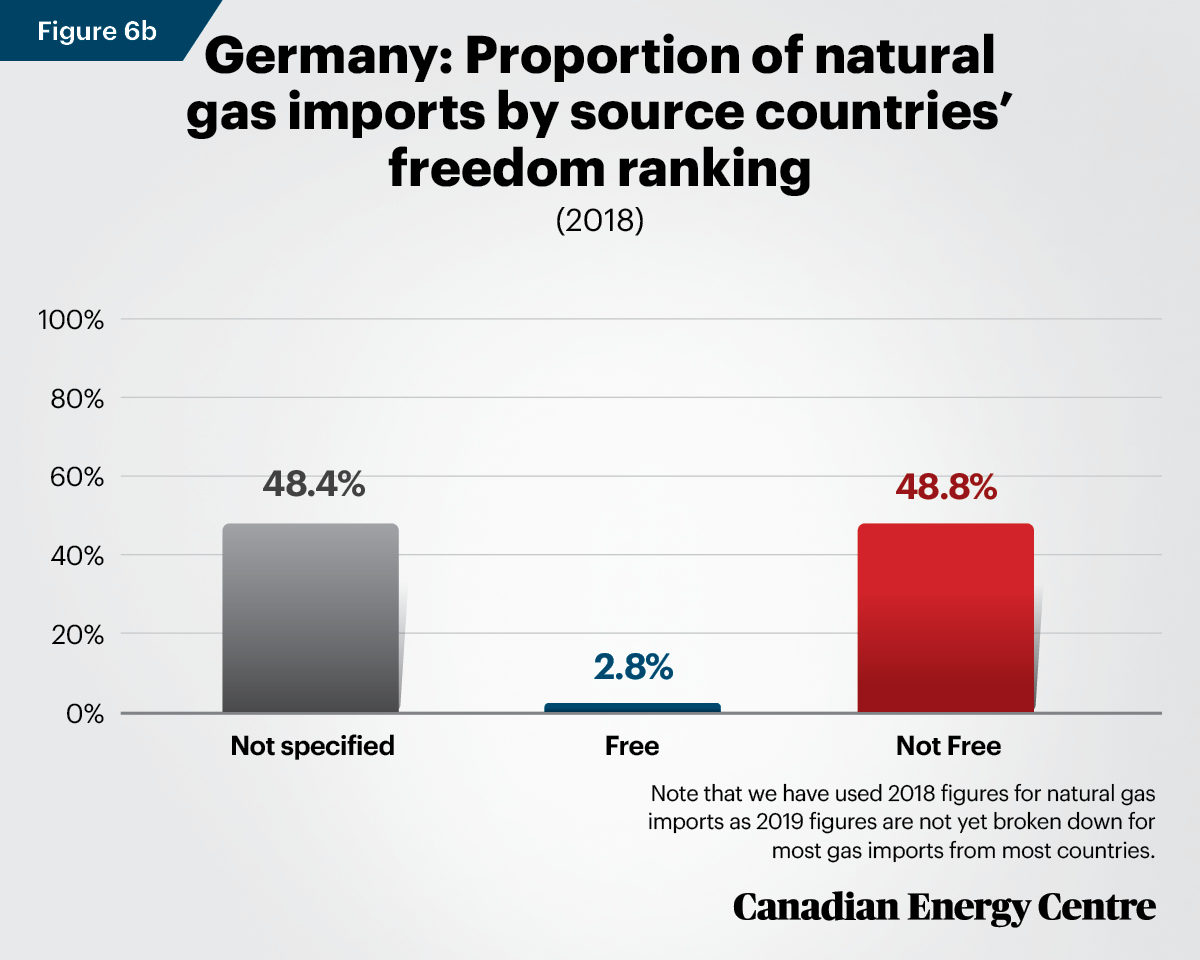
Germany’s missing natural gas imports: The data gap
Germany was dependent on tyranny natural gas for just under 49 per cent of its natural gas imports in 2018 (see Figure 2a). However, that proportion is likely dramatically understated because for four straight years the IEA has not identified the source countries for a significant proportion of Germany’s natural gas imports. Furthermore, that unspecified source country proportion has consistently risen (see Figure 2b).

Source: International Energy Agency (2019).
Conclusion
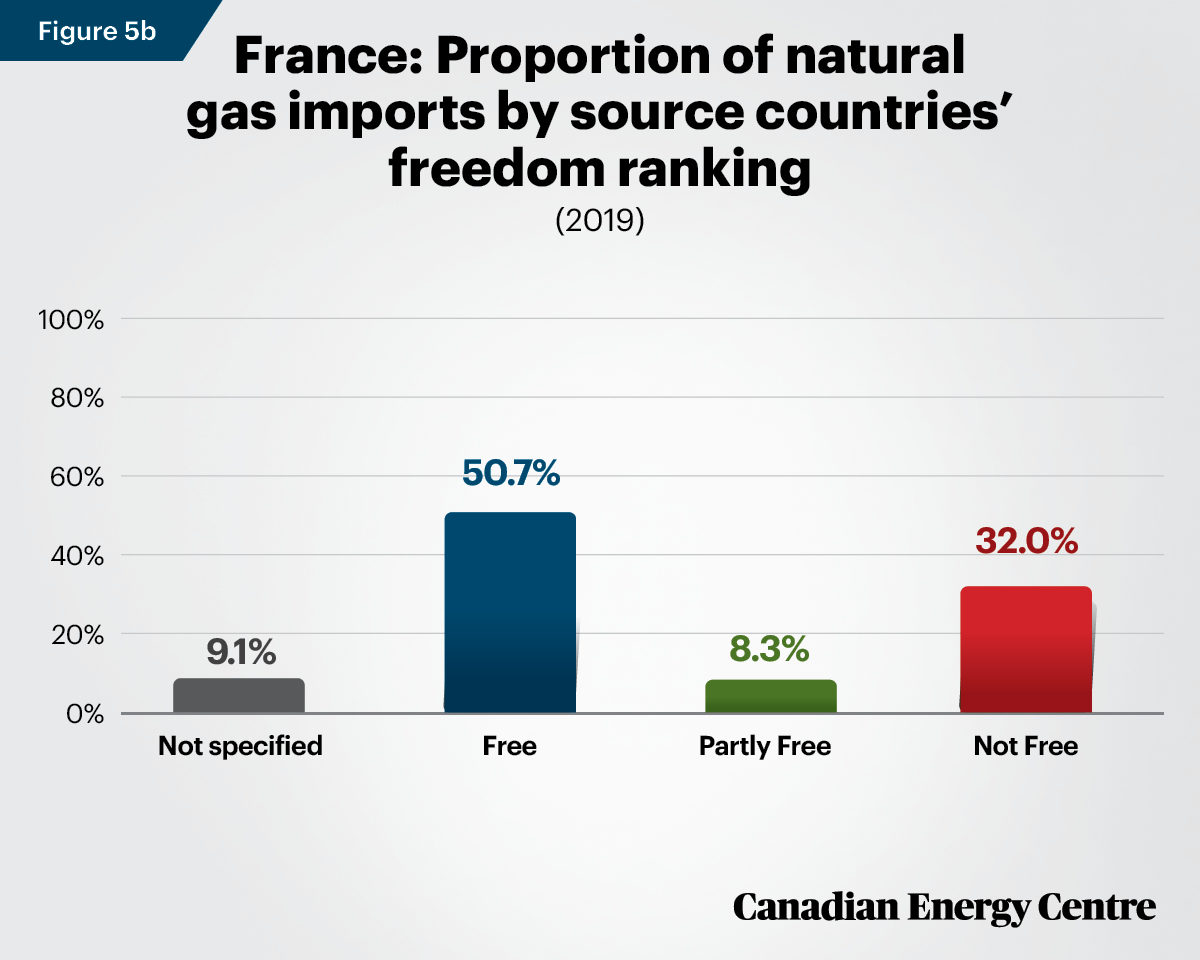
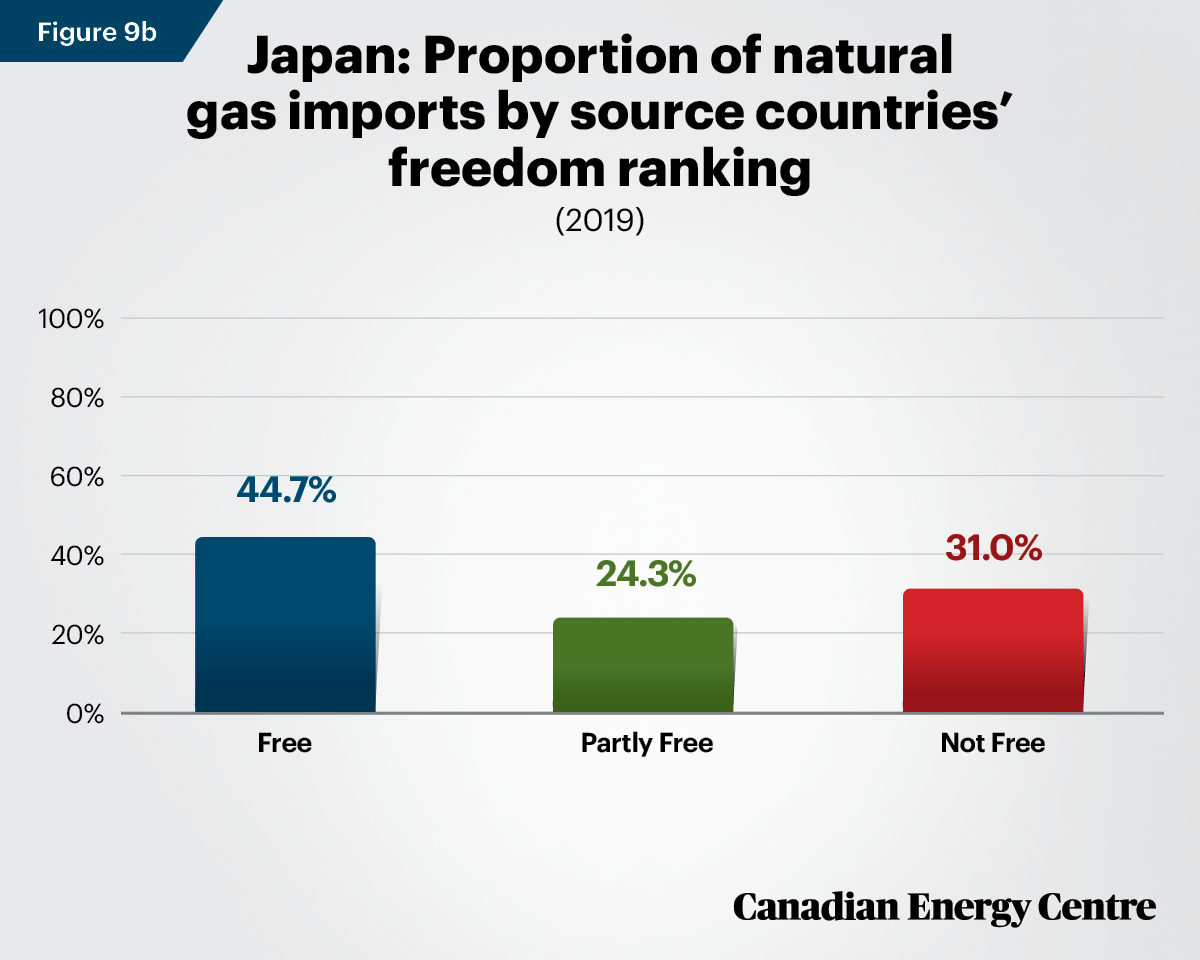
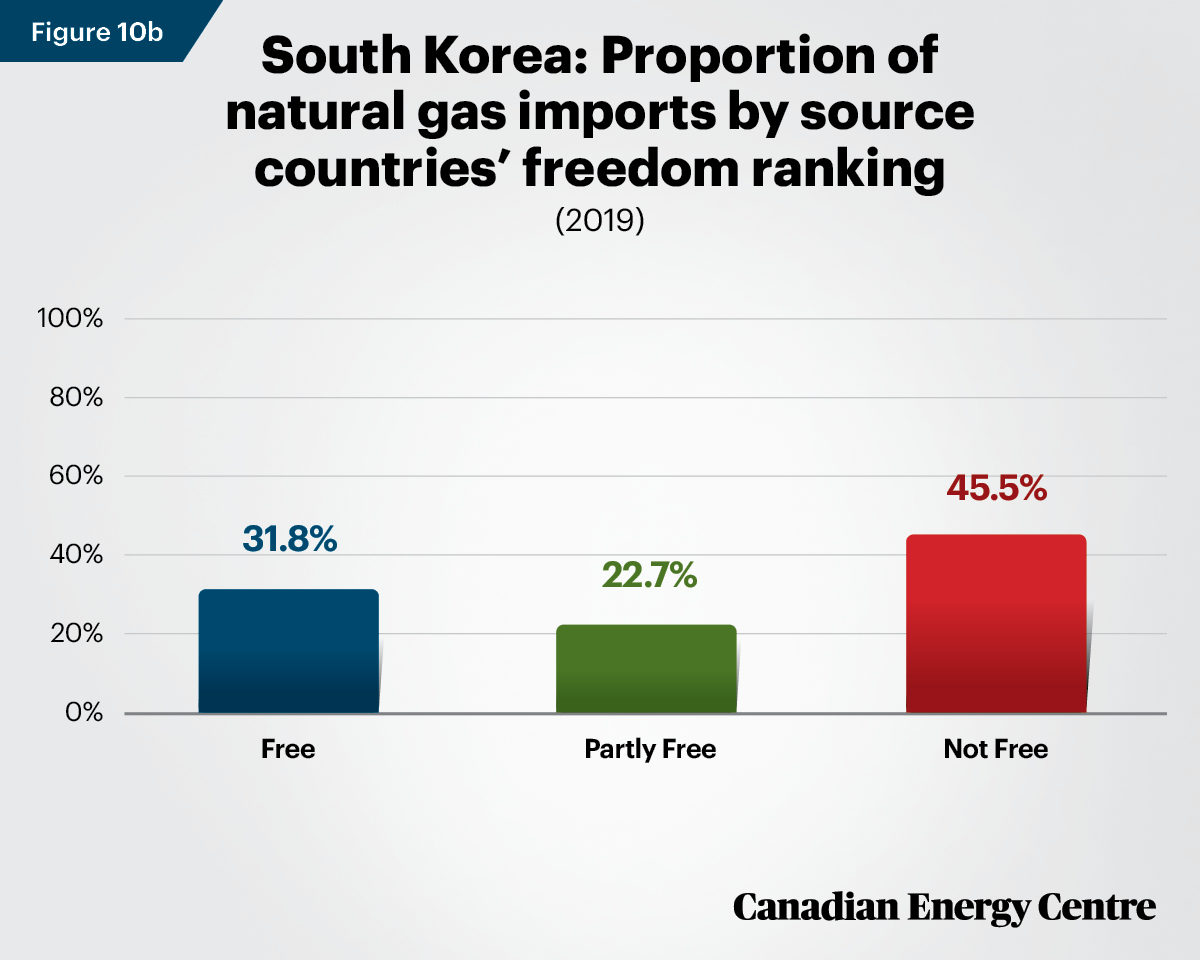
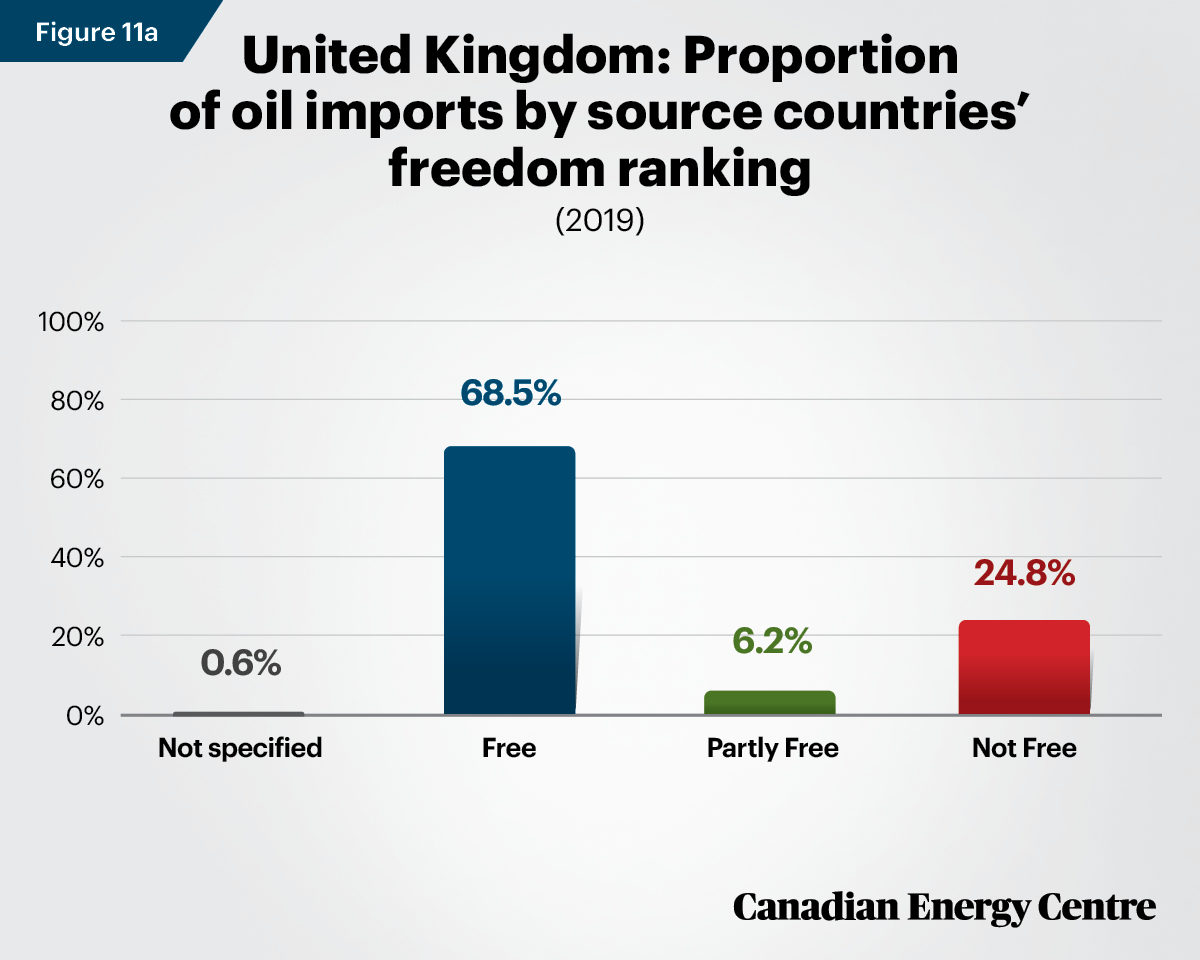
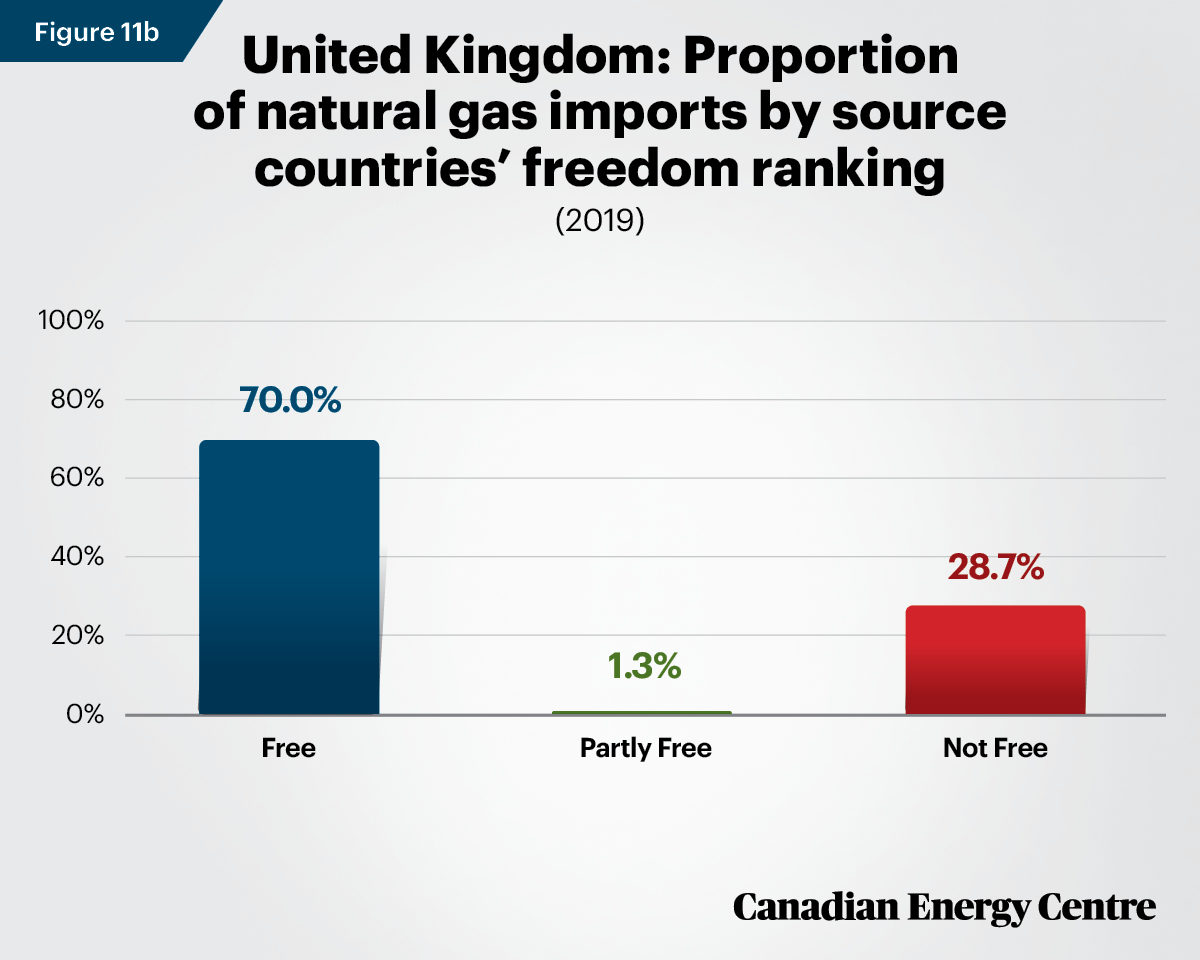
Among the free G20 countries with significant imports of oil and natural gas that are measurable by source countries, two-thirds import between 47 per cent (Australia) and 87 per cent (Italy) of their oil from Not Free Countries, while four countries rely heavily on natural gas from Not Free countries (between 45 per cent for South Korea and 83 per cent for Italy) while three others (the United Kingdom, Japan and France) are reliant on tyranny natural gas for roughly 30 per cent of their natural gas imports. Other findings include:
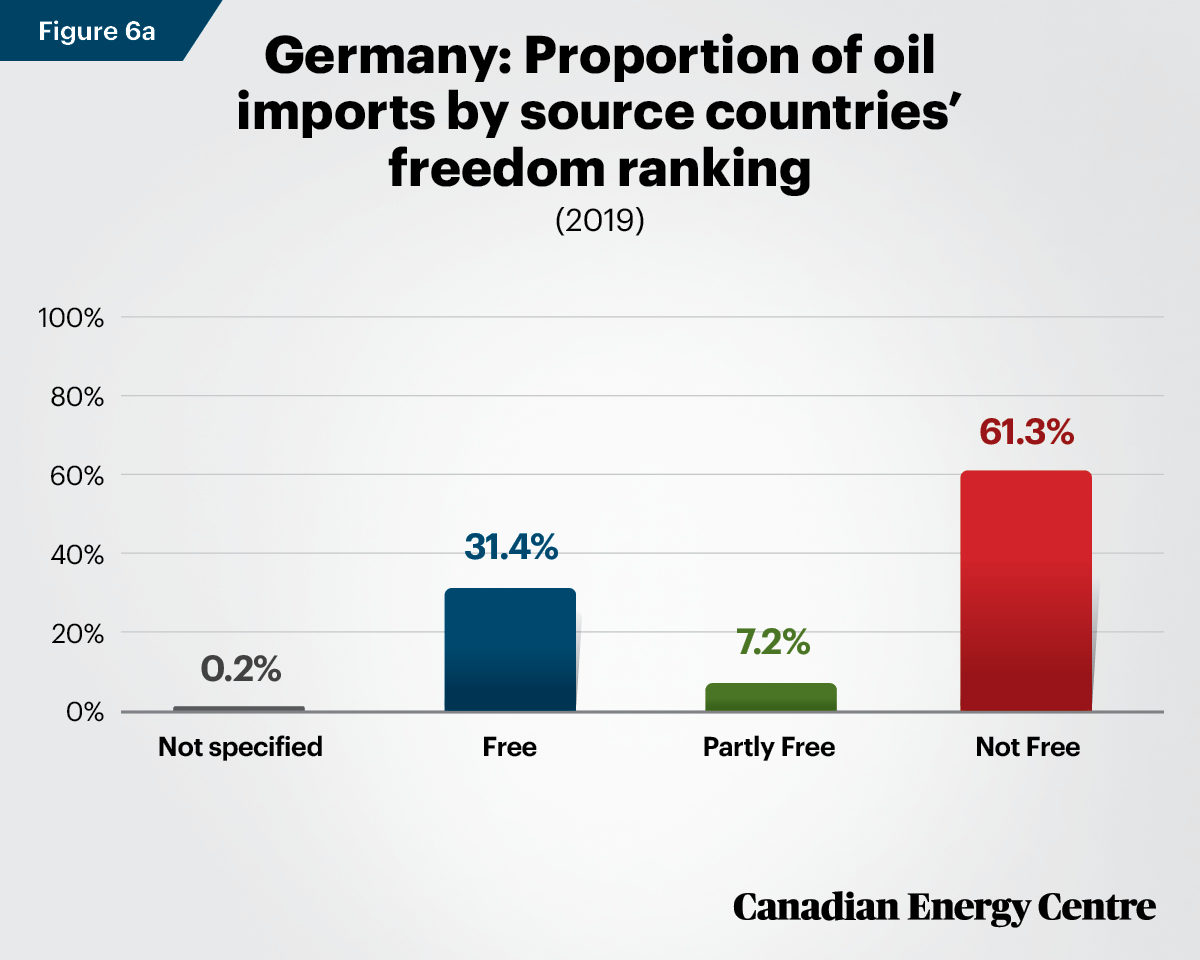
- Germany, South Korea, France, Italy, and Japan are all highly dependent on foreign oil from Not Free countries (autocracies or tyrannies). Oil imports from tyrannies or autocracies to those five countries range from 61 per cent (Germany) to over 87 per cent in the case of Italy.
- South Korea, Germany, India, and Italy are the most dependent on tyranny natural gas with their imports in that category ranging from 45 per cent to nearly 83 per cent.
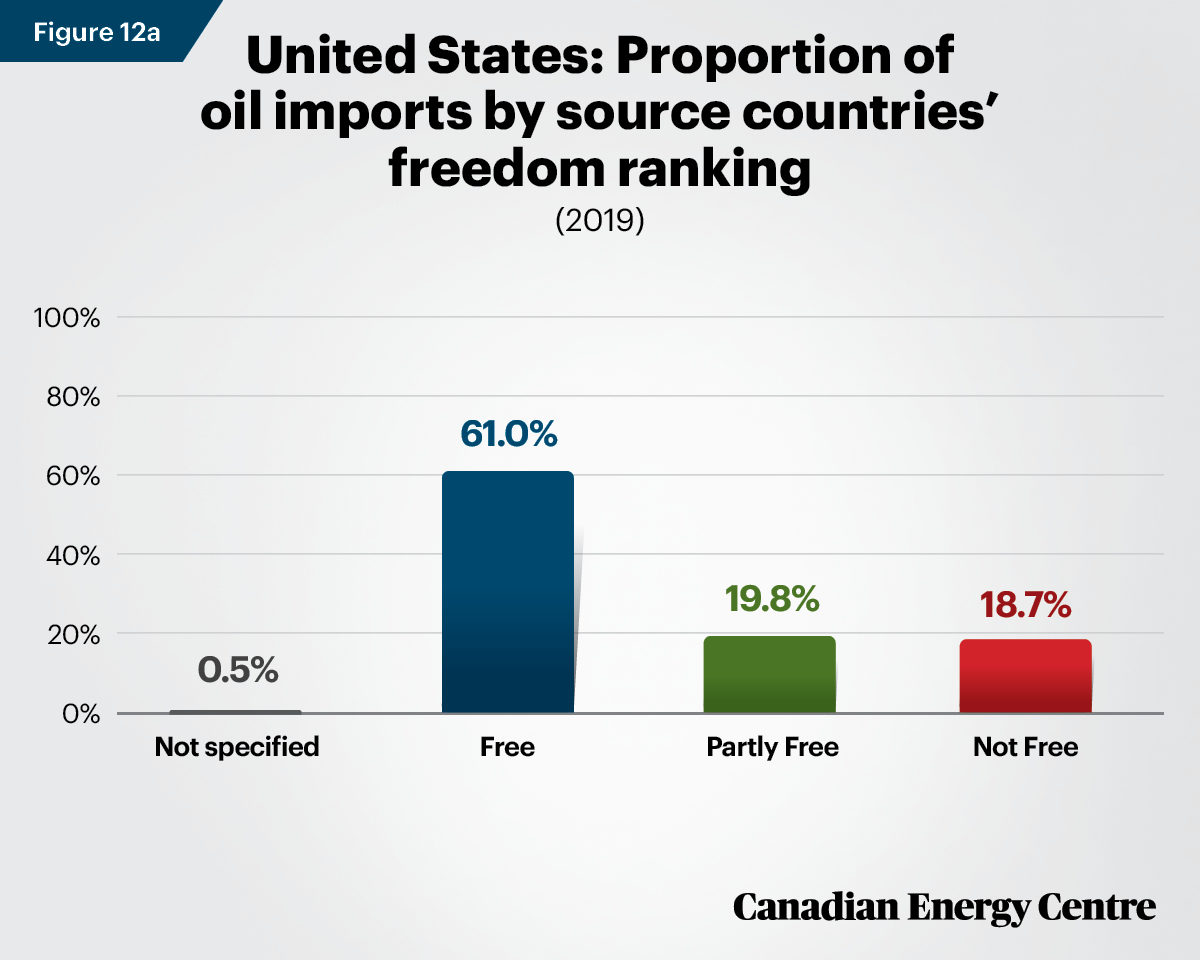
- Second only to Canada on oil, the United States is the least dependent on tyranny oil and (not at all on) natural gas; under just 19 per cent of its oil and none of its natural gas is sourced from Not Free countries.
- Of Canada’s oil imports, 16 per cent is tyranny oil and just 0.4 per cent tyranny natural gas. In 2019, tyranny oil imports for Canada originated in Azerbaijan, Libya, Russia, and Saudi Arabia.
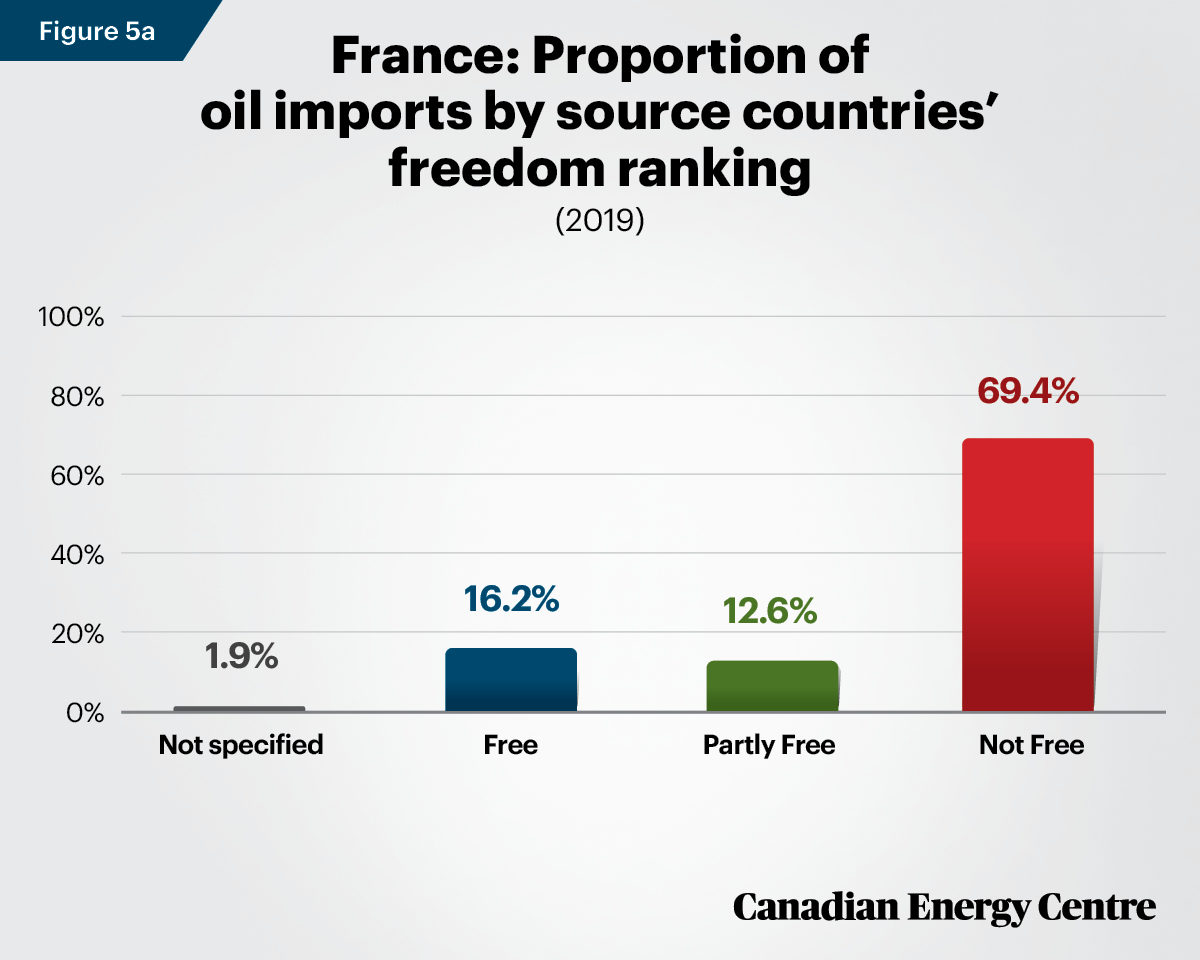
- Three European countries are heavily dependent on imported oil. Tyranny oil from Not Free countries accounts for 61 per cent of Germany’s imports, 69 per cent of France’s imports, and 87 per cent of Italy’s imports. The tyrannies that are the source for the oil for those European countries include Kazakhstan, Russia, Libya, Iraq, and Saudi Arabia, among others.
- Two European countries are heavily dependent on imported natural gas from Not Free countries. Tyranny natural gas accounts for 49 per cent of Germany’s imports, and 83 per cent of Italy’s imports. They tyrannies that are the source for the natural gas for those European countries include Russia in particular, but also Qatar and Algeria, among others.
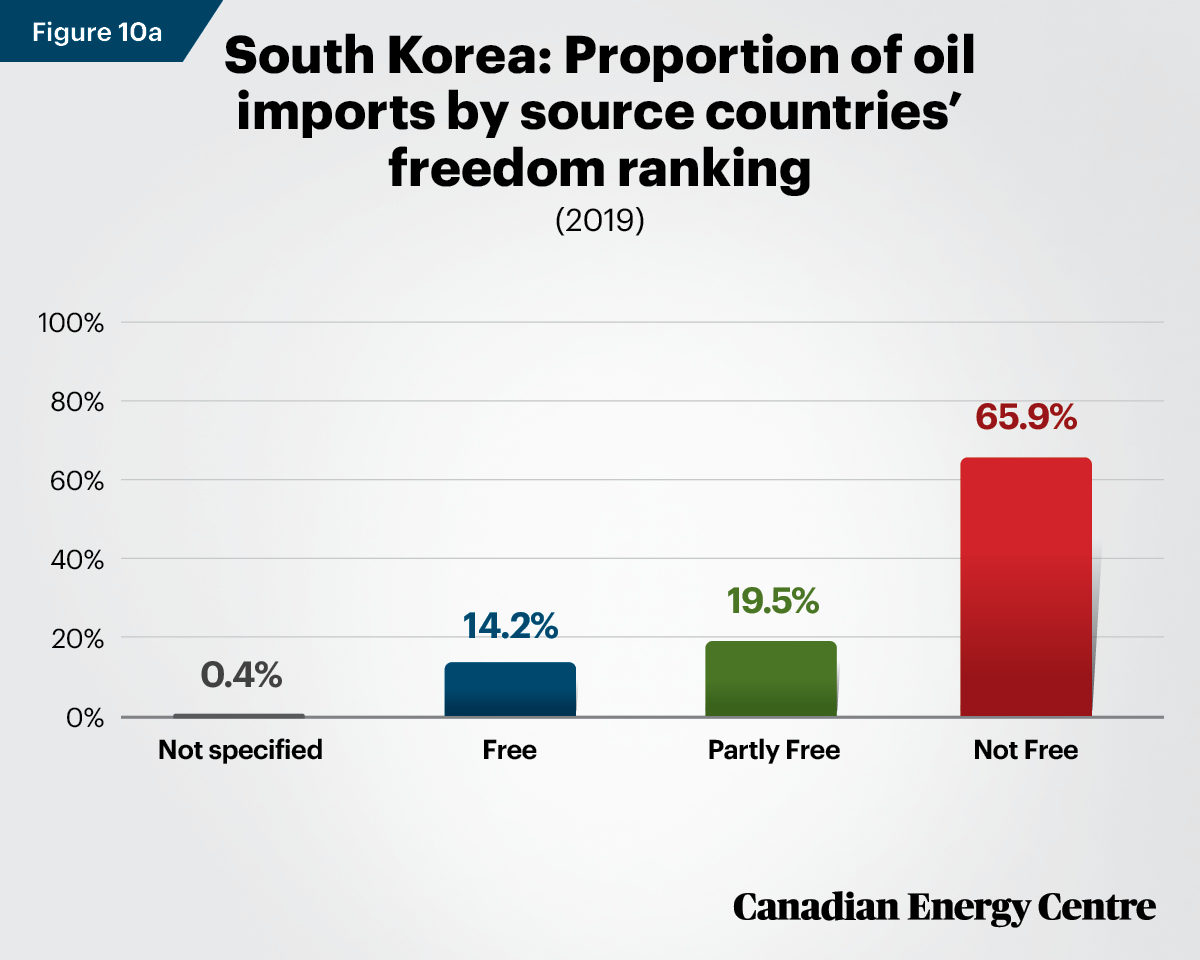
- South Korea and Japan are heavily dependent on imported tyranny oil. Tyranny oil from Not Free countries accounts for 66 per cent of South Korea’s imports and 86 per cent of Japan’s imports. The tyrannies that were the source for the oil in 2019 included Russia, Saudi Arabia, Iran, Iraq, the United Arab Emirates, and Kazakhstan, among others.
- South Korea and India are heavily dependent on imported tyranny natural gas. Tyranny natural gas from Not Free countries accounts for over 45 per cent of South Korea’s imports and 75 per cent of India’s imports. The tyrannies that are the source for the natural gas include Qatar, the UAE, Angola, and Russia, among others.
Country profiles: Oil and natural gas imports according to freedom rankings
This section profiles the 10 free G20 countries (categorized as Free by Freedom House) that also imported significant enough volumes of oil, natural gas, or both, to warrant examination.
Australia
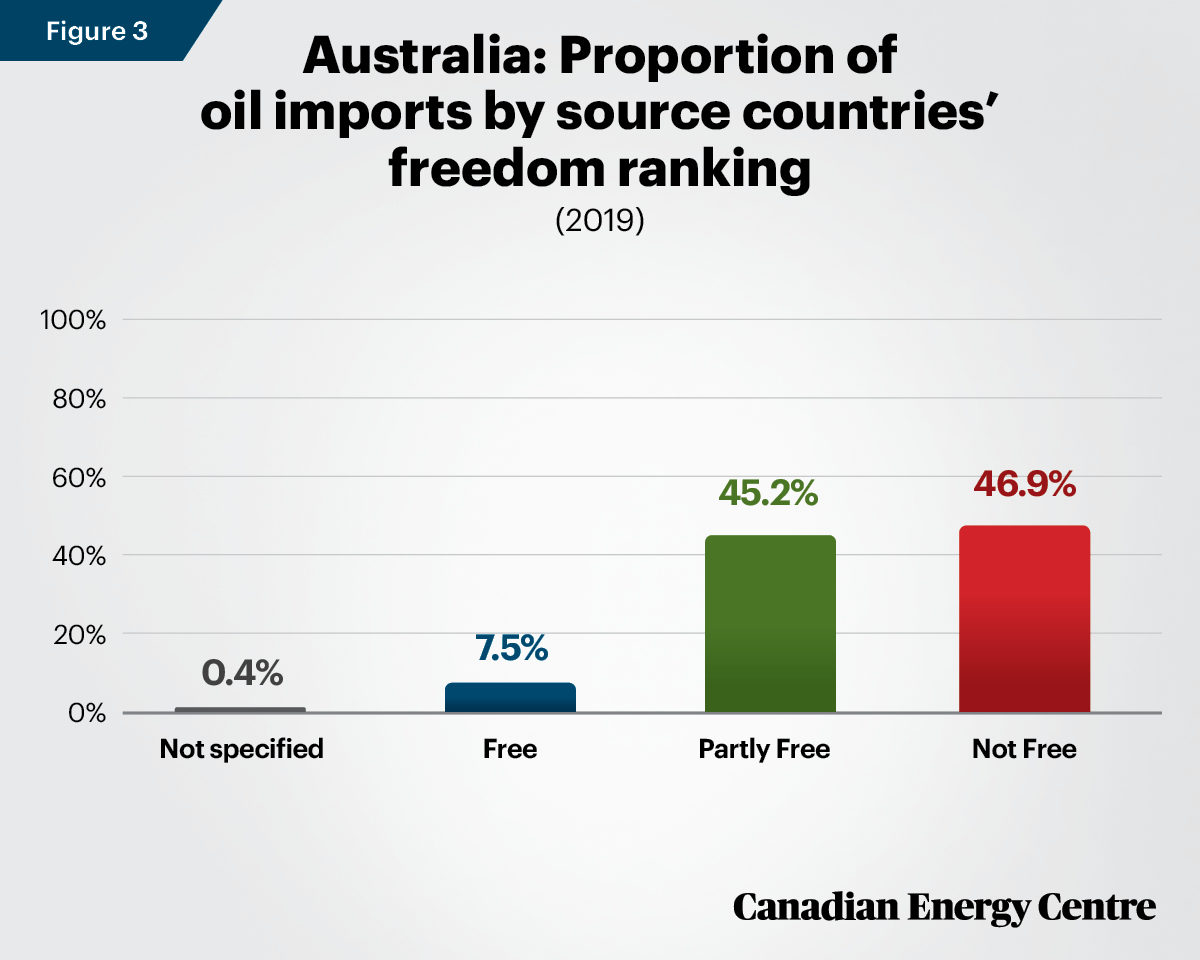
Sources: International Energy Agency (2019) and Freedom House (2020).
Canada
Sources: International Energy Agency (2019) and Freedom House (2020).
Sources: International Energy Agency (2019) and Freedom House (2020).
France
Sources: International Energy Agency (2019) and Freedom House (2020).
Sources: International Energy Agency (2019) and Freedom House (2020).
Germany
Sources: International Energy Agency (2019) and Freedom House (2020)
Sources: International Energy Agency (2019) and Freedom House (2020).
India
Sources: International Energy Agency (2019) and Freedom House (2020).
Italy
Sources: International Energy Agency (2019) and Freedom House (2020).
Sources: International Energy Agency (2019) and Freedom House (2020).
Japan
Sources: International Energy Agency (2019) and Freedom House (2020).
Sources: International Energy Agency (2019) and Freedom House (2020).
South Korea
Sources: International Energy Agency (2019) and Freedom House (2020).
Sources: International Energy Agency (2019) and Freedom House (2020).
United Kingdom
Sources: International Energy Agency (2019) and Freedom House (2020).
Sources: International Energy Agency (2019) and Freedom House (2020).
United States
Sources: International Energy Agency (2019) and Freedom House (2020).
Sources: International Energy Agency (2019) and Freedom House (2020).
End Notes
1. Freedom House categorizes nations and territories by their degree of freedom using three possible overall rankings: Free, Partly Free, and Not Free, and has done so since 1973.
2. The 2020 rankings are based on 2019 data.
3. On Russia, note the summary conclusion of the GAN Business Anti-Corruption Portal on Russia: “Corruption significantly impedes businesses operating or planning to invest in Russia. High-level and petty corruption are common, especially in the judicial system and public procurement. The business environment suffers from inconsistent application of laws and a lack of transparency and accountability in the public administration. Russia’s regulatory inefficiency substantially increases the cost of doing business and has a negative effect on market competition” (GAN 2020).
4. Transparency International on Saudi Arabia: “Notably, almost total opacity in public accounting prevents ordinary Saudis from understanding how much of the state income generated by massive oil revenues ends up as private wealth for the royal family and its clients.”
5. Transparency International on Venezuela: “Instead of fulfilling the social and economic rights of millions of citizens for which huge sums of public funds were allocated in a decade of high oil prices, the efforts went to lining pockets.”
6. When an autocracy or dictatorship has significant leverage over a product, other countries dependent on that product can be severely and adversely affected. For a fuller discussion, see the Atlantic Council’s December 2019 essay by Daniel Fried: Russia Gas Pipeline Sanctions Legislation (PEES Act): A Way Ahead.
7. We arrive at the measurements by calculating the total energy supply (TES), which is made up of production + imports – exports – international marine bunkers – international aviation bunkers ± stock changes. As defined by the International Energy Agency (2020) international marine bunkers covers those quantities delivered to ships of all flags that are engaged in international navigation while International aviation bunkers includes deliveries of aviation fuels to aircraft for international aviation.
8. If all countries were urged to be self-sufficient on energy needs, the implicit assumption would be that exports of oil and natural gas should cease. That position is unsupportable for market reasons—it may be more economical, for instance, for a Saint John refinery to import some foreign oil rather than be supplied from a domestic source—and also for practical reasons—not all countries have oil and natural gas resources any more than all countries have 12-month growing seasons and can rely solely on domestic food production
9. Note that other IEA data show that India imports oil at a rate of almost 994 kilobarrels daily. That data set does not break down which countries are exporting to India.
References (links live as of November 12, 2020)
Bloomberg (2020). “Poisoning of Alexei Navalny has turned Merkel against Putin,” Japan Times, September 18. <https://bit.ly/32pD849>.
Der Spiegel (2020). “I Assert that Putin was Behind the Crime.” October 1. <https://bit.ly/3eDvFmF>.
Freedom House (undated). About Us. <https://bit.ly/2YC53g5>;
Freedom House (2020). “Country and Territory Ratings and Statuses, 1973-2020.” Freedom in the World Comparative and Historical Data. <https://bit.ly/3epM12w>.
Fried, Daniel (2019). Russia Gas Pipeline Sanctions Legislation (PEES Act): A Way Ahead. Atlantic Council. December. <https://bit.ly/3eVONN5>.
Guardian (2017). “France Bans Fracking and Oil Extraction in All of Its Territories.” December 20. <https://bit.ly/32oBj7t>.
International Energy Agency [IEA] (2019). World Energy Statistics 2019 (database). <https://bit.ly/3p0MnBr>.
International Energy Agency [IEA] (2020). IEA World Energy Statistics, 2020 Edition. (Subscription database).
International Trade Centre (undated). Trade Map. <https://bit.ly/38gM0gg>.
G20. What is the G20? <https://bit.ly/3eoFEfB>.
G20. G20 Participants. <https://bit.ly/3mMkkUk>.
GAN Integrity, Business Anti-Corruption Portal (2020). Russia Corruption Report. <https://bit.ly/38zaIIN>.
Kramer, Andrew (2020). “Pipeline Politics: Why Nord Stream 2 Is Back in the Spotlight.” New York Times, September 14 <https://nyti.ms/3lbeawB>.
Milke, Mark, and Lennie Kaplan (2020). The Tyranny Index for Oil and Gas. <https://bit.ly/3p8usIT>.
NPR (2020). “Alexei Navalny was Poisoned with Novichok Nerve Agent, Merkel Says.” September 3. <https://n.pr/2IfQmt9>.
Sukhankin, Sergey (2020). Russian Geopolitical Objectives in the Current Oil Price Crisis and Implication for Canada. University of Calgary School of Public Policy. <https://bit.ly/2JPGmrj>.
Szymanski, Konrad (2020). “Navalny Poisoning Shows Why Putin’s Pipeline Must Be Stopped.” Politico, September 16. <https://politi.co/38kCUio>.
Transparency International (2015). Corruption and Human Rights Violations in Venezuela. <https://bit.ly/38DKeFS>.
Transparency International (2020). Saudi Arabia: An Overview of Corruption and Anti-Corruption. <https://bit.ly/36zwtpn>.
CEC Research Briefs
Canadian Energy Centre (CEC) Research Briefs are contextual explanations of data as they relate to Canadian energy. They are statistical analyses released periodically to provide context on energy issues for investors, policymakers and the public. The source of profiled data depends on the specific issue.
About the authors
This CEC Research Brief was compiled by Mark Milke, Executive Director of Research for the Canadian Energy Centre and Ven Venkatachalam, Senior Research Analyst. Acknowledgements The authors and the Canadian Energy Centre would like to thank and acknowledge the assistance of Dennis Sundgaard for his review of this paper.
Share This:


