


 CDN NEWS |
  US NEWS







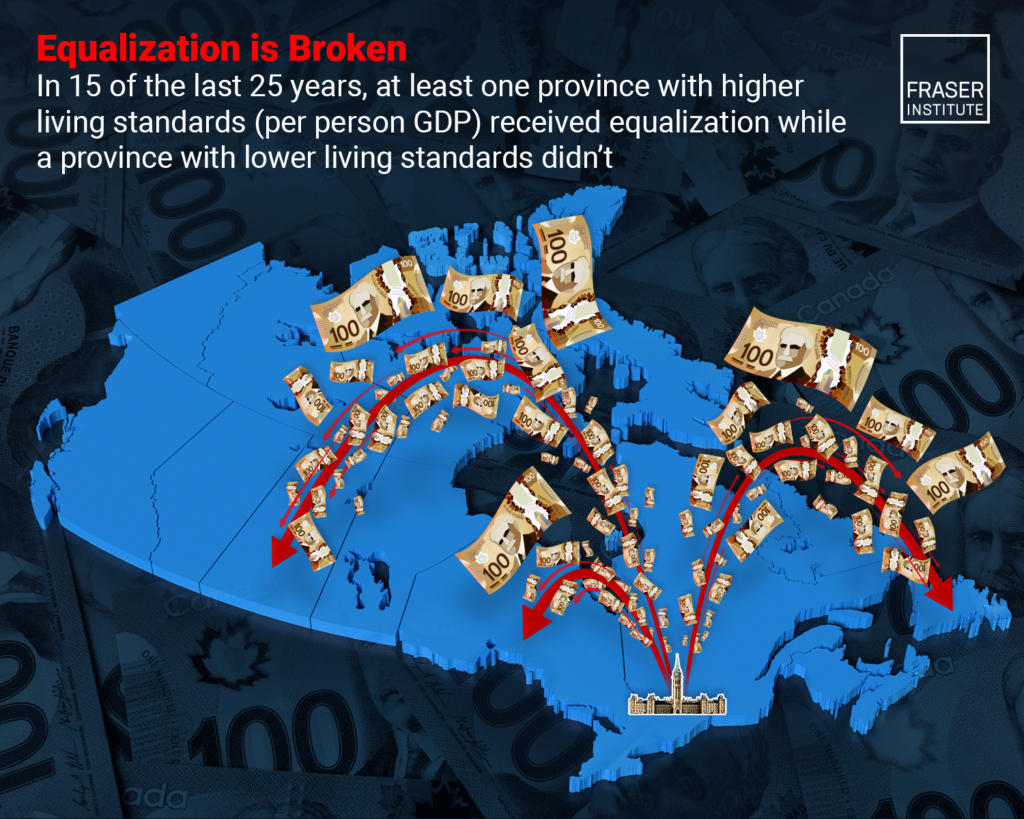
In 15 of the Last 25 Years, One or More Provinces with Higher Living Standards (per person GDP) Received Equalization While a Province with Lower Living Standards Did Not
By Tegan Hill and Joel Emes



Is Equalization Broken? Comparing Payments with GDP per Person
- If the equalization program works as intended, there should be a fairly consistent relationship between GDP per person levels (and ranks) and equalization payments. This study assesses that relationship from 1981 to 2024 and finds that there were discrepancies in all but three years.
- For instance, from 2009 to 2018 (22.7 percent of the period), Ontario received equalization payments every year, while British Columbia (BC) received zero payments, even though that province had a lower GDP per person than Ontario in each of the 10 years. Total equalization payments to Ontario totalled $19.0 billion over the period, while Ontario’s GDP per person was 3.2 percent higher than BC’s on average.
- There were numerous cases where, among receiving provinces, a province received greater equalization payments per person than one or more other provinces that had a lower GDP per person. For instance, from 2000 to 2007, Newfoundland & Labrador had a higher GDP per person than one or more provinces in every year—as many as four provinces in 2005—but received greater per person equalization payments.
- During the period of analysis, there were numerous discrepancies between equalization payments and GDP per person. Some of the discrepancies have persisted over many years, and include recent years, demonstrating that there are ongoing, structural issues with the equalization formula.
Share This:






















INSIGHT: The Northern Shield Energy Corridor Provides Energy Security for All Canadians – Yogi Schulz