


 CDN NEWS |
  US NEWS


By Jim Warren
Once again president Donald Trump has disrupted global trade and commerce. The current wave of attacks on Iran is the second time in the space of a year the Trump Administration decided to kick the crap out of an undemocratic OPEC member state heavily reliant on oil exports.
Disrupting oil tanker traffic in the Persian Gulf or at its choke point in the narrow Strait of Hormuz can seriously threaten the global crude trade. The International Energy Agency (IEA) reports that in 2025 Persian Gulf producers were exporting and estimate 15 to 20 million barrels of oil per day, accounting for nearly 20% of the global crude trade.
China and other Asian countries are heavily dependent on oil and gas produced in the gulf. And the economies of the gulf countries are in turn almost totally dependent on oil and gas revenues. For example, in 2025 China purchase 91% of the oil exported by Iran. China needs the oil, Iran needs the revenue. Iranian production that year was running at around 3.2 million barrels per day.
Yet, despite the critical importance of oil tanker and LNG carrier traffic flowing in and out of the Persian Gulf, accurate information is at premium. Messages from the Whitehouse and Pentagon are erratic and mainstream media reports are often based on incomplete information and conjecture.
Some reasonably reliable details have managed to penetrate to fog of war. But at the same time some of what passes for news is hard to believe.
The benchmark prices for crude provide a reasonably accurate indication of the effects of the global oil market.
On February 26, two days before the US and Israel launched their attacks on Iran, Brent crude was selling for $69.85 and WTI was going for $64.27. One week into the conflict the Brent price was up to $92.69 and WTI was at $90.01.
During the second week of the war prices were fluctuating up and down by as much as $10 per barrel in the space of a day. Something as insubstantial as Trump’s latest post on social media, hinting about the expected duration of the war could move prices. Between March 9 and March14 the price for Brent crude ranged between $91.04 per barrel and $103.4. Over the same week WTI ranged between $86.72 and $99.64. Based-on the highest prices posted since the war began, that amounts to a 32% increase in the Brent price in just 17 days and a 35.5% increase in the price of WTI over the same period.
LNG importers from Europe and Asia are scrambling to find suppliers other than Qatar, the Gulf’s biggest LNG exporter. The average charter rates for LNG carriers has increase six fold since February 28 and particularly desperate importers are reported to have paid 10 times the normal rate.
The US War department has reported that all of Iran’s naval vessels have been sunk including its three purpose-built mine layers (albeit the Iranians are capable of using speed boats to lay mines). The Pentagon also claims the war has substantially reduced Iran’s missile inventories and destroyed its fleet of military aircraft. But opinions vary regarding the extent to which quantities of smaller missiles and drones capable of striking oil tankers and LNG carriers in the Gulf have been critically reduced. Many of these claims may be inaccurate. We are dependent on the veracity of War Department communications, and the Secretary for War, Pete Hegseth, is an unreliable source.
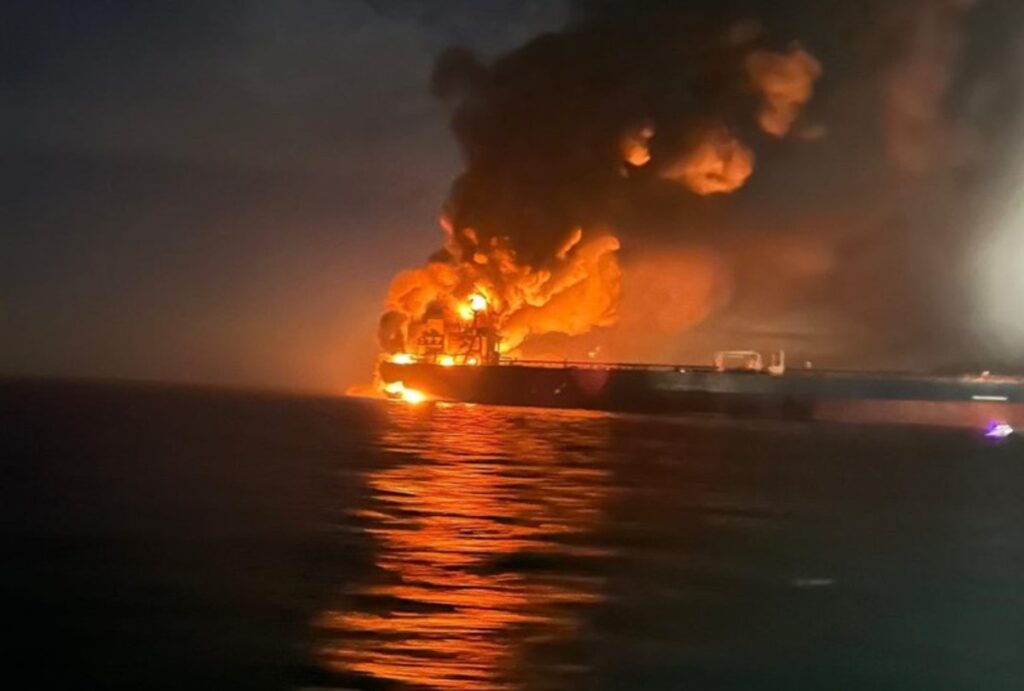
Media reports contend that there have been somewhere between 12 and 20 attacks on merchant vessels in the gulf, most of which are presumed to be tankers. Several of the attacks appear to have been successful. Newscasts have shown video of oil tankers engulfed in flames. We are led to assume the images are from the current war.
Rumours reported in newscasts claim the Iranians have been laying mines in the Strait of Hormuz—a tactic they used to damage ships during the Tanker War of the 1980s. If true, which it isn’t, full use of the strait could not resume before the mines are cleared. Even if a ceasefire were announced tomorrow the mine sweeping could take several weeks or months.
Mainstream media’s allegedly expert analysts have reported that the attacks have prevented 20 million barrels of oil per day from leaving the Persian Gulf. This is pure conjecture. It assumes none of the pre-war quantity of oil leaving the Gulf prior to February 28 is making it to the high seas.
There is plenty of evidence indicating ships have indeed been passing through the strait Hormuz. It appears vessels from countries on friendly terms with Iran have been given a free pass and there’s a good chance some captains turn off their transponders and scoot through undetected. That would all change if Iran starts placing mines in the strait and elsewhere in the gulf.
The Persian Gulf Tanker War of the 1980s
The global energy crisis triggered by the Iranian revolution 1977-1979 followed by the Iran Iraq War 1980-1988, caused a spike in oil prices and a steep decline in the production of oil in the Persian Gulf states. It also sparked a severe worldwide recession in 1981 and ‘82 and a huge jump in the rate of inflation. Albertan’s will recall the recession of 1981-‘82 coincided with the introduction of the National Energy Program and usurious increase in mortgage interest rates which rose to nosebleed heights—up to as much as 18%-20%.
The Tanker War of the 1980s was part of the Iran-Iraq war. Iraq began attacking merchant ships in the Gulf; especially oil tankers and Iranian oil infrastructure in 1980. Iran initially went after Iraqi oil terminals and ships in Iraqi ports but in 1984 it joined Iraq in attacking ships in the Gulf and Strait of Hormuz. The Tanker War ended in August of 1988 in conjunction with the signing of the ceasefire ending the Iran-Iraq War.
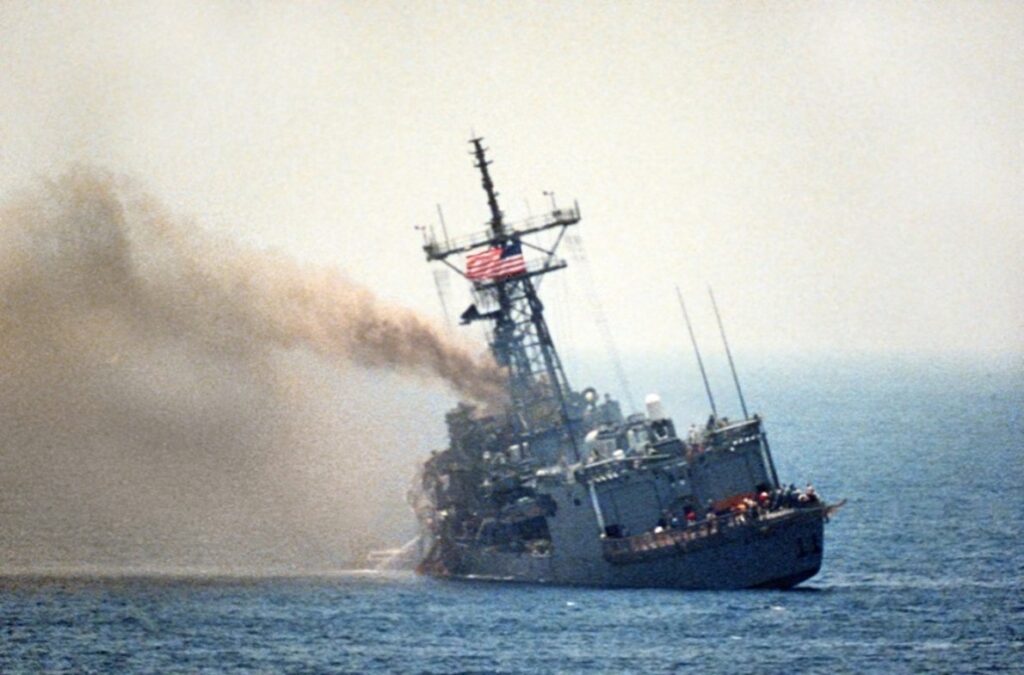
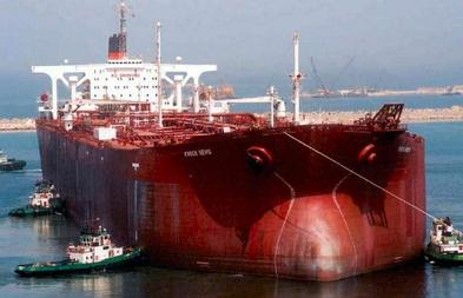
Over the course of the War 451 ships were attacked and damaged, 11 of them were sunk. Iraq was responsible for 283 of the successful attacks, Iran managed to strike and damage 168 merchant ships. An estimated 100 sailors were killed during the Tanker War, including 37 US navy sailors on the missile frigate USS Stark, which was severely damaged by Iraqi aircraft on 17 May 1987. One of the oil tankers so badly damaged that it was initially not expected to stay afloat was Seawise Giant, the world’s largest oil tanker at the time. The ship was eventually restored to service by contractors based in the gulf and Malaysia.
Tanker traffic in the Persian Gulf declined as the number and intensity of the attacks increased. Unfortunately, the publicly available data sets I have managed to locate only provide complete attack records for 1984, 1987, and 1988. But those records are nevertheless insightful.
There is an old maxim that says, “When a new war starts the generals are initially locked into the tactics and technology they used when fighting the last war.” So much has change in the four decades since the Tanker War it would be just about impossible to rely totally on outdated weapons and tactics. Despite what the maxim says, the US has made good use of a few lessons and practices that worked in the last war.
Over the course of the 1980s Tanker War the vast majority of Iraqi attacks involved land-based missiles and bomb and missile attacks by aircraft. The Iranian attacks relied primarily on small patrol-gunboats, along with the occasional use of naval frigates. Prior to 1988, Iranian mines damaged several ships, and there are a few instances when Iran employed land based missiles.
Among the first steps taken by the US military in the 2026 war were efforts to destroy the Iranian air force and Iran’s naval capabilities. Clearly the US learned a few things from history.
What history did not prepare the US military for was how to inexpensively defend against swarms of drones, without some of them getting through to their targets. Thousands of small inexpensive drones can be easily hidden and so can the relatively smalls speed boats from which Iran can lay mines, launch small missiles, fire rocket propelled grenades and plant IEDs. Small drones can be launched from just about anywhere. And they don’t require launch pads visible from space. Furthermore, speed boats, drones and their components can be built locally or smuggled in from just about anywhere– but most probably from Russia.
Figuring out how best to deal with drones and speed boats will take time and it’s likely any solutions adopted will be imperfect. Some drones and speed boats will always get through; especially if tankers are not provided with naval escorts. And escorts will not be made available because Trump is too afraid of losing ships and sailors. This doesn’t mean tanker traffic will drop to zero, but obviously there will be ship owners, insurers, ships’ captains and crew members reluctant to take the risk.
The best solution would be a formal ceasefire ending the war
In 1977, one year before the outbreak of the Iranian Revolution, OPEC members produced 10.658 billion barrels of oil. In June of 1977 WTI crude was priced at $13.90. By March of 1979 the revolution was over but Iran’s oil production had declined due to the economic paralysis caused by the revolution. In 1980, Just as Iran’s oil production began returning to pre-Revolution levels, war broke out between Iraq and Iran. The Tanker War and the Iran-Iraq War wouldn’t end until August 1988.
The table and notes provided at the end of this column show the production volumes for: OPEC member states, members of the OECD, and the rest of the world’s (ROW’s) oil producing counties; along with the annual price for WTI crude for selected years from 1979 to 1988. In order to get a reasonable estimate of oil production in the Persian Gulf countries during the war, I assumed that virtually all of the increases in and decreases in OPEC production until at least 1986 can be attributed to the six OPEC members bordering the Persian Gulf in the 1980s (Qatar was still a member of OPEC during the 1980s).
Persian Gulf/OPEC production declined steadily from 1979 until 1985, falling by 47% from 10.643 billion barrels to 5.593 billion barrels. Crude prices increased from $13.90 per barrel in 1977 to its 1980s peak of approximately $39.00pb in 1980-’81 (a 67% increase). It wasn’t until 1990, one and on-half years after the end of the war, that the world’s oil production returned to pre-war levels. And, it took until 1998, a full decade after the end of the war, before prices returned to pre-war levels.
Growth in production after 1985 occurred in all three regional groups–OECD, OPEC and the ROW. Several factors contributed to production growth and the accompanying decline in prices. For example, the Alaska pipeline from Prudhoe Bay to Valdez had been completed, North Sea production was booming and OPEC members located within and beyond the gulf were increasing production after 1985.

Best guess scenarios going forward
We are a long way from the 451 successful attacks on oil tankers and other commercial vessels that occurred in the 1980s. But the current war is still young. Over the course of the 1980s Tanker War, damaging attacks on ships averaged 56.4 per year over eight years. So far during the current war the Iranian’s have been quite successful relative to the last war. After just two weeks of attacks, if we accept the low-ball estimate of just 12 damaging attacks, we get a rate of six attacks per week which works out to 312 per annum—82% higher than the attack rate in the 1980s.
The rate of attacks we have seen in the first two weeks in unlikely to be sustained, simply because while the danger lasts tanker traffic in the strait will decline, reducing the number of potential targets. And eventually the combatants will need to seriously think about conserving weapons stockpiles.
If we can believe Iran’s March 14 pledge to refrain from attacking ships belonging to its regular customers, China and India in particular, the pressure on oil prices and production may not reach 1980s levels. But that doesn’t mean no tankers will be attacked. Iran promises it will continue to strike ships with links to Israel and the US. But it does mean that Iran is unlikely to mine the waters of the Strait of Hormuz—it customers will need to safely transit the strait.
On the other hand, if the US decides to prevent Iran from shipping any oil from Kharg Island, its only major deep water oil terminal, the conflict could escalate. If Iran is prevented from exporting oil, it is likely to respond by trying to ensure no one else from the gulf can export any oil. Mines could be laid and Iran could call it open season for drone attacks on all tankers.
A lot has been made of Iran’s purported ability to persevere through a long conflict. This scenario compares Iran’s position with that of the North Vietnamese and Vietcong in Vietnam or the Taliban in Afghanistan. Hardline fanatics in Iran’s Revolutionary Guard, army and the secret police are similarly expected to hold out to the bitter end.
Perhaps.
But another lesson from the 1980s is that Iran is not anywhere near self-sufficient in agricultural production. Maintaining the struggle when people are hungry and malnourished can’t go on forever. Geopolitical analyst Gwynne Dyer said Iran could not withstand sanctions that effectively blocked its food imports. In the 1980s and ‘90s if it weren’t for huge shipments of frozen Australian lamb and mutton, ordinary Iranians would have gone hungry. And, hungry Iranians can be expected to hold mass protests and launch general strikes that paralyze economic activity.
General strikes were one of the principal factors responsible for the fall of the Shah in 1979. Another key development was when the Iranian army finally refused to continue shooting its own people. At that point the Sha’s regime was doomed.
The majority of Iranian’s would be undoubtedly be content with a regime change if it signaled an end to the Tanker War and harsh sanctions.
A question we are left with today is…how long can we expect the maniacs in the Revolutionary Guard to go on killing their fellow countrymen and women? Until that happens it is unlikely the new tanker war will end on account of a popular uprising that kicks the Mullahs out of power.
By the same token, should America’s Toddler in Chief decide to attack Cuba or become otherwise distracted, he could declare his Iranian mission had been accomplished and pull out of the war tomorrow.
In the final analysis no one knows for certain how, and when, the 2026 Tanker War will be resolved. Yogi Berra was right. Making predictions is hard; especially when they’re about the future.
Price and production effects of 1980s Tanker War plus comparisons with 2025-2026
| Year | 1979 | 1980 | 1981 | 1985* | 1990 | 1998** | 2025*** | 2026 0314+ |
| OECD | 5.798Bb | 6.077Bb | 6.231Bb | 6.876Bb | 6.729Bb | 7.777Bb | ||
| OPEC | 10.643Bb | 9.303Bb | 7.843Bb | 5.593Bb | 8.216Bb | 10.768Bb | ≈10.774Bb | ≈10.5mbpd |
| ROW | 7.227Bb | 7.418Bb | 7.491Bb | 7.982Bb | 8.451Bb | 7.770Bb | ||
| Total | 23.668Bb | 22.798Bb | 21.493Bb | 20.451Bb | 23.369Bb | 26.315Bb | ≈38.000Bb | |
| Price++ | $18.10pb | $39.5pb | $38.00pb | $26.87pb | $17.05pb | $14.30pb | $60.79pb | $93.45+++ |
Note: OPEC production for 1977 was 10.658 Bb at WTI price of $13.90pb. In 1978 mass demonstrations paralyzed Iran causing a significant decline in oil production OPEC production fell to 10.225 Bb at WTI price of$14.85. By March 1979 the revolution was over, oil production increased over 1978 levels for a short period before falling again in 1980 with the outbreak of the Iran Iraq War.
Sources: Macrotrends, Crude oil prices (1946-2026)
https://www.macrotrends.net/1369/crude-oil-price-history-chart
IEA (International Energy Agency) World oil production 1971-2020 https://www.iea.org/data-and-statistics/charts/world-oil-production-by-region-1971-2020
Oilprice.com https://oilprice.com/oil-price-charts/block/1
* Lowest production for OPEC 1979-1998
** The first year that OPEC production recovered to just over its 1978 level
*** Production levels for OPEC increased last half of 2025 in response to a Saudi led reversal of production cuts.
+ This column provides an OPEC production estimate in barrels/day for the period Feb. 28 – Mar 15, 2026 during the US/Israel attacks on Iran. The production estimate is based only on media reports claiming production losses due to limitations on Persian Gulf tanker traffic of 20million bpd—this figure lacks backing offial or industry statistics.
++ all prices are for WTI crude June snapshots
+++ This is the price posted for WTI crude on the website Oilprice.com 8:30 am on Sat. March 14.
-30-
Share This:


