


 CDN NEWS |
  US NEWS


Each week, XI Technologies scans its unique combination of enhanced industry data to provide trends and insights that have value for professionals doing business in the WCSB. If you’d like to receive our Wednesday Word to the Wise in your inbox, subscribe here.
In our recent posts looking back on the oil and gas sector in Western Canada in 2020, we focused on production: both from new wells and existing wells. This week, we wanted to examine a different part of the E&P landscape and look at how the WCSB managed liabilities in 2020.
For this we wanted to examine liability values and reclamation totals from the end of December 2019 to the end of December 2020 to get a broad picture of the state of oil and gas liabilities. We then compared these totals with those from 2019 to get a sense of the direction our sector is moving in terms of taking care of their responsibilities.
Liability Values
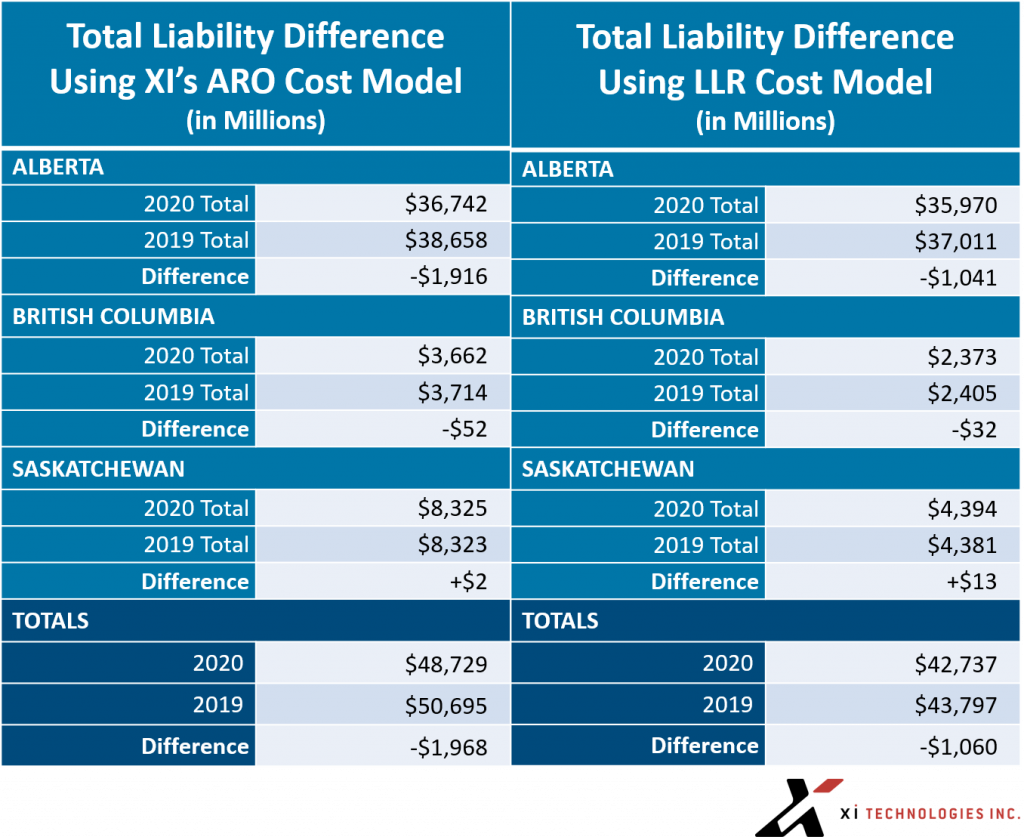
The information was compiled using XI’s ARO Manager and AssetSuite well and facility data. Pipeline information was specifically excluded for this compilation as provincial LLR calculations do not currently include those assets.
Comparing the 2020 numbers with 2019’s show that liability values have been reduced in the WCSB by over $1 billion with Alberta accounting for most of the drop. Using XI’s ARO cost model, which considers many real-word factors left out of the LLR model, the improvement is nearly $2 billion. Using the less complete LLR cost model based on the regulator cost model still keeps the improvement over $1 billion.
For a look at five major differences between XI’s proprietary third-party cost model and regulator LMR costs, download this case study. The biggest difference noted here is due to regulators understating reclamation costs, and not factoring in remediation costs.
Reclamations in Western Canada
Now let’s look at the number of site reclamations done in 2020. This data is based on the license status change for a site, which is to say that it’s not necessarily reflective on when the work was done, but when the status changed according to the regulators (i.e., when the site has officially been “reclaimed”).
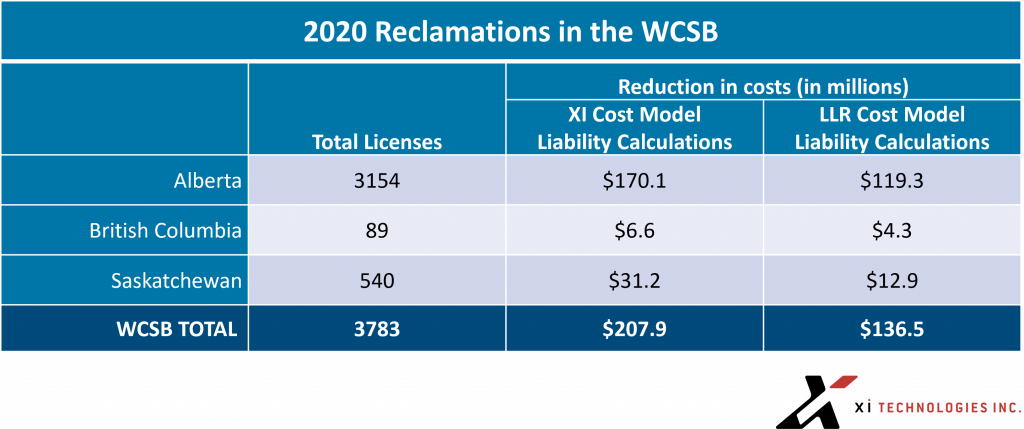
Above are the total reclamations in the past six months, broken down by province. Using XI’s cost model, you see that operators in these western Canadian provinces took an estimated $208 million off their books in 2020 months, reclaiming 3783 well sites. These costs are based on our reclamation and remediation cost estimates, and do not include SSLAs or proprietary estimates.
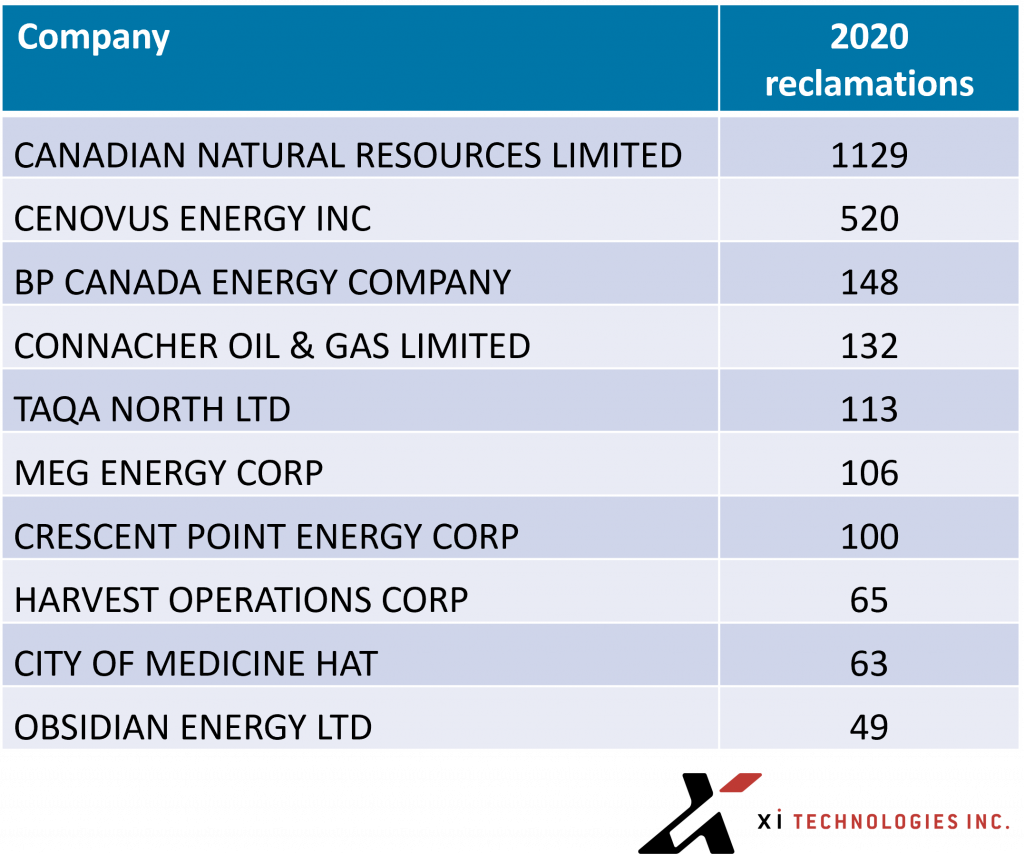
The chart above details which operators were most active last year in terms of reclamations. Note: this list does not include reclamations performed by the Orphan Well Association.
The overall reduction in liability and increase in reclamations serve as evidence that operators in the WCSB are serious about tackling reclamations. Despite the myriad of challenges posed in 2020 and with assistance from government SRP programs, oil and gas producers made real efforts to reduce their on-paper ARO and meet their Environmental, Social & Governance (ESG) responsibilities.
This data was calculated using XI’s liability software module, AssetBook ARO Manager. ARO Manager is the only standardized tool for estimating and monitoring asset retirement obligations in Western Canada’s oil and gas sector. To learn how XI’s ARO Manager can help with the planning and reporting of liability management, visit our website or contact us for a demo.
Share This:


COMMENTARY: Canadians Should Decide What to do With Their Money – Not Politicians and Bureaucrats