


 CDN NEWS |
  US NEWS


Canada still has chance to enter burgeoning market with demand for liquified natural gas set to rise in Asia
To sign up to receive the latest Canadian Energy Centre research to you inbox email: [email protected]
Download the PDF here
Download the charts here
Overview
Liquefied natural gas (LNG) is an increasingly important component of the international natural gas trade, with global trade in LNG reaching US$130 billion annually as of 2019. The global share of LNG as a proportion of all gas imports increased from 22 per cent in 2000 to 38 per cent in 2019. In Asia, 70 per cent of the gas imported is in the form of LNG. However, Canada, despite its abundant natural gas resources, exports no liquefied natural gas, though one export terminal is under construction in British Columbia.
As a destination for investment in liquefied natural gas (LNG),¹ Canada is not popular. For example, in March 2020, the American investment firm Berkshire Hathaway withdrew its funding from a US$9 billion liquefied LNG project in Quebec, and within several months (in July 2020), it redirected the funds to purchase an interest in US Dominion Energy Natural Gas in a US$10 billion deal (Morgan, 2020). Meantime, while Canada remains on the sidelines, other nations have attracted LNG investment and benefited from the rise in LNG export markets.
There has been significant discussion among policymakers and others as to why LNG projects have not proceeded in Canada beyond the planning stage, except for the one LNG Canada project in British Columbia (McConaghy and Wallace, 2019; Grant and Grant, 2019). However, this Research Brief aims not to focus on that debate, but to review the growth in the global LNG market and Canada’s near non participation in that market.
This Research Brief is divided into two main sections:
- an overview of the global trade (exports and imports) in LNG; and
- a look at the recent growth in the construction of LNG liquefaction and regasification terminals around the world.²
1. LNG is natural gas that has been converted to a liquefied state by cyrogenic processing. LNG supply chain includes production, liquefication, shipping, regasification, and delivery to the end user. Natural gas exporting countries increasingly use LNG for packaging their natural gas exports where the importing countries have no feasible pipeline access.
2. Liquefication terminals convert natural gas into a liquid state by compressing and liquefying natural gas. Regasification terminals convert liquefied gas back to the vapour state so natural gas can be transported by pipelines for distribution to end users.
Growth in the international LNG trade since 2000
Canada has abundant natural gas resources and is a net exporter of natural gas, with all of its exports going to the United States (US). Still, growing shale gas production in the US has reduced that country’s demand for Canadian gas (Moore et al., 2014).
Consequently, gas producers in both the US and Canada have sought overseas markets for their natural gas exports, including Asian markets where pipeline exports are not feasible (Moore et al., 2014). While American gas producers have succeeded in increasing LNG exports in recent years, Canadian natural gas producers have been limited—for a variety of reasons—to one export market, the United States.
Many countries are active players in global LNG markets; they have export terminals currently operating and are constructing additional facilities. In Canada, 18 LNG projects have been proposed (Natural Resources Canada, 2020). However, only one is currently being constructed due to delays caused by regulatory and financial barriers and/or opposition to the projects, including in some instances anti-oil and gas activism (McConaghy and Wallace, 2019).
According to the International Energy Agency (IEA, 2020a), the 2020 decline in natural gas demand will reverse in 2021 and return to its higher, pre-Covid-19 levels, with consumption rising even higher in coming years. Of note, the Asia Pacific region will account for half of the growth in global gas consumption.
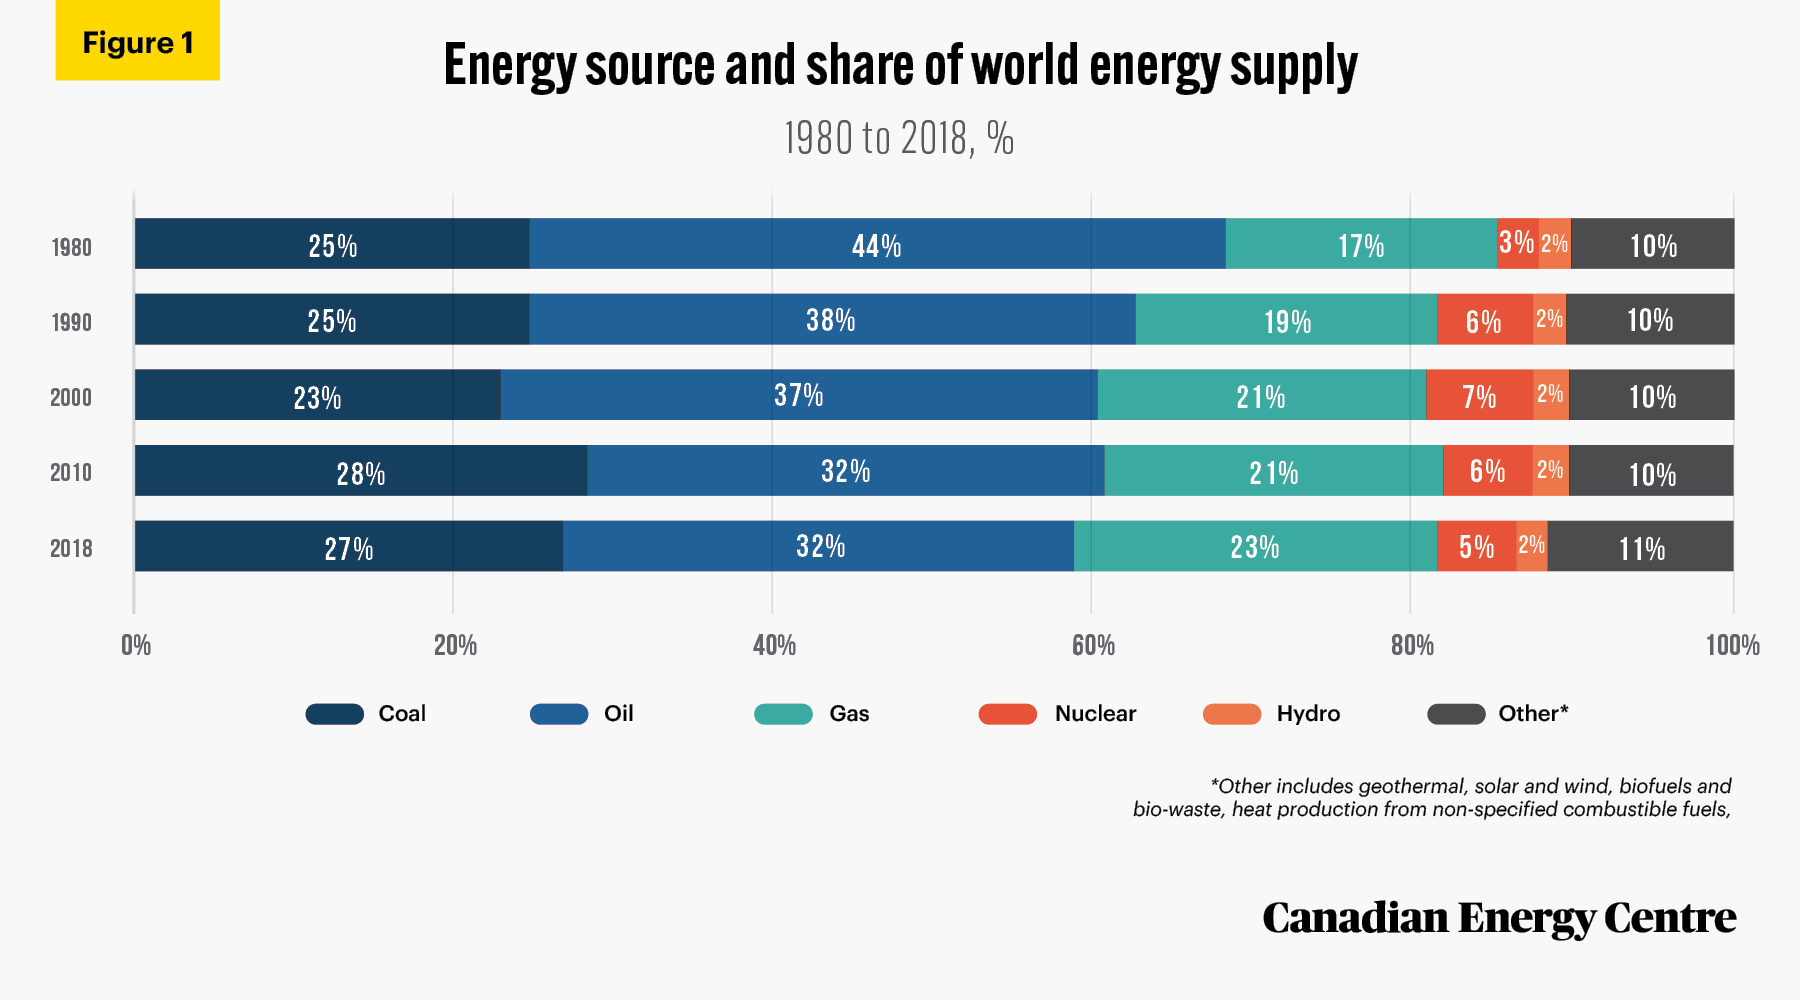
The world’s changing energy supply: The proportion of each type of energy
Between 1980 and 2018, the world’s total energy supply (TES)³ doubled from 7,203 Mtoe (million tonnes of oil equivalent) to 14,282 Mtoe. The share of oil in the world energy supply decreased from 44 per cent in 1980 to 37 per cent in 2000, and further declined to 32 per cent in 2010, where it remained for the last decade. In the same period, the market share of natural gas grew from 17 per cent in 1980 to 23 per cent in 2018 (see Figure 1).
3. Total Energy Supply (TES) is defined as production + imports - exports ± stock changes
Source: Authors’ calculations from IEA (2020b), World Energy Statistics (database).
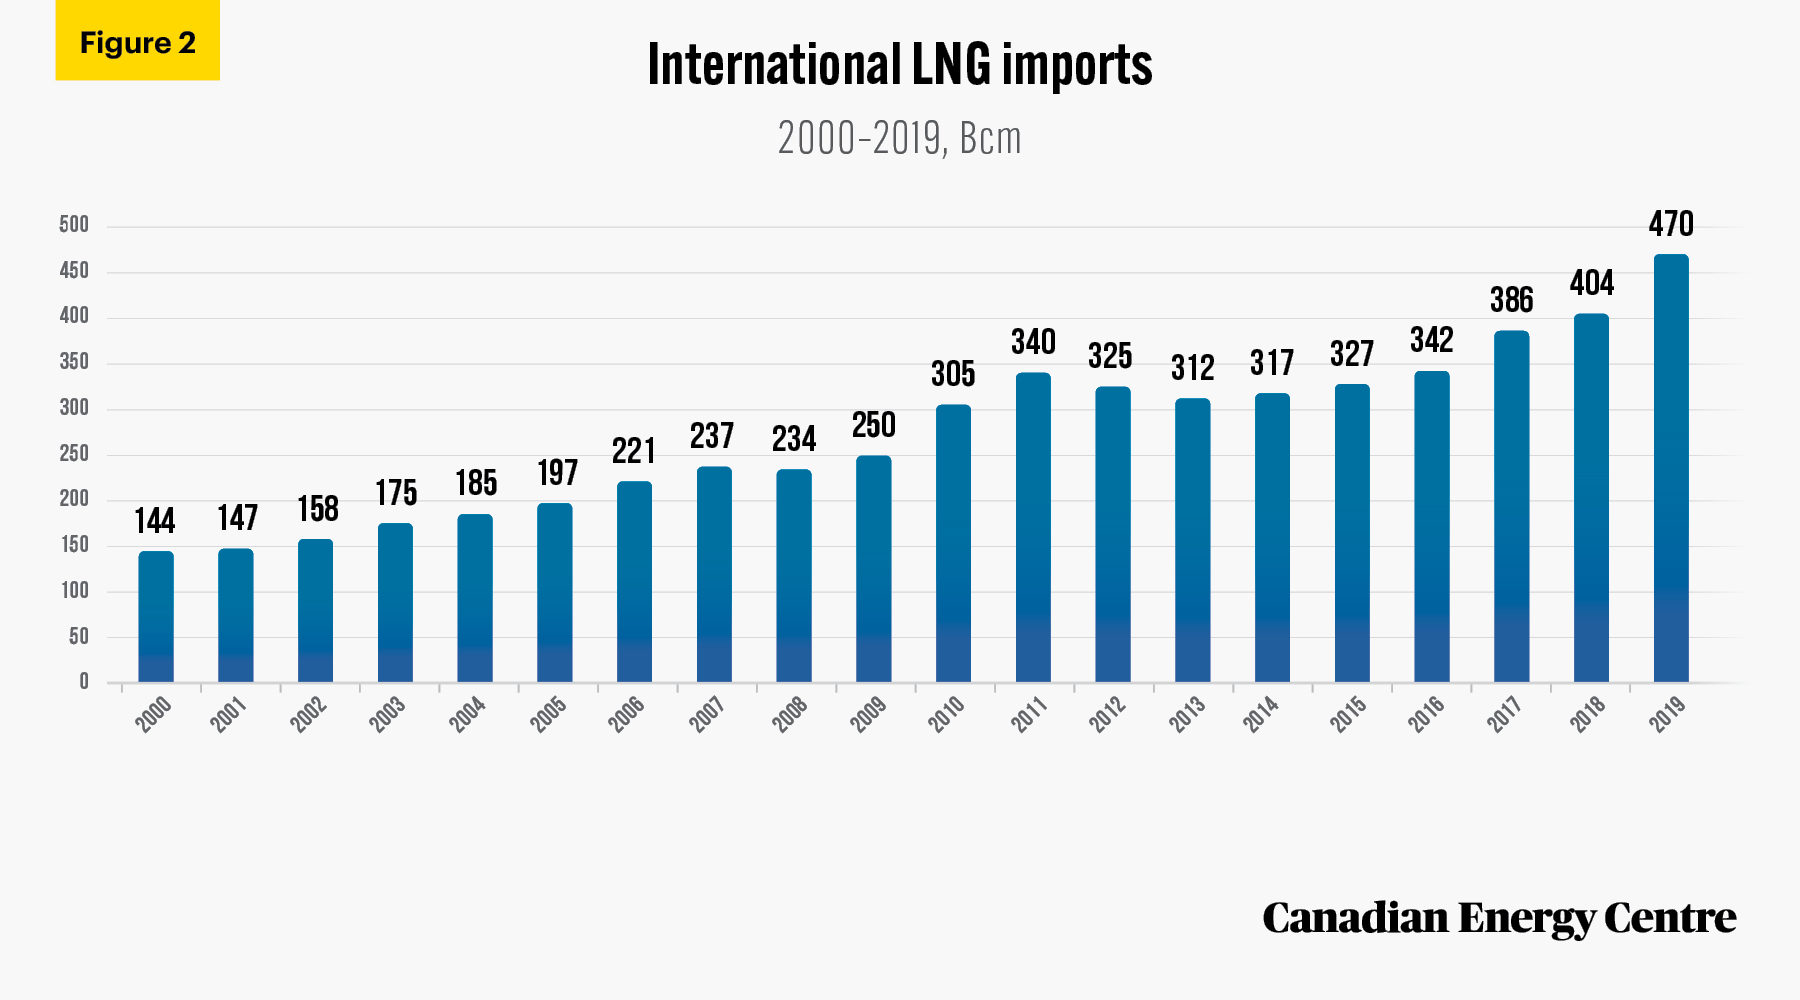
International LNG imports
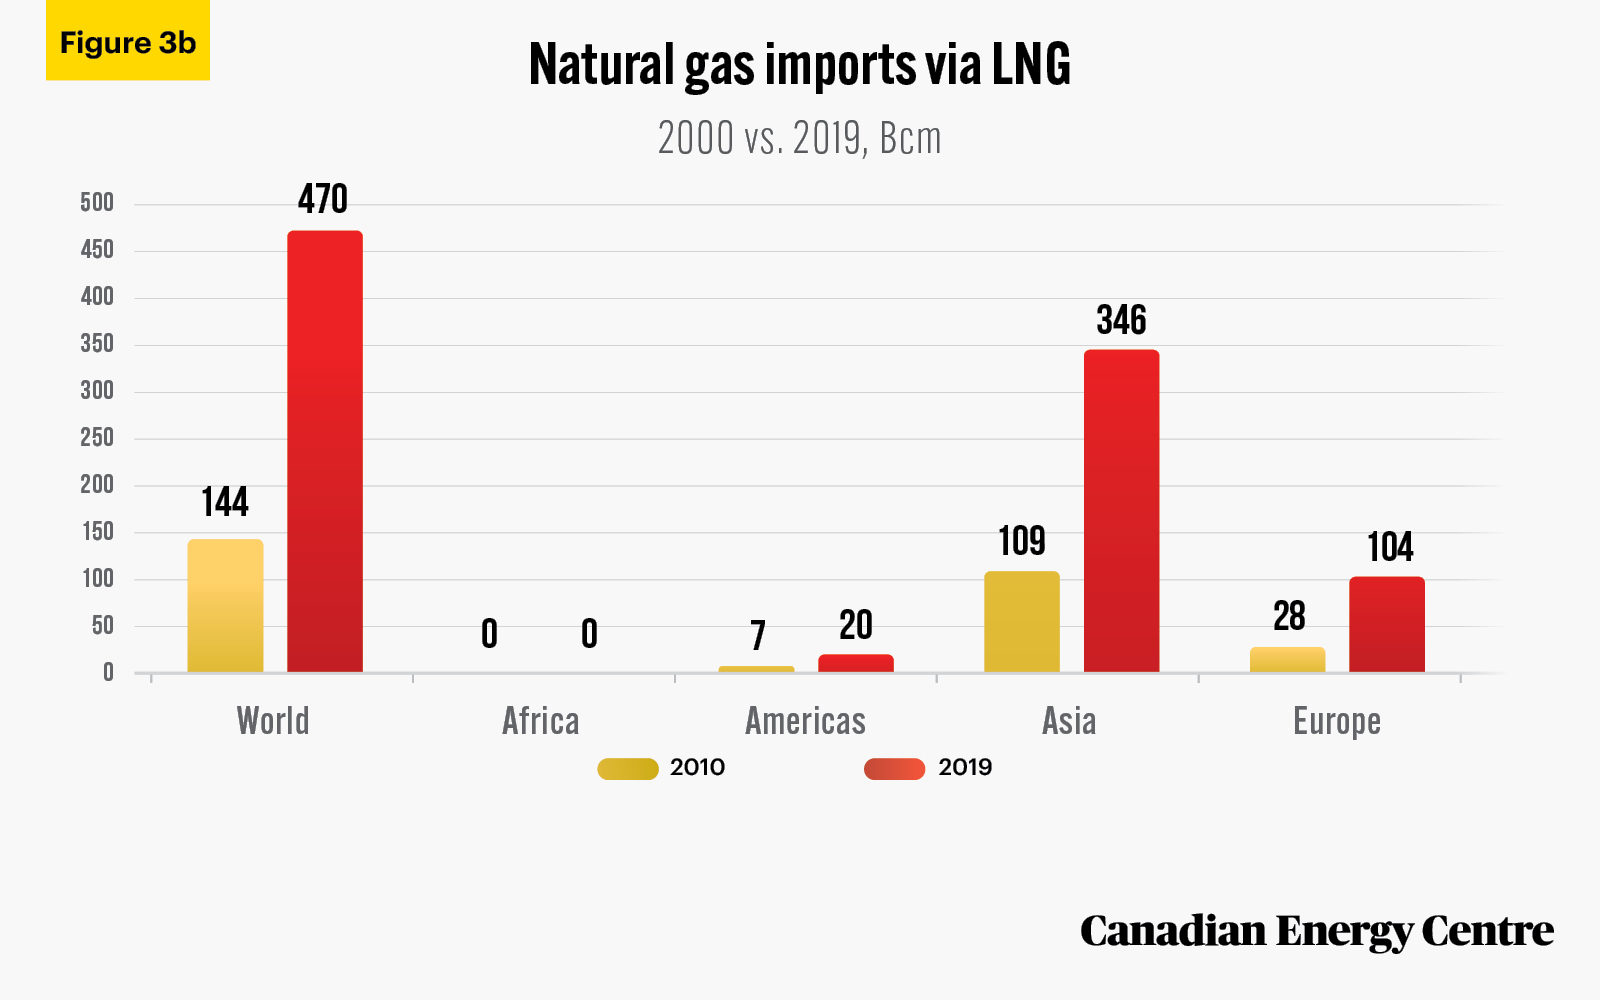
Natural gas consumption growth has led to increased international natural gas imports both through pipelines and, where pipelines are not feasible, LNG. The international imports of LNG have risen from 144 Bcm (billion cubic meters) in the year 2000 to 470 Bcm in 2019 (see Figure 2).
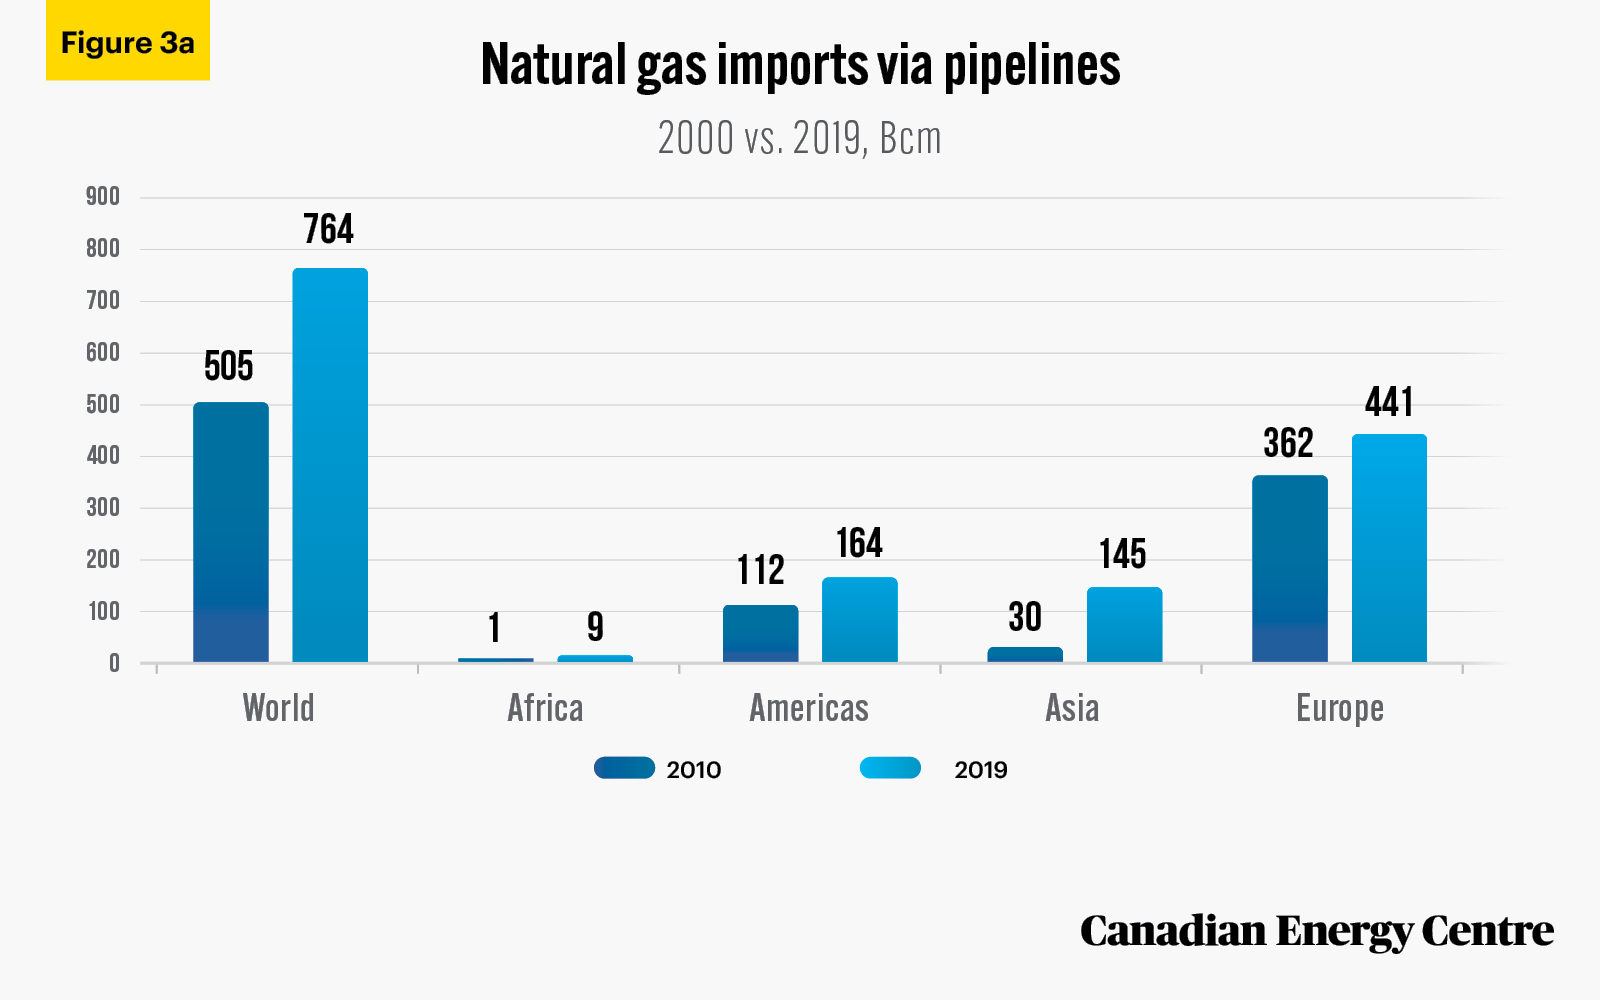
Worldwide international imports of natural gas: Pipeline shipments
Worldwide imports of natural gas through pipelines rose from 505 Bcm in 2000 to 764 Bcm in 2019, an increase of 259 Bcm or 51 per cent. The breakdown by region was as follows (see Figure 3a):*
- Europe: 441 Bcm in 2019, or 79 Bcm and 22 per cent higher;
- Americas: 164 Bcm in 2019, or 52 BCM and 47 per cent higher;
- Asia: 145 Bcm in 2019, or 115 Bcm and 386 per cent higher; and
- Africa: 9 Bcm in 2019, or 8 Bcm and 774 per cent higher in 2019 over 2000.
In sum, the highest rise in shipments of imported natural gas by pipeline in absolute volume occurred in Asia (up 115 Bcm) and Europe (higher by 79 Bcm).
Worldwide international imports of natural gas: LNG shipments
Worldwide imports of natural gas in the form of LNG rose from 144 Bcm in 2000 to 470 Bcm in 2019, an increase of 326 Bcm and 226 per cent during the period. The breakdown by region was as follows and does not include Africa, which had no LNG imports (see Figure 3b):
- Europe: 104 Bcm in 2019, or 76 Bcm and 266 per cent higher;
- Americas: Over 20 Bcm in 2019, or nearly 14 BCM and 203 per cent higher; and
- Asia: 346 Bcm in 2019, or 237 Bcm and 217 per cent higher in 2019 over 2000
In sum, the sharpest rise in LNG imports by volume occurred in Asia (up 237 Bcm) and Europe (up 76 Bcm). Of note, the Asia Pacific region, with LNG imports of 346 Bcm in 2019, constituted 74 per cent of the world share of all LNG imports.
*Bcm figures in text and in figures are rounded to nearest whole numbers. Percentages are based on original data including fractions of whole numbers. Readers will thus arrive at slightly different percentages if replication is attempted using only whole numbers.
Source: Authors’ calculations from IEA (2020b), World Energy Statistics (database).
Source: Authors’ calculations from IEA (2020b), World Energy Statistics (database).
Source: Authors’ calculations from IEA (2020b), World Energy Statistics (database).
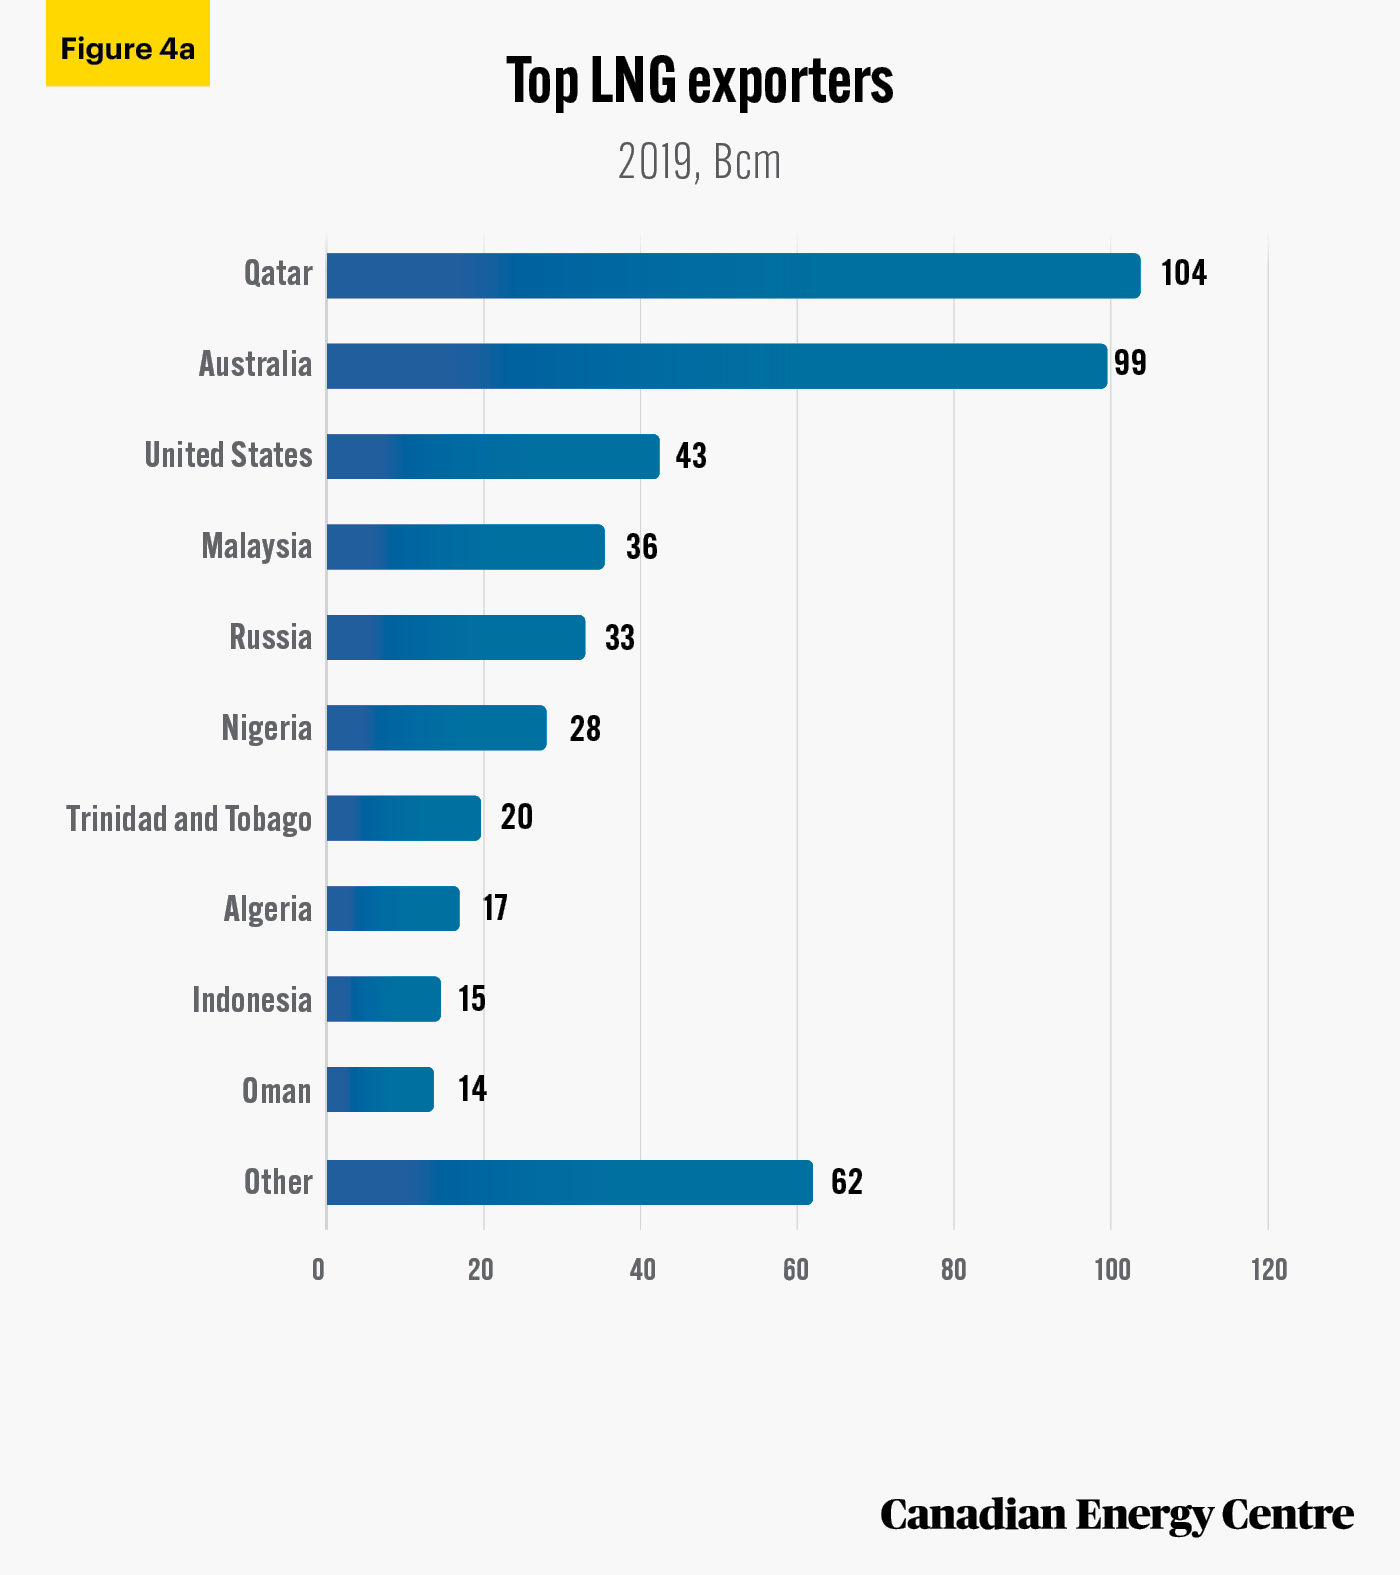
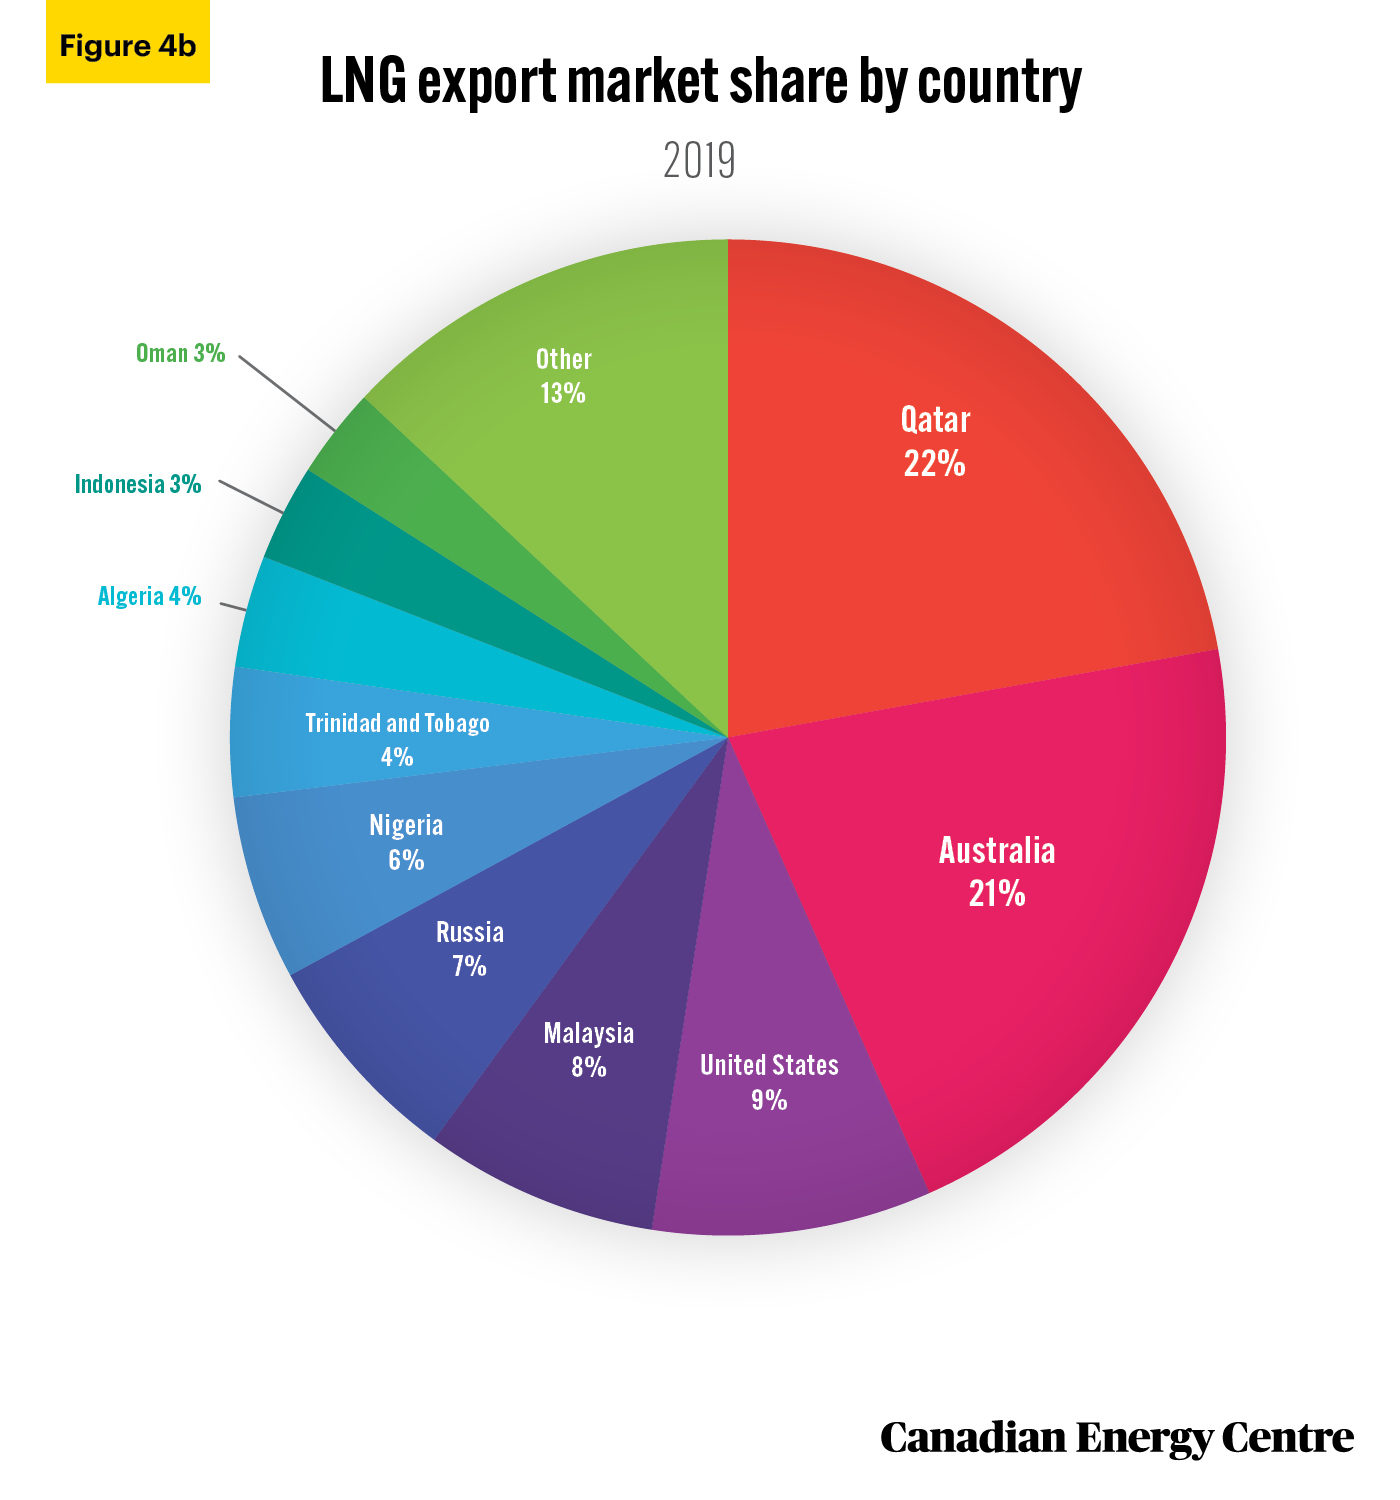
Major LNG supporting countries
Qatar is the world’s top exporter of LNG. In 2019, Qatar’s exported 104 billion cubic meters (Bcm) of LNG (Figure 4a) and accounted for 22 per cent of global LNG exports that year. It was followed by Australia (21 per cent) and the United States (9 per cent) (see Figure 4b).
Source: Authors’ calculations from IEA (2020b), World Energy Statistics (database).
Source: Authors’ calculations from IEA (2020b), World Energy Statistics (database).
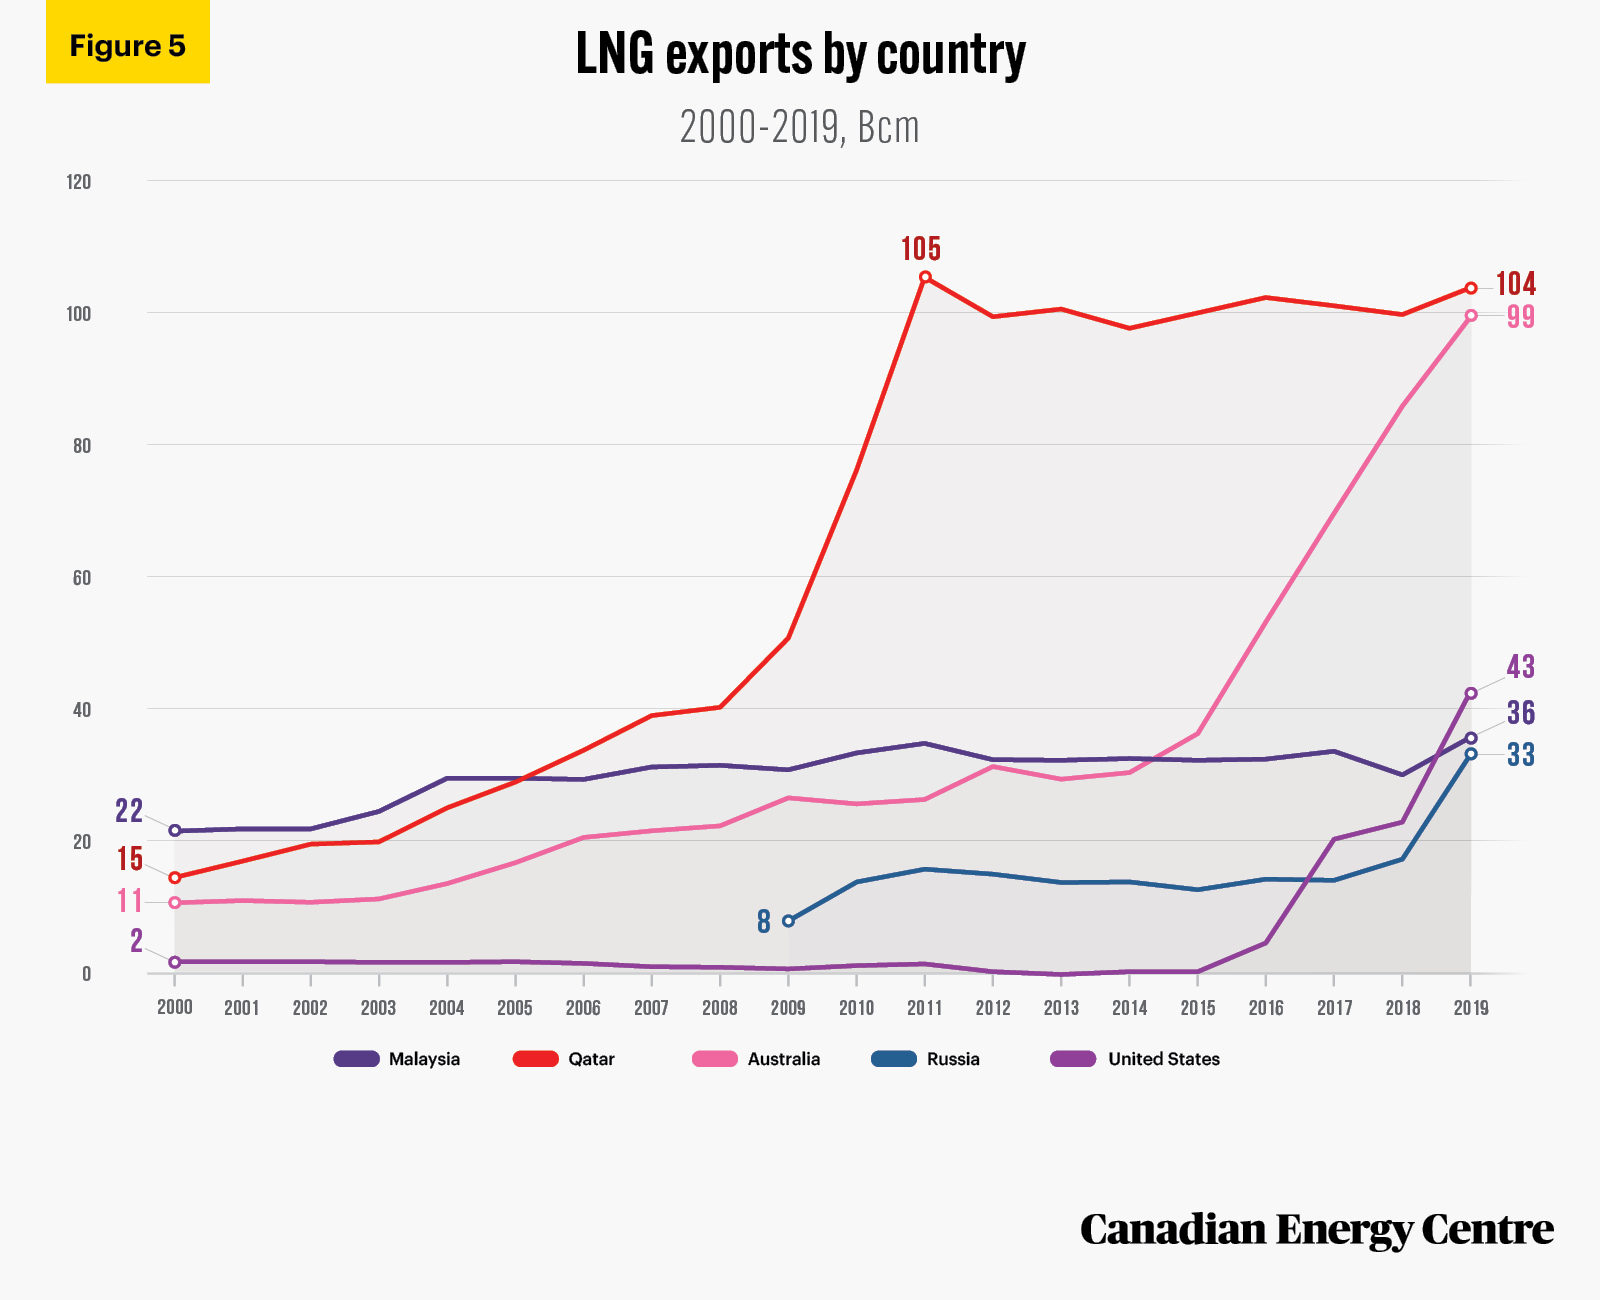
Trends in LNG exports from 2000 to 2019
Several countries, including those listed below, have seen their LNG exports grow significantly between 2000 and 2019 (see Figure 5). They are, in order of the size of the LNG export increase:
- Qatar: 14.7 Bcm to 103.8 Bcm, or 606 per cent higher;
- Australia: 10.8 Bcm to more than 99.4 Bcm, or 820 per cent higher;
- United States: 1.8 Bcm to 42.5 Bcm, or 2261 per cent higher;
- Malaysia: 21.7 Bcm to 35.5 Bcm, or 64 per cent higher; and
- Russia (using the latest data from 2009), up from 8.1 Bcm to 33.0 Bcm in 2019, or 307 per cent higher.
Despite the global rise of LNG exports—a significant rise in the countries noted above—Canada has yet to participate in the LNG export market.
Source: Authors’ calculations from IEA (2020b), World Energy Statistics (database).
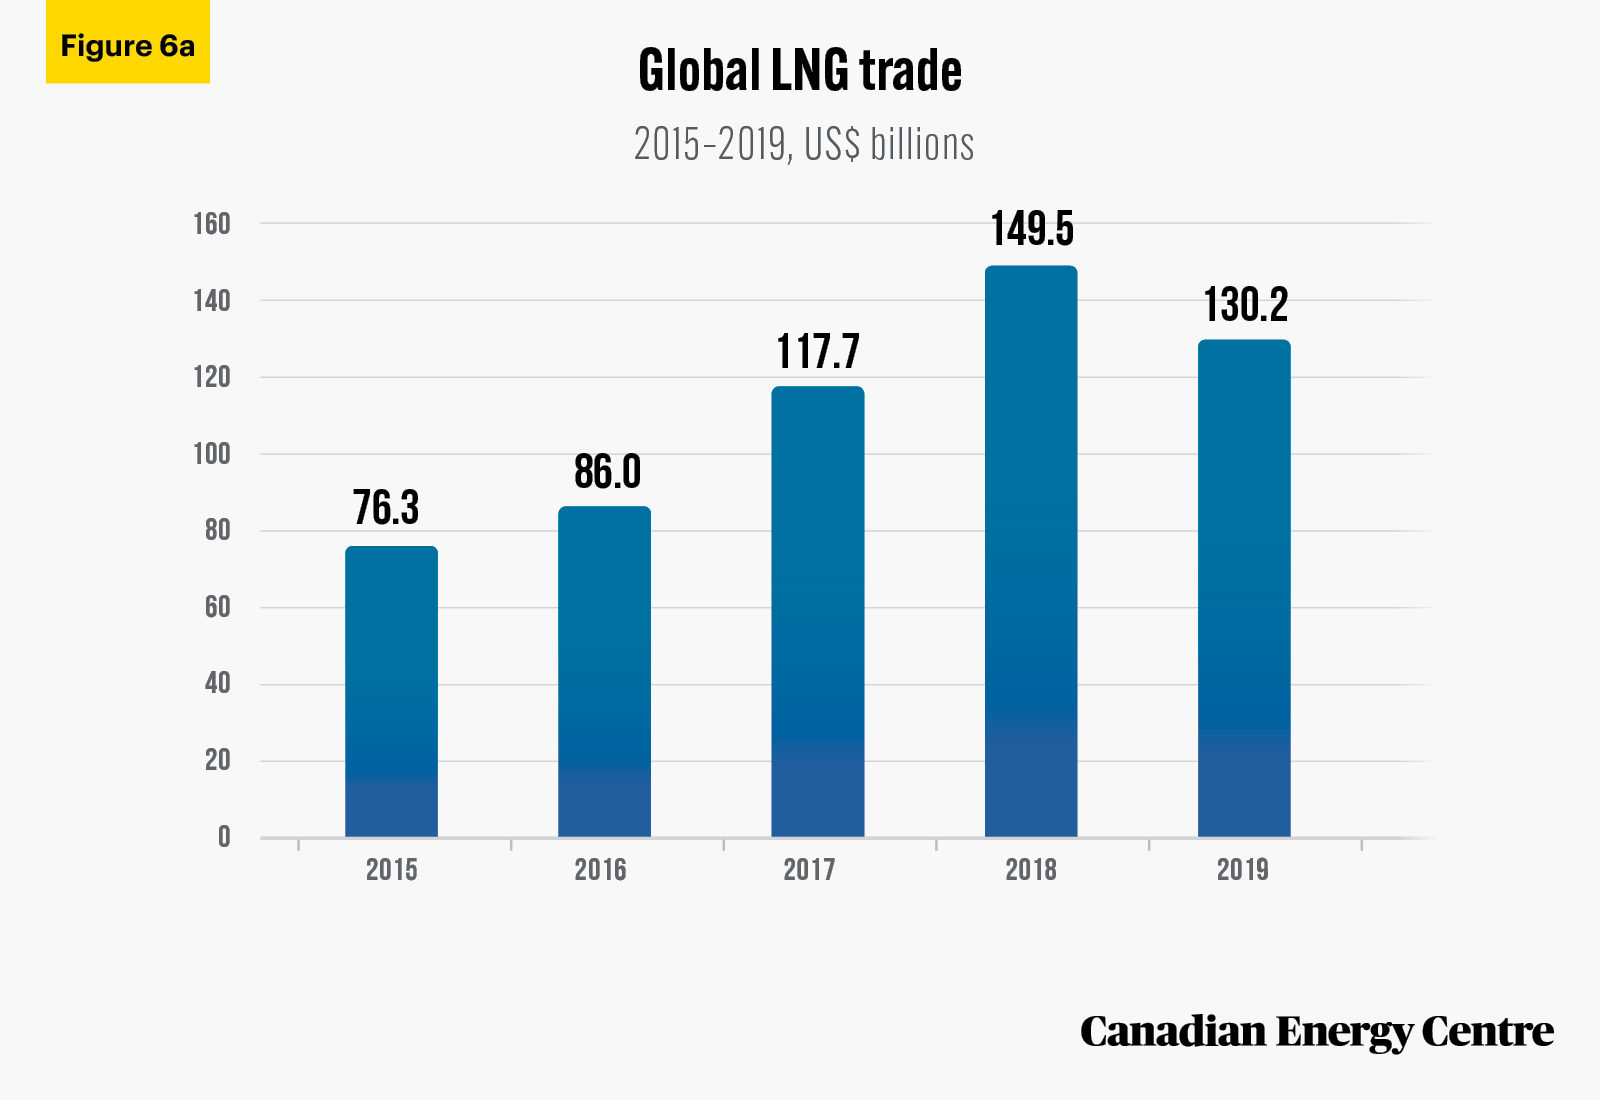
The worldwide value of LNG exports from 2015 to 2019
The earliest year for which there is data measuring the value of LNG exports worldwide is 2015. That year, total LNG exports were worth just over US$76 billion, a figure that increased to almost US$150 billion by 2018 before declining to about US$130 billion in 2019 (see Figure 6a).
Source: International Trade Centre (undated).
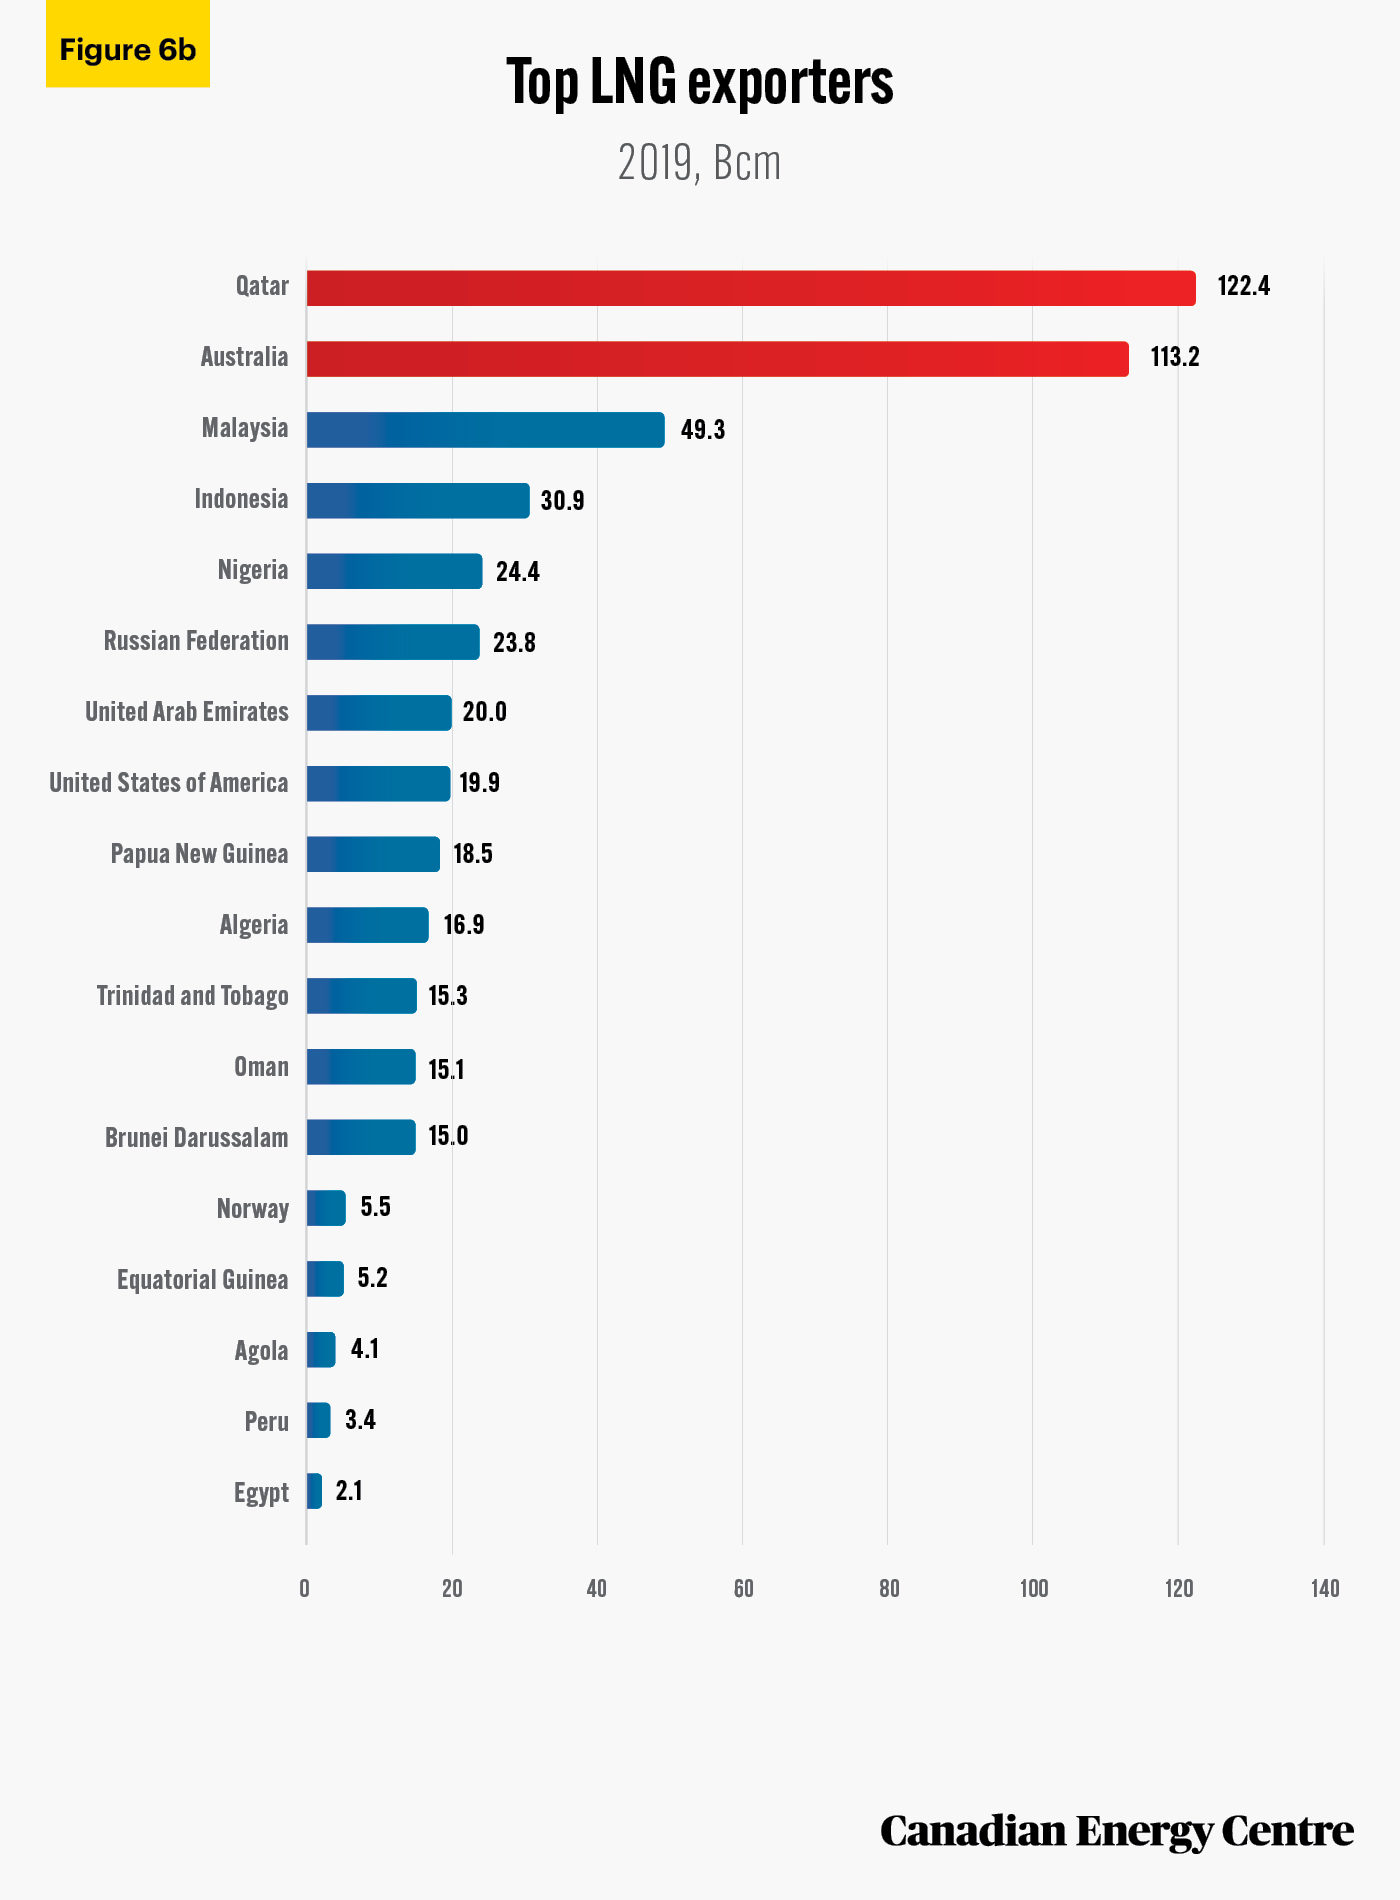
Leading LNG exporters from 2015 to 2019
Between 2015 and 2019, Qatar was the largest exporter of LNG at a total value of US$ 122.4 billion, followed closely by Australia at US$113.2 billion (see Figure 6b). In 2019 alone, Australia’s LNG exports totaled US$35 billion, an increase of US$23 billion from its total of US$12 billion LNG exports in 2015
Source: International Trade Centre (undated).
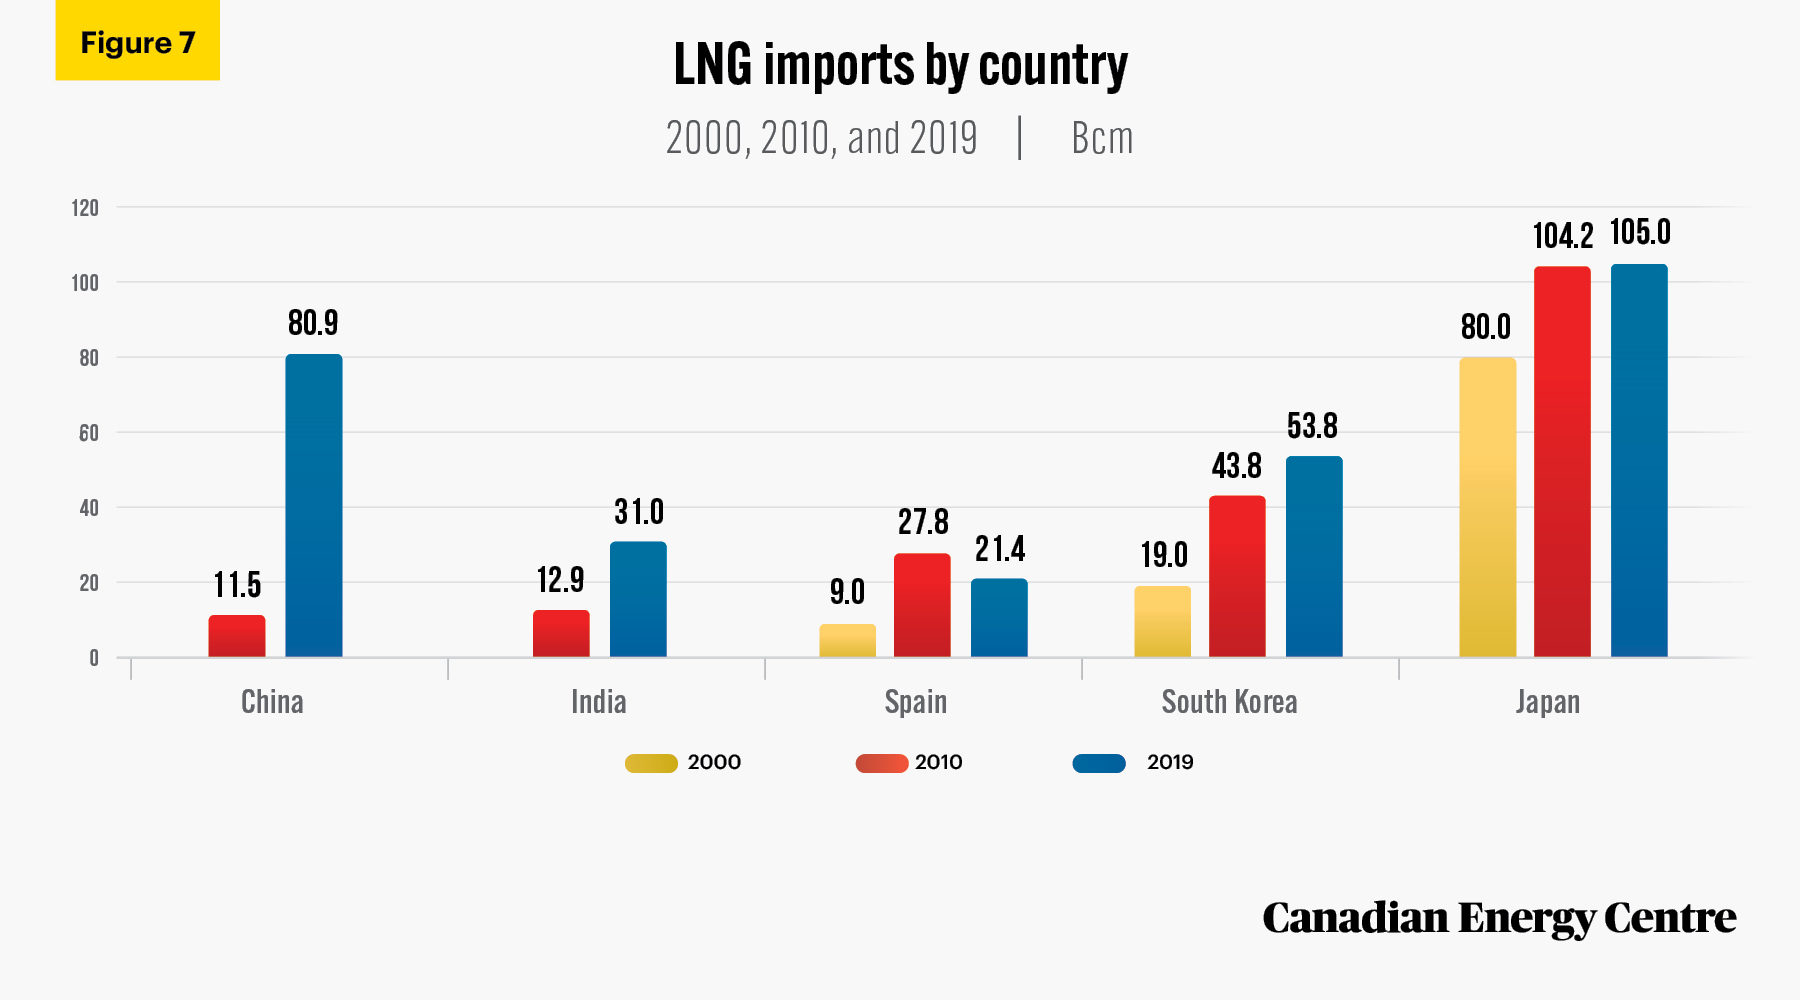
Main LNG importing nations, 2000 to 2019
Many countries increased their LNG imports between 2000 and 2019, some of them significantly (see Figure 7). They include:
- Spain, from 9.0 Bcm to 21.0 Bcm, or 137 per cent higher;
- South Korea, from 19 Bcm to almost 53.8 Bcm, or 183 per cent higher;
- Japan, from 80 Bcm to 105 Bcm, or 31 per cent higher;
- China, from 11.5 Bcm (in 2010) to 81 Bcm or 602 per cent higher; and
- India, from 12.9 Bcm (in 2010) to 31 Bcm in 2019, or 141 per cent higher.
Source: Authors’ calculations from IEA (2020b), World Energy Statistics (database).
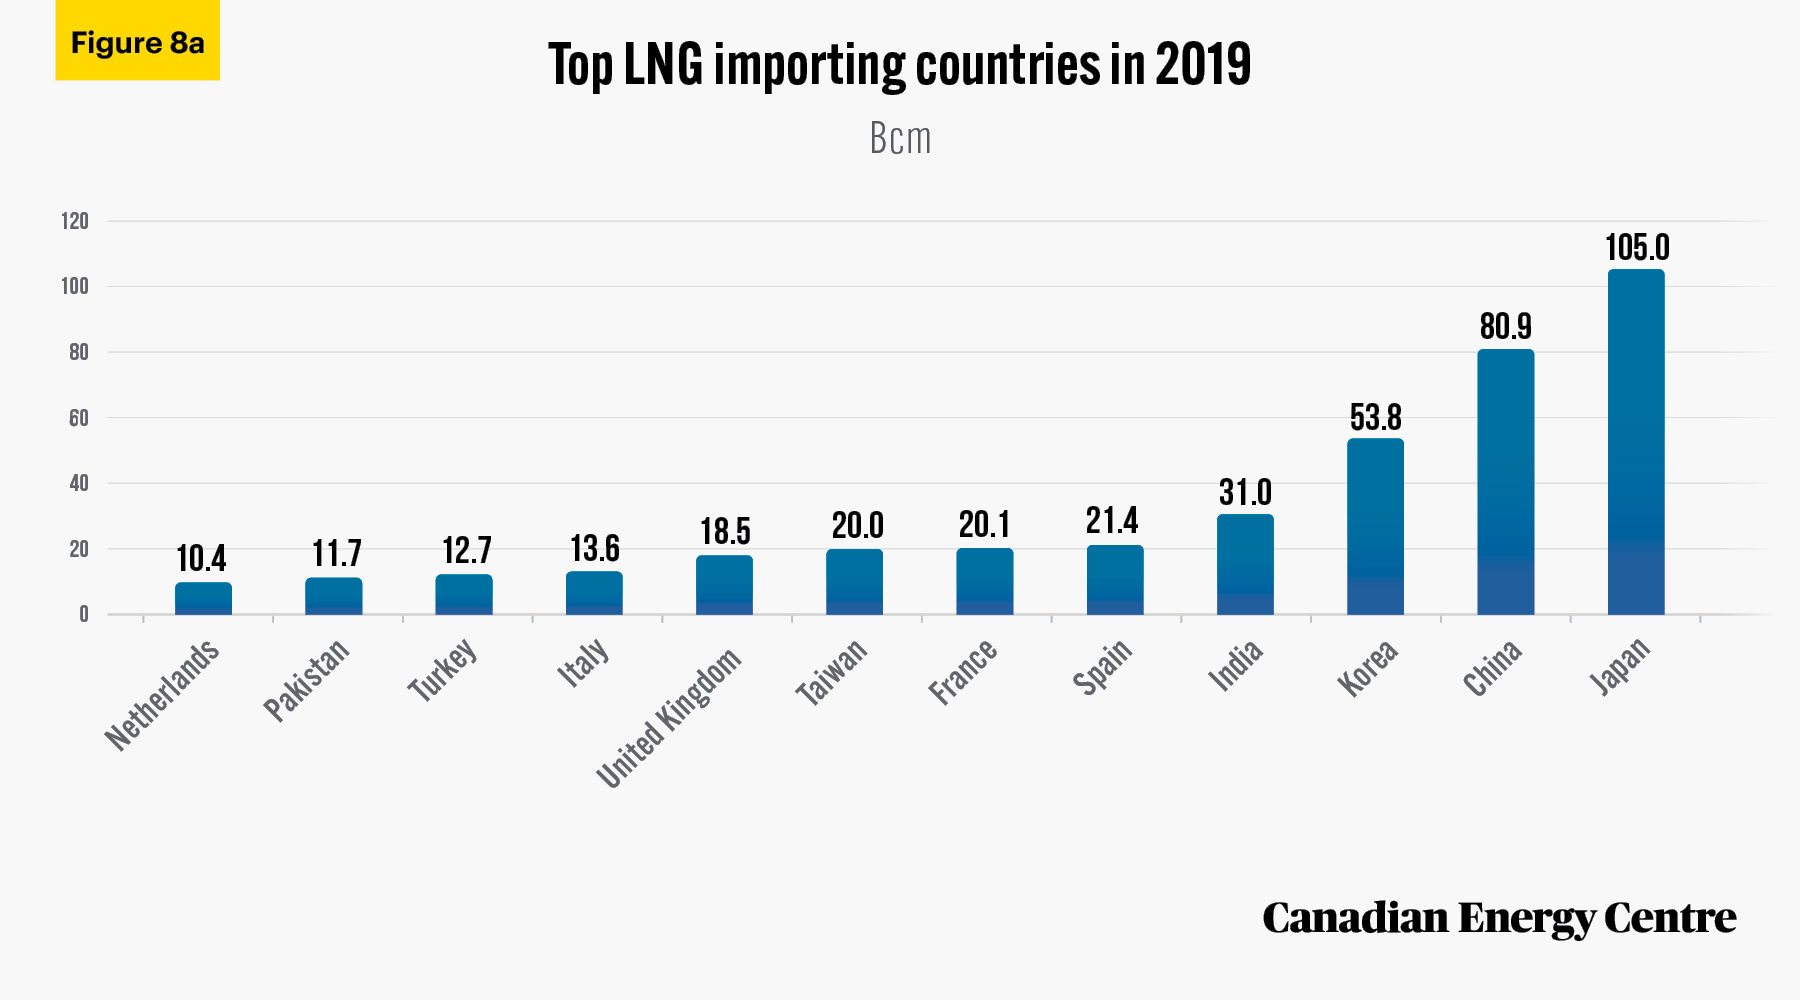
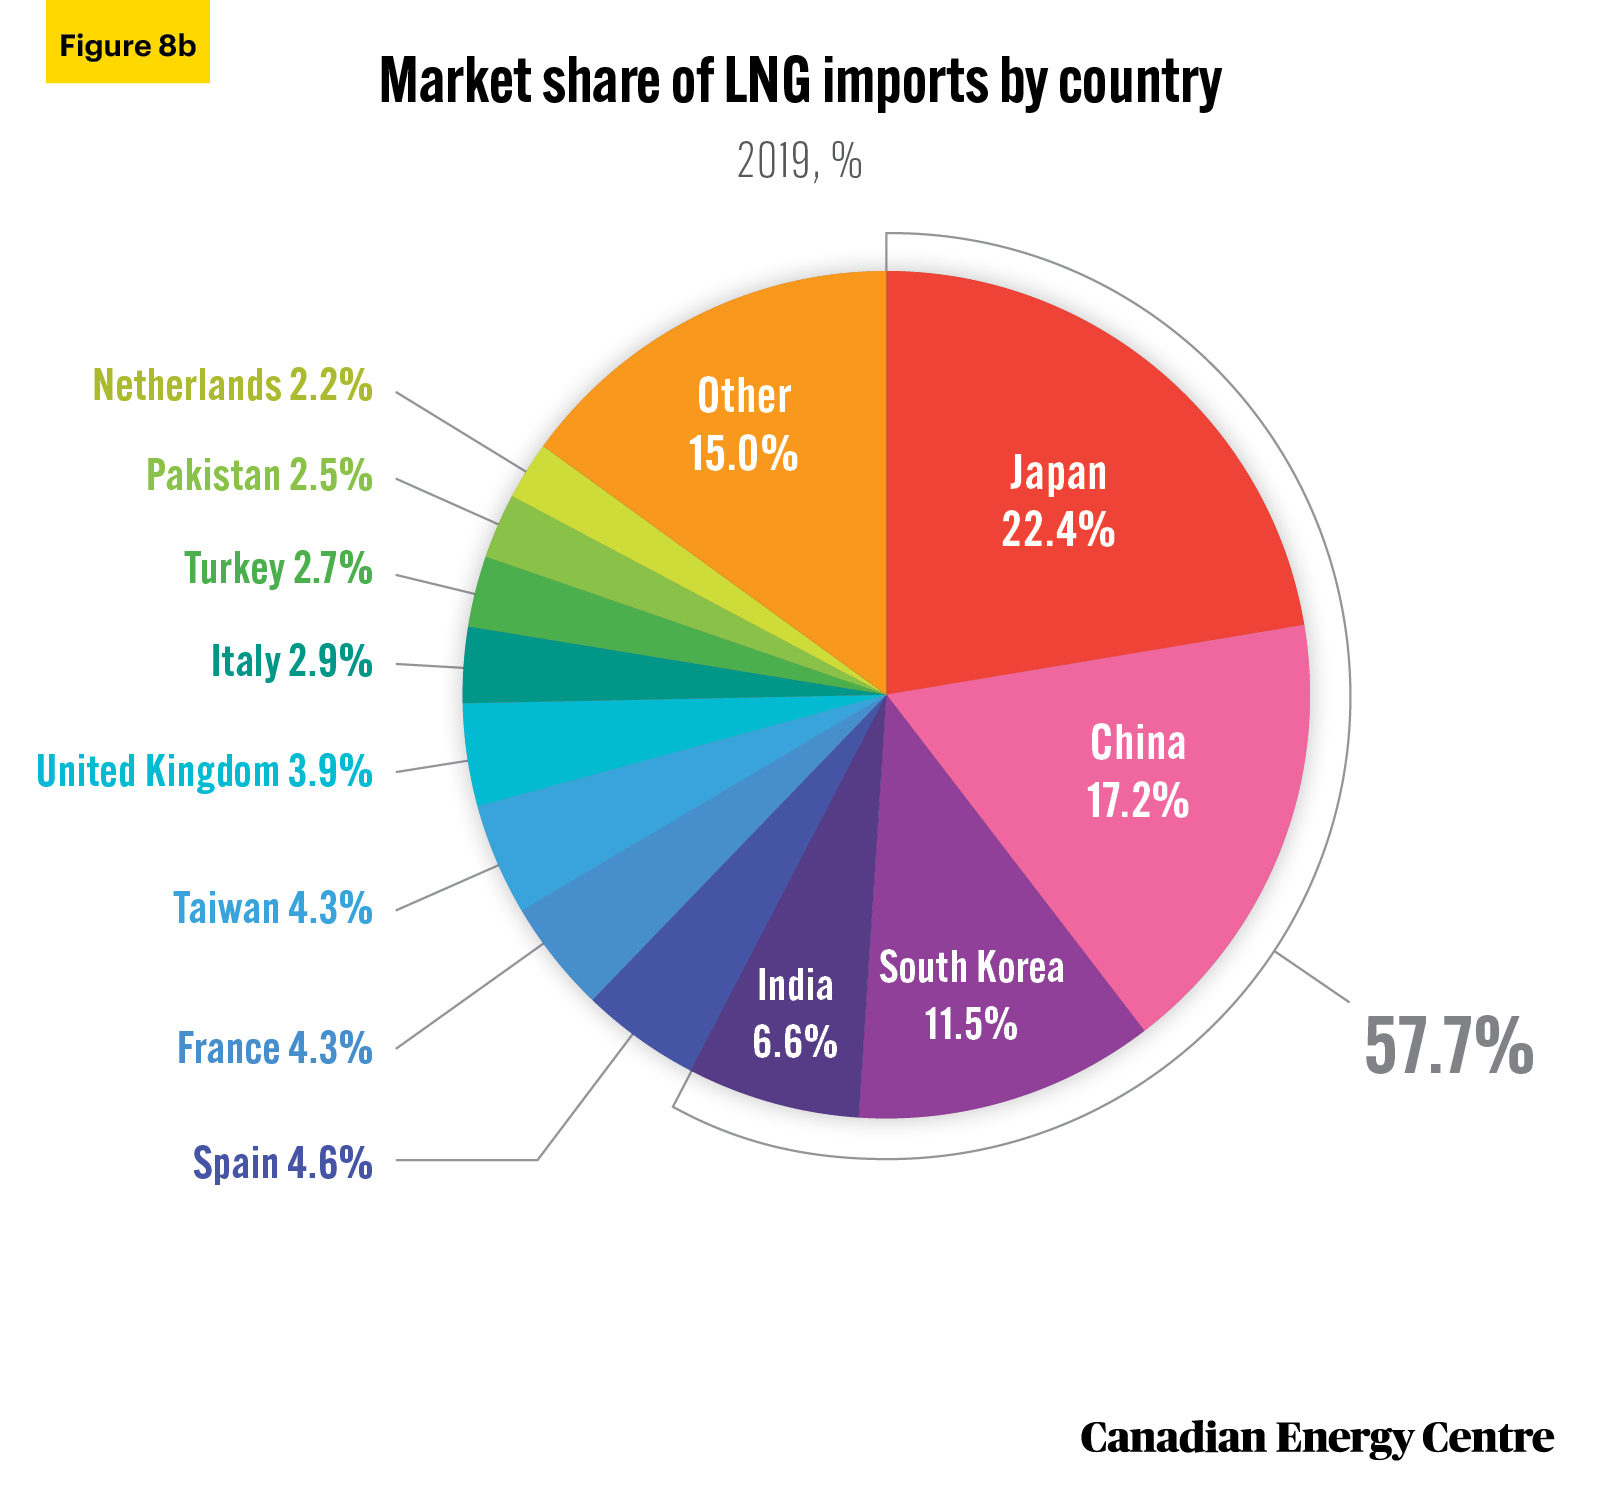
Main LNG importing nations in 2019
At 105 Bcm Japan imported the largest volume of LNG globally in 2019, a 22 per cent share of all imports of natural gas worldwide (see Figures 8a and 8b).
In that year China ranked as the second-largest LNG importer at 81 Bcm, followed by South Korea (54 Bcm), and India (31 Bcm). The four countries account for 58 per cent of global LNG imports (see Figure 8b).
Source: Authors’ calculations from IEA (2020b), World Energy Statistics (database).
Source: Authors’ calculations from IEA (2020b), World Energy Statistics (database).
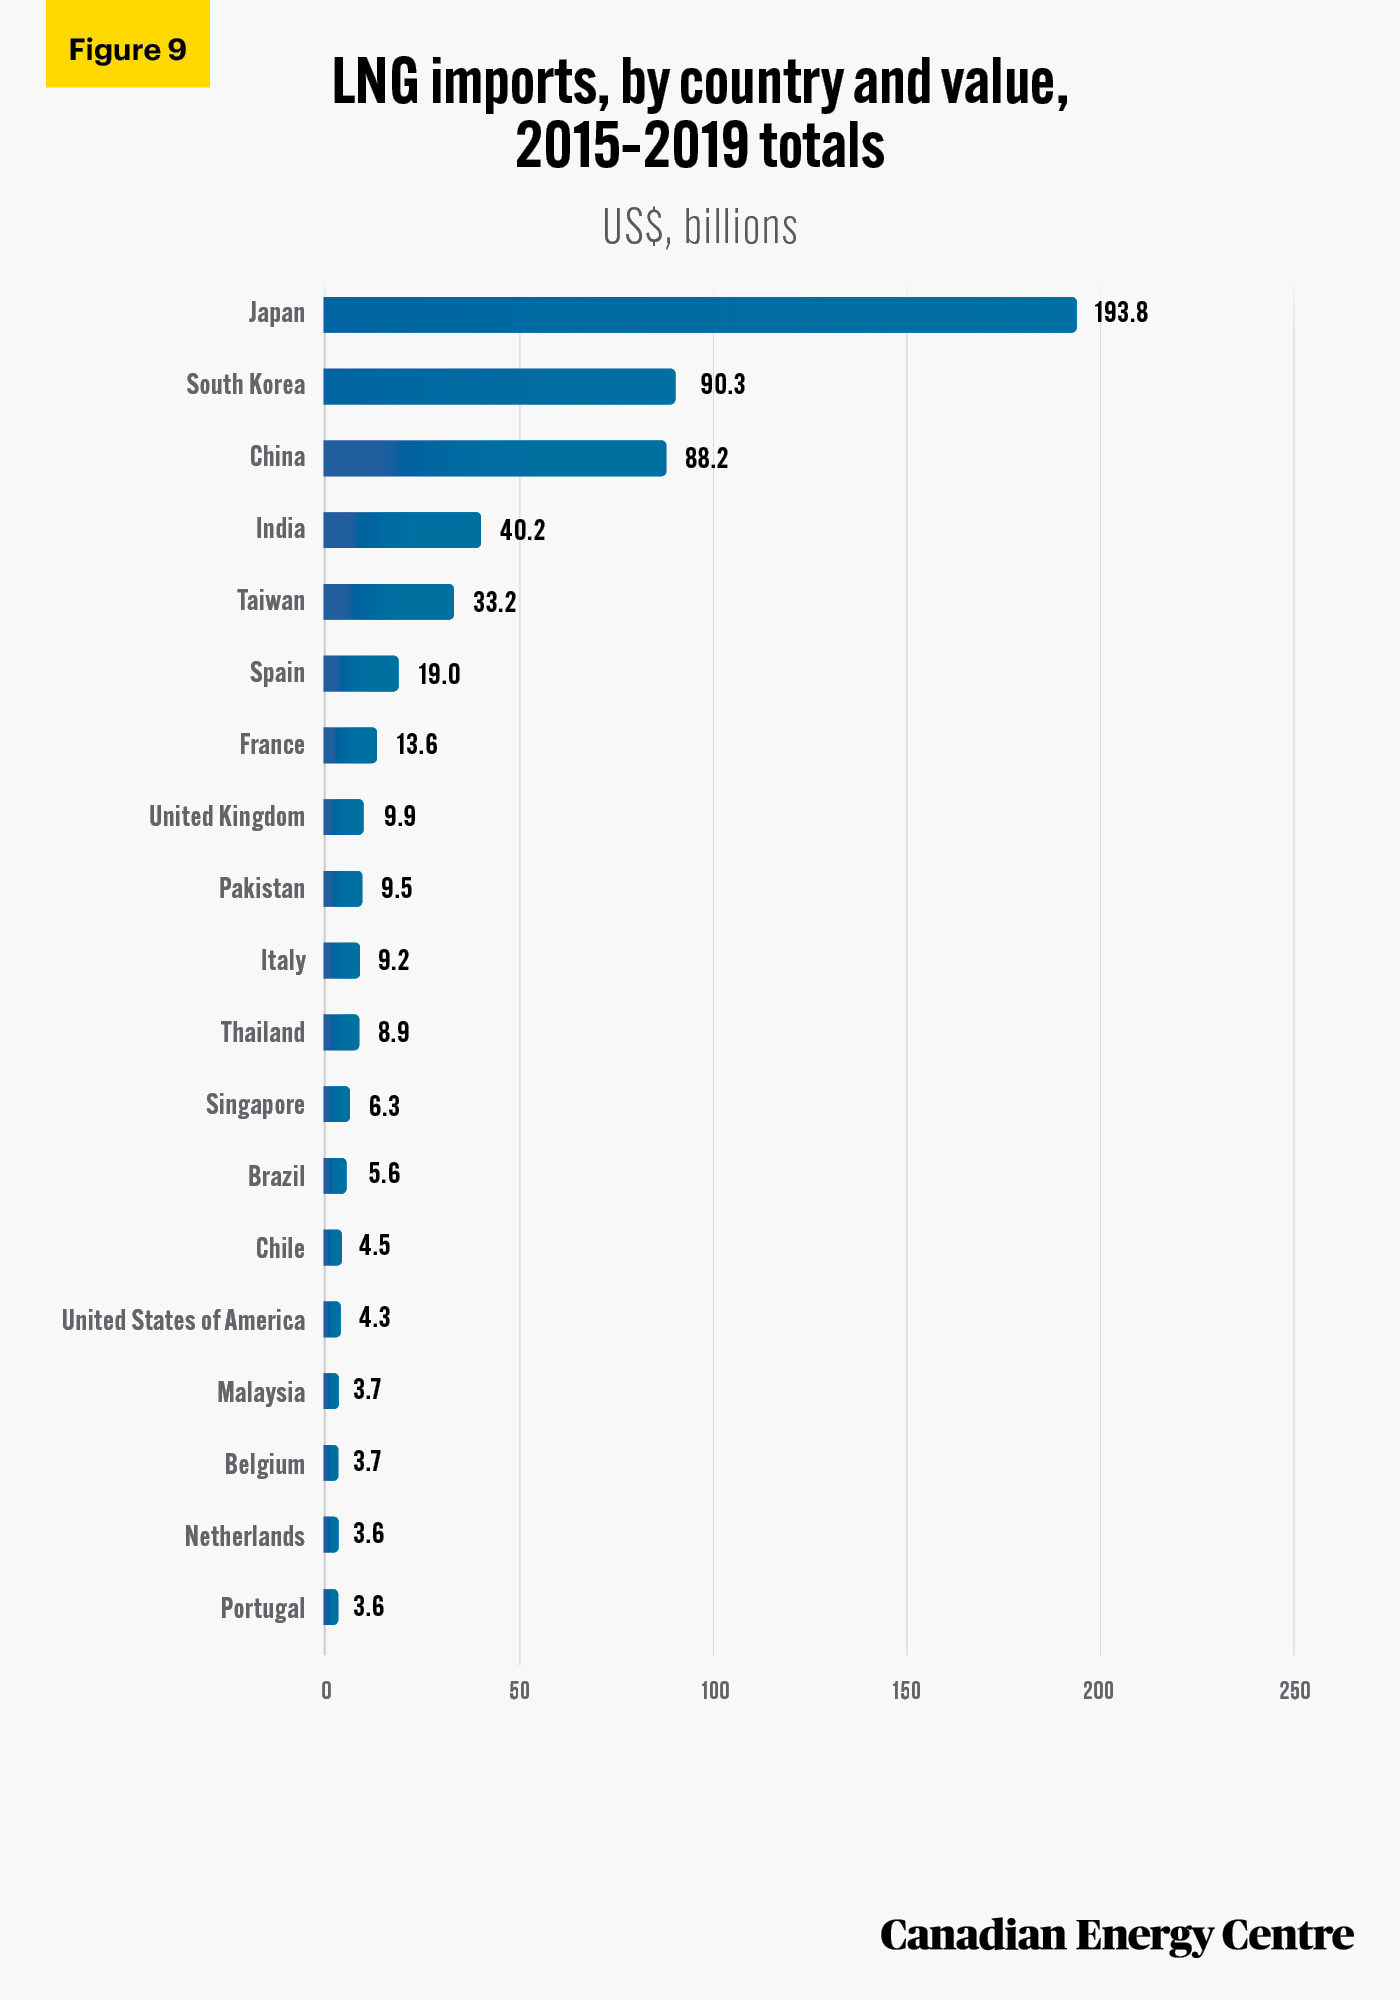
Top LNG importers by country from 2015 to 2019
Between 2015 and 2019, Japan imported nearly US$194 billion worth of LNG, followed by South Korea at over US$90 billion, and China at over US$88 billion. India and Taiwan round out the top five at US$40.2 billion and US$33.2 billion respectively
Source: International Trade Centre (undated).
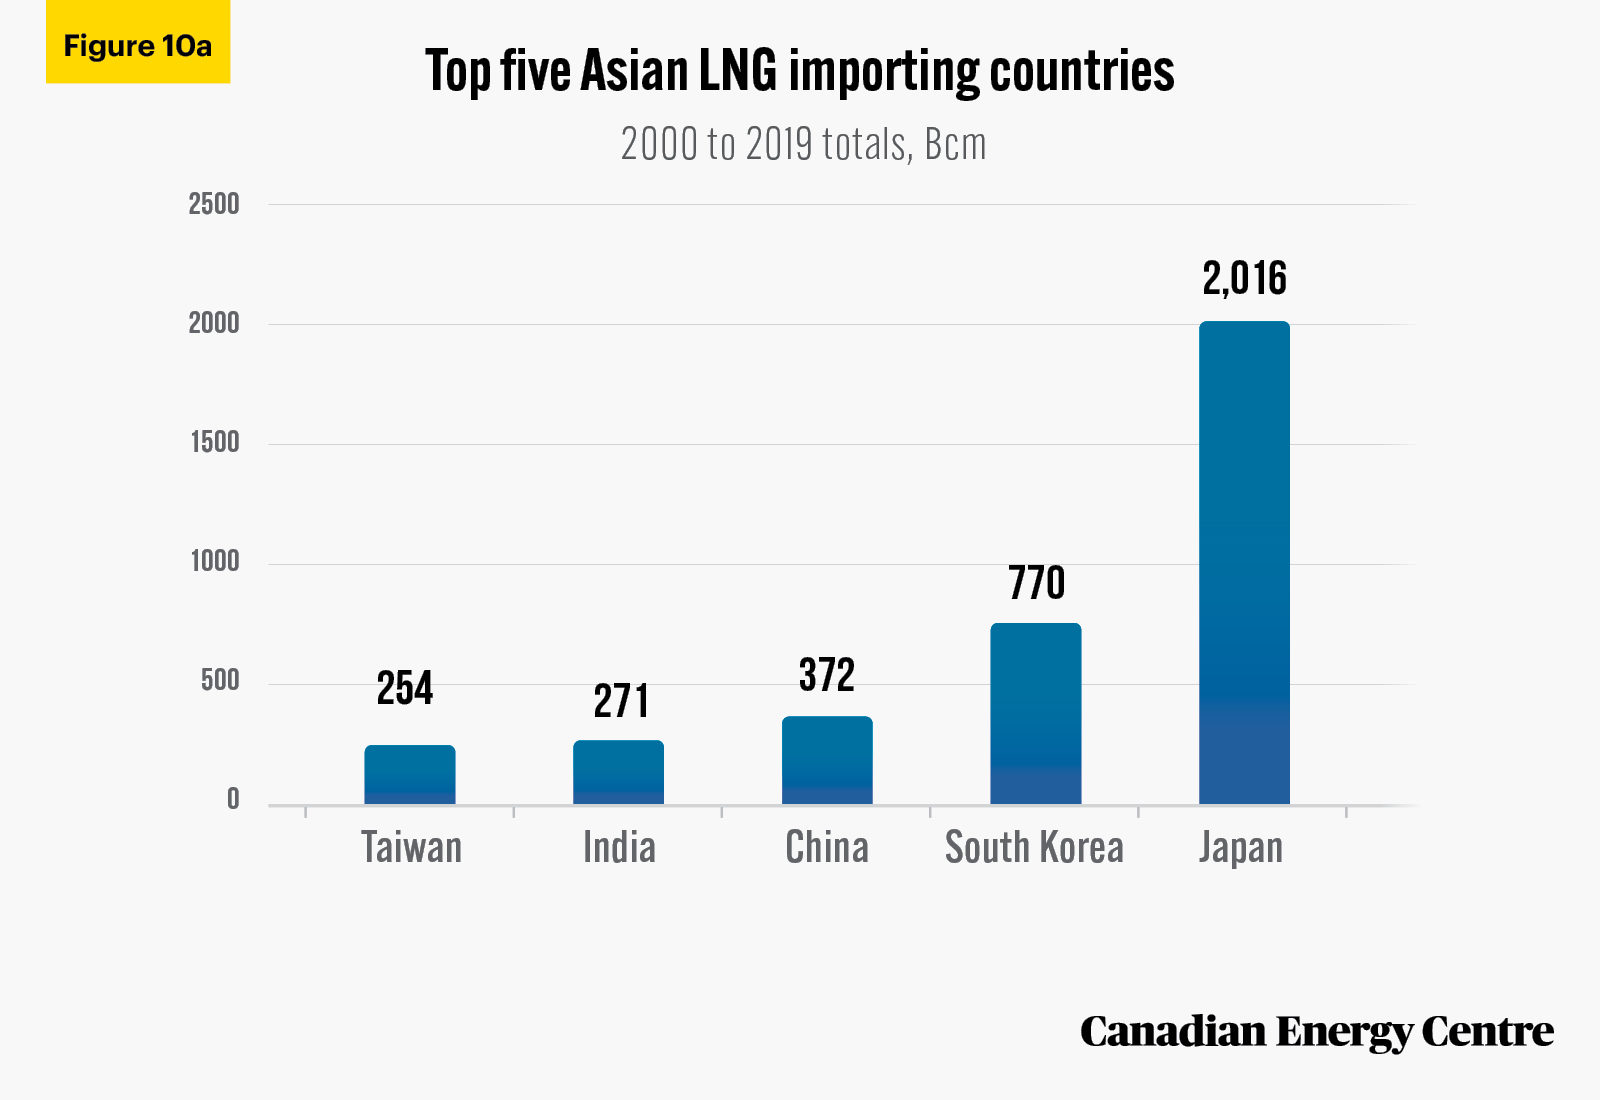
LNG imports into selected Asian markets over two decades
The year 2019 was not an outlier. These countries have been consistently high LNG importers since 2000. The cumulative totals from 2000 to 2019 and measured in billions of cubic meters show that the top five countries noted above by value are, by volume, Taiwan, India, China, South Korea, and Japan. The volume of LNG imports into the five countries ranged from 254 Bcm to Taiwan to 2,016 Bcm to Japan (see Figure 10a).
Source: Authors’ calculations from IEA (2020b), World Energy Statistics (database).
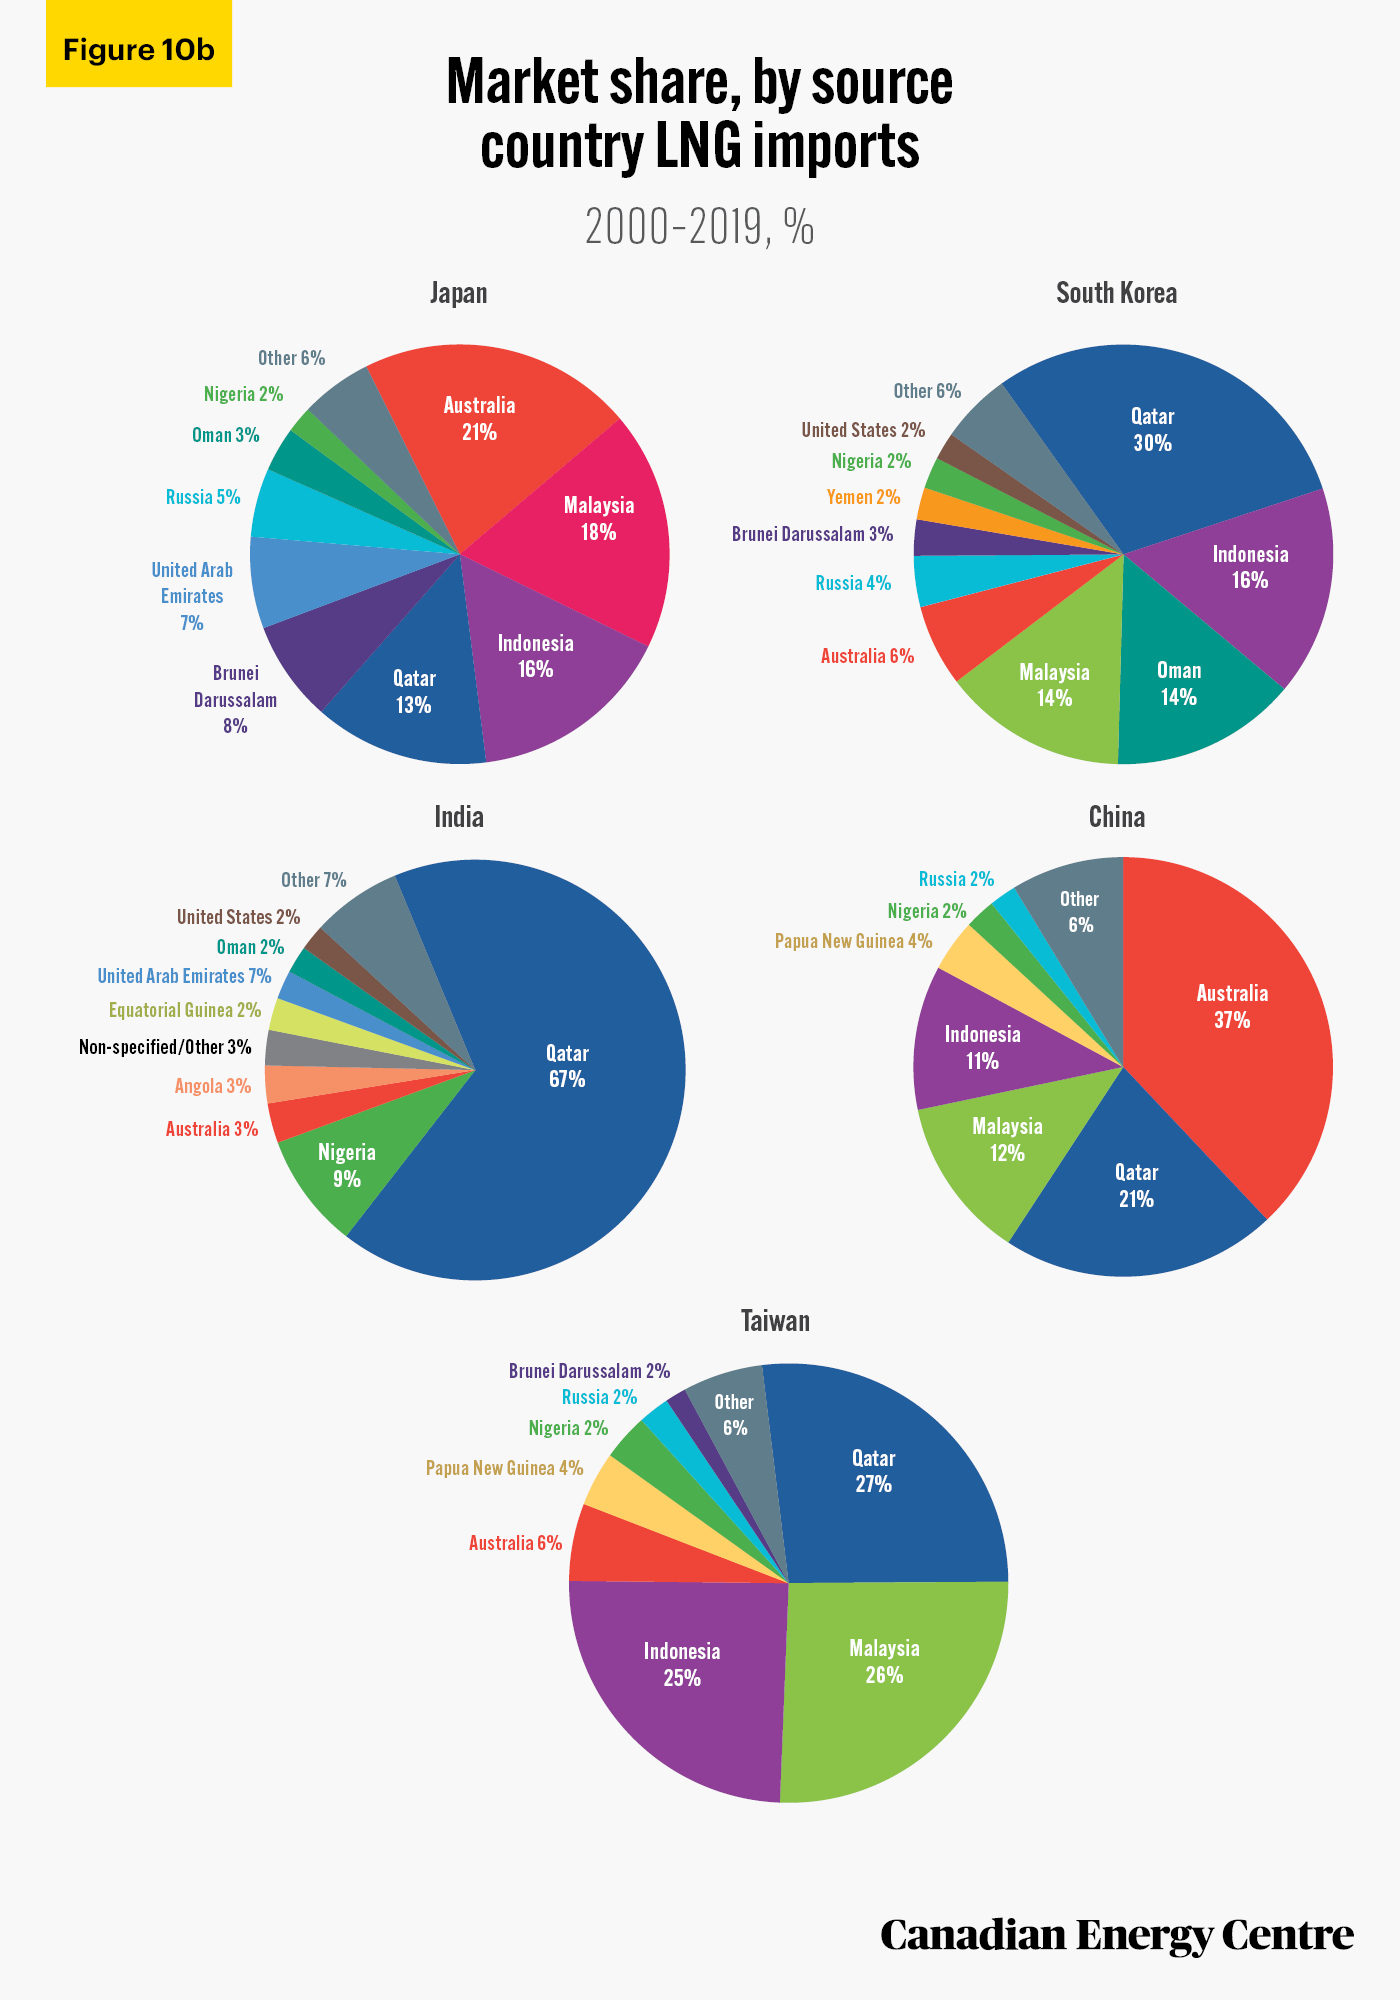
Top five Asian LNG importing countries: imports by source countries
Australia, Malaysia, and Qatar are the top source countries for liquefied natural gas imports to the top five importing nations or territories in Asia (see Figure 10b), though Indonesia, Oman, and Nigeria are also significant suppliers. The top three LNG source countries for each importing jurisdiction over the whole 19-year period, are:
- Japan: Australia (21 per cent), Malaysia (18 per cent), and Indonesia (16 per cent);
- South Korea: Qatar (30 per cent), Indonesia (16 per cent), Malaysia and Oman tied at (14 per cent each);
- India: Qatar (67 per cent), Nigeria (9 per cent), and Australia and Angola tied at (3 per cent each);
- China: Australia (37 per cent), Qatar (21 per cent), and Malaysia (12 per cent); and
- Taiwan: Qatar (27 per cent), Malaysia (26 per cent), and Indonesia (25 per cent).
Source: Authors’ calculations from IEA (2020b), World Energy Statistics (database).
Growth in LNG terminals (liquefication and regasification)
As of 2019, 18 countries exported LNG and 27 countries imported it (International Gas Union, 2020). To be competitive in the LNG export market requires a significant investment of capital and time. That is partly because, on average, it takes more than 10 years to complete an LNG terminal from start of the planning stage to the day that exports begin leaving the terminal (PWC, 2014). Below are some details on liquefaction and regasification terminals around the world.
Liquefaction terminals
Countries that export natural gas by sea require a liquefaction terminal, which liquefies the gas to make it suitable to transport. There are more than 80 liquefaction plants in the world. At 16 facilities, Australia has the greatest number of operational LNG export terminals. Australia is followed by Qatar at 12 LNG terminals, and the United States with seven (International Gas Union, 2020).
Total liquefaction capacity worldwide was 431 million tonnes per annum (MTPA)4 in 2019. Australia had the most liquefaction capacity at nearly 88 MTPA, followed by Qatar (77 MTPA), and the United States (38 MTPA) (International Gas Union, 2020).
In recent years, the United States has increased its liquefaction capacity to 38 MTPA, and it now accounts for nine per cent of the global liquefaction capacity. In the next few years, 124 MTPA liquefaction capacity will be added worldwide, and by 2024 Canada will have its first LNG terminal with a 14 MTPA capacity (International Gas Union, 2020).
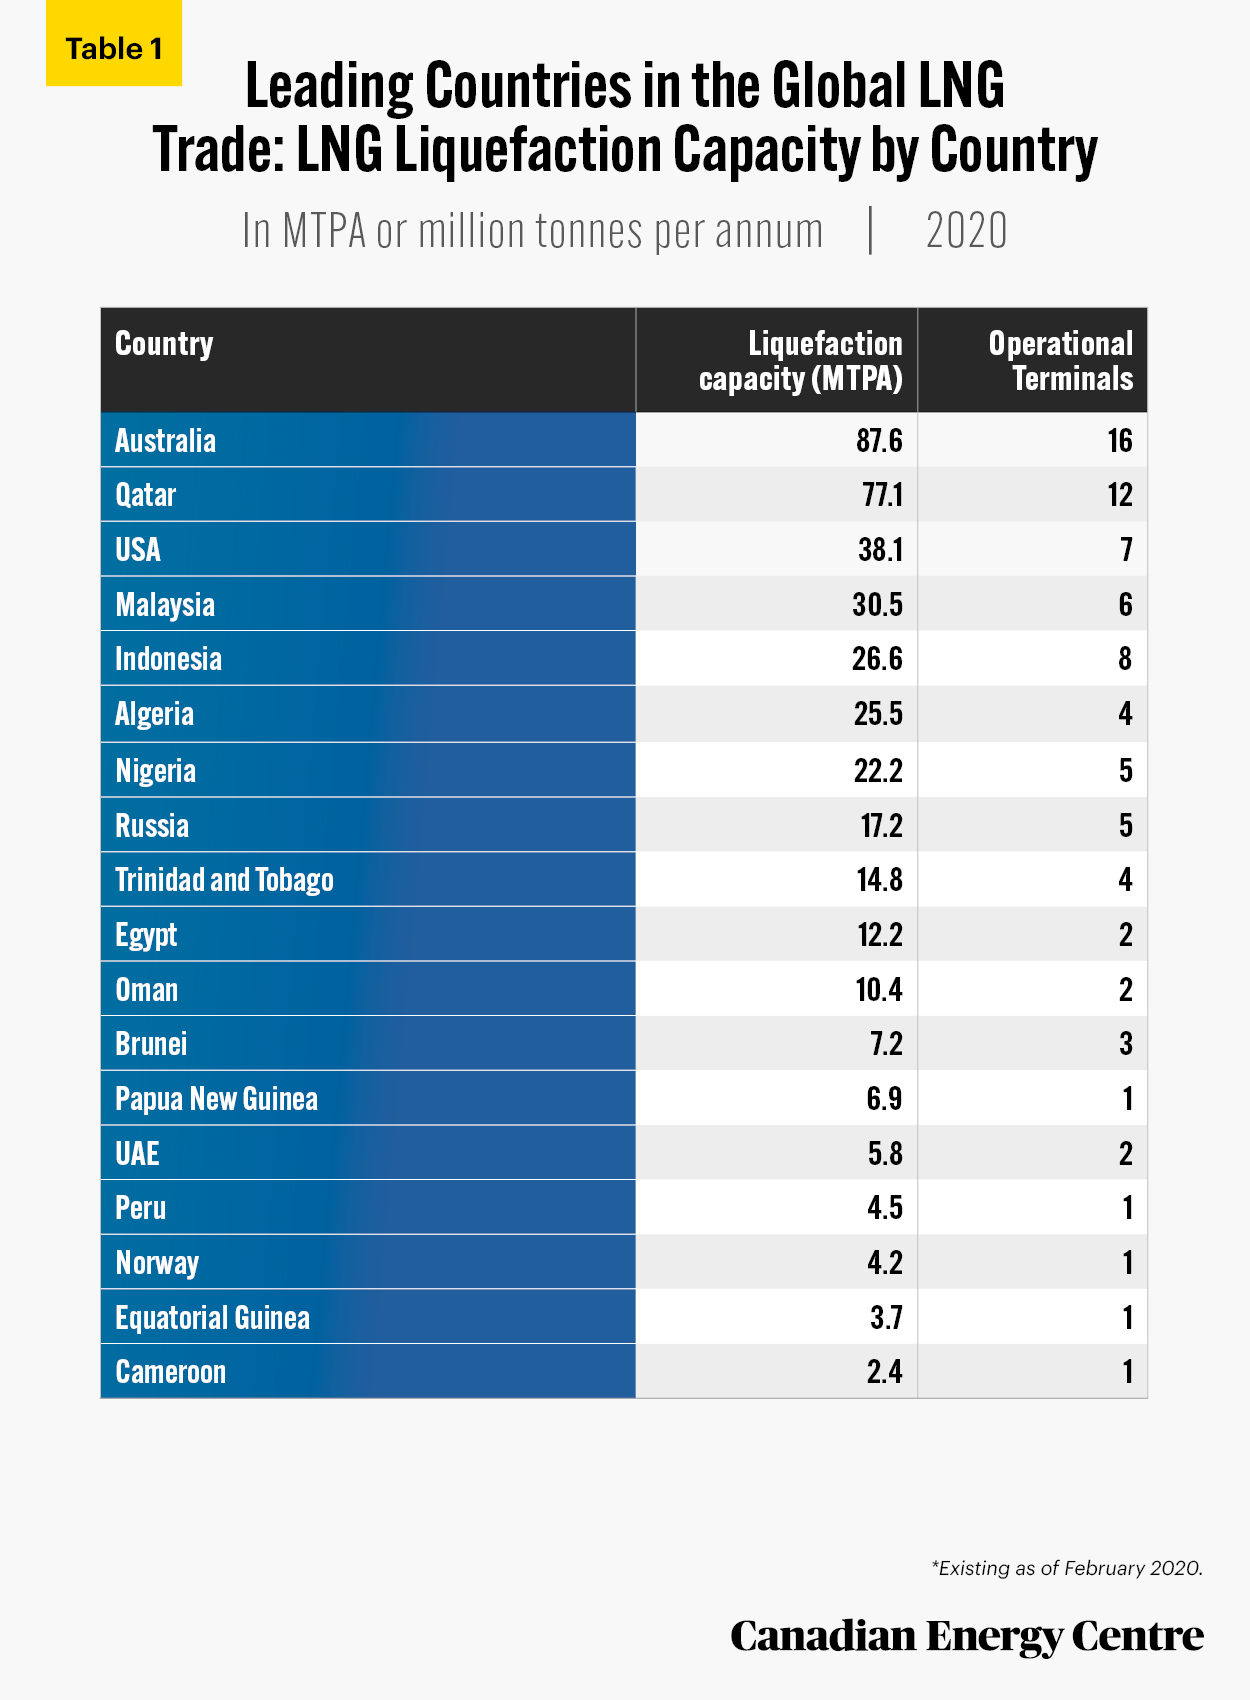
Source: International Gas Union (2020). Source: International Gas Union (2020).
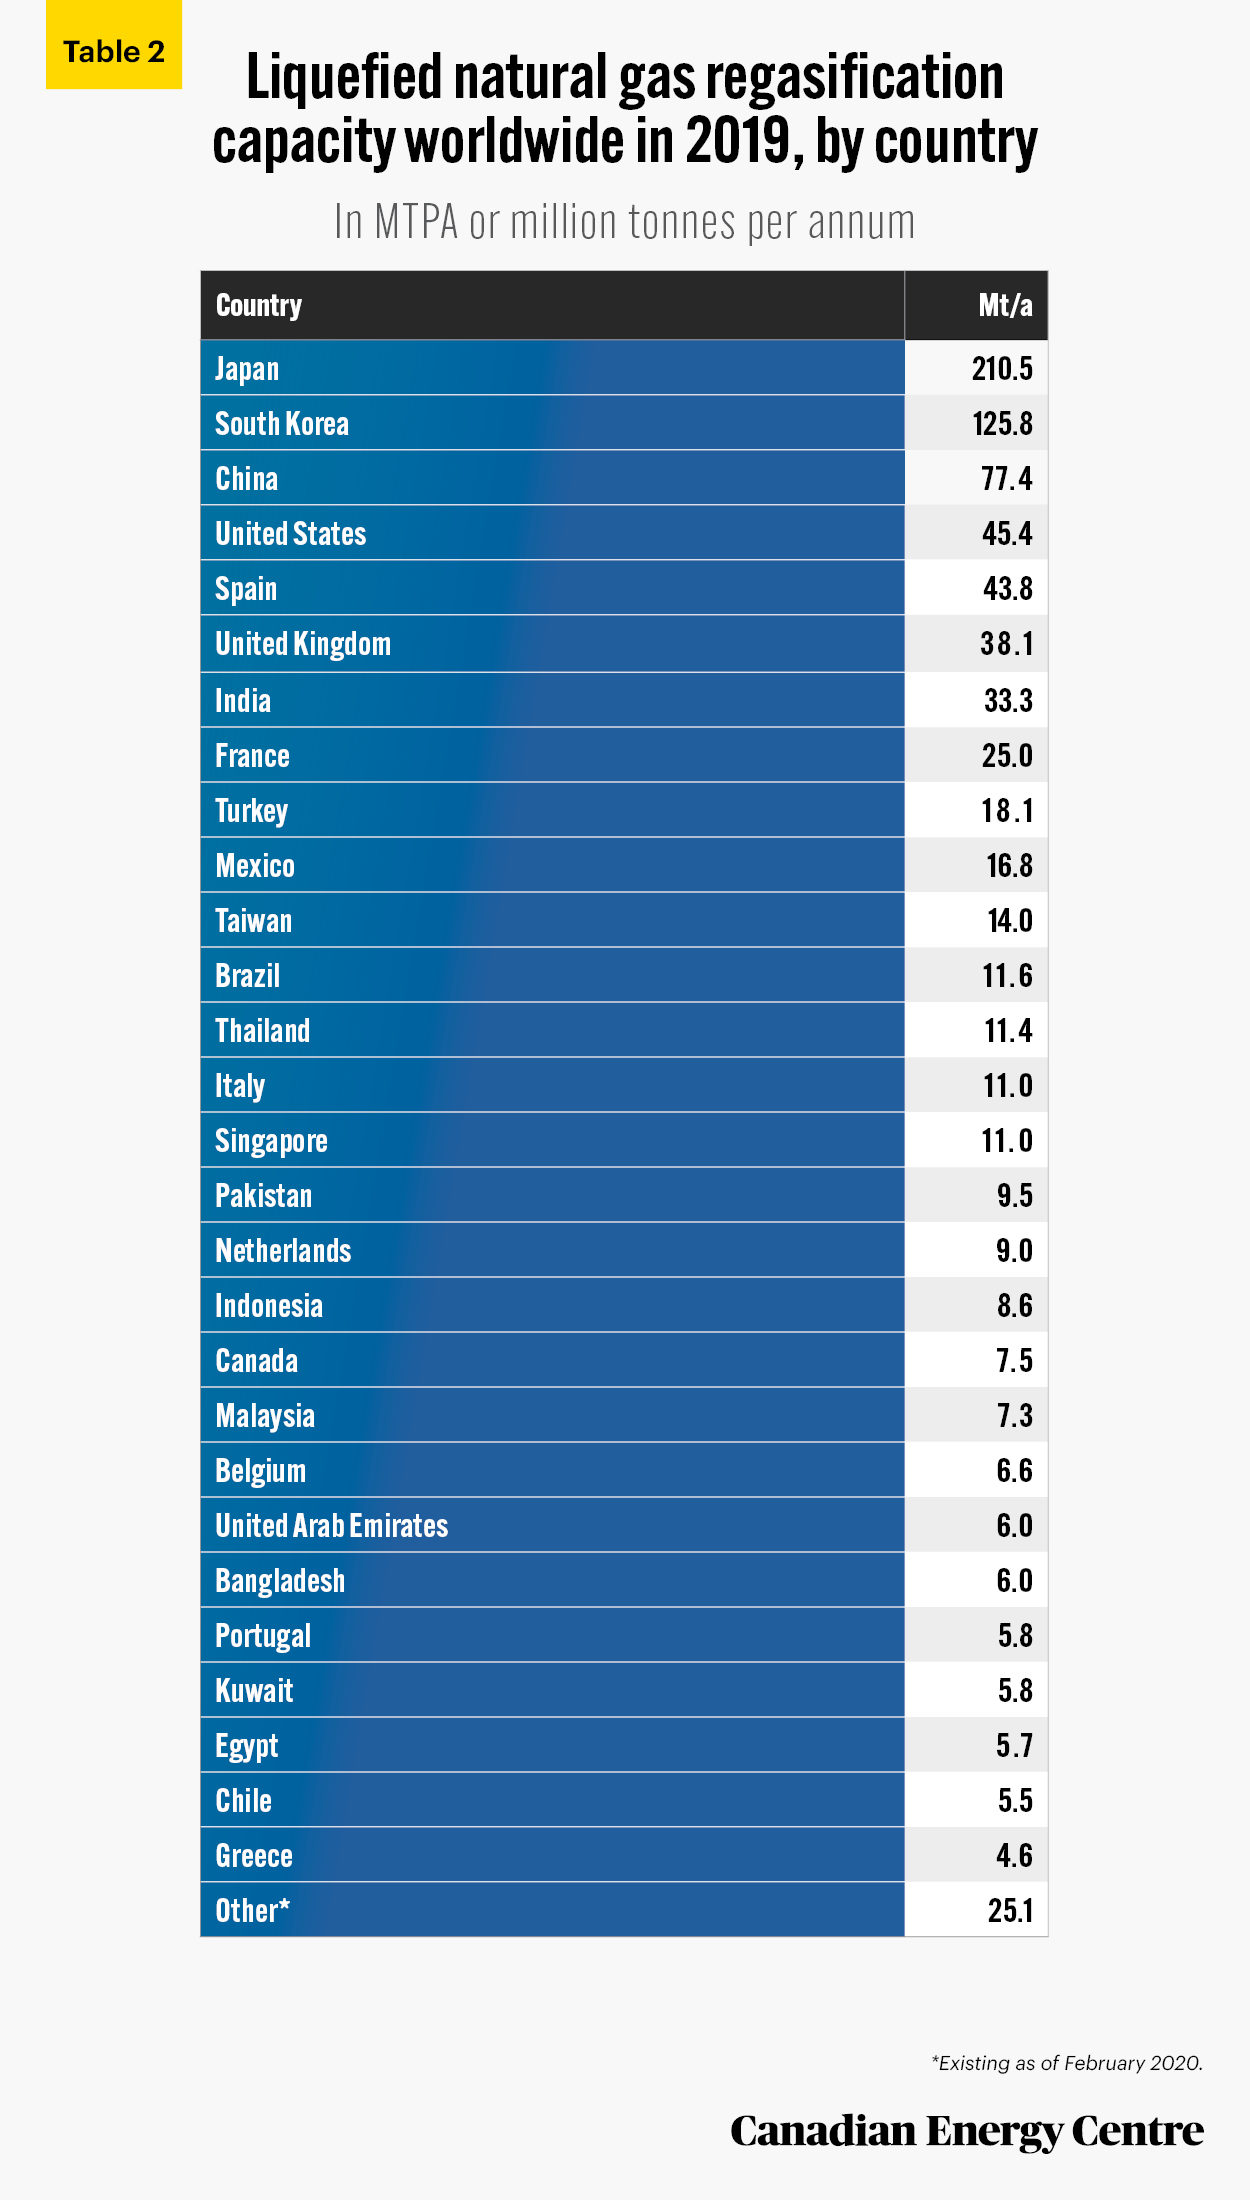
Regasification terminals
Countries importing LNG require regasification terminals to convert the liquefied LNG back to natural gas. Global LNG regasification capacity reached 821 MTPA as of 2020 and is expected to continue to grow as liquefaction capacity is added to meet growing demand (International Gas Union, 2020).
In 2019, growth in regasification was driven primarily by newly built terminals in existing LNG import markets, including China and India. Japan had the world’s largest liquefied natural gas (LNG) regasification capacity in 2019, at 210.5 MTPA. In that same year, South Korea and China had the second and third largest LNG regasification capacity, at 125.8 MTPA and 77 MTPA annually. Regasification capacities of liquefied natural gas (LNG) terminals worldwide are expected to reach 921 MTPA by 2025. Of these, 14 MTPA in China and 19 MTPA in India will be added in the coming years (International Gas Union, 2020).
Source: International Gas Union (2020).
Conclusion
The international annual LNG export trade was valued at US$130 billion in 2019. Canada is not yet involved in the global LNG export trade and does not share in any of that market.
However, Canadian LNG projects that are under construction and proposed have several advantages over those existing in other countries. One clear advantage is the shorter distance between British Columbia’s coast and many of the Asian markets than is the case with US Gulf Coast facilities. For example, the distance between the US Gulf Coast and to the Japanese ports of Himeji or Sodegaura is more than 9,000 nautical miles, compared to less than 4,200 nautical miles between those two Japanese ports and the coast of British Columbia (Steuer, 2019, pp.33-35).
Various studies have estimated the potential contribution that LNG exports could make to the Canadian economy. One of those reports, a 2016 Conference Board study, estimated that an LNG export industry equivalent to 30 MTPA in British Columbia could add roughly $CA7.4 billion annually to Canada’s economy over the next 30 years and raise national employment by 65,000 jobs annually.
Canada has missed out on the LNG boom of the last decade, but the future demand for LNG in Asia and elsewhere still offers a tremendous opportunity for Canadian natural gas exporters.
References
BP (undated). Approximate Conversion Factors—Statistical Review of World Energy. <https://on.bp.com/33XXbr2>.
Conference Board of Canada (2016). BC’S Future Liquefied Natural Gas Industry Could Fuel Economic and Job Growth in the Provinces and Canada for Decades. News Release. <https://bit.ly/3nkuHza>.
Bishop, Grant, and Grant Sprague (2019). A Crisis of Our Own Making: Prospects for Major Natural Resource Projects in Canada. Commentary 534. CD Howe Institute. <https://bit.ly/3q6jioM>.
IEA (2020a). Gas 2020. <https://bit.ly/35oEe1O>.
IEA (2020b). IEA World Energy Statistics (database). <https://bit.ly/34nYWOF>.
International Gas Union (2020). 2020: World LNG Report. <https://bit.ly/2UmSnq2>.
International Trade Centre (undated). Trade Map. <https://bit.ly/38gM0gg>.
McConaghy, Dennis, and Ron Wallace (2019). Salvaging Canadian LNG Potential. Canadian Global Affairs Institute. <https://bit.ly/2Va6sY4>.
Milke, Mark, and Lennie Kaplan (2020). Missing Out: Natural Gas and Canada’s Exports: A Worldwide Snapshot, 2000 to 2017. Research Brief Two. Canadian Energy Center. <https://bit.ly/39jvexi>.
Moore, Michal, David Hackett, Leigh Noda, Jennifer Winter, Roman Karski, and Mark Pilcher (2014). Risky Business: The Issue of Timing, Entry, and Performance in the Asia-Pacific LNG Market. Research Paper 7, 18. School of Public Policy. <https://bit.ly/3mbUhpP>.
Morgan, Geoffrey (2020, March 5). Warren Buffett’s Exit from $9-billion Quebec LNG Project after Rail Blockades ‘A Signal’ to Investors. Financial Post. <https://bit.ly/2IzDj5Y>.
Natural Resources Canada (2020). Canadian LNG Projects. <https://bit.ly/369EaU9>.
PricewaterhouseCoopers [PWC] (2014). Canadian LNG Projects: The Progression of an LNG Project. <https://pwc.to/2I7MqL0>.
Steuer, Claudio (2019). Outlook for Competitive Energy Supply. OEIS Paper NG 142. Oxford Institute of Energy Studies. <https://bit.ly/3gGVl38>
CEC Research Briefs
Canadian Energy Centre (CEC) Research Briefs are contextual explanations of data as they relate to Canadian energy. They are statistical analyses released periodically to provide context on energy issues for investors, policymakers, and the public. The source of profiled data depends on the specific issue.
About the authors
This CEC Research Brief was compiled by Ven Venkatachalam, Senior Research Analyst, and Mark Milke, Executive Director of Research, Canadian Energy Centre.
Acknowledgments
The authors and the Canadian Energy Centre would like to thank and acknowledge the assistance of Dennis Sundgaard for his review of this paper.
Creative Commons Copyright
Research and data from the Canadian Energy Centre (CEC) is available for public usage under creative commons copyright terms with attribution to the Canadian Energy Centre. Attribution and specific restrictions on usage including non-commercial use only and no changes to material should follow guidelines enunciated by Creative Commons here: Attribution-NonCommercial-NoDerivs CC BY-NC-ND.
Photo Credits
Seoul, Korea by Tingyaoh from Pixabay.com, Boat in Body of Water by Pixabay on Pexels.com, Qatar by Proriat Hospitality on Unsplash.com, Jaipur, India by Sagar Soneji from Pexels.com, Blossoms in Japan by Evgeny Tchebotarev on Pexels.com, Sunset at terminal by Cocoparisienne from Pixabay.com
The unaltered reproduction of this content is free of charge with attribution to Canadian Energy Centre Ltd.
Share This:


