


 CDN NEWS |
  US NEWS


There are two places that define British Columbia’s natural gas future, and they could hardly be more different from each other.
The first is a stretch of northeast B.C. that most people in this province couldn’t place on a map without help. It sits beneath the Peace River country, straddling the Alberta border, and for most of recorded history it was simply farmland, boreal forest, and cold. The Montney formation doesn’t announce itself. There are no visible signs of what lies beneath. You drive through it, if you ever do, without any particular sense that you are passing over one of the largest natural gas resources in North America.
The second is Kitimat, a town on the Douglas Channel that most British Columbians know only as the endpoint of arguments. For years — decades, really — Kitimat existed in public conversation almost entirely as a destination: the place where the pipelines were trying to go, the location of the terminal, the spot on the map that opponents circled in red. A coastal story, a shipping story, a tankers-on-the-water story.
Here is what connects them, and here is why it matters. Kitimat is not where B.C.’s LNG story begins. It is where the story ends. Or more precisely: it is where the story becomes visible to people who haven’t been paying attention to everything that came before it. The gas doesn’t originate at the shoreline. It originates hundreds of kilometres away, underground, in a formation that has been quietly accumulating drilling inventory and producer investment for years. It moves through processing plants and gathering systems and transmission pipelines before it ever sees the coast. The liquefaction terminal is the final act of a very long play.
This may seem like a technical distinction. It is not. It is, in fact, the distinction that explains almost everything that has gone wrong with how Canada has approached this opportunity.
Politicians and commentators have spent years debating LNG as though it were a coastal controversy — a question of tankers and shorelines and indigenous rights on the water. Those are real questions, and some of them have been genuinely hard to answer. But they have consistently crowded out a prior question: whether Canada would build the inland industrial system that makes coastal export possible in the first place. The upstream producers, the midstream processors, the pipeline operators, the fractionation facilities — the entire architecture that turns reservoir gas into something a tanker can carry across the Pacific. Without that system, there is nothing to export. The terminal is just a very expensive building.
What I find striking, having followed this file for many years, is how completely the inland story has been ignored. B.C.’s natural gas production has more than doubled since 2010. The Montney holds roughly 70 per cent of the remaining gas resource in the play, one of the longest drilling inventories on the continent. ARC Resources, Tourmaline, Ovintiv — these are not speculative ventures. They have been methodically developing the resource in anticipation of export demand that, until very recently, wasn’t there. For years they drilled into a price paradox: Canadian gas, among the most abundant and technically accessible in the world, trading at a persistent discount to U.S. benchmarks simply because there was nowhere for it to go. Egress constraints, in the dry language of the industry. A resource without routes.
That price gap is not an abstraction. It is capital that didn’t flow into the basin. It is wells that weren’t drilled. It is infrastructure that wasn’t built. And it sits in direct contrast to what has happened on the U.S. Gulf Coast, where LNG export expansion has proceeded at a pace that is, if you look at the numbers plainly, somewhat humbling. The United States expects to be exporting more than 40 billion cubic feet per day of LNG by the mid-2030s. Canada’s export capacity, measured against what the resource could support, remains in its early stages.
LNG Canada in Kitimat changed the equation. So will Cedar LNG, the floating facility being developed in partnership with the Haisla Nation — a genuinely different model, one that connects Indigenous equity ownership to the export economy in ways that the debate never quite expected. These projects are real. Feedgas is contractually secured years in advance. The Coastal GasLink pipeline is in the ground. What was theoretical is now physical.
But physical infrastructure is only as durable as the political and regulatory environment that surrounds it. And that environment, in Canada, has been shaped for a long time by a public conversation that located the entire LNG debate at the coastline — at the ships and the terminals and the questions of who has jurisdiction over the water — while the inland system accumulated quietly, largely outside public view, dependent on a policy stability that was never quite guaranteed.
TC Energy alone operates roughly 94,000 kilometres of natural gas pipeline. Pembina’s gas infrastructure network processes billions of cubic feet per day across western Canada. These systems are the circulatory structure of the entire enterprise. They are also, by and large, invisible to anyone who hasn’t spent time thinking about how energy actually moves from the ground to a buyer in Japan or South Korea.
But there is a dimension of the Montney story that is even less visible than the pipelines, and it matters enormously. Natural gas, when it comes out of the ground, is not just methane. Montney wells produce associated liquids — propane, butane, condensate, natural gasoline — that must be separated, processed, and sold into their own markets. These are the natural gas liquids, or NGLs, and in a liquids-rich play like the Montney, they can be the difference between a marginal well and a highly economic one. They are also, as it turns out, in fierce demand in Asia, for reasons that have nothing to do with electricity generation.
Japan heats homes with propane. South Korea uses propane and butane in petrochemicals and transportation. China’s rapidly expanding propane dehydrogenation industry — a process for making plastics — has been growing at 15 per cent annually since 2020. These are not small markets, and they are not being adequately supplied from the Middle East or the U.S. Gulf. They are being supplied, increasingly and by design, from the northern coast of British Columbia.
I have stood in Prince Rupert adjacent to the site where the first of AltaGas’s vast pressurized storage accumulators rises above the waterfront at Ridley Island. It is an imposing sight — enormous steel spheres that hold propane under pressure before it is loaded onto tankers bound for Osaka and Incheon. If the Montney is where the story begins, this is where one critical chapter ends, and it has been ending here quietly, without controversy or ministerial press conferences, for years. The RIPET terminal — Ridley Island Propane Export Terminal — began operations in 2019. It was, at the time, the first propane export terminal on Canada’s West Coast. It has been followed by the REEF expansion now under construction on the same site.
I was also, some years earlier, near Dawson Creek at a drill site where some of this gas first comes out of the ground. The two experiences, upstream and downstream, separated by hundreds of kilometres, illuminate what the charts and flow diagrams can only approximate: that this is a real industrial system, built by real companies over real decades, that has already demonstrated what it can do.
What AltaGas proved at Prince Rupert — quietly, and well ahead of the national conversation — is that Canada’s geographic advantage applies to LPG exactly as it applies to LNG. A tanker leaving Prince Rupert reaches Japan in ten to eleven days. The same cargo from the U.S. Gulf Coast requires twenty-five or more, and that’s before accounting for Panama Canal congestion, which can add another ten days to the journey. The netback to Canadian producers shipping via AltaGas’s RIPET terminal has averaged roughly five dollars per barrel better than the equivalent route through Conway or Mont Belvieu. That is not a rounding error. Compounded over years of shipments, it is the economic foundation of an entire trade.
The connection to the broader Montney story is direct. The basin’s wells produce gas and liquids together. The economics of drilling depend on the realized value of both. When propane has no export route, it gets sold domestically at depressed prices or flared or left in the ground. When it can reach Japan and South Korea, it fetches prices linked to global energy markets — and it makes the gas wells that produce it more profitable, which means more wells are drilled, which means more feedgas for LNG Canada. The liquids exports and the LNG exports are not competing. They are reinforcing.
There is a version of this story that ends well. The Montney is real. The Asian demand is real — global gas consumption continues to grow, much of it driven by countries trying to replace coal with something that actually works when the wind isn’t blowing, and Asian LPG import needs are projected to grow by more than 40 per cent by 2040. B.C.’s Pacific location gives Canadian exporters a genuine structural advantage over Gulf Coast competitors. The resource, the geography, and the market are all present.
None of this comes easily, and it would be a mistake to end here without saying so plainly.
I spent considerable time in the early part of this decade reporting on the violence and turmoil that afflicted First Nations communities along the Coastal GasLink route during the height of the pipeline protests — work I gathered into a series called Manufacturing Dissent. What I witnessed in the Bulkley Valley and the surrounding territory was not the unified Indigenous opposition that media coverage implied. It was a community fractured and traumatized by the collision of outside political forces with people’s real lives and livelihoods. The pipeline got built. The wounds from that period have not fully healed. The lesson is not that the infrastructure was wrong to proceed. It is that the social and political cost of proceeding without a coherent public narrative is enormous — and that cost is still being paid.
Looking recently at images of the Strait of Hormuz — twenty per cent of the world’s oil supply suddenly frozen as tanker traffic ground to a halt — I found myself thinking about the mountain passes of coastal B.C. in a different way. They are, in their own sense, a chokepoint. Great forces bear down on them. When they are working, the throughput is remarkable and largely invisible. When they are not working — when a court injunction lands, or a blockade holds, or a federal election produces six months of policy paralysis — the consequences ripple outward in ways that most people never connect to the thing that actually caused them. The Strait of Hormuz and the Bulkley Valley are not the same, but the structural logic rhymes: concentrated infrastructure, high stakes, and a vulnerability that is easy to forget in the good times.
The ENGO narrative that challenged public understanding of these projects has not gone quiet. A poll-based op-ed published in the National Observer in February 2026 claimed that 78 per cent of British Columbians are worried about climate change and framed B.C.’s LNG expansion as a “frenzy.” The piece was a deliberate attempt to reframe LNG as a political liability for the Eby government — even as that same government is actively co-signing these projects, because it has read the economic and geopolitical situation correctly and understands what is at stake. The framing will not go away. It will intensify as project activity increases and as the export volumes become real rather than theoretical.
We are currently in earnings reporting season for the companies whose slides appear in this article. What the analyst community broadly understands — and what the numbers confirm — is that the Montney’s fundamentals are sound and that LNG Canada represents a genuine demand catalyst for the basin. But there is a political overlay that the fundamentals alone cannot resolve: carbon policy fragmentation, Treaty 8 permitting complexity, federal election uncertainty, and U.S. tariff spillover effects on the competitiveness argument. Any one of these, poorly managed, can create the kind of investor hesitation that takes years to reverse. Together, they represent a communications environment in which credible civil society voices — organizations that can speak to the public interest rather than corporate interest — have a specific and important role to play.
This is why I take pride in the work of the Resource Works team every day. When France’s Trade Minister Nicolas Forissier visited Vancouver this week, I had the opportunity to convey something I believe with some conviction after more than a decade working on this file: that the Montney is the crown jewel of the British Columbia economy. Not a controversial extraction play. Not a climate liability. A publicly owned natural resource of extraordinary scale and quality, sitting beneath land that communities in the northeast have worked and lived on for generations, connected by infrastructure built at enormous effort and expense to markets that genuinely need what it produces. The value of that resource can only be fully realized when we work together — producers, midstream companies, First Nations partners, governments, and organizations like ours — to build the trust and understanding that durable development requires.
The coast is where the story becomes visible. But it starts, as it has always started, somewhere you’ve probably never been — beneath the farmland and the boreal forest, hundreds of kilometres from the sea. Getting it from there to here is the work. The work is not finished.
Stewart Muir is the president and CEO of Resource Works based in Vancouver. He can be reached at [email protected]
Charts and data: the evidence behind the argument
The slides below are drawn from investor presentations and analyst research published by the companies and firms named — ARC Resources, Tourmaline, Ovintiv, Enverus Intelligence, Pembina Pipeline, TC Energy, Enbridge, and Cedar LNG. They were not produced for this article. They are the working materials of an industry making its case to capital markets, and they are included here because they show, in the language of people with money at stake, exactly what the essay describes in prose: the scale of the resource, the economics of the system, the gap between what Canada has built and what it has so far been willing to export. Each caption attempts to explain not just what the chart shows but what it means.
Chart 1. ARC Resources — Montney reserves per share, 2023–2025

ARC’s proven, probable and developed producing reserves per share have grown consistently across each of the past three years. The key line at the bottom of the slide tells you what matters: ARC’s net present value of $39 per share for its 2P reserves is based on roughly a quarter of its total drilling inventory. Three-quarters of the resource hasn’t been assigned a value yet. This is not a company running out of runway. It is a company that hasn’t started running.
Chart 2. Tourmaline — production outlook to 850,000 boe/d

Tourmaline’s July 2025 expansion plan runs through the end of the decade with annotated milestones: new processing facilities, compressor stations, liquids hubs. The trajectory is not speculative — each step is named and scheduled. What the chart conveys is the sheer organizational complexity required to grow a gas basin. Every incremental volume of Montney gas requires a corresponding increment of surface infrastructure, and Tourmaline’s slide is essentially a road map for what that looks like in practice.
Chart 3. Enverus — the Montney is the largest gas play in North America

The bar chart comparing undeveloped dry gas resource across major North American plays is arresting. The Montney column is taller than Marcellus, Haynesville, Delaware, and every other basin on the chart. The companion chart shows that British Columbia holds approximately 70 per cent of the remaining gas resource in the play. The Duvernay, also in Canada, barely registers. This is not a minor reserve. It is, by volume, the dominant gas resource on the continent — and it is almost entirely landlocked.
Chart 4. Tourmaline — Alberta Deep Basin acreage map

The map of Tourmaline’s Deep Basin land position stretches across a substantial portion of northwestern Alberta. Current production is 320,000 barrels of oil equivalent per day from 3.2 million acres. The drilling inventory stands at nearly 15,000 horizontal locations. The significance here is not Tourmaline specifically — it is what the map illustrates about the geographic scale of the western Canadian sedimentary basin. The gas fields extend far beyond the Montney. The resource is enormous and largely underdeveloped.
Chart 5. ARC Resources — Montney supply cost curve

This curve plots inventory well count against supply cost per thousand cubic feet. The striking finding: approximately half of ARC’s total drilling inventory carries a supply cost below zero cents per Mcf. That is gas that is economic to produce at any positive price. It sits waiting for markets. The supply cost curve is the physical explanation for why egress constraints are so economically damaging — the resource is there and it is cheap, but without a route to buyers, the economics don’t close.
Chart 6. Ovintiv — Montney operational performance, 2025

Ovintiv’s Montney operations slide shows accelerating drilling efficiency: completion rates rising from roughly 3,300 feet per day in 2022 to nearly 4,750 in 2025. Well costs are falling. Time-to-depth at Gold Creek has dropped to under ten days. Condensate realizations are running at 96 per cent of WTI. This is what a mature, operationally competitive basin looks like when investment has been sustained. The Ovintiv data reinforces that the Montney’s costs are not holding it back. Infrastructure access is.
Chart 7. Enverus — Canada’s gas output flat; U.S. up 2x since 2010

Side by side, the contrast is damning. Canadian gas production, while growing in B.C., has been essentially flat in aggregate since 2010. U.S. production has roughly doubled over the same period, driven primarily by Texas and Pennsylvania. B.C.’s contribution within the Canadian total has increased, but it is swimming against a structural stagnation. The divergence between the two production profiles is not geological — it is the product of pipeline access, LNG export development, and regulatory environments that have treated the two resources very differently.
Chart 8. Enverus — AECO vs. Henry Hub prices, 1997–2025

This is the price paradox made visible. The AECO benchmark — where Canadian gas trades — has sat at a persistent and widening discount to the U.S. Henry Hub price throughout the shale era. The differential line tells the story: since the mid-2010s, Canadian producers have routinely received 20 to 40 per cent less for their gas than U.S. producers receive for an equivalent molecule. The explanation is not resource quality. It is that Henry Hub gas can reach LNG export terminals in Louisiana and Texas. AECO gas, until recently, could not reach tidewater at all.
Chart 9. Enverus — Canadian plays hold the longest resource life

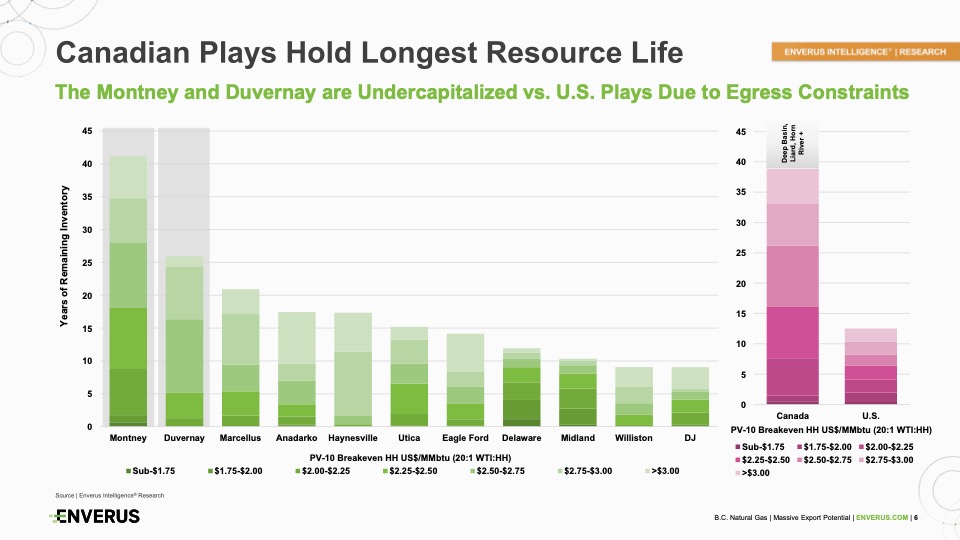
The Montney and Duvernay have more years of remaining inventory than any U.S. play on the chart — over 40 years combined at current depletion rates, compared with 20 years for Marcellus and far less for Haynesville or the Delaware. Yet both Canadian plays are described as undercapitalized relative to their U.S. counterparts. The reason, as the subtitle states directly, is egress constraints. The longest resource life on the continent has attracted proportionally less capital than shorter-lived U.S. basins, simply because those basins could move their gas.
Chart 10. Pembina — the natural gas value chain

This diagram is the clearest single-slide illustration of the argument that LNG is a system, not a terminal. Gas produced in the Montney travels through Pembina’s gathering and processing infrastructure, along the Alliance Pipeline, through third-party transmission, to mainline fractionation facilities, and only then reaches Cedar LNG at Kitimat. Parallel NGL streams move through separate pipelines to storage, fractionation, and export at Prince Rupert. Vancouver Wharves handle oil and condensate. The diagram is dense because the system is dense. Every stage requires capital, and the removal of any link breaks the chain.
Chart 11. TC Energy — North American gas pipeline network

The map of TC Energy’s natural gas pipeline system is, at first glance, simply a lot of blue lines across a continental map. But the key facts are in the lower left: 57 billion cubic feet per day of deliveries, 94,000 kilometres of pipeline, $8.3 billion in capital in service in 2025 alone. TC Energy’s system carries approximately 30 per cent of North American LNG feedgas demand. It connects eight of the ten largest gas distribution utilities in the United States. The Canadian portion of that network is the artery through which Montney gas eventually reaches Coastal GasLink and the Pacific coast.
Chart 12. Enbridge — gas transmission highlights

Enbridge’s gas transmission portfolio spans both the U.S. and Canada, with $4 billion in capital deployed in 2025. On the U.S. side, the system is expanding in multiple directions simultaneously: Gulf Coast LNG export, Texas Eastern and Valley Crossing pipelines, data centre connections. On the Canadian side, the Canada Energy Regulator approved the Sunrise expansion in January 2026. The contrast between the pace of U.S. gas infrastructure expansion and the pace of Canadian expansion is evident even within the slides of a single company operating in both markets.
Chart 13. Pembina — midstream asset map, western Canada

This map shows the physical geography of Pembina’s midstream network stretching from the Montney in northeast B.C. through the Deep Basin and Duvernay in Alberta, down toward Edmonton, and west to Vancouver Wharves and the Cedar LNG terminal under construction at Kitimat. The Montney oval in the upper left of the map and the LNG terminal icon on the Pacific coast are connected by a web of pipelines, fractionators, and processing plants. This is what it looks like when the system is drawn to scale — not a pipeline, but a network, and a large one.
Chart 14. Pembina — processing, fractionation and storage capacity

The specifications on this slide quantify the midstream infrastructure that most LNG commentary omits entirely: 6.7 billion cubic feet per day of gas processing capacity, 430,000 barrels per day of fractionation capacity, 21 billion cubic feet of cavern storage. Pembina Gas Infrastructure is the largest third-party gas processor in Canada. The Redwater complex is described as Canada’s premier NGL fractionation facility. Without infrastructure of this scale and complexity, the gas from the Montney would be unsaleable in export form. This is the invisible foundation.
Chart 15. ARC Resources — Montney production history, 2000–2026

The production chart annotated with milestones — first horizontal well in 2005, land base built from 2006 to 2008, gas plants added in sequence through the 2010s, major acquisitions in 2021 and 2025 — shows a story of methodical, decade-long asset development. The production line bends sharply upward in the early 2020s as the system reached critical mass. This is what patient capital looks like. The Montney basin was not discovered last year. It was built over twenty years by companies that believed export markets would eventually materialize.
Chart 16. ARC Resources — drilling inventory by asset

The horizontal bar chart shows years of development inventory remaining at each of ARC’s Montney assets, with breakeven supply costs indicated. Greater Dawson and Sundown carry more than 25 years of inventory. Even the shorter-tailed assets like Ante Creek show over a decade of runway. Critically, the majority of the inventory sits below $2 per Mcf breakeven — competitive on a global basis. The constraint is not the length of the inventory, and it is not the cost. It is the pace at which export capacity can absorb the supply.
Chart 17. Enverus — B.C. LNG projects proposed vs. built

The left panel shows the full universe of B.C. LNG projects proposed between 2014 and the present: a cascade of project names accumulating toward 30 billion cubic feet per day of potential export capacity. The right panel shows what actually moved to final investment decision or construction: a narrow set of bars representing LNG Canada Phase 1, Woodfibre, Cedar LNG, Ksi Lisims, and a potential Phase 2. The gap between the two panels is the visual record of a decade of regulatory uncertainty, legal challenges, and lost investment. The subtitle — “What Could Have Been” — requires no elaboration.
Chart 18. Enverus — global natural gas consumption outlook to 2050

The stacked area chart shows global gas consumption rising from roughly 400 billion cubic feet per day today toward nearly 500 by mid-century. The growth is concentrated in Asia — China, India, and other Asian markets expanding steadily throughout the forecast period. Europe and North America remain relatively flat. The demand case for Canadian LNG does not rest on optimistic assumptions about gas displacing renewables in mature markets. It rests on the straightforward arithmetic of Asian energy systems trying to replace coal with something dispatchable.
Chart 19. Enverus — LNG shipping routes: Canada’s proximity advantage

The shipping map makes the geographic argument visually. Routes from Kitimat to Japan are materially shorter than routes from the U.S. Gulf Coast — which must travel either through the Panama Canal or around the Cape of Good Hope to reach the same destination. The cost advantage compounds over the life of a long-term supply contract. Canada’s Pacific position is not a minor benefit. Over years of voyages, it translates into a structural cost advantage that Gulf Coast LNG cannot replicate, regardless of how efficiently those projects are built.
Chart 20. Enverus — Canada vs. U.S. LNG export capacity to 2035

The side-by-side comparison is perhaps the most clarifying chart in the set. By 2035, U.S. and Mexican LNG export capacity is projected to exceed 40 billion cubic feet per day, built from a broad portfolio of Gulf Coast projects. Canada’s expected capacity — LNG Canada Phase 1, Woodfibre, Cedar LNG, Ksi Lisims, and a potential LNG Canada Phase 2 — reaches roughly six billion cubic feet per day on the same timeline. That is a gap of more than seven to one. Both countries had the resource. One built the infrastructure.
Chart 21. Enverus — Canada’s LNG opportunity, 2025–2040

The final chart shows the demand trajectory against projected global LNG supply, with Canada’s current capacity and potential capacity identified separately. The opportunity identified by Enverus is more than 20 billion cubic feet per day of additional export potential over the next 15 years — roughly the equivalent of six more projects the size of LNG Canada. The demand line rises consistently above committed supply through the forecast period. The gap is not a market problem. It is a supply problem, and specifically a Canadian supply problem. The resource to fill it sits beneath the Peace River country, ready to be moved.
The liquids layer: AltaGas and the Prince Rupert story
Chart 22. AltaGas — Canada: natural gas and NGL production outlook, 2020–2030

Canadian natural gas production is projected to rise by more than 30 per cent through 2030, reaching roughly 23 billion cubic feet per day. The Montney will account for 65 per cent of all production growth over that period. But the companion charts on NGLs tell an equally important story: Canadian NGL production is also expected to grow by more than 30 per cent, to nearly 1.8 million barrels per day, over the same timeframe. The critical note is that domestic demand for those NGLs will remain limited. The growth must be exported. This is the supply push that makes the Prince Rupert export buildout not a niche play but a structural necessity.
Chart 23. AltaGas — gas and NGL fundamentals drive midstream growth

This four-panel dashboard connects the dots between supply growth, LNG export projects, NGL volumes, and Asian LPG demand in a single view. The top-left panel shows WCSB gas production rising by roughly 4 billion cubic feet per day through 2030, with additional LNG projects adding further upside after that. The NGL production panel shows a corresponding increase of 280,000 barrels per day. The bottom-right panel on Asian LPG petrochemical demand — growing at 15 per cent compounded since 2020 — explains where all of it is going. The four panels are the commercial logic of the liquids export business assembled in one place.
Chart 24. AltaGas — Alberta: Montney liquids-rich growth on the horizon

Alberta’s Montney NGL supply is projected to reach 700,000 barrels per day by 2030, with the Pipestone growth area driving much of the incremental volume. The Alberta Deep Basin, anchored by the Harmattan growth area, is separately projected to show 25 per cent NGL supply growth over the same period. The Alberta Montney is expected to be the single largest source of NGL supply in Canada by 2030, representing roughly 40 per cent of total Canadian production. The AltaGas midstream system sits in the path of all of this volume — and Prince Rupert is the outlet.
Chart 25. AltaGas — B.C.: well permits and Montney NGL supply outlook

B.C. well permits saw a fourfold increase in 2023 relative to 2022 levels, and the trajectory through 2025 remains elevated. The NGL supply outlook for the B.C. Montney, broken down by area and by product, shows total NGL supply rising from roughly 200,000 barrels per day today toward 450,000 by 2030 — with propane and LPG making up a substantial and growing share. AltaGas notes that additional fractionation and liquids handling capacity will be required to capture this growth, and that leveraging existing infrastructure is the key to meeting environmental stewardship commitments. B.C.’s upstream is not waiting for markets to materialize. It is drilling ahead of them.
Chart 26. AltaGas — Montney economics among the strongest in North America

The half-cycle economics comparison across North American gas plays puts the Alberta Montney Core and northeast B.C. Montney Core at the left end of the payout period axis — meaning they pay out faster than any other play on the chart. The Montney pays out in roughly one year or less. Eagle Ford, at the other end, takes more than 2.5 years. The pie chart alongside confirms that the Montney represents 54 per cent of total WCSB natural gas supply, and that Montney volume growth has outpaced total basin growth by a factor of two. The economics that make this the most attractive gas play in North America are also the economics that most need export routes to be fully realized.
Chart 27. AltaGas — west coast advantage: shipping times

The map quantifies what geography implies. A tanker from Prince Rupert or Ferndale reaches Japan in ten to eleven days. The same cargo from the U.S. Gulf Coast takes twenty-five or more days under normal conditions. Via the Arabian Gulf, eighteen or more. Panama Canal congestion — a recurring operational reality — can push the Gulf Coast voyage to thirty-five days or beyond, with corresponding increases in shipping cost. AltaGas calculates that North American West Coast LPG exports have a base-case time saving of roughly 60 per cent over the Gulf Coast route and 45 per cent over the Arabian Gulf. These savings are structural. They do not depend on commodity price cycles or political conditions. They are the product of where British Columbia sits on the map.
Chart 28. AltaGas — battle of the barrels: Asian tolling wins

Excess Canadian propane and butane produced at Fort Saskatchewan has two destinations: east by rail to the U.S. Southern markets at Conway, Kansas or Mont Belvieu, Texas, or west via AltaGas’s system to Prince Rupert and Asian buyers. The slide shows that AltaGas’s RIPET tolling has averaged roughly five dollars per barrel stronger all-in netback to shippers than the Conway route over the past two years. That differential is the financial expression of the geographic advantage — and it compounds. Every barrel of propane that reaches Japan via Prince Rupert rather than the U.S. Gulf returns more value to the western Canadian producer who drilled the well that produced it.
Chart 29. AltaGas — North America balancing the global LPG market

AltaGas has become, without much public fanfare, a significant participant in the global propane trade. The company delivers 28 per cent of Japan’s total propane imports and 13 per cent of South Korea’s. Approximately 97 per cent of its LPG export volumes flow to those two markets, with 90 per cent transacted with investment-grade counterparties or fully secured. North American LPG exports — the red band that appears and rapidly expands in the global export chart from 2018 onward — have become the marginal supply source balancing Asian demand. Canada, via Prince Rupert, is a substantial part of that story. The slide notes rising inquiries and spot sales into China as well, driven by tariff-related trade realignments.
Chart 30. AltaGas — REEF: Ridley Island Energy Export Facility

REEF is AltaGas’s next chapter at Prince Rupert — a multi-phased LPG and bulk liquids marine export terminal under construction adjacent to the existing RIPET facility. Phase 1 includes 56,000 barrels per day of initial export capacity, 600,000 barrels of LPG storage, a ten-bay dual-sided rail offloading facility capable of handling unit trains, and an 1,100-metre multi-product jetty. Subsequent optimization and expansion phases bring additional refrigeration, storage, and capacity. The aerial photograph of Ridley Island shows REEF and RIPET side by side on the same industrialized waterfront — the quiet infrastructure of a trade relationship with Asia that has been under construction for years, and that most of the Canadian public has never been asked to think about.
Chart 31. AltaGas — Asian LPG import demands to grow more than 40 per cent by 2040

The demand side of the equation is as clear as the supply side. Asian propane import requirements are projected to grow by more than 40 per cent between 2025 and 2040, with China, Japan, Korea, and other Asia-Pacific markets all contributing to the increase. Asian butane imports are expected to grow by more than 45 per cent over the same period. The drivers include Chinese PDH petrochemical expansion, home heating in Japan and Korea, transportation and fuel blending across the region. The gap between domestic Asian supply and domestic Asian demand will be filled by imports — and the question is from where. Prince Rupert is already the answer.
Share This:


COMMENTARY: Can Alberta Become the Compute Capital of Canada? – Maureen McCall