CDN NEWS |
  US NEWS


Vermilion Energy Inc. (Vermilion) has announced that it is acquiring Westbrick Energy Ltd. (Westbrick) for $1.075 billion. XI’s AssetBook has identified roughly 44,700 boe/day compared to the news articles that have identified the deal at 50,000 boe/day. This translates to roughly between $21,000 and $24,000 per flowing boe. Looking back at other gas transactions, Tourmaline acquired Bonavista for $1.45 billion, which, based on AssetBook’s 6:1 ratio, translated to a valuation of about $30,400 per barrel of oil equivalent per day (boe/d). Tourmaline also purchased Crew, a valuation around $44,000 per boe/d. As these two Tourmaline purchases dealt with a greater proportion of liquid rich gas, these metrics make sense.
XI Technologies evaluated the Vermillion acquisition of Westbrick through different lenses using AssetSuite software tools and looked at each company’s asset profile, plus the combined entity, to gain valuable insight into the transaction. Consideration was also given to the fall out and which other players in the area may be affected. This deep dive gives a comprehensive understanding and full picture of the resulting acquisition.
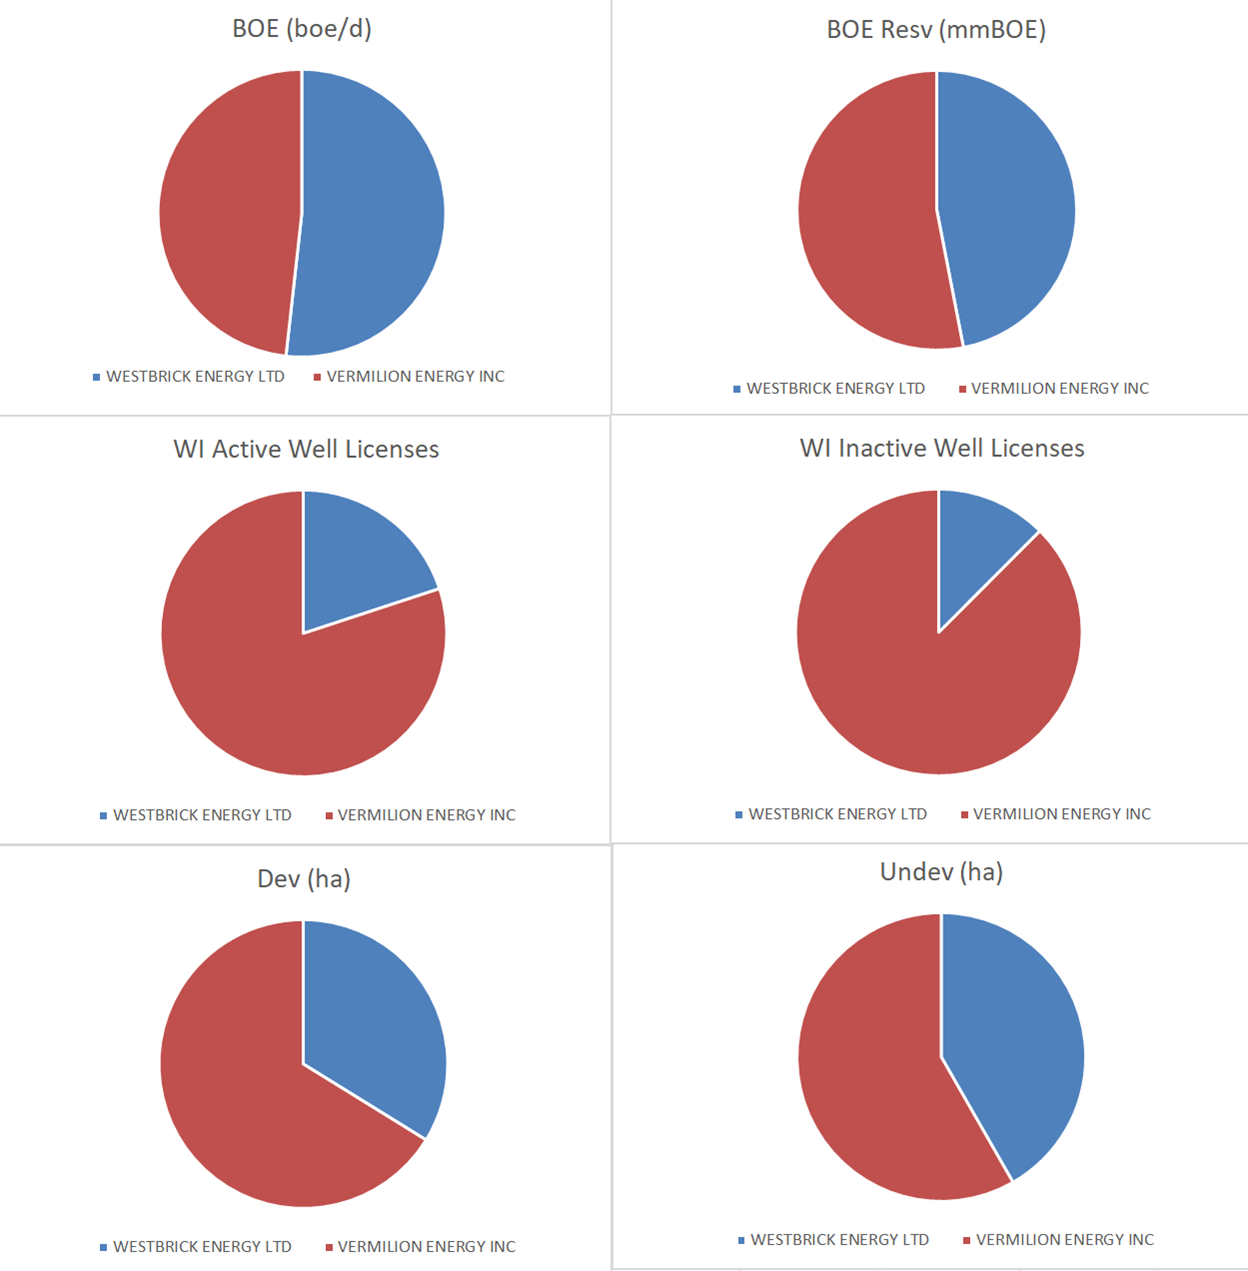
Figure 1 – Working Interest values for Westbrick Energy (blue) and Vermilion Energy(red). Source: XI Technologies AssetBook/AssetBook ARO Manager
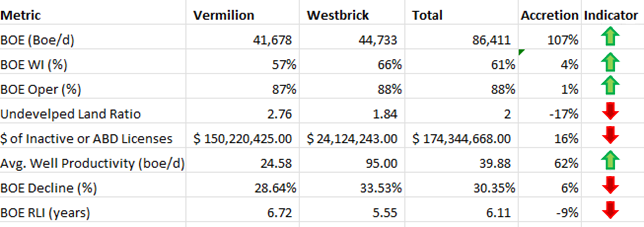
While the absolute numbers tell one story, accretion and dilution metrics tell us more. Looking at the AssetSuite summary, we can calculate some accretion and dilution metrics for this transaction relative to the increase in production.
Per Figure 2 below, Vermilion’s production base will more than double through this acquisition, while liabilities will only increase by 16%. The Westbrick assets don’t appear to be quite as long lived as Vermilion’s base, but they do potentially add operational efficiency with a substantial increase in the average well rate.
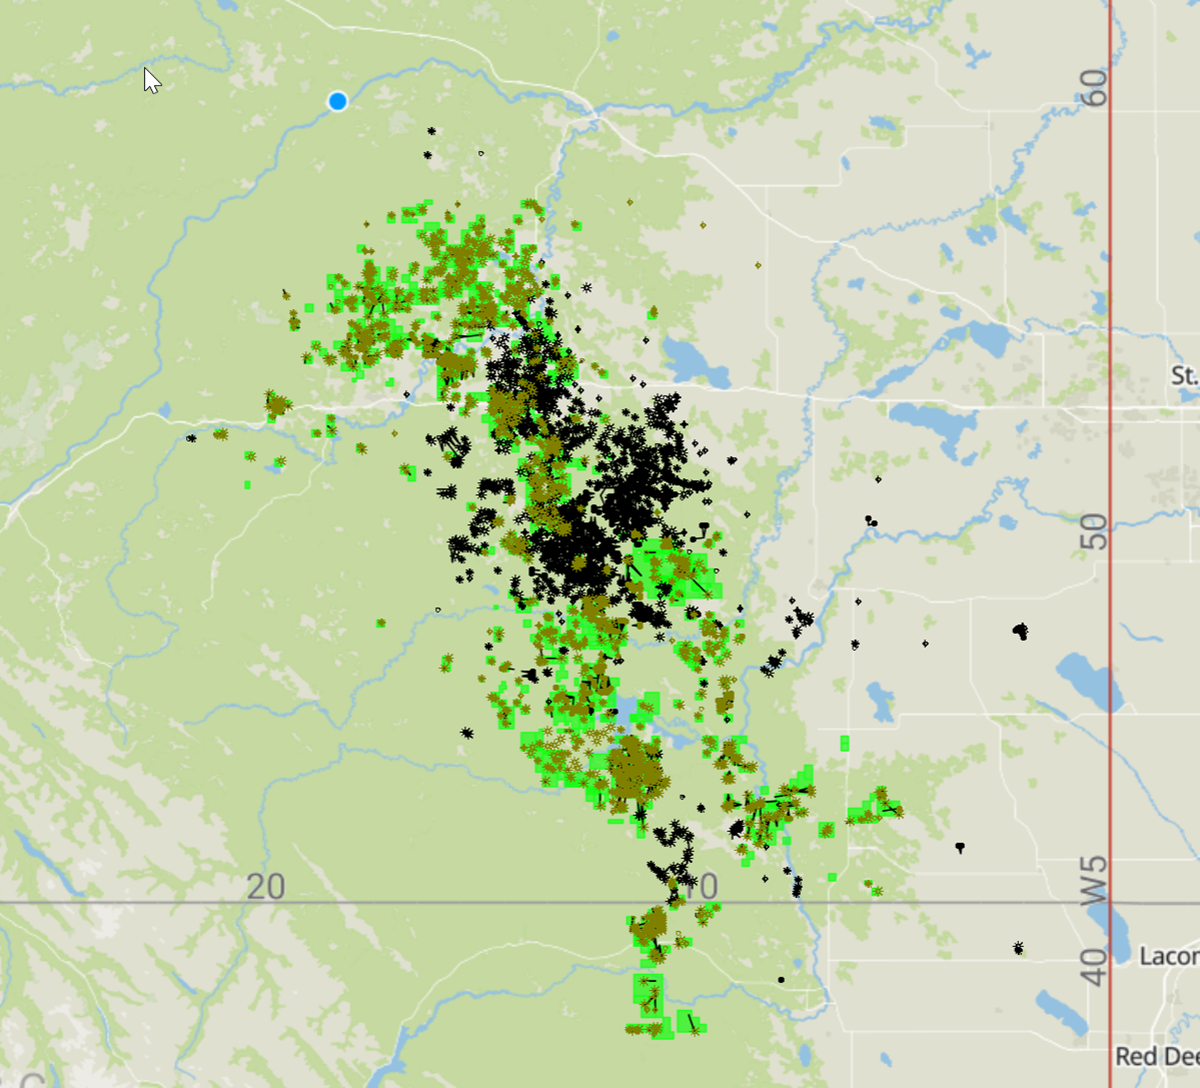
The best way to see the core of this deal is to overlay Westbrick’s production heat map on Vermilion’s well map. Westbrick’s assets are very concentrated, so it is easy to evaluate other players in this area.
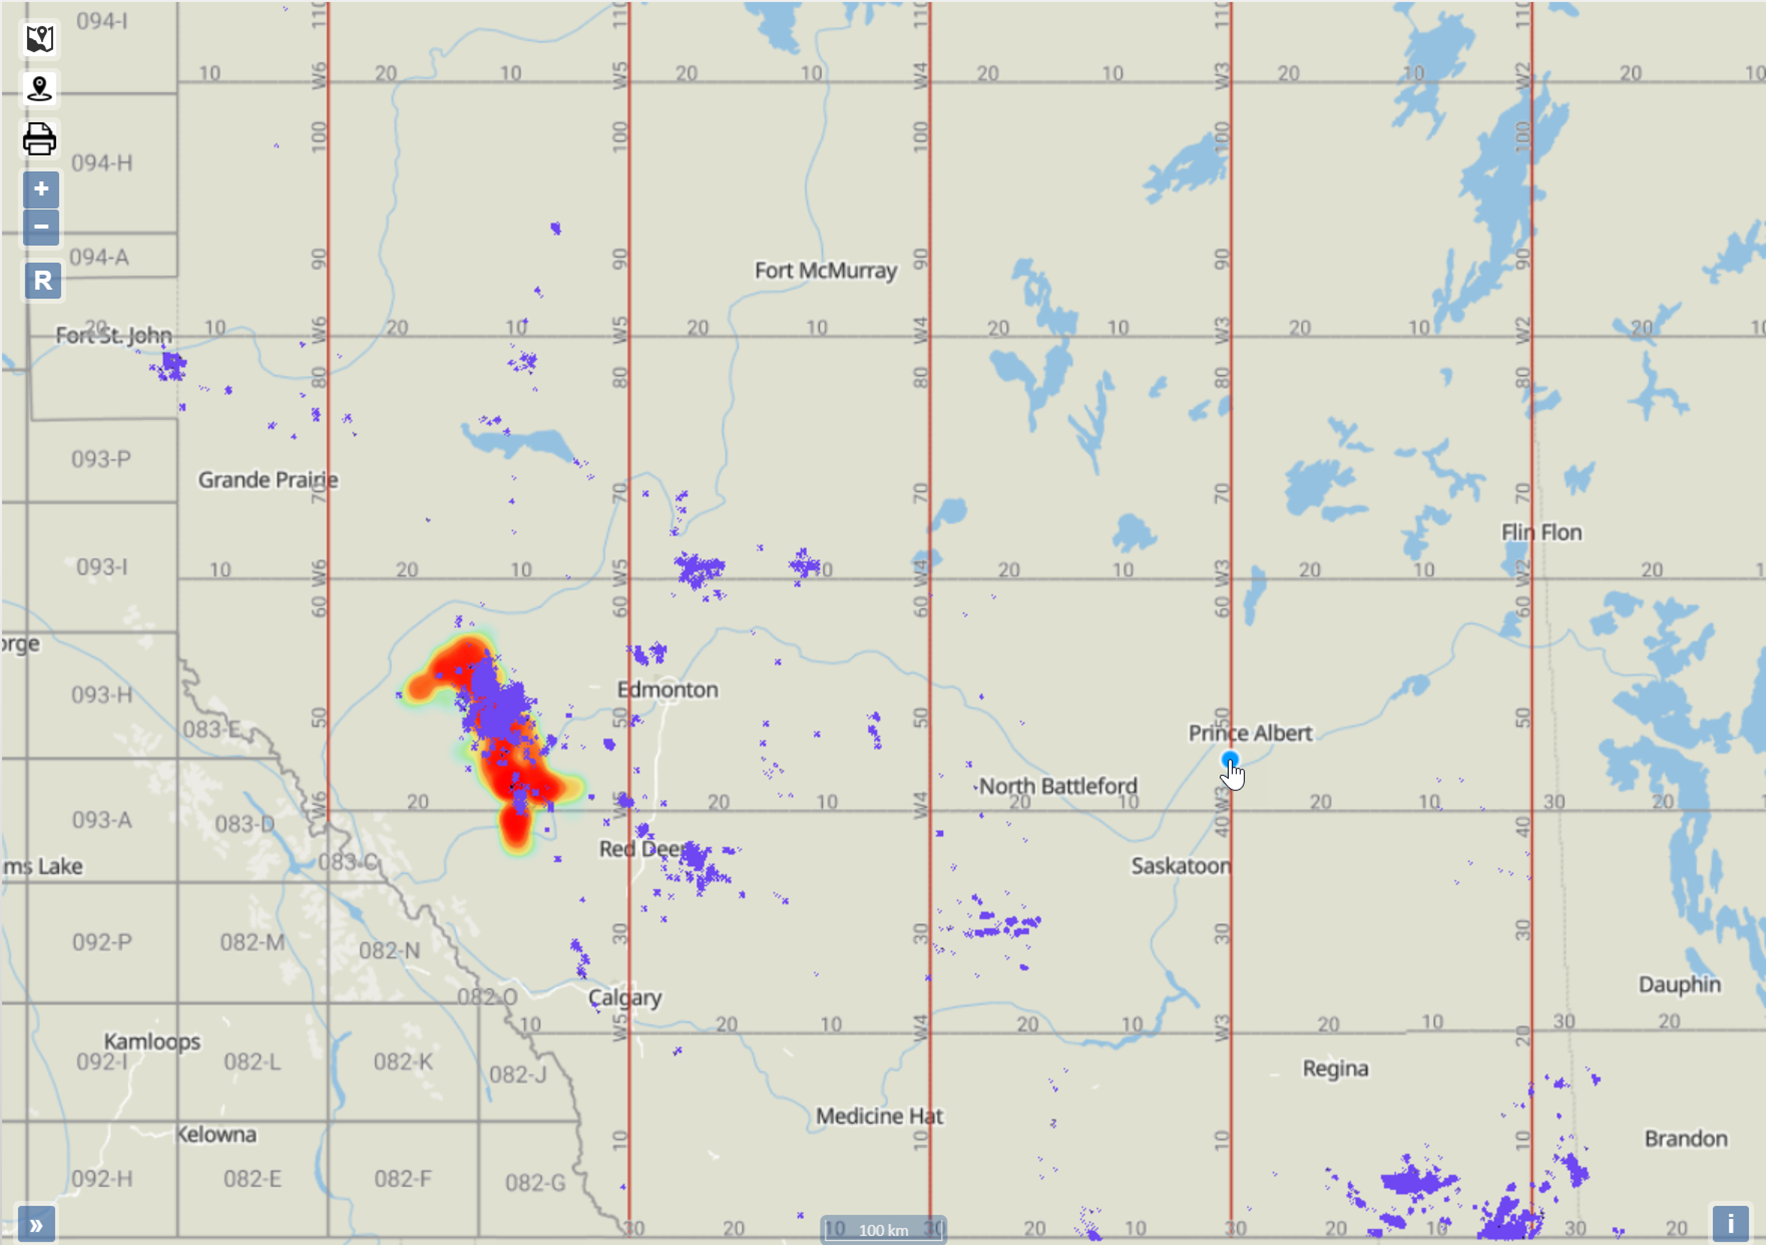
Expanding Vermilion’s central Alberta assets, this acquisition augments their production around the Pembina field. Combining Vermilion’s assets with Westbrick shows that these assets are in a diverse number of Zones as shown below.
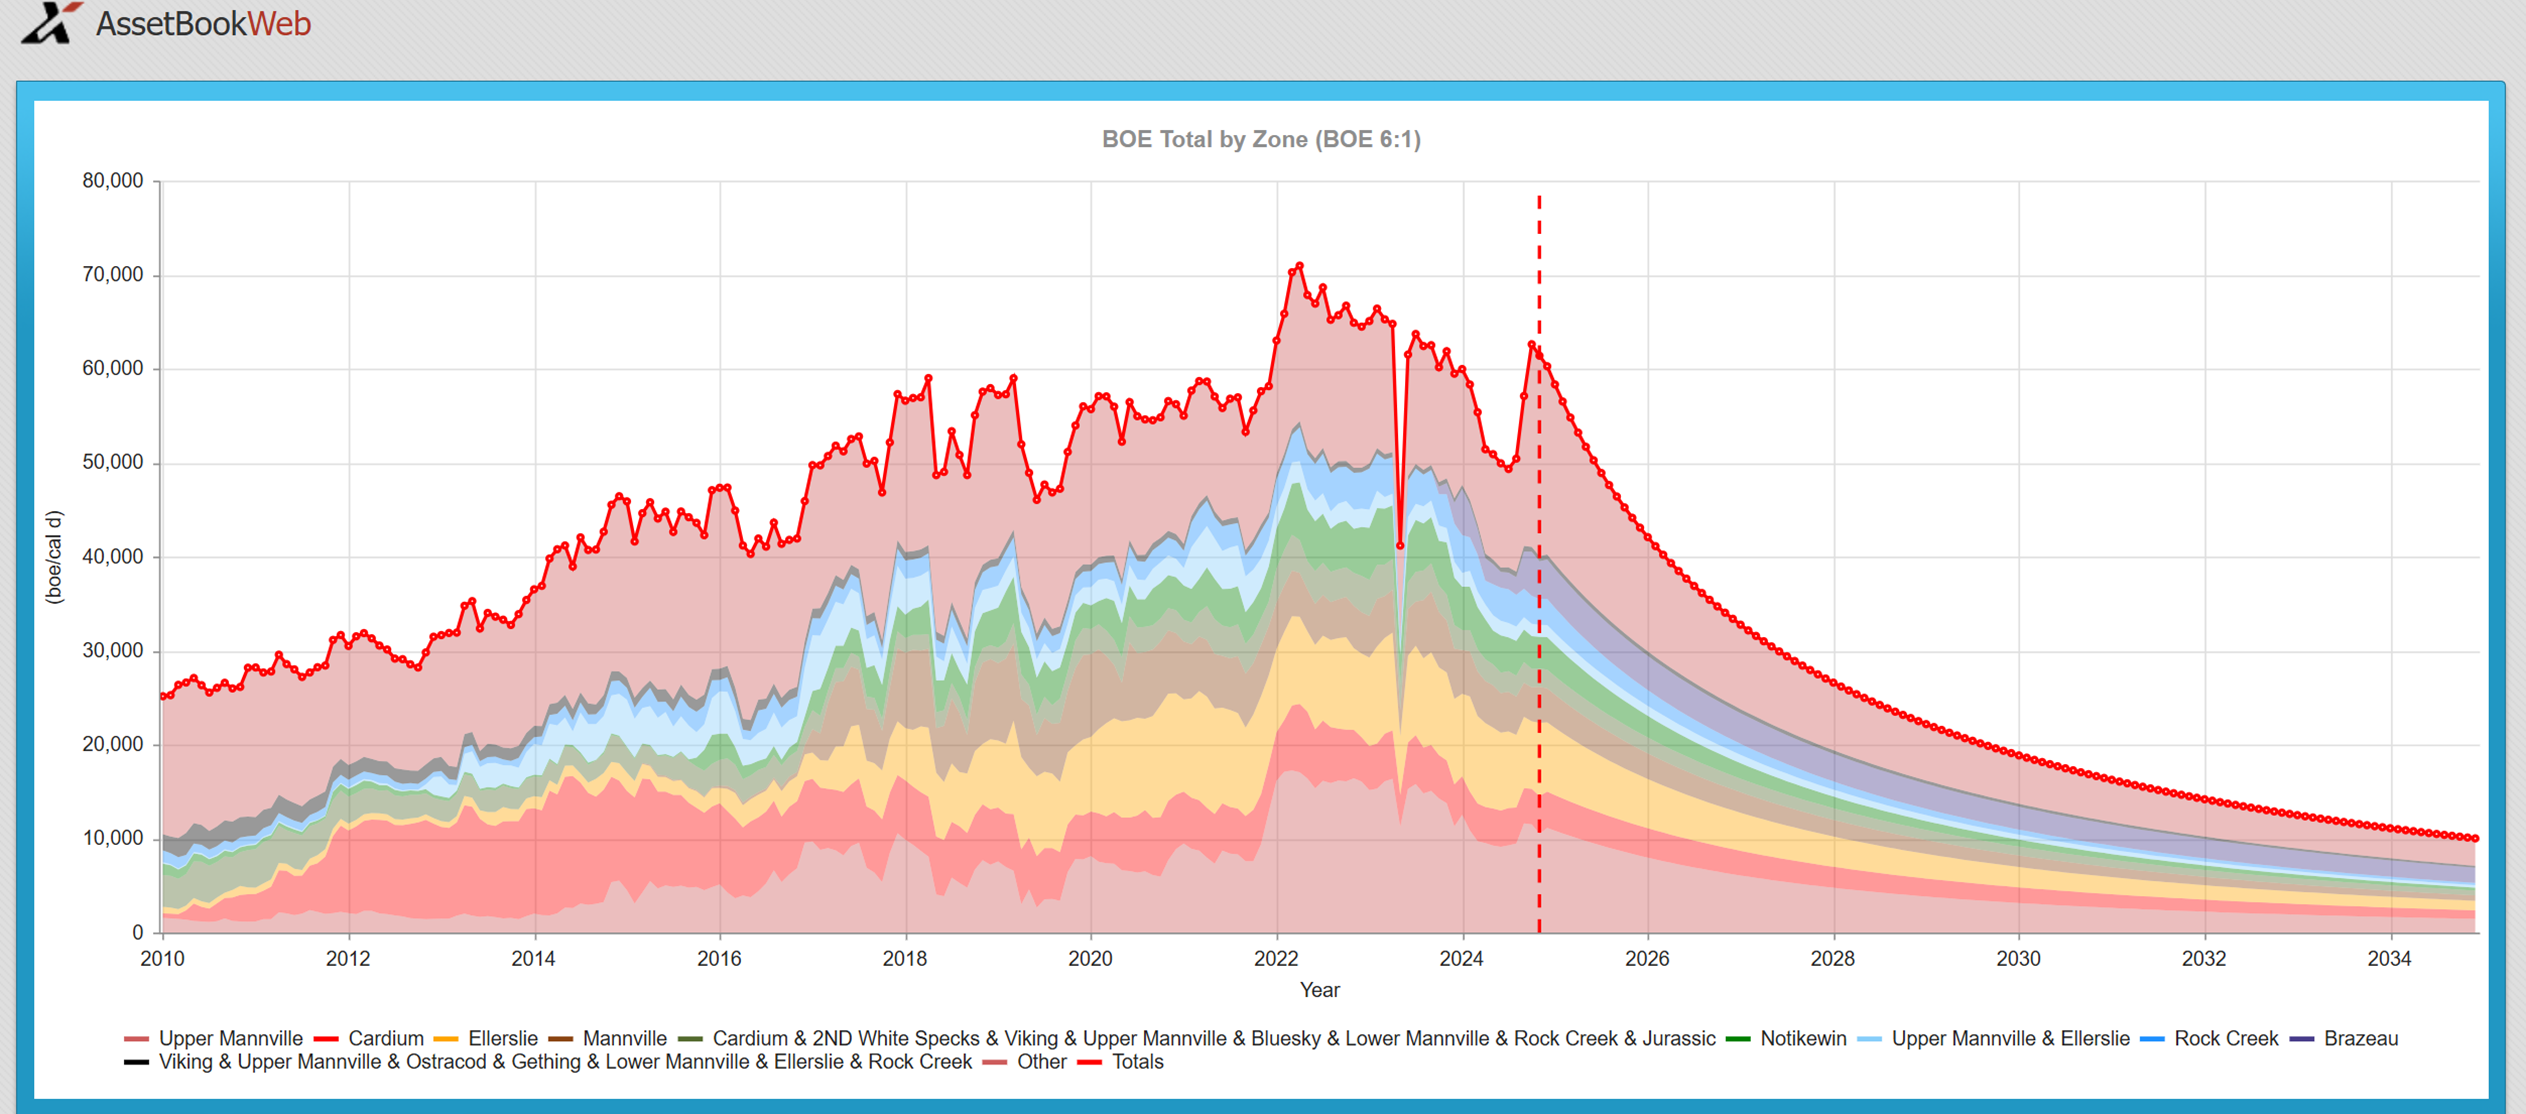
The land holdings involved in this deal are a crucial component of its strategic value. Westbrick’s assets are notably concentrated, offering Vermilion an opportunity to enhance its operational efficiencies and expand its presence around the Pembina field. The overlapping asset base creates a seamless integration, adding diversity to Vermilion’s production portfolio. With these new holdings in a variety of geological zones, Vermilion gains access to untapped potential and significant room for future development. The consolidation of these concentrated assets further underscores the importance of strategic land positioning in Alberta’s competitive energy market.
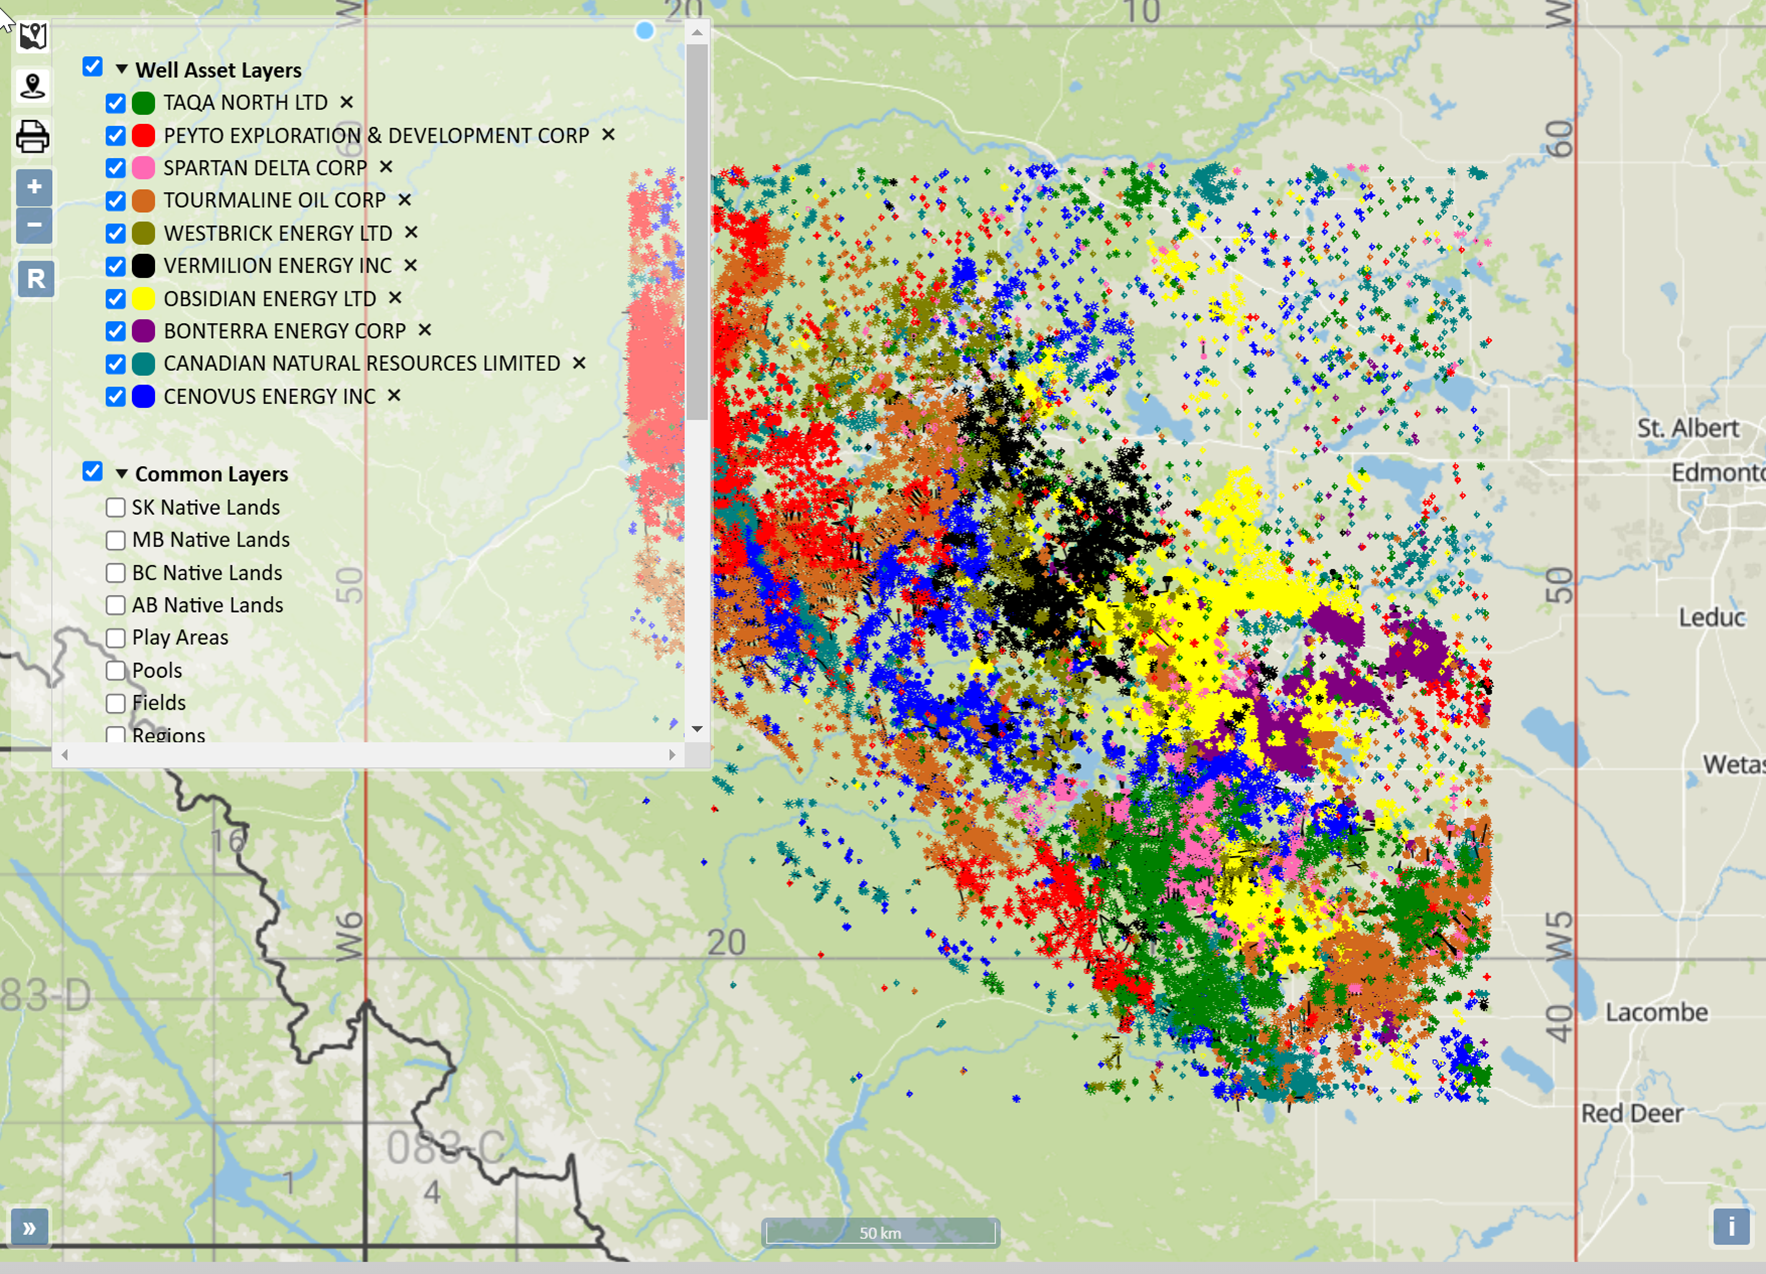
A CORE AREA OVERVIEW


With the AssetBook we can create an area around each of these and see all other players in that region. Tourmaline Energy is the largest player in this area with approximately 81,000 boe/d of the 566,069 boe/d producing from this area. The area has 151 producers and just under 75% of the production is held by the top 10 producers. This is primarily a gas producing area with a little more than 86% of the production coming from gas. Download more information on the companies in this area here.
This acquisition not only cements Vermilion’s strategic position in this region but also sets a benchmark for similar transactions in the sector. By integrating Westbrick’s concentrated and efficient asset base, Vermilion is poised to optimize production while managing liabilities effectively, as shown in the accretion metrics. With other key players like Tourmaline and Crew already setting the tone for valuation in the region, Vermilion’s move highlights a broader trend of consolidation and efficiency in Alberta’s energy landscape. As this deal unfolds, it will be fascinating to observe its ripple effects across the industry and the potential opportunities it creates for further collaboration or competition in the area.
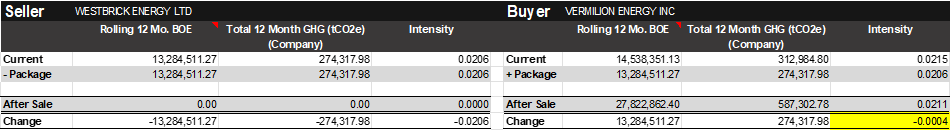
EMISSIONS PROFORMA ANALYSIS
Vermilion Energy has a robust sustainability vision, with a stated goal to reduce Scope 1 GHG Intensity by 15-20% below their 2019 baseline by 2025, focusing initially on methane reduction in line with AER regulations. Large scale acquisitions of this magnitude, primarily driven by financial metrics, can have a major impact on stated ESG or emissions targets.
A high-level analysis using XI’s Emissions Report noted that while Vermillion is doubling its production, it’s intensity factor will remain essentially unchanged (if anything it will drop a little) based on our proforma reporting.
This was likely a big factor for Vermillion. For any company, early-stage high-level analysis of post-transaction emissions materiality during the scoping phase, especially when looking at multiple packages, saves time, identifies emissions-related red flags, and helps mitigate any potential impacts against stated ESG targets and goals.
* Please note that our reporting is built from the data using XI’s proprietary emissions factors and published emissions volumes. The numbers may not match a company’s reported sustainability values, but the XI methodology allows for apples-to-apples assessments at a high level, instantly. Trailing 12-month BOE and CO2e values are current until November 2024.
Share This: