


 CDN NEWS |
  US NEWS


The world will continue to rely on oil and gas for decades to come, according to the International Energy Agency
Follow CEC on LinkedIn CEC LinkedIn
Follow CEC on Facebook CEC Facebook
Follow CEC on Twitter CEC Twitter

Getty Images photo
To sign up to receive the latest Canadian Energy Centre research to your inbox email: inbox@canadianenergycentre.ca
Download the PDF here
Download the charts here
Overview
Recent global conflicts, which have been partly responsible for a global spike in energy prices, have cast their shadow on energy markets around the world. Added to this uncertainty is the ongoing debate among policymakers and public institutions in various jurisdictions about the role of traditional forms of energy in the global economy.
One widely quoted study influencing the debate is the International Energy Agency’s (IEA) World Energy Outlook, the most recent edition of which, World Energy Outlook 2023 (or WEO 2023), was released recently (IEA 2023).
In this CEC Fact Sheet, we examine projections for oil and natural gas production, demand, and investment drawn from the World Energy Outlook 2023 Extended Dataset, using the IEA’s modelled scenario STEPS, or the Stated Policies Scenario. The Extended Dataset provides more detailed data at the global, regional, and country level than that found in the main report.
The IEA’s World Energy Outlook and the various scenarios
Every year the IEA releases its annual energy outlook. The report looks at recent energy supply and demand, and projects the investment outlook for oil and gas over the next three decades. The World Energy Outlook makes use of a scenario approach to examine future energy trends. WEO 2023 models three scenarios: the Net Zero Emissions by 2050 Scenario (NZE), the Announced Pledges Scenario (APS), and the Stated Policies Scenario (STEPS).
STEPS appears to be the most plausible scenario because it is based on the world’s current trajectory, rather than the other scenarios set out in the WEO 2023, including the APS and the NZE. According to the IEA:
The Stated Policies Scenario is based on current policy settings and also considers the implications of industrial policies that support clean energy supply chains as well as measures related to energy and climate. (2023, p. 79; emphasis by author)
and
STEPS looks in detail at what [governments] are actually doing to reach their targets and objectives across the energy economy. Outcomes in the STEPS reflect a detailed sector-by-sector review of the policies and measures that are actually in place or that have been announced; aspirational energy or climate targets are not automatically assumed to be met. (2023, p. 92)
Key results
The key results of STEPS, drawn from the IEA’s Extended Dataset, indicate that the oil and gas industry is not going into decline over the next decade—neither worldwide generally, nor in Canada specifically. In fact, the demand for oil and gas in emerging and developing economies under STEPS will remain robust through 2050.
Oil and natural gas production projections under STEPS
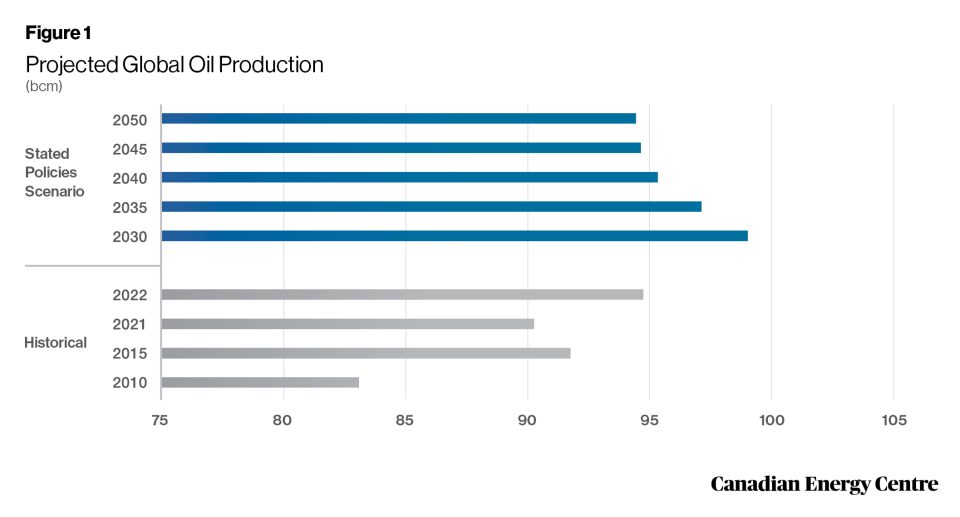
World oil production is projected to increase from 94.8 million barrels per day (mb/d) in 2022 to 97.2 mb/d in 2035, before falling slightly to 94.5 mb/d in 2050 (see Figure 1).
Source: IEA (2023b)
Canadian overall crude oil production is projected to increase from 5.8 mb/d in 2022 to 6.5 mb/d in 2035, before falling to 5.6 mb/d in 2050 (see Figure 2).

Source: IEA (2023b)
Canadian oil sands production is expected to increase from 3.6 mb/d in 2022 to 3.8 mb/d in 2035, and maintain the same production level till 2050 (see Figure 3).

Source: IEA (2023b)
World natural gas production is anticipated to increase from 4,138 billion cubic metres (bcm) in 2022 to 4,173 bcm in 2050 (see Figure 4).

Source: IEA (2023b)


Canadian natural gas production is projected to decrease from 204 bcm in 2022 to 194 bcm in 2050 (see Figure 5).

Source: IEA (2023b)
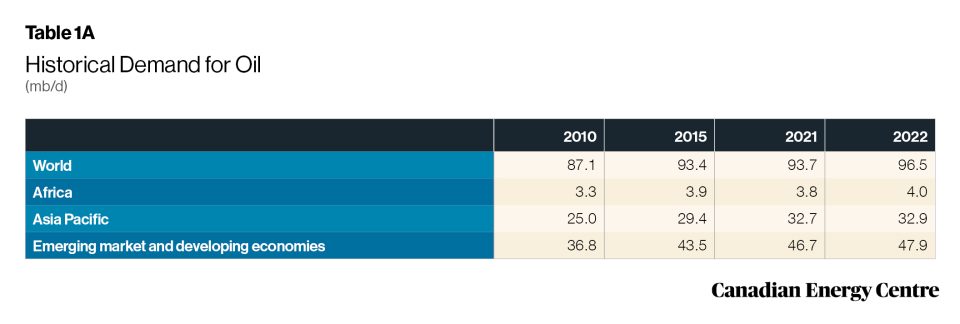
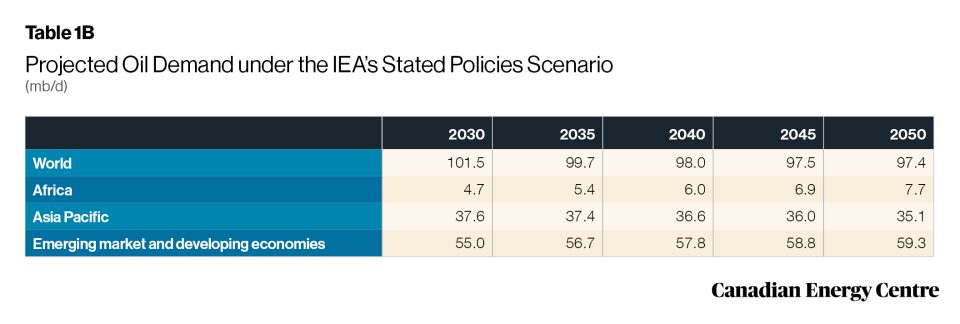
Oil demand under STEPS
World demand for oil is projected to increase from 96.5 mb/d in 2022 to 97.4 mb/d by 2050 (see Tables 1A and 1B). Demand in Africa for oil is expected to increase from 4.0 mb/d in 2022 to 7.7 mb/d in 2050. Demand for oil in the Asia-Pacific is projected to increase from 32.9 mb/d in 2022 to 35.1 mb/d in 2050. Demand for oil from emerging and developing economies is anticipated to increase from 47.9 mb/d in 2022 to 59.3 mb/d in 2050.
Source: IEA (2023b)
Source: IEA (2023b)
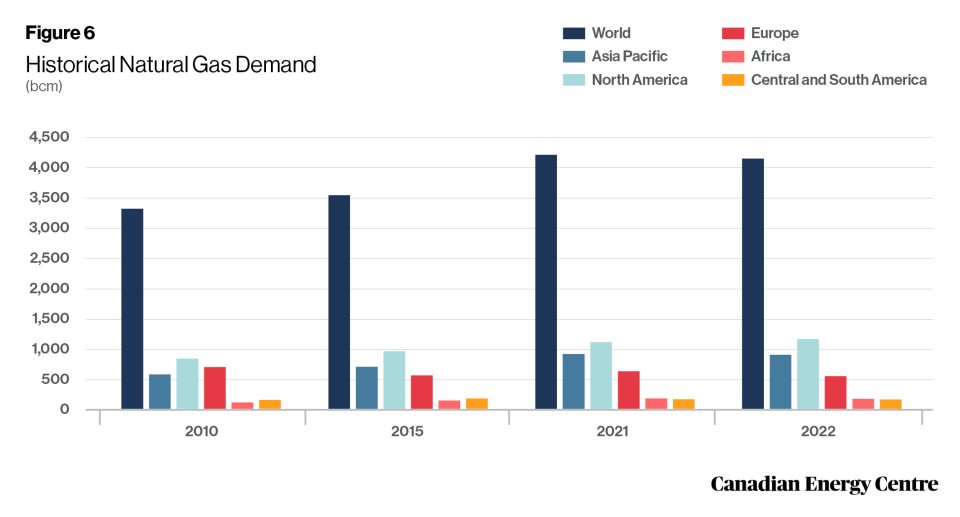
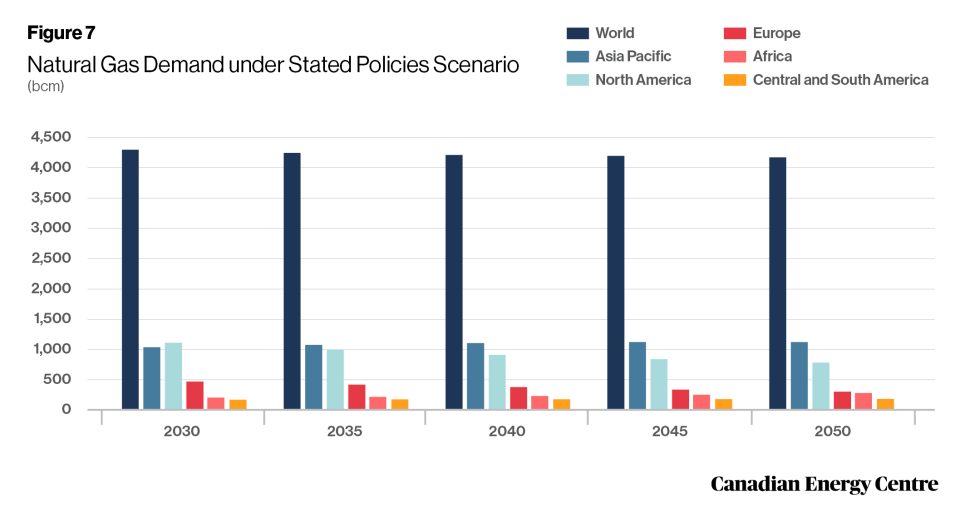
Natural gas demand under STEPS
World demand for natural gas is expected to increase from 4,159 billion cubic metres (bcm) in 2022 to 4,179 bcm in 2050 (see Figures 6 and 7). Demand in Africa for natural gas is projected to increase from 170 bcm in 2020 to 277 bcm in 2050. Demand in the Asia-Pacific for natural gas is anticipated to increase from 900 bcm in 2020 to 1,119 bcm in 2050.
Source: IEA (2023b)
Source: IEA (2023b)
Cumulative oil and gas investment expected to be over $21 trillion
Taking into account projected global demand, between 2023 and 2050 the cumulative global oil and gas investment (upstream, midstream, and downstream) under STEPS is expected to reach nearly U.S.$21.1 trillion (in $2022). Global oil investment alone is expected to be over U.S.$13.1 trillion and natural gas investment is predicted to be over $8.0 trillion (see Figure 8).
Between 2023 and 2050, total oil and gas investment in North America (Canada, the U.S., and Mexico) is expected to be nearly U.S.$5.6 trillion, split between oil at over $3.8 trillion and gas at nearly $1.8 trillion (see Figure 8). Oil and gas investment in the Asia Pacific, over the same period, is estimated at nearly $3.3 trillion, split between oil at over $1.4 trillion and gas at over $1.9 trillion.

Source: IEA (2023b)
Conclusion
The sector-by-sector measures that governments worldwide have put in place and the specific policy initiatives that support clean energy policy, i.e., the Stated Policies Scenario (STEPS), both show oil and gas continuing to play a major role in the global economy through 2050. Key data points on production and demand drawn from the IEA’s WEO 2023 Extended Dataset confirm this trend.
Positioning Canada as a secure and reliable oil and gas supplier can and must be part of the medium- to long-term solution to meeting the oil and gas demands of the U.S., Europe, Asia and other regions as part of a concerted move supporting energy security.
The need for stable energy, which is something that oil and natural gas provide, is critical to a global economy whose population is set to grow by another 2 billion people by 2050. Along with the increasing population comes rising incomes, and with them comes a heightened demand for oil and natural gas, particularly in many emerging and developing economies in Africa, the Asia-Pacific, and Latin America, where countries are seeing urbanization and industrialization grow rapidly.
References (as of February 11, 2024)
International Energy Agency (IEA), 2023(a), World Energy Outlook 2023 <http://tinyurl.com/4nv9xyfj>; International Energy Agency (IEA), 2023(b), World Energy Outlook 2023 Extended Dataset <http://tinyurl.com/3222553b>.
Creative Commons Copyright
Research and data from the Canadian Energy Centre (CEC) is available for public usage under Creative Commons copyright terms with attribution to the CEC. Attribution and specific restrictions on usage including non-commercial use only and no changes to material should follow guidelines enunciated by Creative Commons here: Attribution-NonCommercial-NoDerivs CC BY-NC-ND.
Share This:


COMMENTARY: Canadians Should Decide What to do With Their Money – Not Politicians and Bureaucrats