


 CDN NEWS |
  US NEWS


Of the top 10 suppliers of foreign oil to the U.S. over nearly three decades, only Canada was considered a ‘Free’ nation

Overview
Despite the advent of the shale oil revolution over the past decade, the U.S. continues to import a significant amount of foreign crude oil on an annual basis.
U.S. foreign crude oil imports help satisfy American domestic demand and are used by U.S. refineries to produce petroleum products such as gasoline, diesel fuel and heating oil, which is consumed in motor vehicles and homes across the country.
In this Fact Sheet, we examine the track record of U.S. foreign crude oil imports over nearly three decades, including the number of barrels imported and the dollar value of those imports¹ by 26 “Not Free” and 19 “Partly Free” countries.²
The term “Not Free” comes from the Washington DC-based think tank Freedom House, which has measured and ranked countries and territories by their degree of freedom since 1973. Its broad rankings are: Free, Partly Free, and Not Free. Not Free countries are those where civil and other rights are often far below those of Free countries.
Over 84 billion barrels of U.S. foreign crude oil imports since 1993: Nearly half from Not Free countries
In nearly three decades (1993-2019), the U.S. has imported over 84 billion barrels of foreign crude oil, an average of over 3.1 billion barrels per year.
Although annual U.S. foreign crude oil imports have declined by about one-third from their high-water mark of nearly 3.7 billion barrels in 2004, they still averaged over 2.9 billion barrels per year over the past decade. In 2019, the U.S. imported nearly 2.5 billion barrels of crude oil.
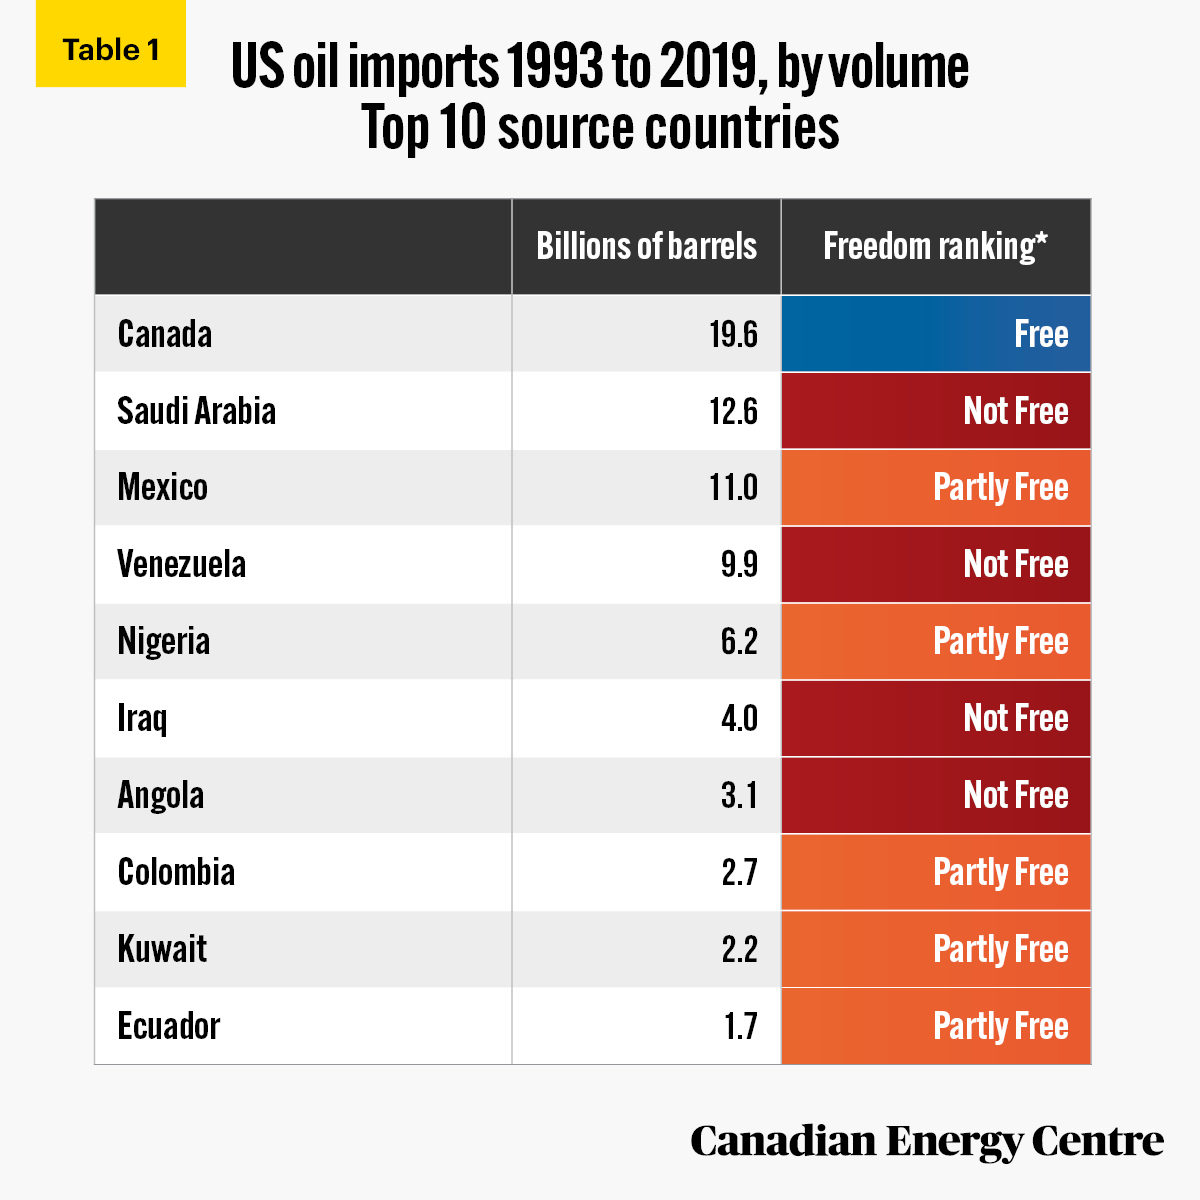
- U.S. foreign crude oil imports between 1993 and 2019 were highest from Canada (19.6 billion barrels or 23.3 per cent of the total), followed by Saudi Arabia (12.6 billion barrels or 15 per cent), and Mexico (11 billion barrels or 13.1 per cent) (see Table 1).
- U.S. foreign crude oil imports from OPEC nations between 1993 and 2019 were over 38.9 billion barrels or 46.3 per cent of the total.
- Of the top ten suppliers of foreign oil to the United States between 1993 and 2019, only Canada was considered Free.
- Of all U.S. foreign crude oil imports, 29.3 per cent came from countries designated as Free, with 29.2 per cent from Partly Free countries and 41.5 per cent from Not Free countries.
1. It should be noted that small differences in the U.S. dollar values for each Free and Not-Free country will occur by barrel of oil exported, since oil prices vary for each country depending on the quality of oil exported.
2. The 26 Not Free countries are Algeria, Angola, Azerbaijan, Belarus, Brunei, Cameroon, Chad, China, Congo (Brazzaville); Congo (Kinshasa), Egypt, Equatorial Guinea, Gabon, Iraq, Kazakhstan, Libya, Oman, Qatar, Russia, Saudi Arabia, South Sudan, Syria, United Arab Emirates, Venezuela, Vietnam, and Yemen. The 19 Partly Free countries are Albania, Benin, Bolivia, Colombia, Ecuador, Georgia, Guatemala, Guinea, Indonesia, Ivory Coast, Kyrgyzstan, Kuwait, Malaysia, Mauritania, Mexico, Nigeria, Papua New Guinea, Singapore, and Thailand.
*As of 2019
Sources: US Energy Information Administration and Freedom House
2019 snapshot: 2.5 billion barrels of U.S. foreign crude oil imports
In 2019, the U.S. imported almost 2.5 billion barrels of foreign oil.
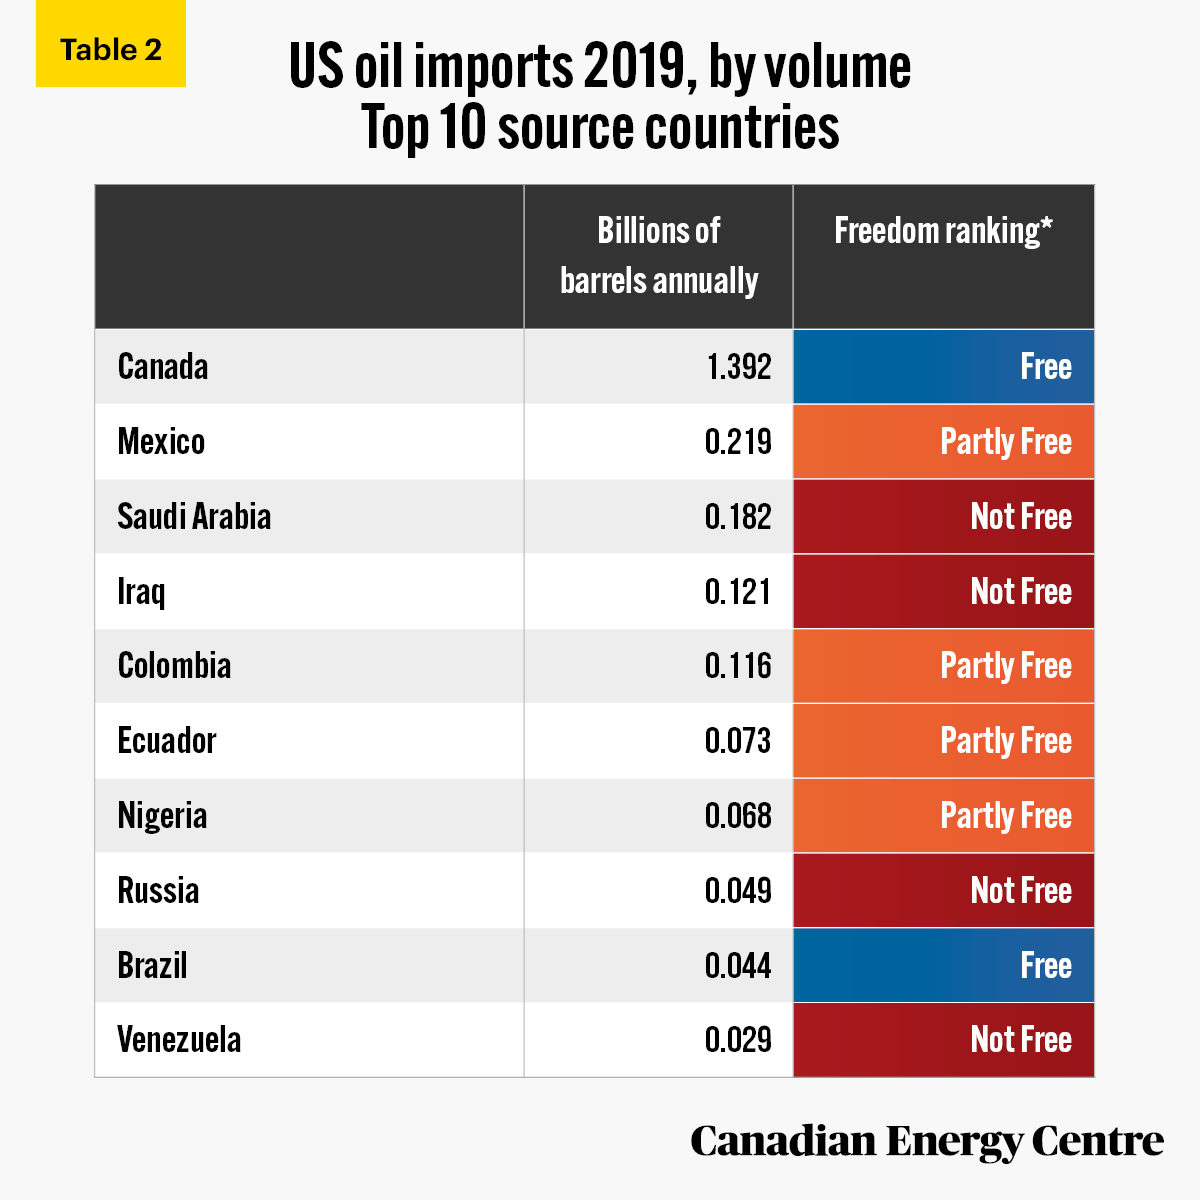
- U.S. foreign crude oil imports in 2019 were highest from Canada (almost 1.4 billion barrels or 56.1 per cent of the total), followed by Mexico (219 million barrels, or 8.8 per cent) and Saudi Arabia (182 million barrels or 7.3 per cent) (see Table 1).
- Of the top ten countries, four were designated Not Free (Saudi Arabia, Iraq, Russia and Venezuela) and four were designated as Partly Free (Mexico, Colombia, Ecuador, and Nigeria).
- Of the top ten suppliers of foreign oil to the United States in 2019, only Canada and Brazil were designated as Free.
*As of 2019
Sources: US Energy Information Administration and Freedom House
Nearly $4.2 trillion in U.S. foreign crude oil imports since 1993: $1.8 trillion from Not Free countries
Turning now to the dollar value of U.S. crude oil imports, in almost three decades (1993-2020), the U.S. has imported nearly $4.2 trillion of foreign crude oil, an average of over $148 billion per year.
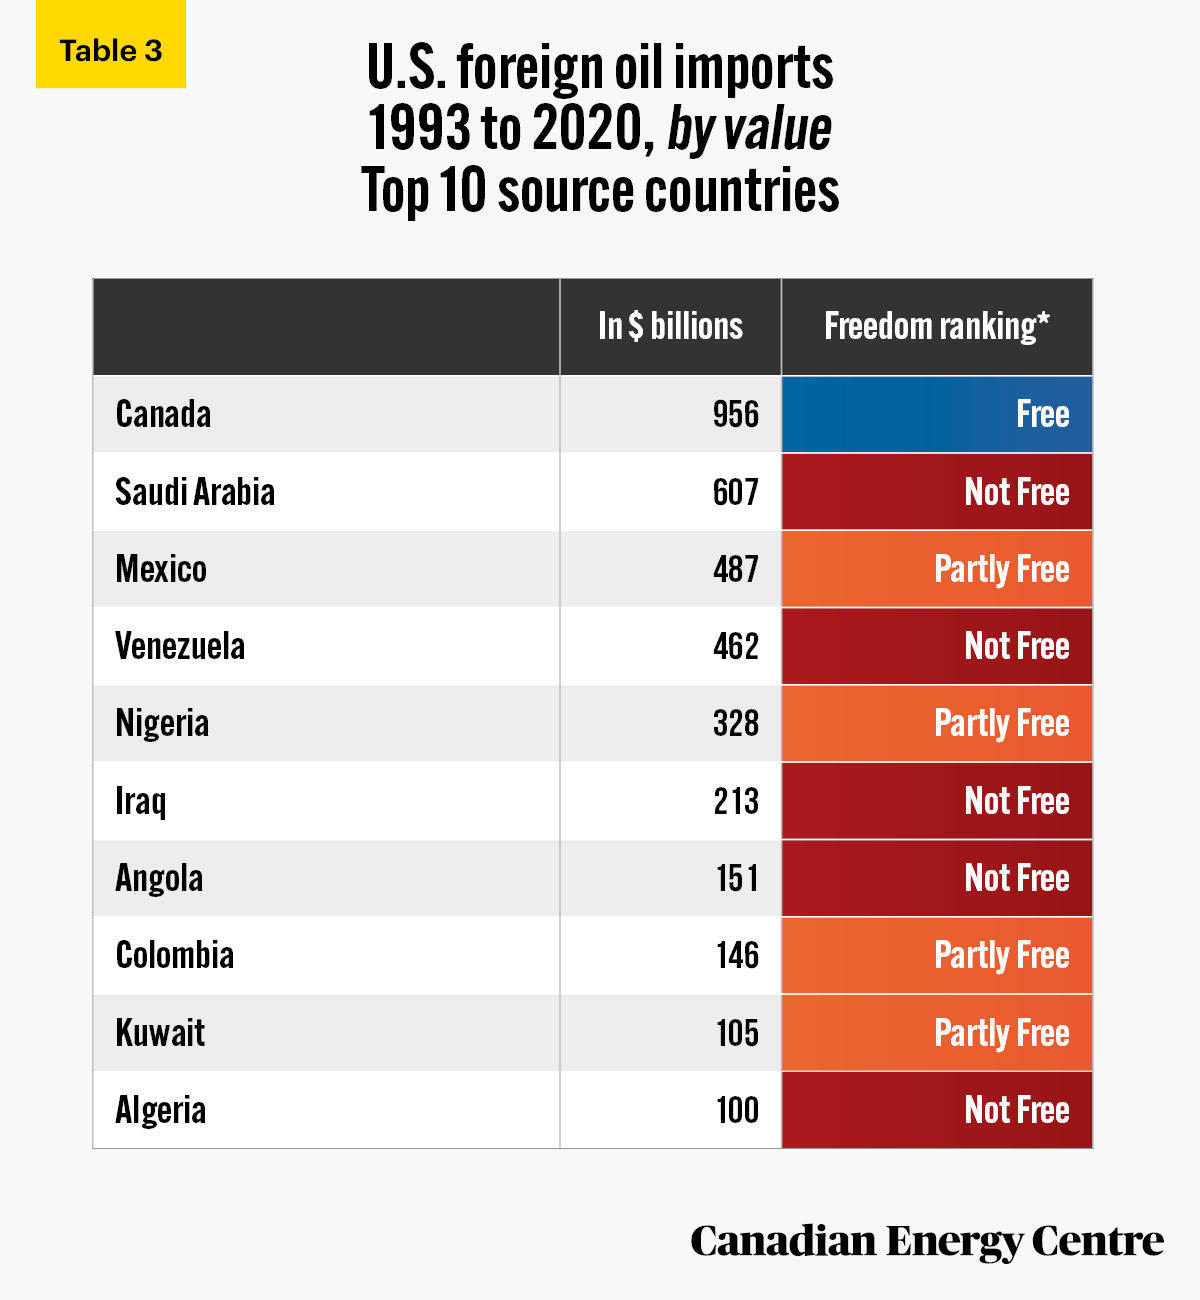
- U.S. foreign crude oil imports between 1993 and 2020 were highest from Canada ($956 billion or 23 per cent of the total), followed by Saudi Arabia ($607 billion or 14.6 per cent), and Mexico ($487 billion or 11.7 per cent) (see Table 3).
- U.S. foreign crude oil imports from OPEC nations between 1993 and 2020 were nearly $2.1 trillion or 50 per cent of the total.
*As of 2019
Sources: US Energy Information Administration and Freedom House
1993 to 2020: U.S. foreign oil imports breakdown by Free, Partly Free and Not Free
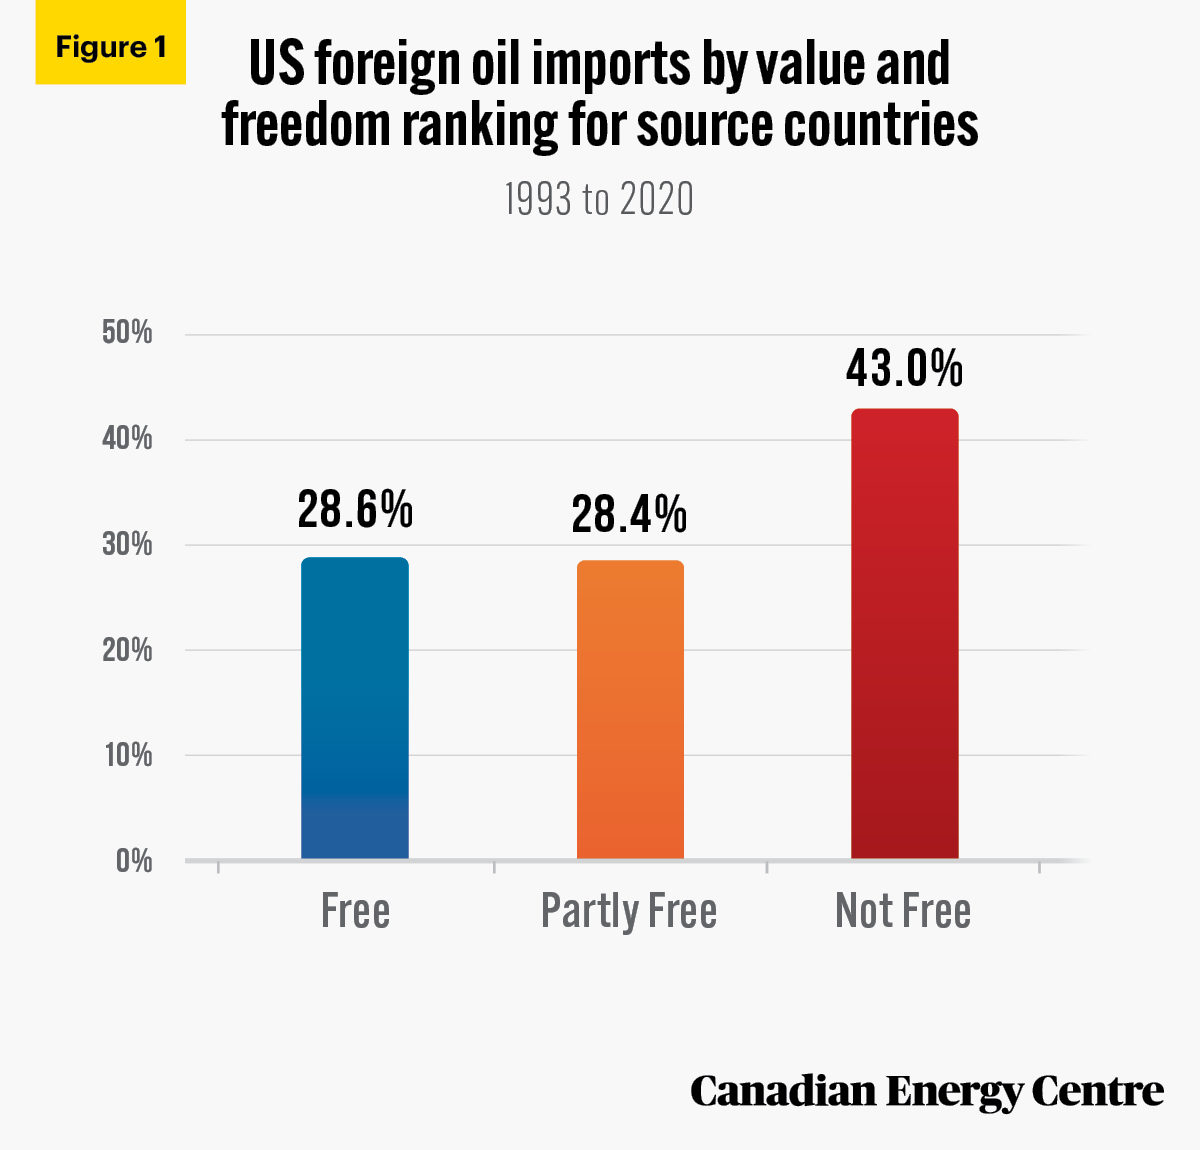
- U.S. foreign crude oil imports from Not Free countries were nearly $1.8 trillion or 43 per cent of total U.S. foreign crude oil imports between 1993 and 2020 (see Figure 1).
- Just under $1.2 trillion of U.S. foreign oil came from Partly Free countries (28.4 per cent) with just over $1.2 trillion (28.6 per cent) from Free countries (see Figure 1).
Sources: US Census Bureau and Freedom House
Moving in the right direction: A 2020 snapshot of $77 billion in U.S. foreign oil imports
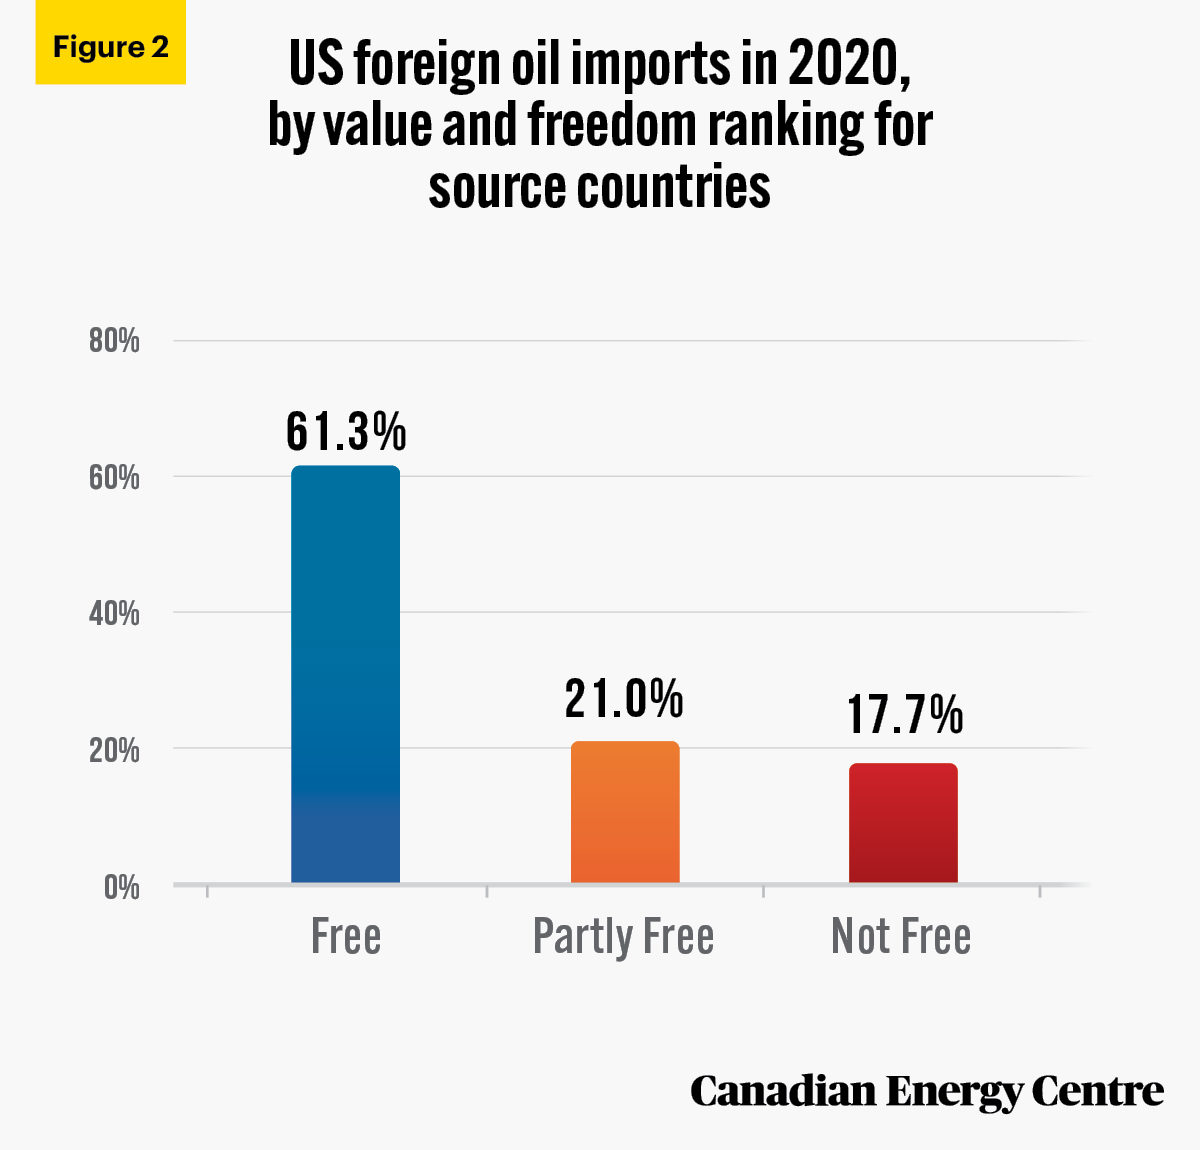
- As of 2020, the picture of U.S. foreign oil imports at $77 billion is much more weighted towards Free countries, essentially Canada, with minor amounts from ten other Free countries. Free countries comprise a 61.3 per cent share in 2020 of America’s foreign oil imports, or $47.2 billion (see Figure 2).
- However, Partly Free countries at 21 per cent (or $16.2 billion) and Not Free countries at 17.7 per cent ($13.6 billion) still account for a collective 38.7 per cent or nearly $30 billion of American foreign oil imports (see Figure 2).
Sources: US Census Bureau and Freedom House
Conclusion
Maintaining and enhancing North American energy security should be a policy priority for the Biden Administration. Continuing to lower U.S. dependence on crude oil imports from Not Free countries in favour of secure and free Canadian oil continues to be part of that equation.
Cross-border pipelines transport crude oil, bitumen and refined petroleum products between Canada and the United States, and the construction of new projects such as the Line 3 Replacement Project and Keystone XL will be critical to reducing U.S. dependence on Not Free crude oil imports and strengthening North American energy security.
Higher Canadian oil exports twinned with price discounts : How cancelled and delayed pipelines yet hurt Canada
The rise in oil exports to the United States and Canada’s greater share of U.S. oil imports does not mean Canada is “out of the woods” with delayed and cancelled pipelines having no impact on Canadian oil and natural gas producers or the Canadian economy.

First, the lack of pipeline capacity has meant and means a higher price differential between U.S. and world oil (West Texas Intermediate and Brent) and Canadian oil (Western Canadian Select). Second, without new pipelines, Canadian oil must be shipped by other methods such as rail, which means higher shipping costs and thus lower returns for producers. Third, without new pipelines to the west and east coasts for oil exports, Canada is still largely subject to one main export market, the United States.
Lost income for the energy industry
The differential in oil prices between U.S. and world oil (West Texas Intermediate and Brent) and Canadian oil (Western Canadian Select) has been estimated by a number of different organizations in recent years. The following have all accounted for quality differences in the oil (light versus heavy, for example) and other reasons a “natural” differential would exist, and then subsequently arrived at estimates of what pipeline constraints cost Canadian producers.
The differential will wax and wane depending on the year but here are two five-year estimates of the historic cost of the differential once other factors beyond pipeline constraints are excluded, and one forecast.
- In 2019, the Fraser Institute estimated that from 2013 to 2017, after accounting for quality differences and transportation costs, the depressed price for Canadian heavy crude oil resulted in C$20.7 billion in foregone revenues for the Canadian energy industry.
- In 2020, IHS Markit estimated the loss of income for Canadian producers at US$14 billion (between 2015 and 2019 inclusive). IHS called that number “conservative.”
- Looking ahead, in 2019, Alberta Finance estimated that if no additional pipelines came online, Canada would lose more than $43 billion in income due to reduced production and investment between 2019 and 2023, or almost $9 billion per year.
As Scotiabank wrote in 2018, “Pipeline approval delays have imposed clear, demonstrable and substantial economic costs on the Canadian economy.”
Notes
This CEC Fact Sheet was compiled by Lennie Kaplan and Mark Milke at the Canadian Energy Centre (www.canadianenergycentre.ca). The authors and the Canadian Energy Centre would like to thank and acknowledge the assistance of Philip Cross in reviewing the data and research for this Fact Sheet. Image credits: Salmiya, Kuwait by Senuscape on Pexels.com
References (All links live as of February 25, 2021)
Alberta Finance and Treasury (2019). Budget 2019. <https://bit.ly/3aTUf2z>; Fraser Institute (2019). The Cost of Pipeline Constraints Within Canada, 2019. <https://bit.ly/2NYgMCu>; Freedom House (2020). Countries and Territories: Global Freedom Scores. <http://bit.ly/2OAXnb7>; IHS Markit (2020). Canadian Oil Sands Dialogue. <https://bit.ly/3qPQocp>; Scotiabank (2018). Pipeline Approval Delays: The Cost of Inaction. <https://bit.ly/37MuJud>; U.S. Census Bureau (2021). USA Trade Online. <http://bit.ly/3rPTFJ0>; U.S. Energy Information Administration (2021). U.S. Imports by Country of Origin. <http://bit.ly/3pf1FRS>
Creative Commons Copyright
Research and data from the Canadian Energy Centre (CEC) is available for public usage under creative commons copyright terms with attribution to the CEC. Attribution and specific restrictions on usage including non-commercial use only and no changes to material should follow guidelines enunciated by Creative Commons here: Attribution-NonCommercial-NoDerivs CC BY-NC-ND.
Share This:


