


 CDN NEWS |
  US NEWS


There has been much study and prognostication on future supply as well as supply costs within major North American oil plays. Oil and gas development spending across most basins has been notably suppressed since early 2020, but with crude oil benchmark prices marching steadily upwards in 2021, it is not hard to believe that more vigorous capital spending could once again return. In this case study, we put the Lower Cretaceous Viking oil play under the microscope and take a closer look at the evolving picture of well productivity, technology, costs and economic competitiveness that have driven play economics over the past decade.
Stretching from eastern Alberta (AB) into western Saskatchewan (SK), the Viking has evolved into a premiere Canadian light oil play. Like many North American tight/halo oil plays, the play experienced rapid growth in the early 2010’s, peaking in activity at around 1,500 wells per year in calendar 2014 (Figure 1). Drilling activity in 2020 dropped by approximately 60 percent year over year, with the lowest number of rig-released wells in the play since 2009.

Figure 1: Viking Saskatchewan & Alberta – Activity Metrics
Looking through the history of the development activity within the play, an interesting trend can be seen in the Saskatchewan rig-release share of the overall total. Saskatchewan represented about 50 percent of Viking drilling activity in 2009, but that rose to settle at around 80 percent since 2013 where it has since remained. This metric holds true both in terms of annual number of wells rig released but also in terms of annual horizontal meters drilled. This tilt towards Saskatchewan is judged to be in part due to attractive royalty incentives on the Saskatchewan side of the border.
Prior to 2014, half-mile short lateral wells dominated in Saskatchewan. Following 2014 and 2015, longer laterals started to gain traction in the Viking, both in Alberta and Saskatchewan. Prior to 2015 in Saskatchewan, nearly all horizontal development was based on fracture-stimulated half-mile horizontal wells with lateral section lengths averaging around 700m. In 2020 that annual average length has increased to around 1,250m reflecting nearly a perfect bifurcation in approaches between 0.5 mile and 1.0 mile wells. For Alberta earlier in the decade, about 150 wells out of the 2,450 Viking wells in the province were drilled (mainly in the Redwater area) as unstimulated multilaterals with as many as nine legs. In the last couple of years, only a handful of these have been spud and stimulated laterals account for nearly all development activity.
Figure 2 offers some insight as to why companies have moved towards drilling longer laterals in the Viking. Using GLJ’s historical capital cost estimates (including Drill, Complete and Tie-In costs) for both the short laterals (<950 lateral meters) and long laterals (>=950 lateral meters), a cost gap started to emerge in 2014 where longer horizontal wellbores began to enjoy relatively lower development capital costs on a length-adjusted basis compared to their short horizontal peers. It should be noted that capital costs across all Viking well types (similar to most plays) saw a large downward correction in years 2015, 2016 and 2017, following the oil price collapse in late 2014.

Figure 2: Capital Cost Trends Between Long and Short Horizontal Wells
The Viking is far from being a blanket-like play both in terms of geological continuity but also in terms of production forecasting. The complexity and the variability of the play make it an ideal candidate for GLJ IntelliCasts™, GLJ’s latest subscription product (GLJ IntelliCasts™ | GLJ (gljpc.com)). IntelliCasts provides both the raw and sales product forecasts, including Estimated Ultimate Recoverable (EUR) volumes for both field and plant products that are referenced here.
Figure 3 illustrates the result of a clustering process that aggregates wells into defined play groupings that exhibit common behaviour traits. This process ensures that IntelliCasts provides optimized automated forecasts that are relevant and reliable. The clustering confirms that substantial differences in production decline characteristics exist across the Viking play, and thus we should not be tempted to apply a simplified generic “type curve” approach in production forecasting workflows.
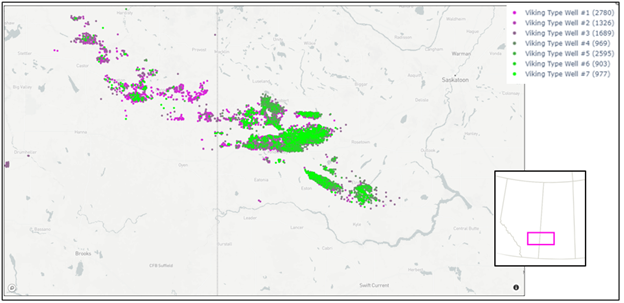
Figure 3: K-means clustering – identification of common Arps b, D, and GOR profile traits

Figure 4: Viking Inter-well spacing density plot
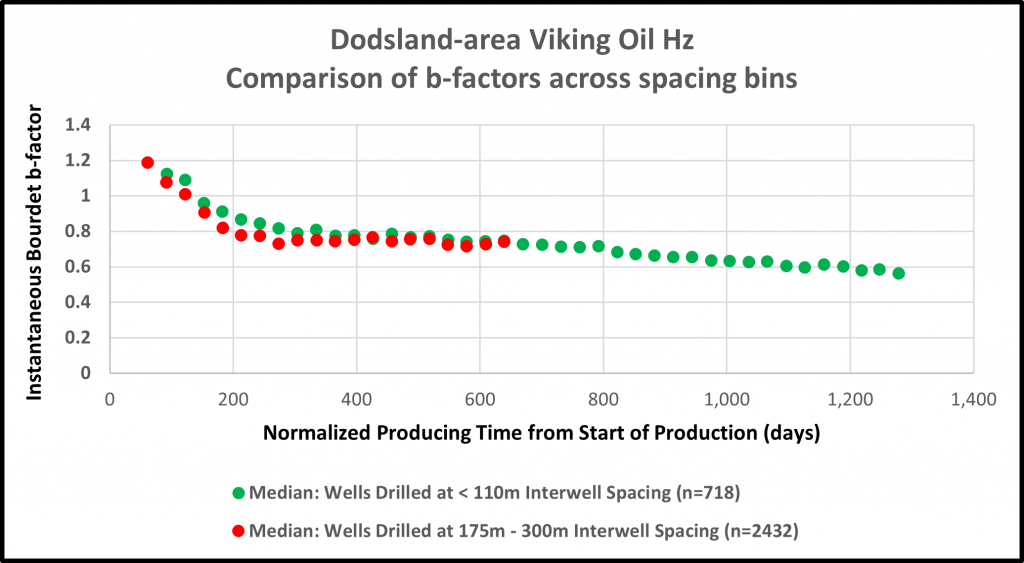
Figure 5: Normalized Arps b-factor timeseries trend comparison
The trend towards longer lateral wellbores in the Viking has resulted in generally higher initial production (IP) rates on a per-well basis, both in Alberta and Saskatchewan (Figures 6,7). The trend in GLJ IntelliCasts forecast EUR is also very encouraging. The data suggests that, while per-meter EUR is not necessarily staying whole as wells get longer, the longer wellbores are still managing to achieve higher EURs overall.

Figure 6: Viking Alberta – Initial Productivity Rate & EUR Trends

Figure 7: Viking Saskatchewan – Initial Productivity Rate & EUR Trends
By applying IntelliCasts EUR P50 forecasts for each well and leveraging GLJ’s machine learning modelling for capital expenditure estimates, normalized Finding and Development Cost (F&D) measures can be estimated and plotted on a heatmap (Figure 8). From this volume cost analysis, clear regionally correlated patterns emerge, which can be interpreted as being influenced by variance in both the EUR and capital costs. Looking at the same F&D dataset in timeseries (Figure 9), there is substantial dispersion and variations between operators, but it is noteworthy that the central tendency of Viking costs has remained in the $20-$25/boe range from 2016 through to present. In other words, aggregate Viking costs remain as low as they have ever been.
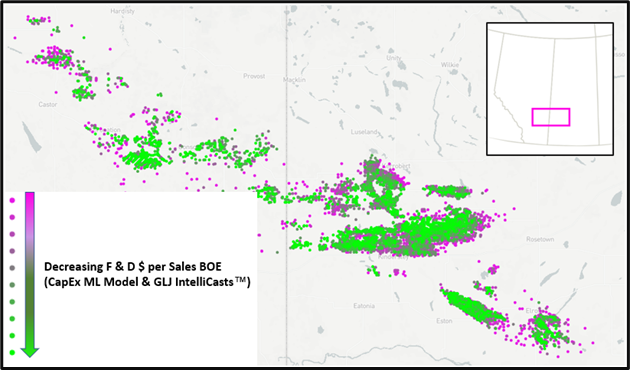
Figure 8: Map of half-cycle finding & development costs – Viking Formation – Horizontal Wells

Figure 9: Timeseries trends in Viking per-well finding & development costs
Having reliable well forecasts that are anchored in play-specific parameter constraints is a key prerequisite to informed decision making. Whether your investments are focused on the drill bit or through acquisition, GLJ IntelliCasts allows you to rapidly fill in data gaps, assess uncertainty and be responsive to opportunities that arise. IntelliCasts provides value-added insights that allow subscribers to spend their time making confident data-driven decisions for their businesses.
For more information on GLJ IntelliCastsTM, please visit our website: https://www.gljpc.com/intellicasts
![]()
Share This:


COMMENTARY: Ontario and Alberta Governments Should Not Moonlight as Energy Companies on Taxpayer Dime