


 CDN NEWS |
  US NEWS


![]()
By Susan James
Stress Engineering Services (SES) helps pipeline operators across North America assess their line’s integrity and resiliency through Finite Element Analysis (FEA). This evaluation includes determining safe operating limits and/or mitigation strategies for cases where the established acceptance criteria is exceeded at identified points of concern along the pipeline. This work has become a specialty of SES, and we have developed an effective and efficient approach to this analysis—but what makes our method superior?
Optimization Through Automation
SES knows that complex problems require complex and sophisticated solutions, and we also know that efficiency of engineering hours brings value to our Clients. Our team has therefore developed a suite of automated pipeline software tools that drives the optimization of pipeline stress/strain analysis.
From Client-provided pipe tally and/or in-line inspection (ILI) data, SES rapidly creates a full-length, cross-country digital representation of your pipeline and, from this, automatically generate models for stress and strain-based analysis. After completing the analytic stage, the model results are extracted, and code stress calculations are automatically performed. Finally, an image-based file is generated, which translates a wealth of information into a clean and concise visual , ready to share with your team. Altogether, this means a faster turnaround and a higher quality product.
A Picture is Worth a Thousand Spreadsheets
At SES, we appreciate fine detail and simplicity of presentation. Our Clients need something simple to interpret that can be easily shared with a multidisciplinary audience. For this reason, we have incorporated satellite imaging into our final product, creating an all-encompassing visual presentation of key pipeline data and analysis.

Clients can see our analytical results and their pipe tally/ILI data overlaid in the context of their pipeline’s right-of-way. Stress and strain gradients and critical locations can be filtered for quick interpretation, and pipeline properties such as yield strength, pipe diameter, wall thickness, and soil profiles can be presented at a click of a button.
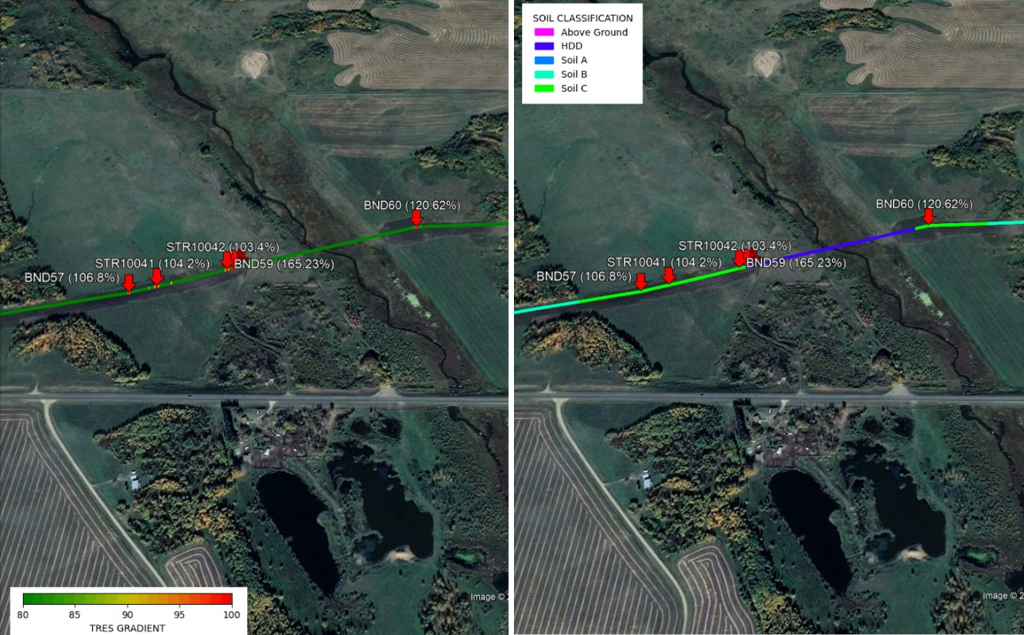
By combining the final analytical results with satellite images, the data is brought into the context of the landscape and surrounding features. Clients can visually assess the “what”, “where”, and “why” of each point of concern – something that is not easily portrayed in a spreadsheet.
Pipeline Analysis: The SES Approach
SES knows pipelines, and we know that you need accurate, effective, and efficient analysis. Developed with these needs in mind, our methodology facilitates the efficient and effective decisions required to inform new design or determine the need to repair, rerate, or replace key assets. Through optimization and visualization, the SES approach saves time and money for our Clients.
For more information about Stress Engineering, please visit www.stress.com or contact Tom Raptis at [email protected];
Share This:


AI INSIGHT: Can Alberta Become the Compute Capital of Canada? – Maureen McCall