


 CDN NEWS |
  US NEWS


![]()
The EFMP
The old adage that you can’t manage what you don’t measure is true, nor can you measure just once and manage forever. The EFMP (Environmental Footprint Monitoring Platform) measures project’s key environmental indicators for your project over the complete lifecycle of the project. The first step is to measure the environmental indices for your project area over the last 40 years of medium resolution satellite imagery. High resolution imagery is also available for the last twenty years*. Going forward, the monitoring frequency is client specific. You can update your environmental measures once or twice a year or, starting in 2021, up to 15 times a day** (see Maxar Legion).
The EFMP was developed to address customer’s needs for actionable information from their monitoring programs. The EFMP provides organizations with a comprehensive view of the project footprint, enhanced safety, and cost effectiveness. Benefits include:
- Reduced time, resources, and costs related to environmental monitoring
- Assist in monitoring and verifying reclamation and project environmental goals
- Generate valuable information on encroachments of vegetation or infrastructure
- Have access to the latest satellite images for reference (Figure 1)
- Provide “big picture” analysis of entire project area
- Focus ground testing on areas of highest interest
- Compare environmental indicators pre-, during, and post-development
- Generate reports on demand
The EFMP indices have been validates through working with two partners, one in mining and one in oil and gas.
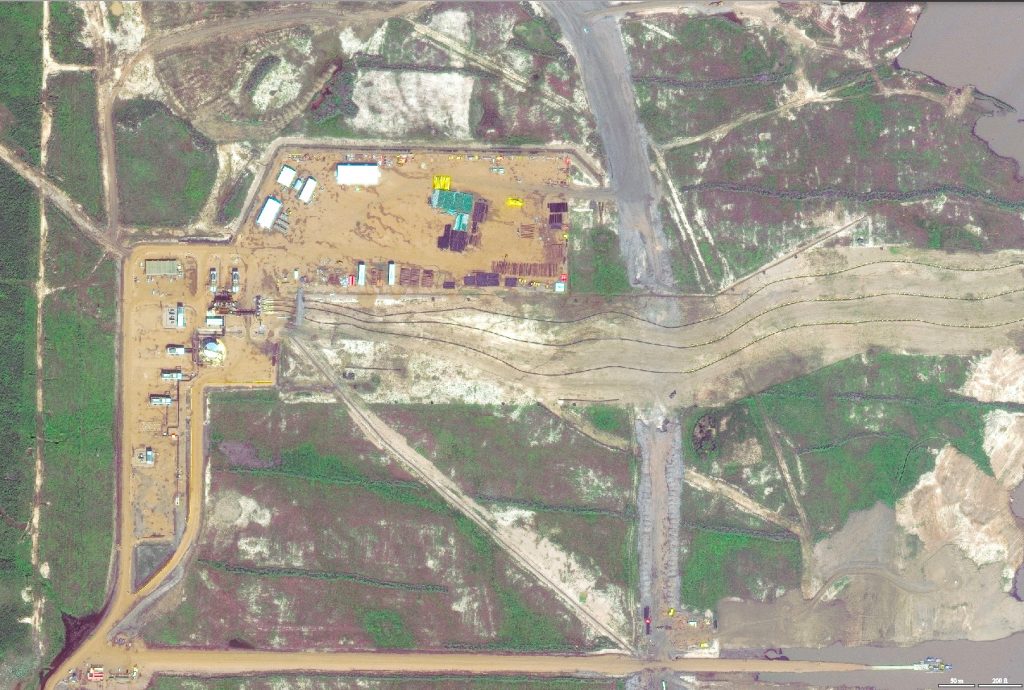
Figure 1: Imagery downloaded from the EFMP
Case Study: Surface Water
In much of the prairies, small sloughs hold significant volumes of water. The quantity of water can very substantially over a single year from over full to bone dry. Given this variability, what is the impact of oil and gas activities? Figure 2 shows the percentage of time that the land in this area was covered by water over the last 30 years, measured by Landsat passes.
The EFMP comes with a well validated water depth model. Since we can also map the surface area, the model can calculate the overall volume. On every satellite pass, the water volume of every slough on the image is automatically calculated. This volume can be compared year to year, season to season, to assess whether the development is having an impact. The volume of surface water can also be cross correlated with local climate data.

Figure 2. Percentage of time that land is covered by water
What about water quality? That is a broad area of inquiry but, in general, it is possible to model some water quality measures such as turbidity. An example would be algae or aquatic vegetation — these can be seen from space. In working with a potash mine, one of the indicators of interest was salinity, and salinity is not visible in optical imagery. A proxy model was developed which utilized the absence of turbidity (less algae in salty water) and the surrounding vegetation community. The one drawback with proxy models, such as the salinity model, is that while they can be quite accurate, they often need to be adjusted for each project area.
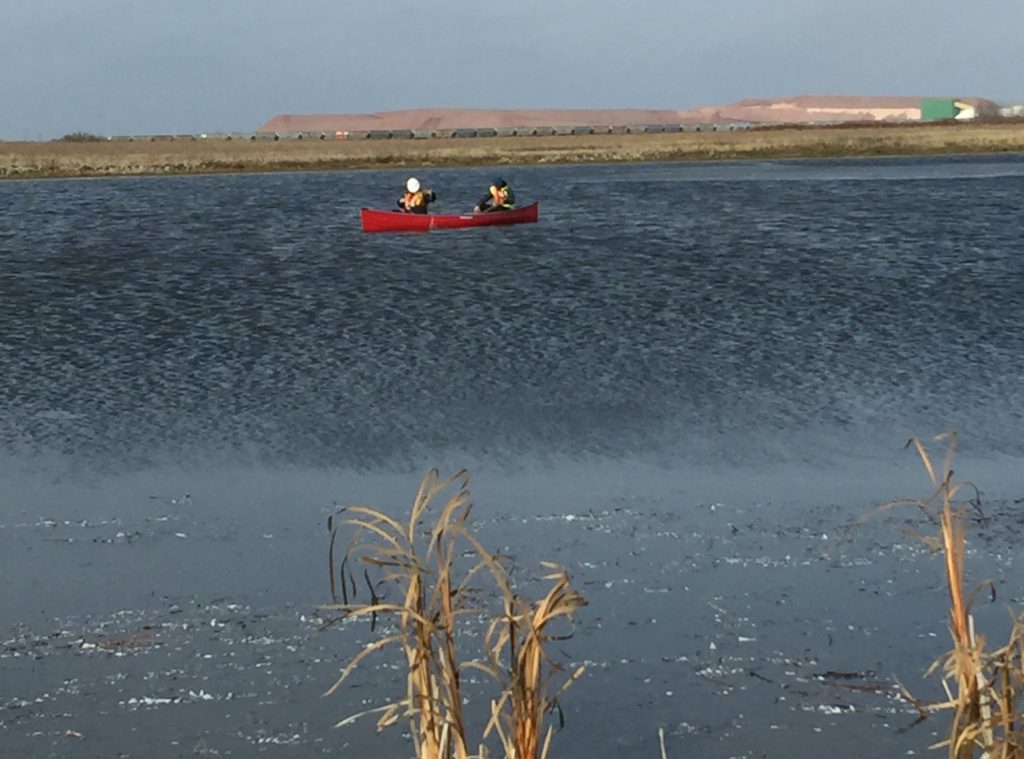
Figure 3. Validating the water variables
Summary
The EFMP provides a cost-effect method for monitoring environmental changes associated with your development. The use of historical imagery often allows for monitoring pre-development to construct a reliable baseline. This data can also be used in forward modelling specific climate impacts. The customers own all of the underlying data used in each EFMP application.
The cost/benefit of using the EFMP for a single wellsite is skewed towards cost, although the EFMP can be utilized. The platform works well for a group of wellsites and easily scales to a specific field or to basin wide monitoring. It can also accommodate linear developments such as pipelines.
Figure 4 shows an example of monitoring a pipeline with medium resolution imagery, in this case a significant pipeline spill from 2011. Both images show a NDVI rendering rather than natural colour and the pixel resolution is 30 m. The red circle on the image is approximately 1.5 km in diameter.
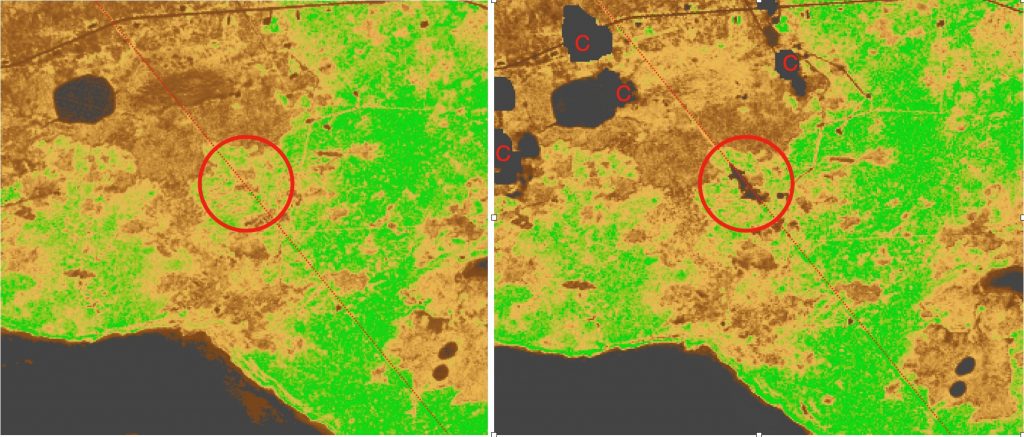
Figure 4. Pipeline spill in Alberta. The figure on the left is from 2010, the figure on the right is from 2010. The 2011 image has more clouds which are marked with a c.
All of the current development work on the EFMP is focused on automating data management and analysis. As the data volumes continue to rise, so does the need for automation and machine learning. For additional information please visit www.footprintmonitoring.com or email [email protected]. The following video describes some of the features of the EFMP.
![]()
* Coverage for high resolution satellites is spotty the further back in time you go while medium resolution satellites have more consistent coverage
** the number of daily visits varies with latitude
Share This:


COMMENTARY: Can Alberta Become the Compute Capital of Canada? – Maureen McCall