


 CDN NEWS |
  US NEWS


Updated by Mark Milke and Lennie Kaplan
Follow CEC on Linkedin CEC Linkedin
Follow CEC on Facebook CEC Facebook
Follow CEC on Twitter CEC Twitter

Russian President Vladimir Putin (L) shakes hands with Saudi Deputy Crown Prince and Defence Minister Mohammed bin Salman during a meeting at the Kremlin in Moscow on May 30, 2017. Getty Images photo
Oil, natural gas, and freedom rankings
This fact sheet (which can be downloaded here as a pdf) examines worldwide oil and natural gas production and market share over four decades for countries in three categories: nations (or territories) that are Free, Partly Free, or Not Free. The freedom rankings are from Freedom House, a Washington D.C.-based think tank which has measured and ranked countries and territories by their degree of freedom since 1973.¹ The data on oil and natural gas production are from the U.S. Energy Information Administration (EIA), a U.S. government agency.
Tyrannies and energy production
The use of tyranny in the title of this Fact Sheet is a nod to the dictionary definition where one categorization of tyranny is ‘oppressive power’ and especially as ‘oppressive power exerted by government.’ In essence, “Not Free” and “tyranny”—while not always interchangeable—overlap enough for our purposes: to give readers a sense of where oil and natural gas production occurs and under what type of regime.
This matters for a variety of reasons. As the data show, there is a shift to higher proportions of oil and gas production in countries that are dictatorial and authoritarian. The result is that the money consumers pay for oil and natural gas is increasingly directed to Not Free regimes that can then use energy revenues to suppress their own people and/or where substantial revenues flow to regime leaders. This is the case in Russia,² Saudi Arabia,3 and Venezuela4 among others.
Also, Not Free regimes can wield significant power over the supply of oil and natural gas exported to vulnerable populations. This occurred in 2009 when Russia cut natural gas supplies to Ukraine in mid-winter over a pricing dispute. In other instances, they can dramatically manipulate prices on the world market beyond what would occur in a normal economic “boom” or “bust.” On the latter, price manipulation, Saudi Arabia—a major oil producer where the government owns most of the dominant energy company (Saudi Aramco)—can influence the world oil market to an immediate degree not possible in countries that are Free, where multiple competing energy companies exist and where manipulation of prices in any direction is circumscribed by anti-collusion laws.
This state-directed dynamic was obvious in late February when Saudi Arabia’s energy ministry directed Saudi Aramco to significantly raise production and thus flood the world market with oil. The action was to ostensibly punish Russia for not decreasing its own production. The action contributed to a 73 per cent drop in the price of Western Canadian Select oil by March 2020 (compared with March 2019), as Saudi Arabia’s action occurred at the same time as demand destruction due to the Coronavirus pandemic. Affected governments in North America will see a dramatic decline in revenues as a result of the artificially-created drop in prices by two Not Free countries, i.e., Saudi Arabia and Russia.
Saudi Arabia has taken similar actions before, in 1986 and 2014. In each case, energy companies in democracies were severely disrupted to the point of economic extinction, as is again occurring in Canada and the United States. When an autocracy or dictatorship has significant leverage over a product, other countries dependent on that product can be severely and negatively impacted.5
With that context, we examine comprehensive production data for petroleum and other liquids and dry natural gas (“oil” and “natural gas” for our purposes). We match up the data from the EIA and Freedom House to track whether the proportion of oil and natural gas controlled, directly or indirectly, by Not Free countries—such as Saudi Arabia, Russia and Venezuela—is increasing or decreasing.
Oil 1980-2019: Rising share of production in Not Free countries
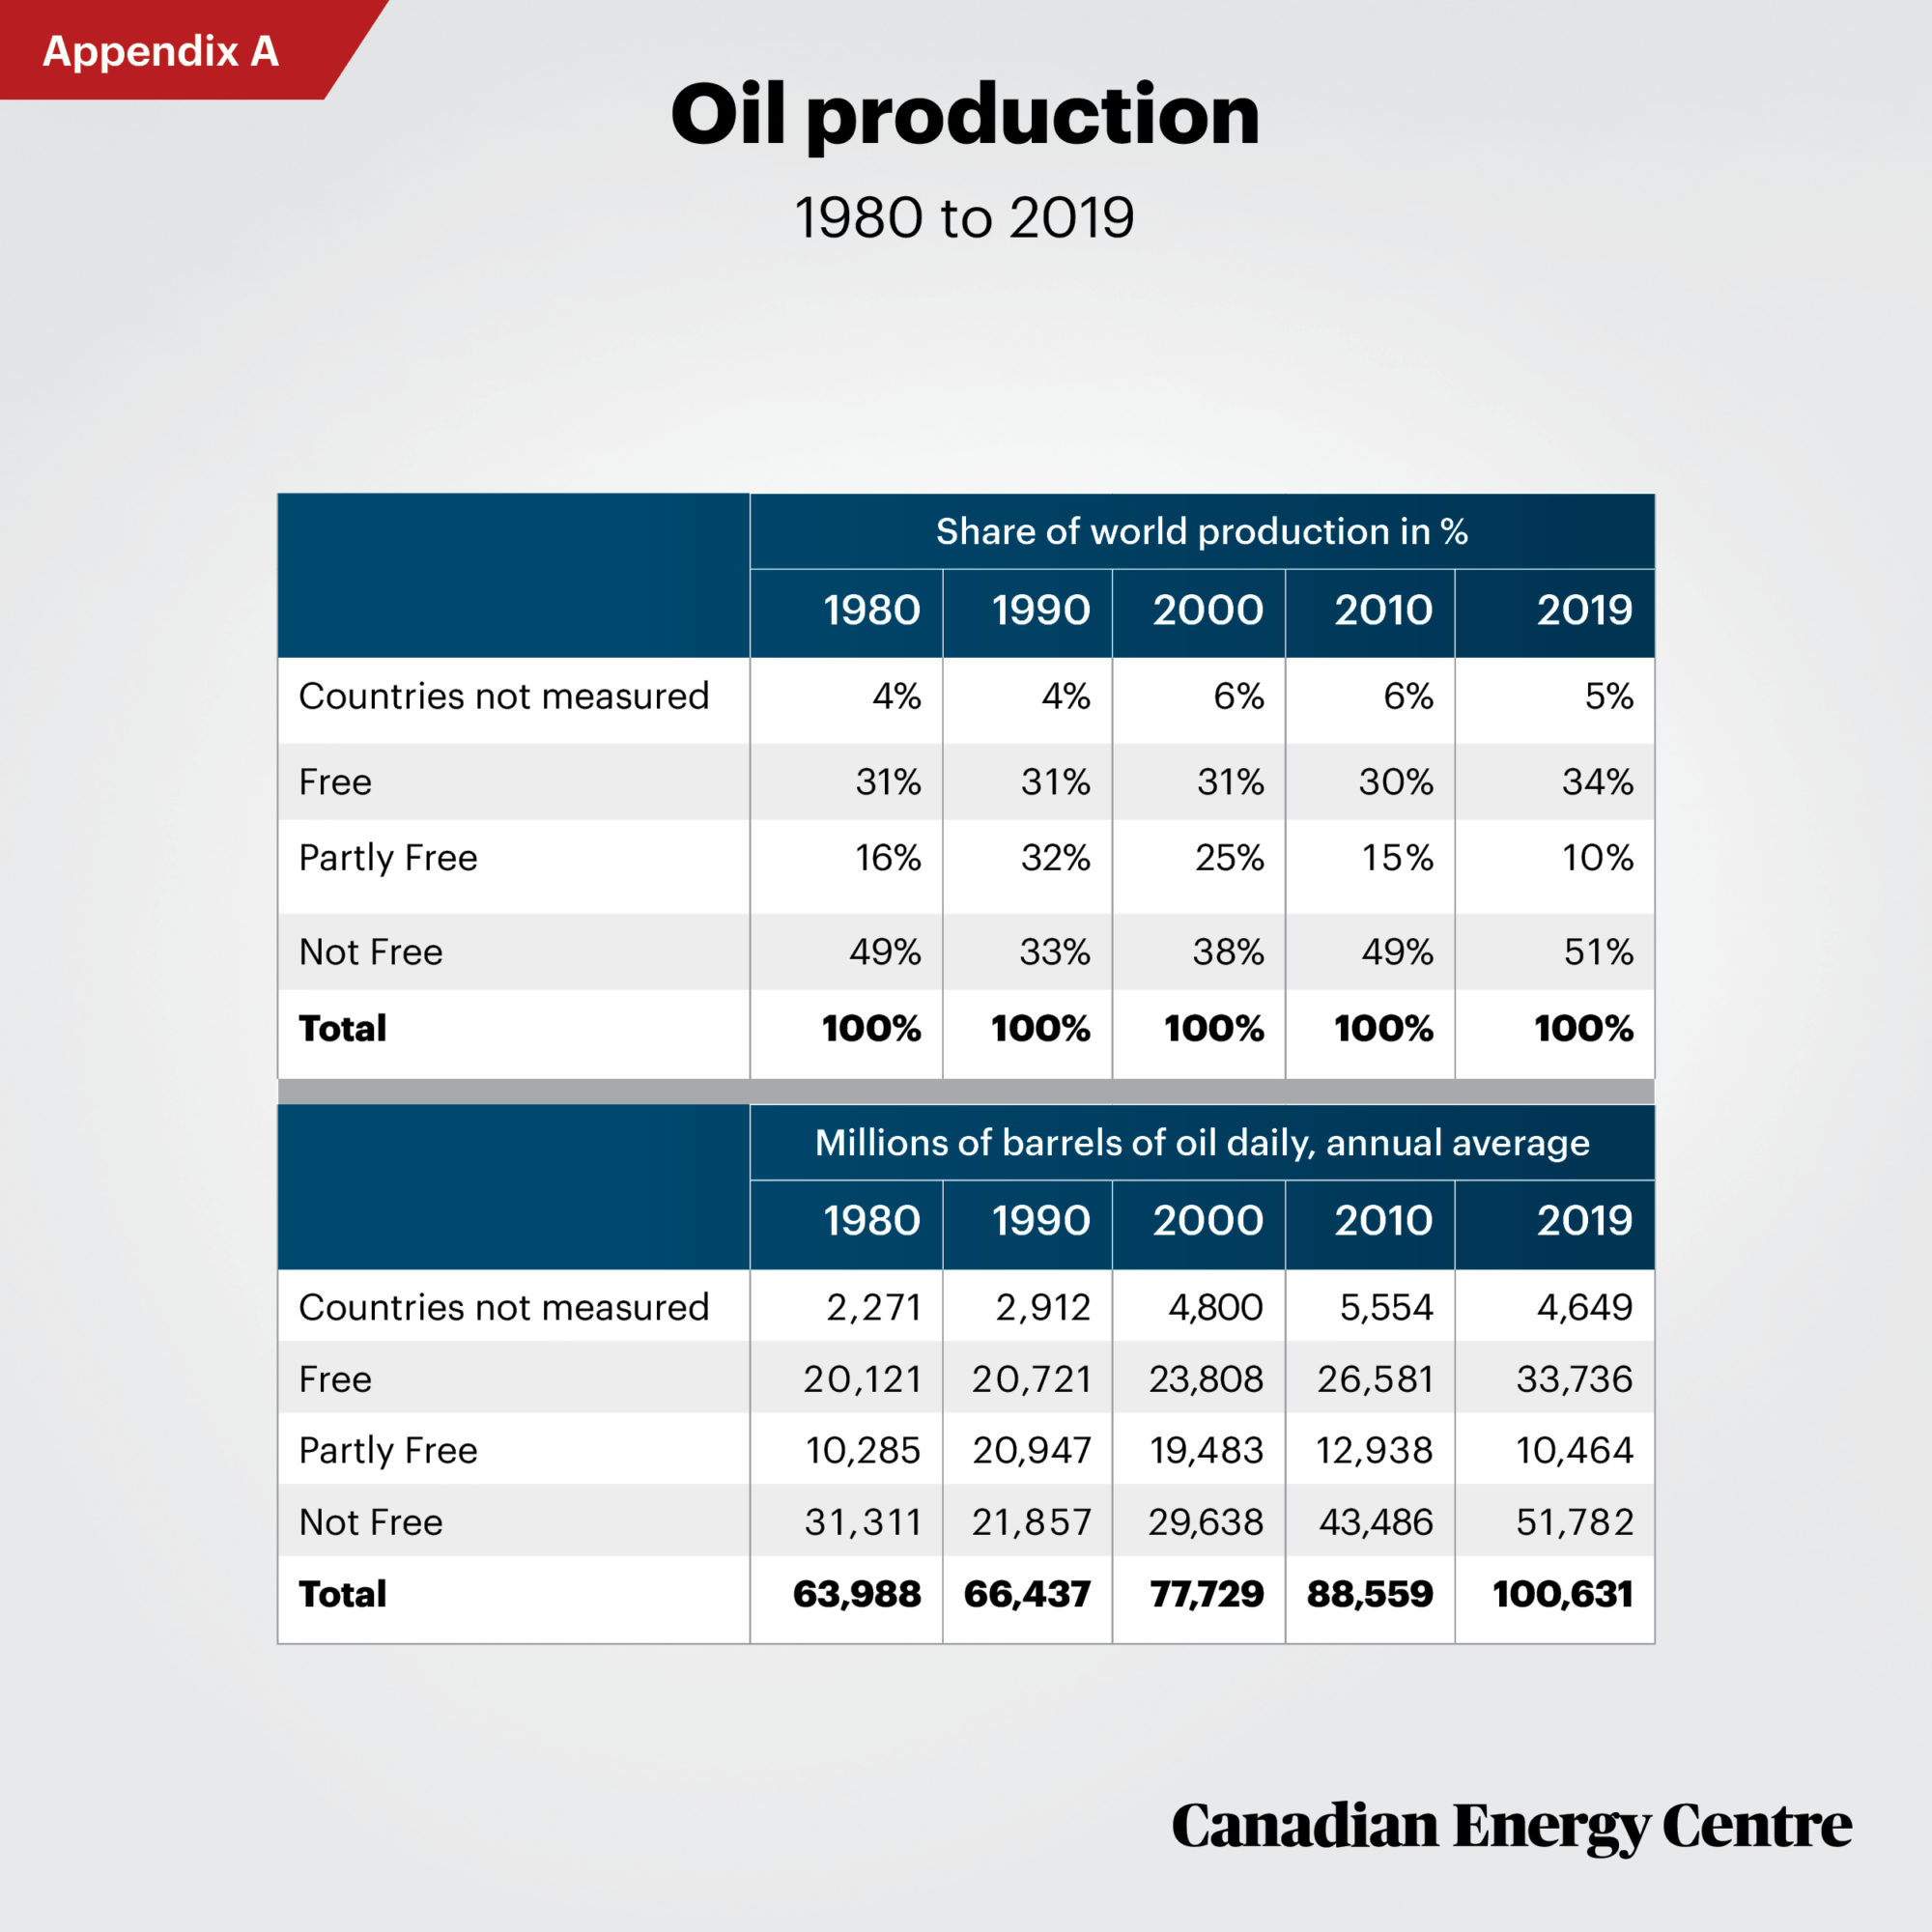
For oil comparisons (Figures 1 and 2), those countries with more than half-a-million barrels of daily production (based on annual averages) in at least one year between 1980 and 2019 were matched with their Freedom House ranking. Countries with less than 500,000 barrels of daily production were not collectively ranked and fall into the “Not Measured” category. Proportions measured by freedom category thus ranged from 94 to 96 per cent of all oil production depending on the year.
1. Freedom House’ definition of freedom and system of rankings is available on its website at About Us. We use three Freedom House rankings— Free, Partly Free, or Not Free—to group oil and gas producing countries collectively. The “data + ranking” match is given for every ten-year mark with the exception of 2019 which is the most recent year available for oil and 2017 for natural gas.
2. GAN Business Anti-Corruption Portal on Russia: “The economy suffers from graft and a misuse of billions of dollars in public revenue from energy sales; however, the government shows little intention of fighting the issue and is oftentimes a beneficiary.”
3. Transparency International on Saudi Arabia: “Notably, almost total opacity in public accounting prevents ordinary Saudis from understanding how much of the state income generated by massive oil revenues ends up as private wealth for the royal family and its clients.”
4. Transparency International on Venezuela: “Instead of fulfilling the social and economic rights of millions of citizens for which huge sums of public funds were allocated in a decade of high oil prices, the efforts went to lining pockets.”
5. For a fuller discussion, see the Atlantic Council’s essay by Daniel Fried, “Russia gas Pipeline Sanctions: A Way Ahead,” published in December 2019.
Sources: Freedom House. Countries and Territories: Global Freedom Scores. U.S. Energy Information Administration, International Statistics. Percentages may not add to 100% due to rounding
Some observations from the data:
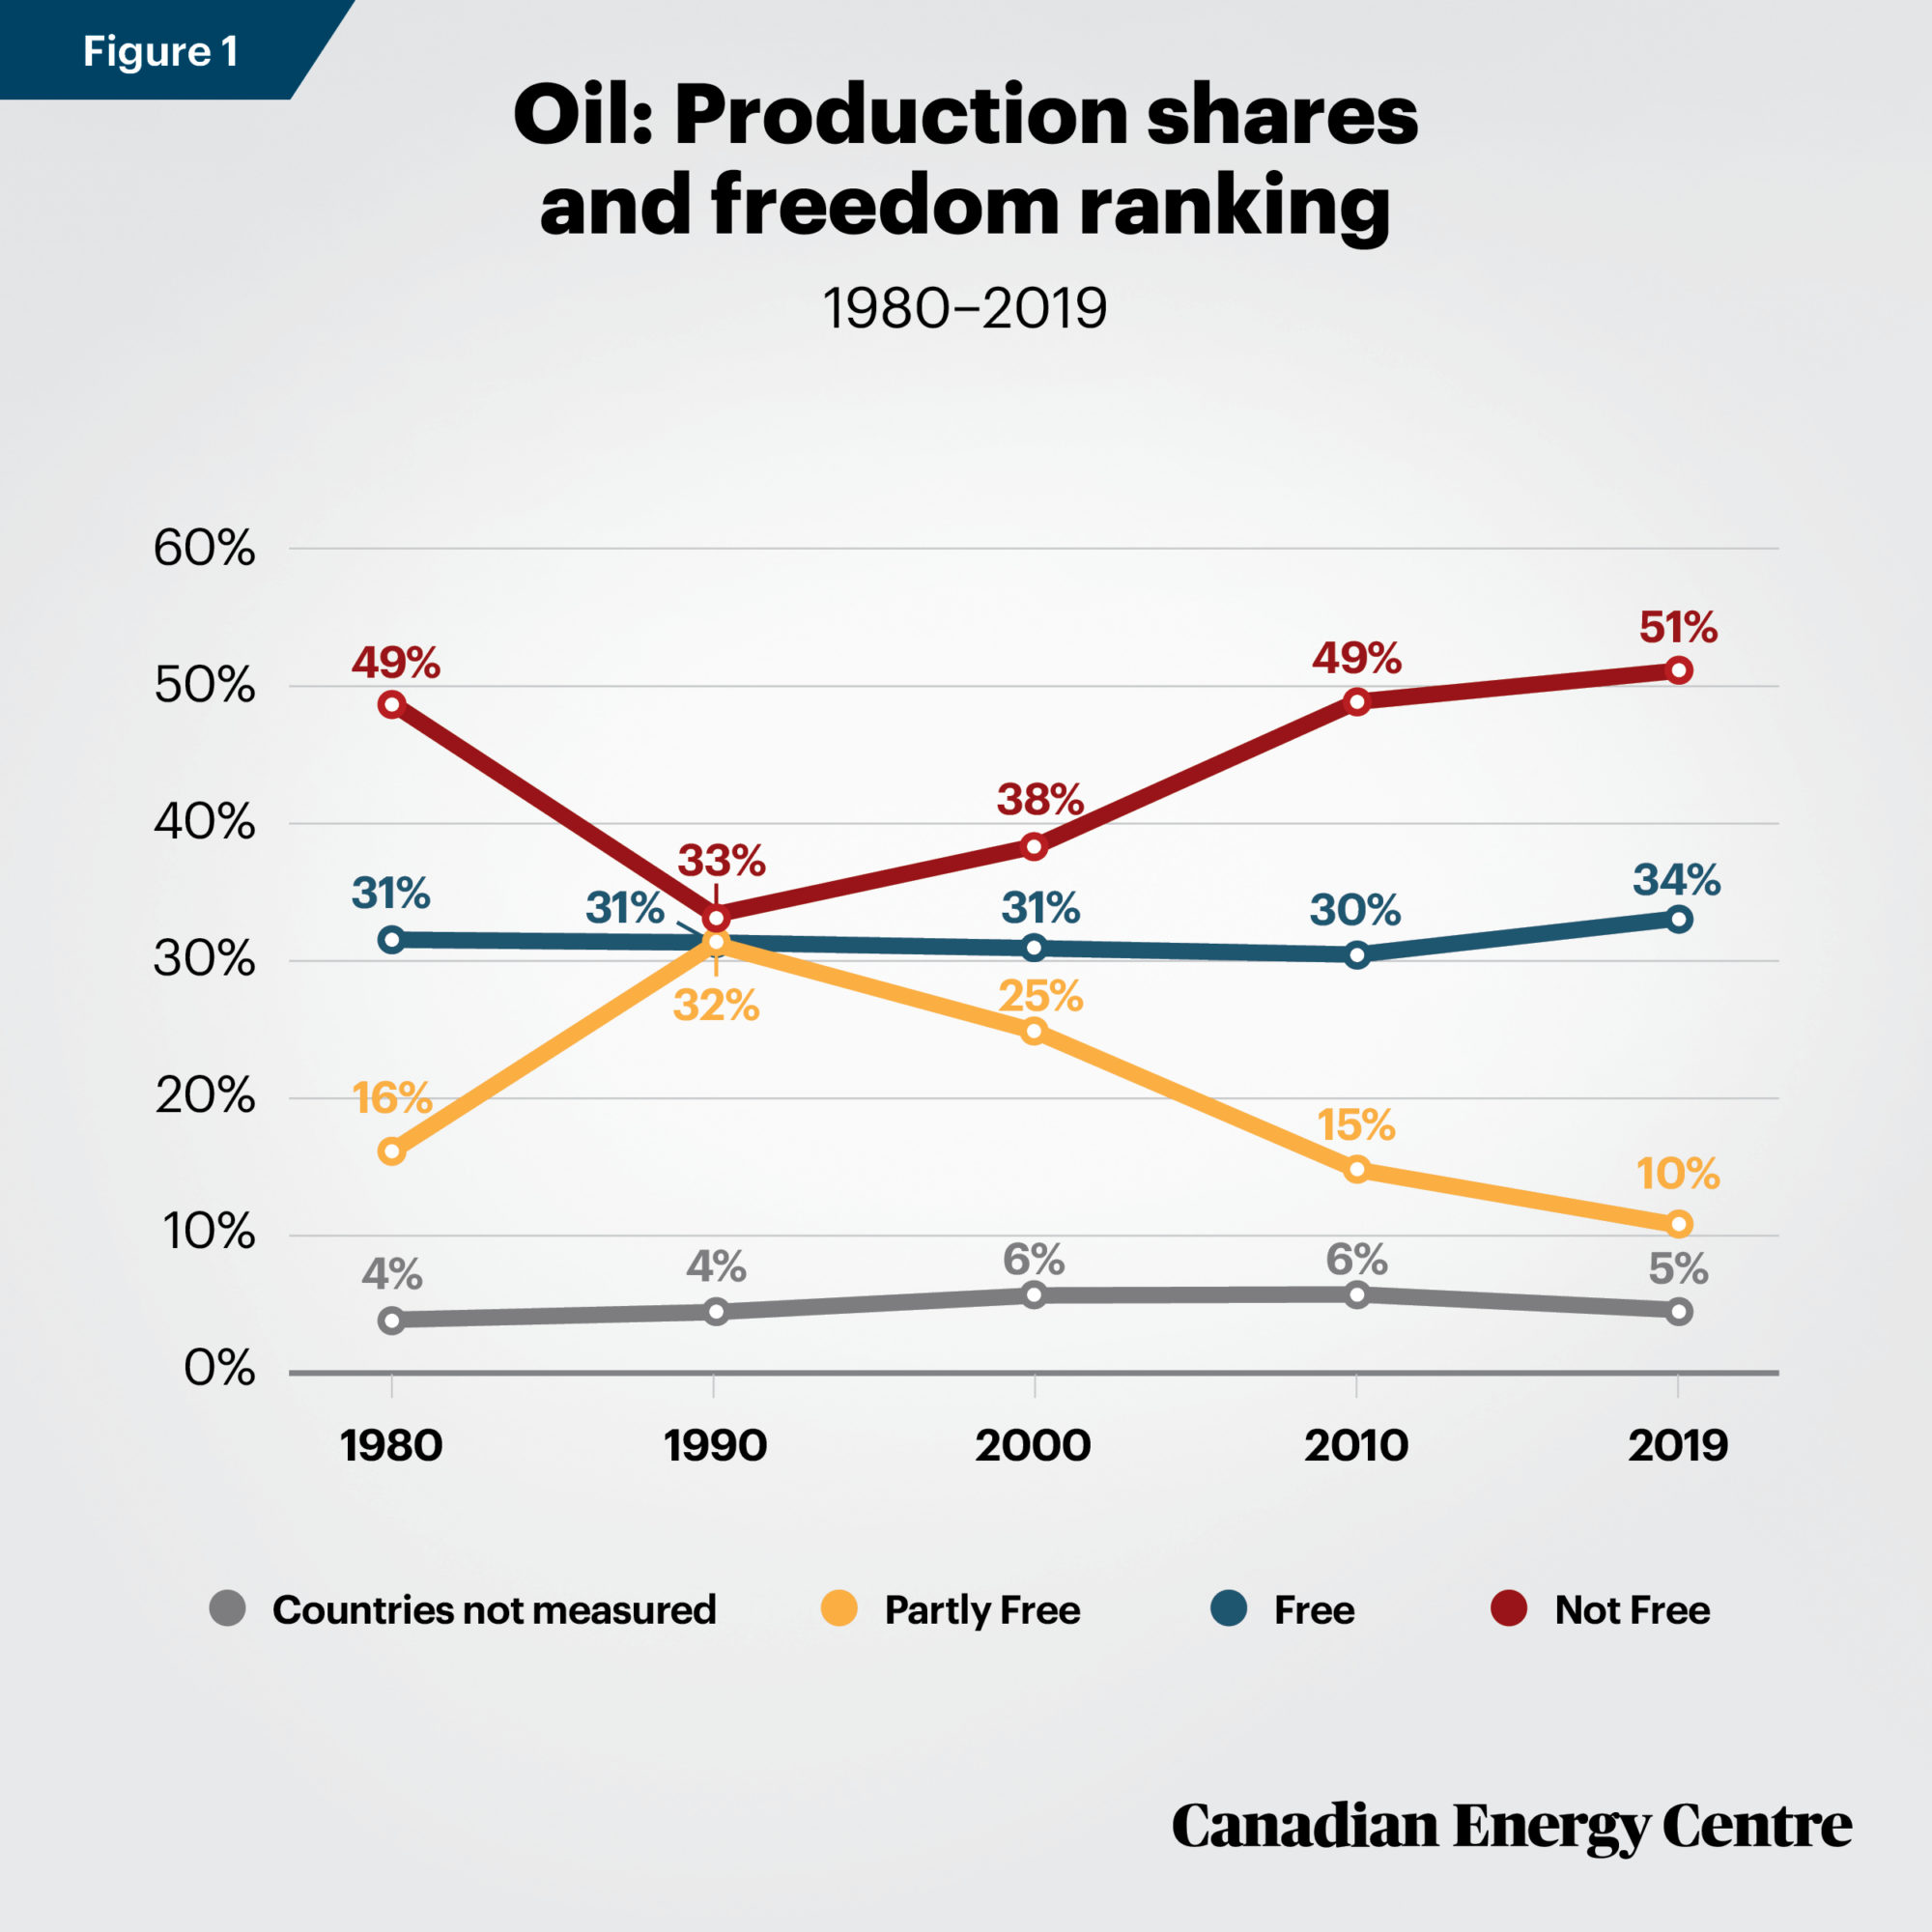
- In 1980, 49 per cent of the world’s oil production (an annual average of 64 million barrels per day) occurred in countries that Freedom House ranked as Not Free, compared with 31 per cent in Free countries and 16 per cent in Partly Free countries. Four per cent were not classified (by CEC) given their minimal production.
- Production in Free countries was proportionally stable at between 31 and 34 percent over the whole period.
- The low-point for the share of oil production by Not Free countries was in 1990. This was partly due to the opening up the Soviet Union and eastern and central European countries in the late 1980s and continuing into the 1990s. In 1990, countries such as the Soviet Union, which were formerly classified Not Free in 1980 were categorized as Partly Free. However, by 2010, Russia, the dominant successor state to the Soviet Union, moved from Partly Free (in 2000) back to the Soviet Union’s 1980 ranking: Not Free.
- Over time, other major oil-producing nations also saw their freedom rankings change. For example, Venezuela was categorized as Free in 1980 and 1990; Partly Free in 2000 and 2010; and Not Free in 2019. This added to the increased proportion of Not Free-producing countries’ oil production share.
- The proportions attributed to the three categories also changed due to a rise or fall in oil production in countries whose freedom rankings were stable. For example, Norway’s oil production in 1980 averaged 529,000 barrels per day, over 3.3 million in 2000, and 1.7 million barrels per day in 2019.
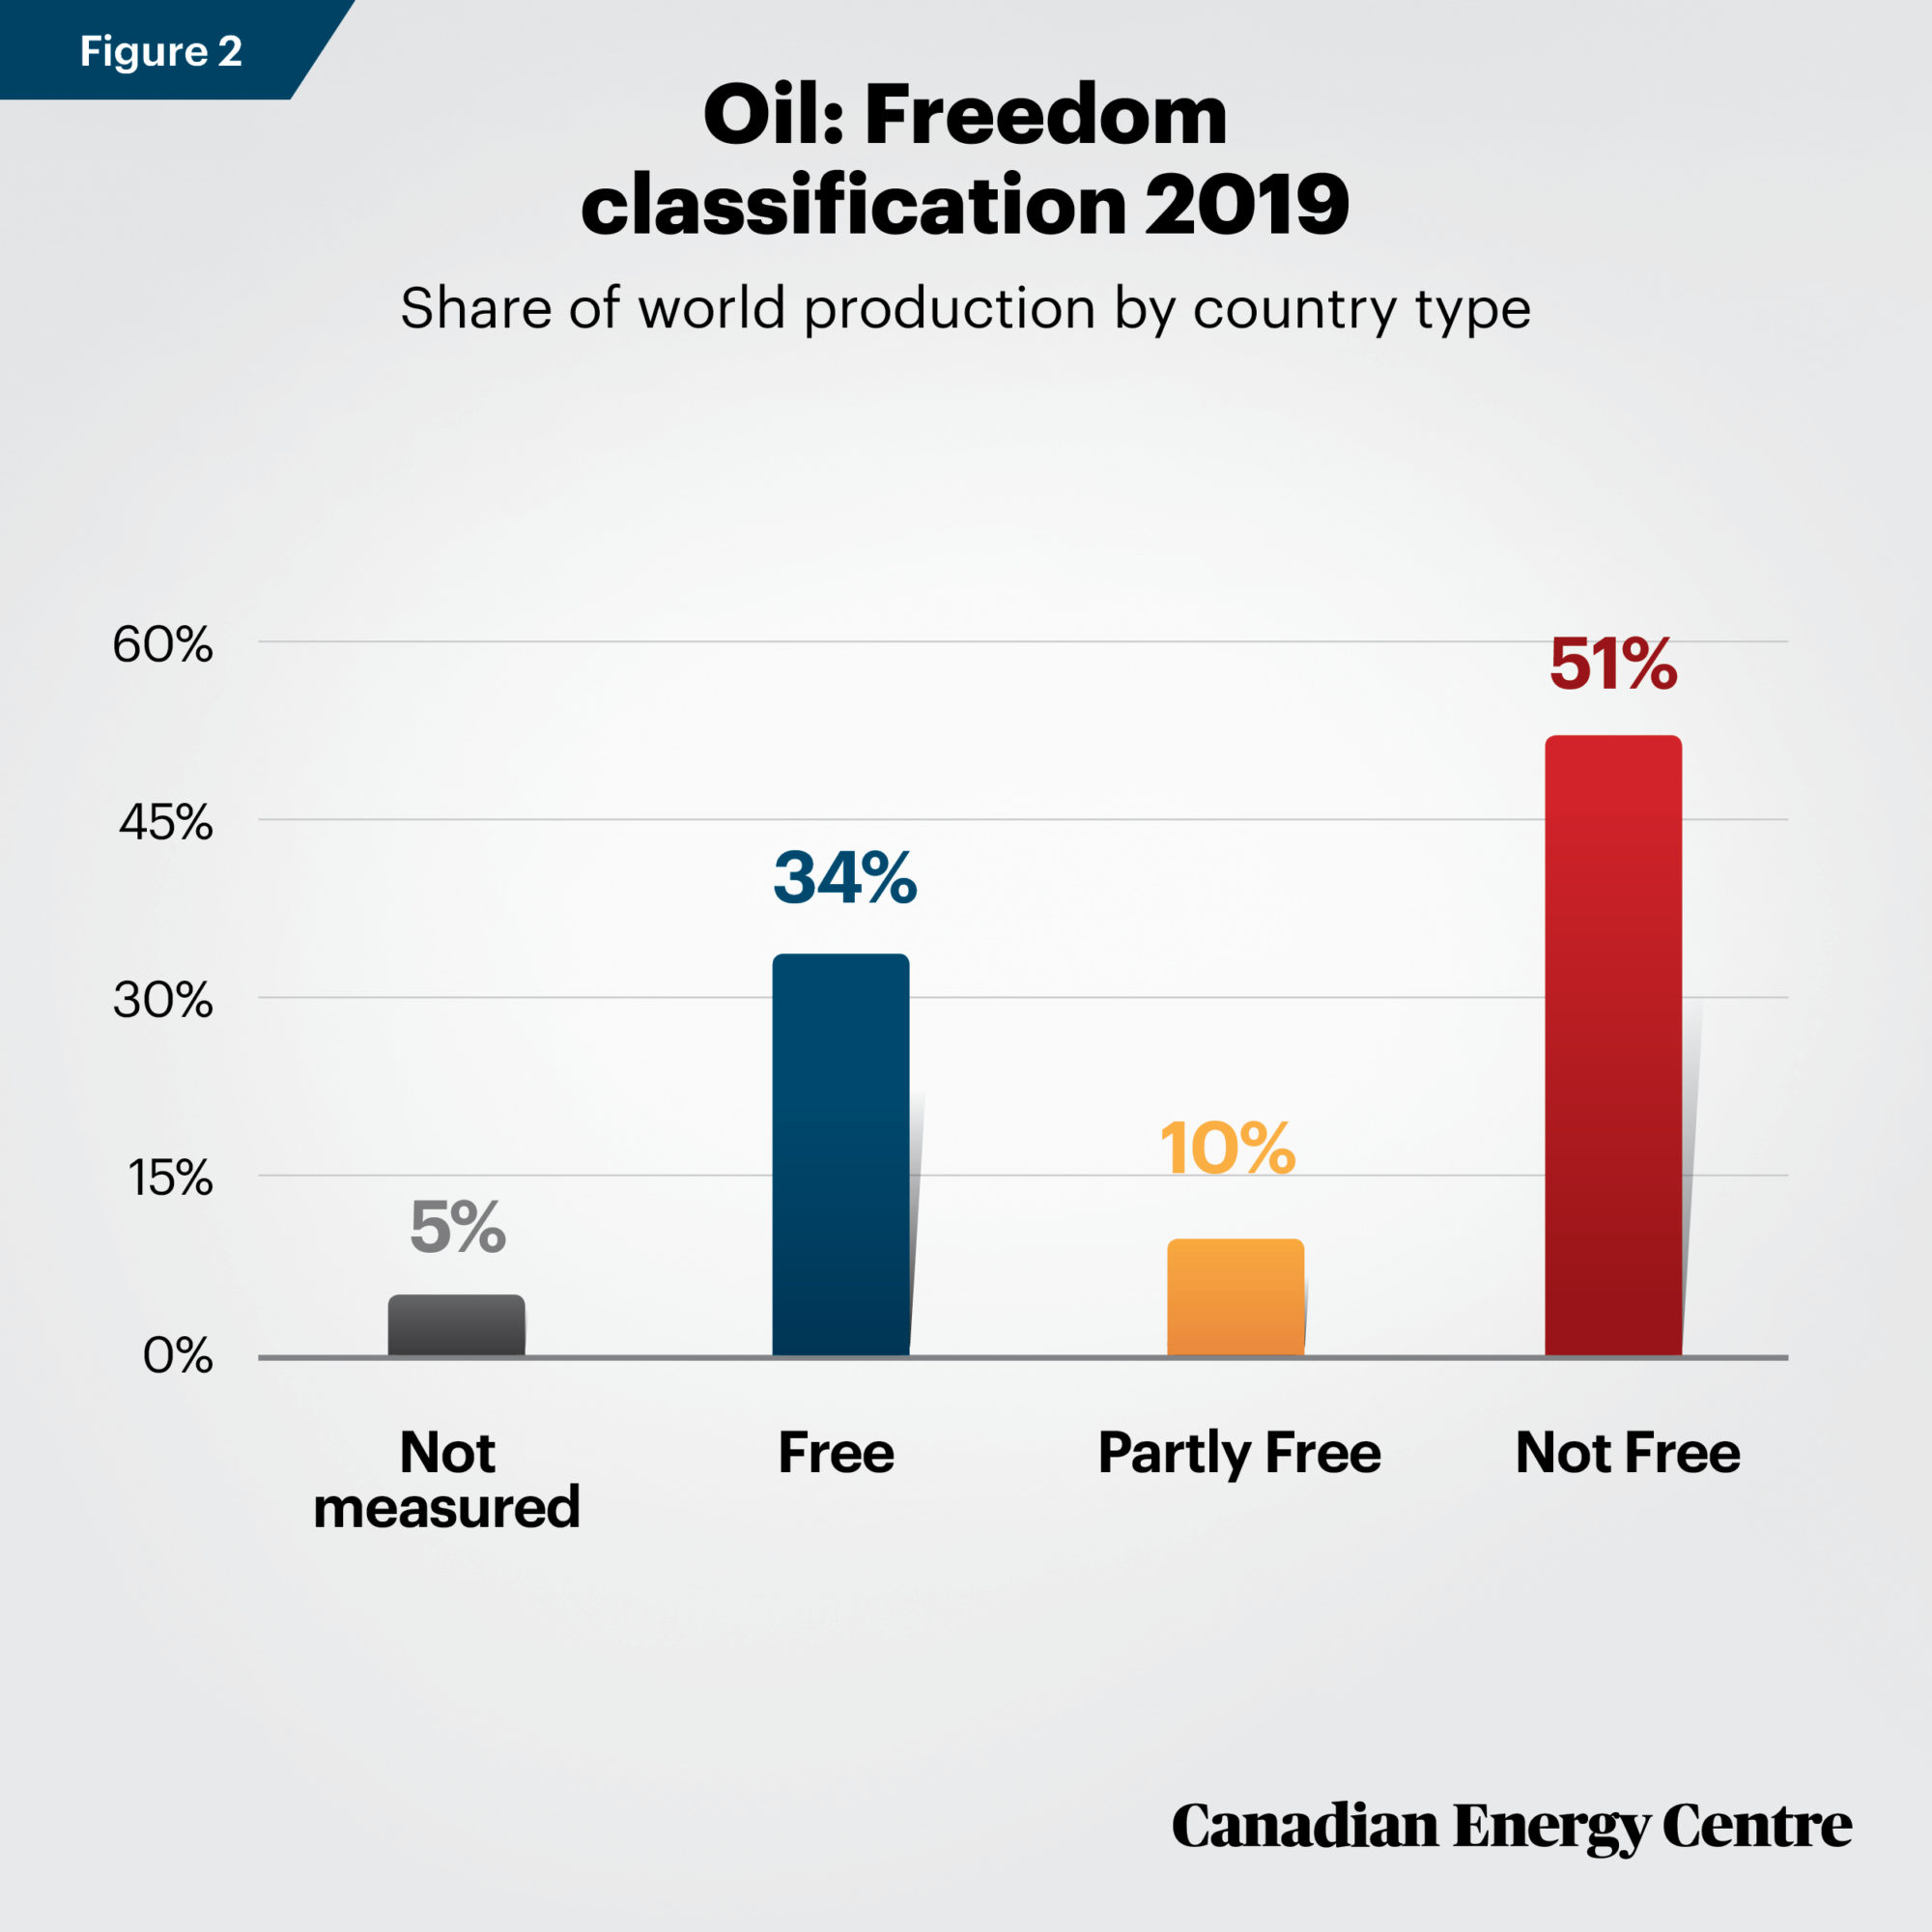
- By 2019, Not Free nations including Saudi Arabia, Russia, China, the United Arab Emirates, Iran, Iraq and others produced 51 per cent of the world’s 100.6 million barrels of oil per day. (Figures 1 and 2). This was the highest percentage in any year.
Sources: Freedom House. Countries and Territories: Global Freedom Scores. U.S. Energy Information Administration, International Statistics. Percentages may not add to 100% due to rounding.
Natural gas 1980-2017: Rising share of production in Not Free countries
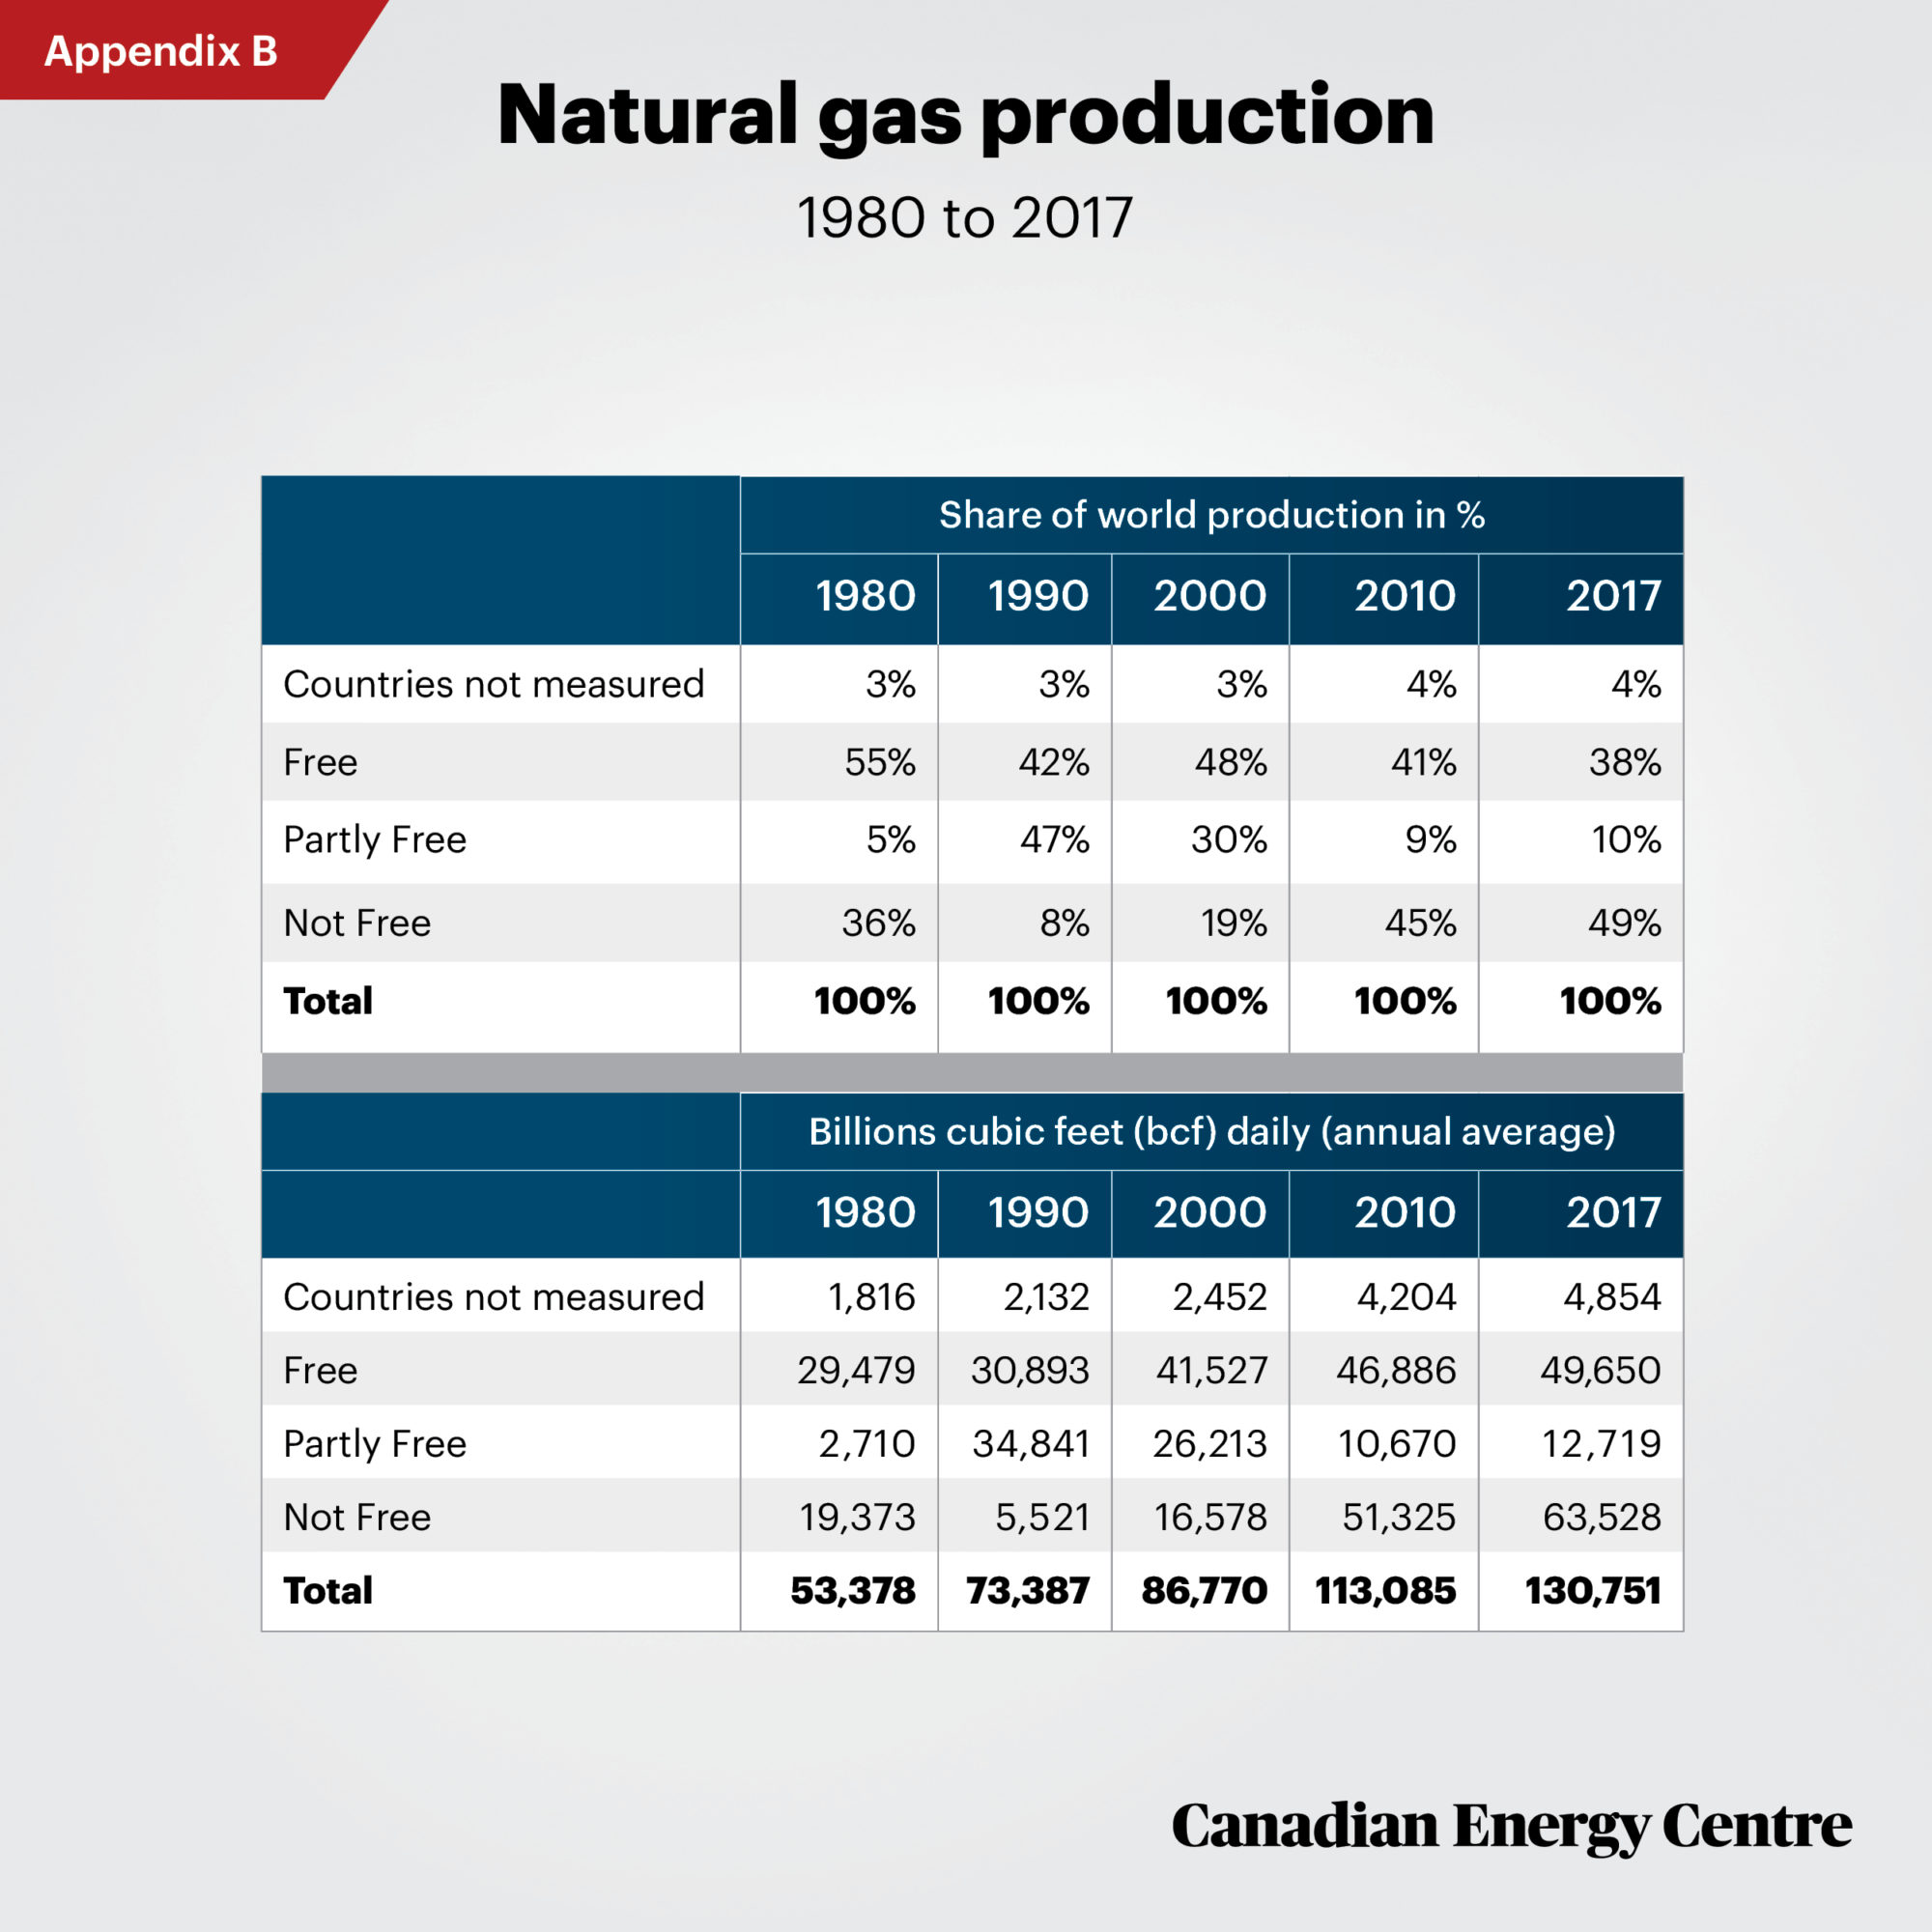
For natural gas comparisons, countries with more than 500 million cubic feet per day of production in at least one year between 1980 and 2017 were matched with their Freedom House ranking. Countries with less than 500 million cubic feet per day were not collectively ranked and fall into the “Not Measured” category of all gas production. Proportions measured by freedom category thus ranged from 96 to 97 per cent depending on the year.


Sources: Freedom House. Countries and Territories: Global Freedom Scores. U.S. Energy Information Administration, International Statistics. Percentages may not add to 100% due to rounding.
Some observations from the data:
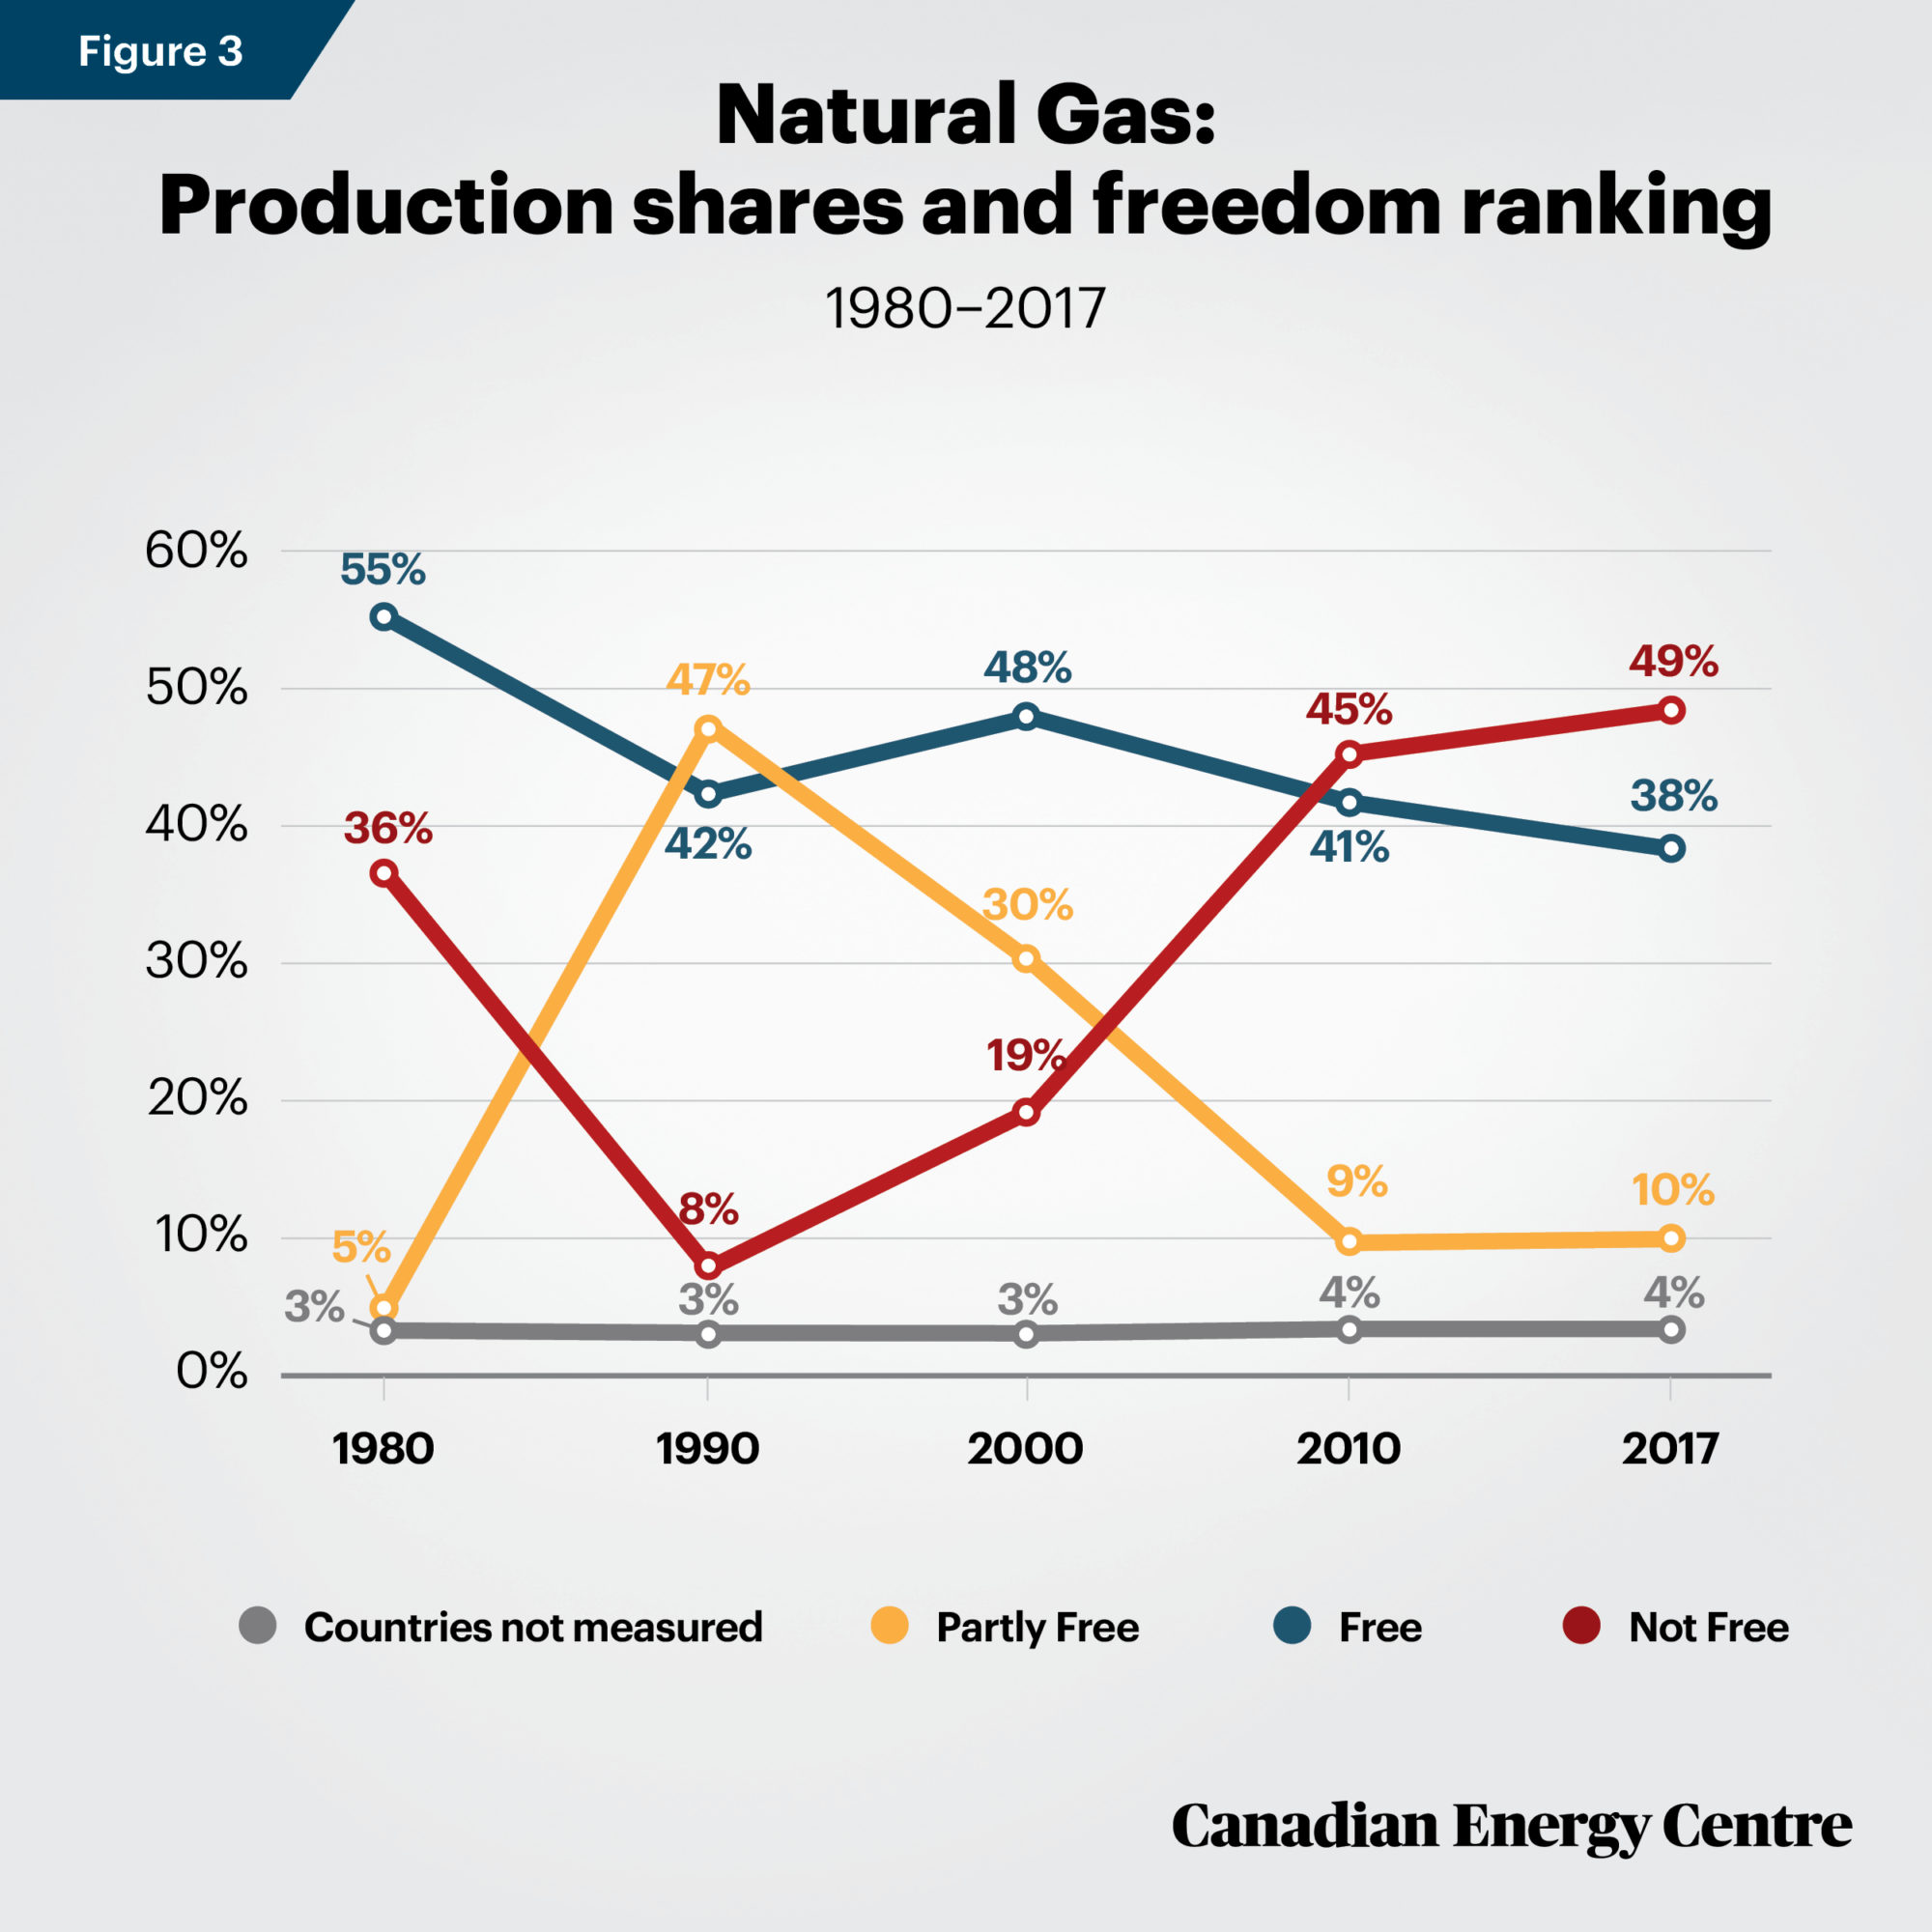
- The majority of natural gas production in 1980 was in Free countries, at 55 per cent. This proportion has since declined to 38 per cent as of 2017.
- The gas production share by Partly Free countries varied dramatically from just five per cent in 1980 to as high as 47 per cent in 1990 and only 10 per cent in 2017.
- Not Free countries’ share of world natural gas production was higher than the other categories as of 2010 and remained there in 2017 at 45 and 49 per cent respectively.
- As with the oil index, shares attributed to the three categories have risen or fallen due to both changes in country rankings and also changes in production volumes in specific countries where freedom rankings remain constant. For example:
- The Soviet Union, with 15,370 bcf of natural gas production in 1980 (out of 53,378 bcf worldwide) was then classified as Not Free. By 1990, the Soviet Union with 28,782 bcf in production (out of 73,387 bcf worldwide) was classified as Partly Free. In both 2010 and 2017, the major successor state to the Soviet Union, Russia, was ranked as Not Free and was still a dominant producer of natural gas. In 2010, Russia’s natural gas production was 21,458 bcf of 113,085 bcf produced worldwide. In 2017, Russia’s natural gas production was 23,508 bcf of 130,751 bcf produced worldwide.
- One nation always ranked as Not Free—China—produced 505 bcf of natural gas in 1980 and tenfold that figure as of 2017 (5,152 bcf). That increase also helps explain the higher proportion of Not Free countries dominant in natural gas production worldwide.
Sources: Freedom House. Countries and Territories: Global Freedom Scores. U.S. Energy Information Administration, International Statistics. Percentages may not add to 100% due to rounding.
Takeaway: Ever-more oil and gas production coming from Not Free countries
With the most recent data available, as of 2019, 51 per cent of global oil production comes from nations that Freedom House tracks as Not Free: the highest proportion of any year measured in the last four decades. That compares to a 34 percent share of oil production in Free and 10 percent in Partly Free countries.
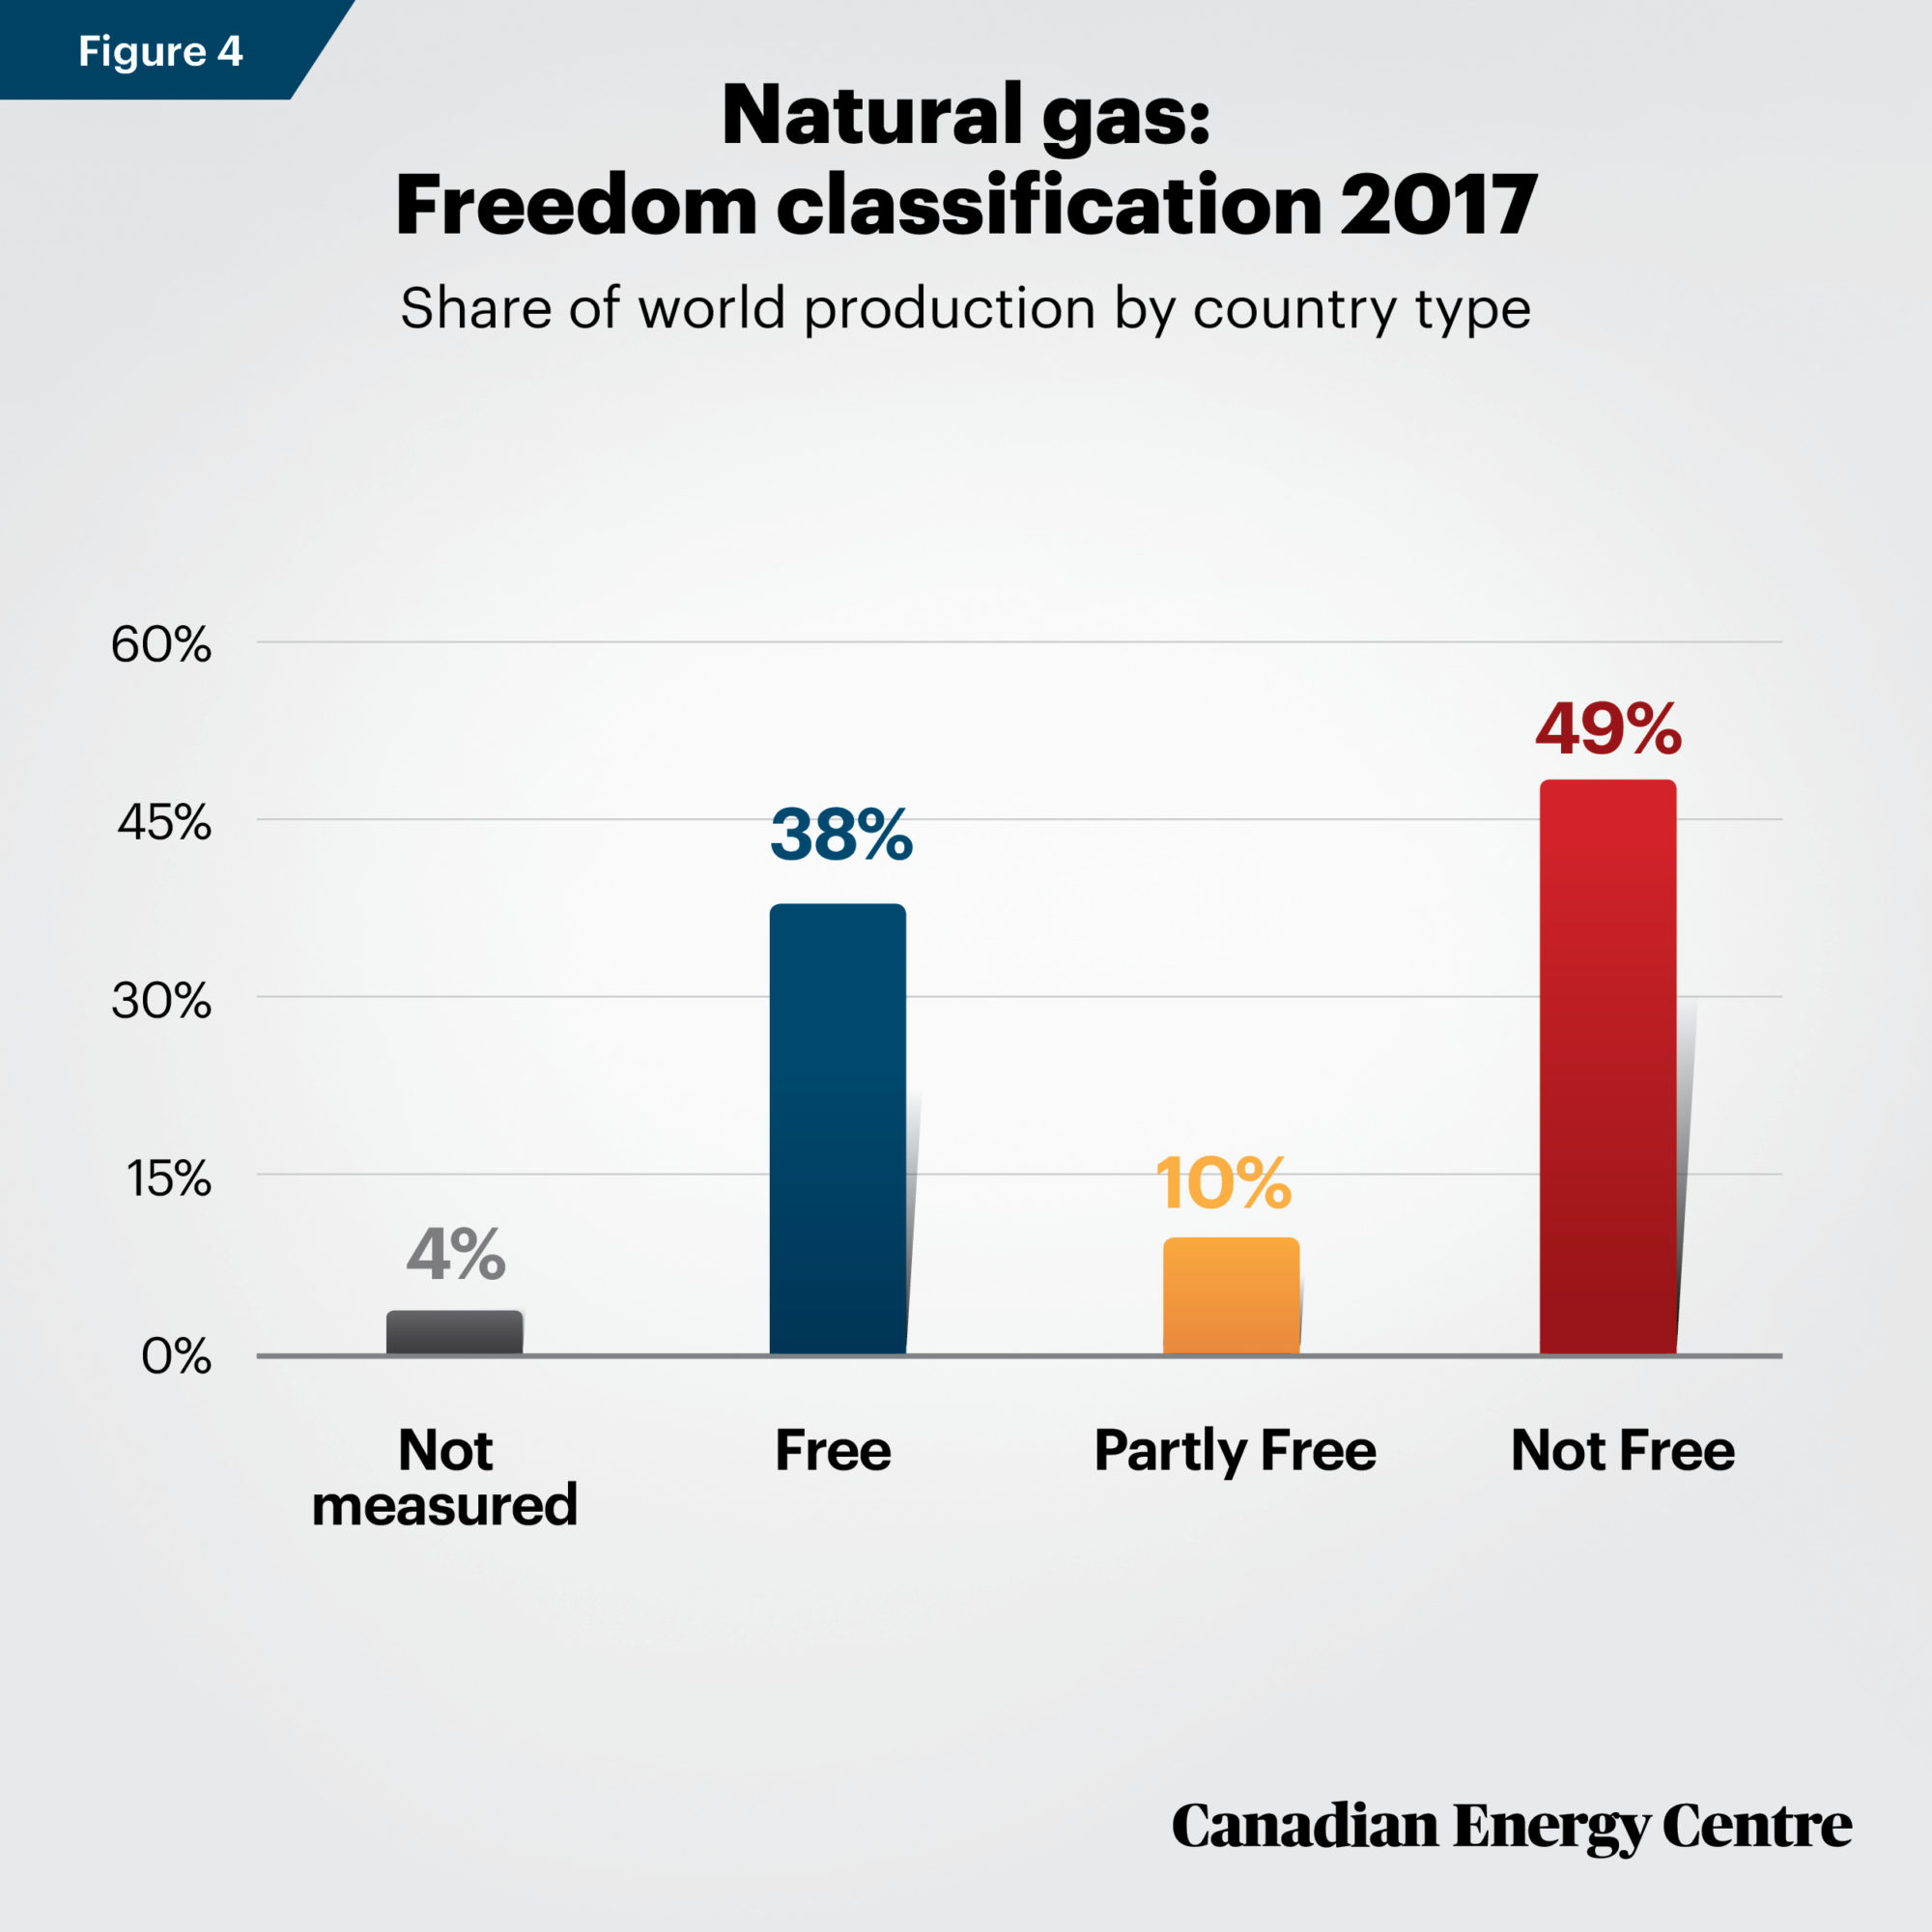
For natural gas, 49 per cent of global production came from countries characterized as Not Free in 2017. That is also the highest proportion observed in the last four decades, and is higher than the proportion of production in Free (38 per cent) or Partly Free (10 per cent) nations.
There are limited options for citizens, companies, and governments in democracies in dealing with regimes that order state-owned oil energy companies to flood the market with additional supply or that restrict natural gas exports, in both cases using energy as a as a geopolitical weapon.
However, supply options matter: Countries with limited natural gas suppliers in Europe or in Asia, for example, will always find it more and not less difficult to ally with other democracies on critical matters such as civil rights, a free media, religious freedom, free expression, and other freedoms if their oil and gas supplies are subject to near-monopoly influence by the regime in a country that is Not Free.
In the context of debates over oil and gas extraction and exports, it should matter if countries such as Canada, the United States, Australia, Norway and other democracies ranked as Free are able to extract and export more oil and natural gas. Other issues beyond energy and the economy matter, including the environment. However, in a world where a greater share of oil and natural gas production is coming from autocracies, the security of supply and national interest matter in parallel to the economy and the environment. Production statistics are measured in this Fact Sheet for that reason and for consideration by policymakers and the public.
Appendices
Sources: Freedom House. Countries and Territories: Global Freedom Scores. U.S. Energy Information Administration, International Statistics. Percentages may not add to 100% due to rounding.
Sources: Freedom House. Countries and Territories: Global Freedom Scores. U.S. Energy Information Administration, International Statistics. Percentages may not add to 100% due to rounding.
Notes
This CEC Fact Sheet was compiled by Mark Milke and Lennie Kaplan at the Canadian Energy Centre: www.canadianenergycentre.ca. The authors and the Canadian Energy Centre would like to thank and acknowledge the assistance of Philip Cross in reviewing the data and research for this Fact Sheet. Image credits: Vladimir Putin and Mohammed bin Salman by Pavel Golovkin.
About the Canadian Energy Centre (CEC)
The Canadian Energy Centre (CEC) is an independent provincial corporation that is primarily supported by the Government of Alberta’s industry-funded Technology, Innovation and Emissions Reduction (TIER) fund. The CEC’s mandate is to promote Canada as the supplier of choice for the world’s growing demand for responsibly produced energy. At its core, the CEC will also create a new, pragmatic, fact-based narrative about Canadian energy.
Sources (Links live as of May 12, 2020)
Freedom House (2020). Countries and Territories: Global Freedom Scores. <https://bit.ly/2yS1IPf>; Freedom House (undated). About Us. <https://bit.ly/2YC53g5>; Fried, Daniel (2019). “Russia gas Pipeline Sanctions: A Way Ahead,” December 17, Atlantic Council <https://bit.ly/2yx8gTm>; GAN Business Anti-Corruption Portal (undated). Russia Corruption Report. <https://bit.ly/3dHDc2t>; Krauss, Clifford (2020). “Saudi Oil Price Cut Is a Market Shock with Wide Tremors.” New York Times, March 9. <https://nyti.ms/2WzRCdX>; Government of Alberta (undated). Economic Dashboard, Oil Prices, <https://bit.ly/2LazJwM>; Khrennikova, Dina and Anna Shiryaevskaya and Daryna Krasnolutska (2019). “Why the Russia-Ukraine Gas Dispute Worries Europe.” Bloomberg, December 6, 2019. <https://bloom.bg/2SWGyX9>; Merriam Webster (undated). Definition of tyranny. <https://bit.ly/2YCc4NZ>; El Gamal, Rani (2019). “Saudi Aramco kick-starts what could be world’s biggest IPO, offers scant details.’ Reuters. <https://reut.rs/2zmlWk5>; Saudi Aramco (2020). “Ministry of Energy directed Saudi Aramco to raise maximum capacity.” <https://bit.ly/3dtOSps>; Transparency International (2019). Russia: Corruptions Perception Index, 2019. <https://bit.ly/2L8syWc>; Transparency International (2015). Corruption and Human Rights Abuses in Venezuela. <https://bit.ly/35OSgZc>; Transparency International (2020). Saudi Arabia: An overview of corruption and anti-corruption. <https://bit.ly/35RGMEv>; U.S. Energy Information Administration, International Statistics, <https://bit.ly/2zUiSvV>; Varcoe, Chris (2020). “Oil price plunge to negative, tightening screws on Alberta producers and province.” Calgary Herald, April 20. <https://bit.ly/3bavZGh>.
Creative Commons Copyright
Research and data from the Canadian Energy Centre (CEC) is available for public usage under creative commons copyright terms with attribution to the CEC. Attribution and specific restrictions on usage including non-commercial use only and no changes to material should follow guidelines enunciated by Creative Commons here: Attribution-NonCommercial-NoDerivs CC BY-NC-ND.
Share This:


