


 CDN NEWS |
  US NEWS


David Yager – Yager Management Ltd.
Oilfield Services Executive Advisory – Energy Policy Analyst
August 16, 2017
It doesn’t feel that great. Based on the share prices for most of the publicly traded oilfield service (OFS) companies it doesn’t look that great either. But at least as measured by revenue, the financial performance of 16 publicly traded Canadian OFS outfits indicates business has materially improved for the first half of the 2017 fiscal year ended December 31, 2017 compared to the same six months in 2016.
The companies were selected based on sectoral diversity, not size or financial metrics. There are companies from manufacturing, transportation, supply, logistics, drilling and service rigs, well servicing and field services. They don’t all react the same way when the current recovery is driven primarily by an increase in drilling in Canada and the U.S. As a group, revenue for the first six months of the year rose nearly 47% from $3.7 billion to $5.5 billion.
And no wonder. Commodity prices were up substantially. According to Natural Resources Canada which tracks Canadian crude prices in domestic currency, for the first four months of 2017 (the latest figures available) Sweet Light crude oil averaged Cdn$64.22 a barrel. For the same four months in 2016 the average price was only Cdn$41.02, less than 2/3 of this year’s price.
The improvement in Western Canada Select, the unique blend of bitumen, synthetic crude and condensate, was even more dramatic. For the first four months of 2017 the average price at Hardisty was Cdn$49.92. This is a whopping Cdn$22.58 a barrel or 83% more that the dreadful average of only Cdn$27.34 from January 1 through April 30, 2016.
Natural gas also enjoyed a nice lift in the half of 2017. According to the TMX NGX Alberta Market Price, for the first six months of 2017 gas averaged Cdn$2.68 per gigajoule (948 cubic feet). This was an improvement of over Cdn$1 per GJ or 64% over the average price of only Cdn$1.64 for the first half of last year. While the Fort McMurray fires and the shutdown of about 1 million of gas-recovered oil sands production clobbered gas prices in May and June, the average price was only Cdn$1.31 in April and Cdn$1.58 in March.
ARC Energy Research Institute reveals the macroeconomic statistics in its August 15, 2017 weekly report. For 2016 total revenue from Canadian oil and gas production was only Cdn$79.3 billion, the lowest level in years. Cash flow available for reinvestment was just Cdn$22 billion. For 2017 ARC estimates total revenue jumping to Cdn$102 billion with cash flow up significantly to Cdn$40 billion, almost double. That’s a lot of extra cash available for drilling and other expenditures.
This was the main driver behind the improved rig count and capital spending which drove OFS activity in the first half 2017. The Daily Oil Bulletin reported July 11 the number of wells licensed in the first half of 2017 was nearly double the same period in 2016, 2,133 wells compared to 1,180. What also helped drilling in 2017 was a later spring break up. Spring came in mid-March in 2016 shutting down activity early. It was that kind of year when nothing seemed to go right.
Many of the 16 companies surveyed have operations in the United States. On June 30, 2017, there were 940 rigs drilling in the U.S. On June 24, 2016 that figure was only 421, 45% of the 2017 figure. This the main reason OFS handled more money this year than last.
But the real test of a recovery lies in the gross margin, the difference between revenue and direct cost of goods sold. This is a useful measure of pricing power. Direct expenses include labor, fuel, subsistence, consumables/expendables, and field operations and management. Gross margin is the percentage calculation of gross profit over revenue before corporate administration, depreciation, stock-based compensation, interest and foreign exchange. These costs are fixed no matter how much business comes in the door. While some service and product delivery functions like field locations and operations management are fixed, the larger expenses like fuel, labor and expendables are variable.
The true test of OFS ability to raise prices is the difference between gross margin this year and last for the same reporting period. Unfortunately, pricing remains challenged. While OFS was able to negotiate some price increases, the figures indicate for many companies higher rates were just a flow-through because of higher expenses for labor and fuel.

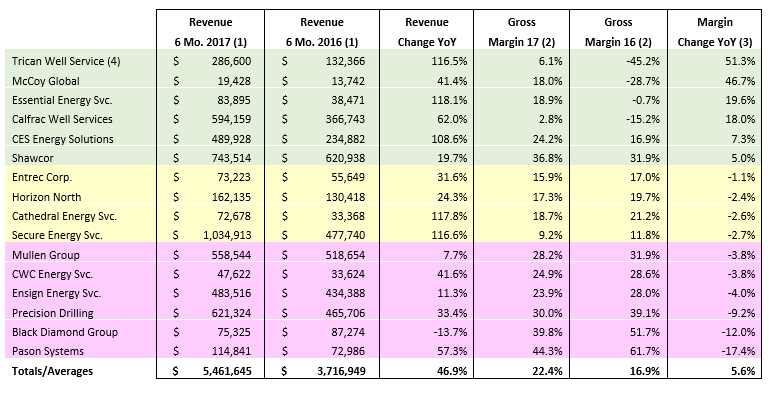
- Revenue as reported on SEDAR
- Gross margin calculated as gross profit as a percentage of revenue. The figure at the bottom is the simple average.
- Gross margin change in 2017 compared to 2016. The figure at the bottom is the simple average.
- Revenue for Trican includes $42.3 million from the acquisition of Canyon Energy Services effective June 2, 2017
The chart above summarizes revenue for the first half of 2017, revenue for the same period in 2016, the revenue change year over year, the gross margin in per cent for 2017, the gross margin in per cent for 2016, and the change in gross margin year over year.
The growth in revenue is significant. For five companies revenue more than doubled but this was supported by acquisitions in some cases. Only one company reported a revenue decline.
Every company reported a positive gross margin in the first half of 2017. Three had direct expenses greater than revenue in 2016. Only six of 16 companies reported gross margins higher in 2017 than 2016. Four companies had margins not quite as high as last year with a reduction less than 3%. Six companies saw gross margin contraction of 3.8% or higher. This means direct costs rose more than their ability to increase prices, or else they worked at lower rates than last year.
The two companies that dragged the gross margin improvement average up to 5.6% for the group were Trican Well Service and McCoy Global. Both had significant negative gross margins in the first half of 2016 meaning that last year every dollar of revenue they handled cost $1.30 to $1.50 to generate. When these companies went positive in 2017 their significant year-over-year gross margin improvements had a major impact on the average for the group. Eliminating these two companies causes the average gross margin of the other 14 to decline by 0.7% in 2017 compared to the prior year.
In the simplest terms, this means overcapacity still exists in every sector and OFS is unable to push through price increases beyond what they need to attract the personnel to do the work their clients want to get done.
The companies with the greatest revenue growth were primarily focused on wellbore operations and conventional field service activity in the fields of pressure pumping, coiled tubing, directional drilling, drilling fluids, chemicals, fluid handling and waste disposal. Of interest is the companies that didn’t respond as well as others involved in wellbore operations were those with drilling and well servicing rigs. They did not enjoy revenue increases that reflect the remarkable increase in drilling in Canada and the U.S. and they also reported higher rates of gross margin erosion. One conclusion is the utilization of their fleets of new generation rigs did not increase as much as the well count on a percentage basis.
The companies with the lowest revenue growth were involved in transportation, logistics, and pipe coating. Companies like Mullen Group get a lot of their business from outside of the oilpatch while Shawcor operates in numerous markets outside of North America. The two logistics (camps and catering) companies – Horizon North and Black Diamond – are readjusting their business models to reflect a material slowdown in worker support requirements in the oil sands region.
The size of the companies analysed skews the average results. But the intent was not to compare a company with $19 million in sales like McCoy to one with $1 billion in revenue like Secure, but to select companies in various facets of OFS from manufacturing to transportation to logistics to wellbore construction and services to demonstrate how the recovery in the first half of 2017 was not evenly distributed. What equipment and services OFS provides to what customers really matters as the sector crawls out of the economic gutter.
Regardless, business as measured by revenue was much better this year than last. While there is much work to do, this is the first positive news in what will later this year be three years of living with collapsed oil prices.
About David Yager – Yager Management Ltd.
Based in Calgary, Alberta, David Yager is a former oilfield services executive and the principal of Yager Management Ltd. Yager Management provides management consultancy services to the oilfield services industry in a number of areas including M&A, Strategic Planning, Restructuring and Marketing. He has been writing about the upstream oil and gas industry and energy policy and issues since 1979.
See David Yager’s Corporate CV
List of David Yager’s Consulting Services
David Yager can be reached at Ph: 403.850.6088 Email: [email protected]
Share This:


