


 CDN NEWS |
  US NEWS


David Yager – Yager Management Ltd.
Oilfield Service Management Consulting – Oil & Gas Writer – Energy Policy Analyst
May 10, 2017
For an industry suffering from Post-Traumatic Stress Disorder (PTSD) almost 2.5 years after the oil price collapse, May 4 was a very long day. After trading within one dollar of its 2017 high at US$53.40 on April 11, on May 4 day WTI closed at US$45.52, 5% lower than the prior day close. Except for a 20-day slump in March when North American crude was on the wrong side of US$50, for the first time since last year’s OPEC supply cut decision, oil prices had seemingly stabilized at a new level. A recovery was underway. You probably read it here. To watch crude lose 15% of value in three weeks was, at minimum, unsettling.
The anxiety disorder PTSD implies the trauma has ended. It clearly has not. As managers, workers and investors try to ascertain their future amid oil price volatility, there are only two options; understand it or live with it. The following article will prove the former difficult if not impossible. The latter is, as the old saying goes, “no way to run a railroad”.
Here’s an example of the effects of oil price volatility. After reasonable success raising equity in late 2016 and early 2017, capital markets for public oil service companies contracted in March when WTI slumped. Source Energy Services Ltd. downsized its Initial Public Offering by $75 million and closed a $175 IPO April 13. STEP Energy Services Ltd. withdrew its planned Initial IPO in March and then resuscitated it in April when prices recovered. It closed May 2 but only raised $100 million, half of what was originally planned. Both were done at lower share prices than previously contemplated.
Exploration and production companies and workers in every sector are subjected to the same gyrations in inventor enthusiasm and future prospects as commodity prices whipsaw.
The main-stream media blamed the dramatic price slump on the usual suspects; a rising U.S. rig count, increasing U.S. production, bloated inventories, increased output from Libya (at least temporarily), China, Iraq and flat U.S. gasoline consumption. Supply and demand. Market forces. What most people assume drives commodity prices.
Prior to the price rout, OPEC et al’s 1.8 million b/d cuts from last November were enjoying high levels of compliance. Signals from OPEC and Russia being telegraphed for the upcoming May 25 meeting were restrictions would continue for the rest of the year. By May 8 consideration was being given to extended the cuts into 2018. While U.S. production had indeed risen by 600,000 b/d since the November OPEC agreement, this was a fraction of the oil withdrawn from the market.
Meanwhile, inventories were declining, though not much. Oil stored in tankers, which is hard to track, declined significantly. In the U.S., inventories have been rising but actually reported modest declines prior to May 4. The International Energy Agency (IEA) in mid-April indicated Q1 reductions in OECD inventories with more to come in Q2. There were no material changes in global physical oil markets prior to May 4. Certainly nothing that would cause a 15% decrease in WTI with one-third occurring in a single day.
However, financial markets are different. The U.S. dollar has been very strong for the past two years. The chart below indicates the value of the U.S. dollar versus a basket of major currencies. As the U.S. dollar rises the general trend is commodity prices denominated in U.S. dollars is downwards because they cost more when purchased with other currencies.
U.S. DOLLAR VERSUS OTHER MAJOR CURRENCIES

The United States Dollar Index or DXY measures the performance of the dollar against a basket of other currencies including EUR, JPY, GBP, CAD, CHF and SEK. Source: TradingEconomic.com
The Canadian dollar has been clobbered relative to the U.S. dollar since the oil price collapse in November of 2014, in part because it is considered a “petro-currency”. That month it closed at US$0.88 but it has been trending downwards ever since currently trading below US$0.73, a 17% decline. This offsets the strength of the American dollar somewhat for domestic producers, although transportation issues still result in lower prices for certain Canadian grades.
A greater problem appears to be a broader commodity correction that occurred at the same time as the drop in the price of oil. On May 4 Bloomberg wrote, “Within minutes of U.S. crude oil futures tumbling through US$45 a barrel, signs of a broader risk-off swing started to emerge in markets, exacerbating what was already brewing as a worrying week for commodities. Oil’s retreat to a level not seen since OPEC forged its landmark agreement to cut output last November stoked declines from iron ore to industrial metals and losses that many commentators had been putting down to individual supply and demand factors”.
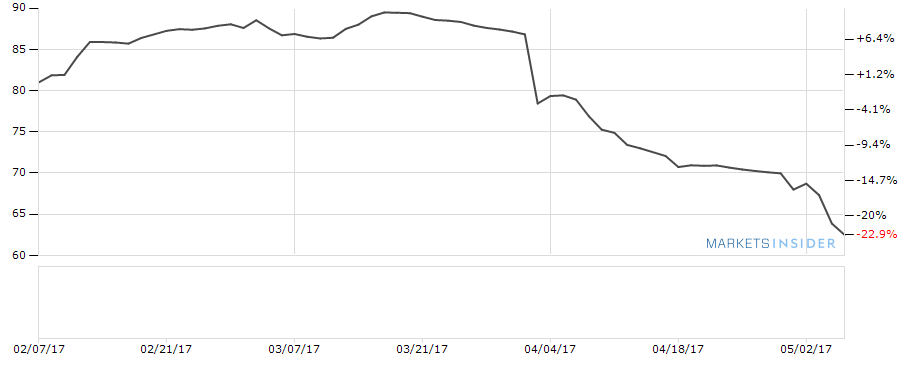
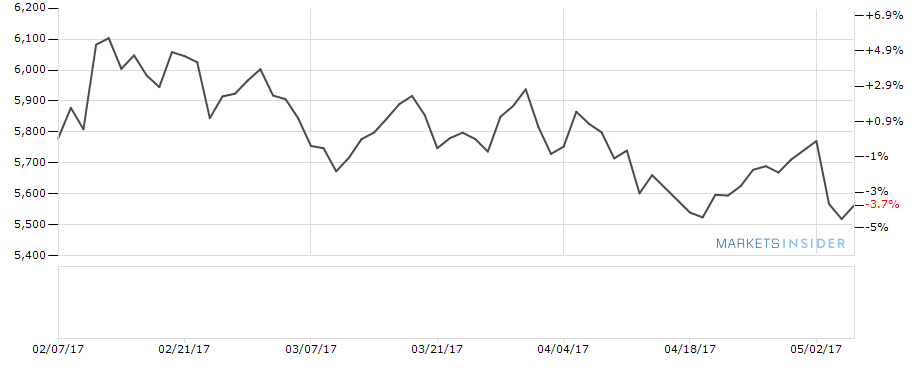
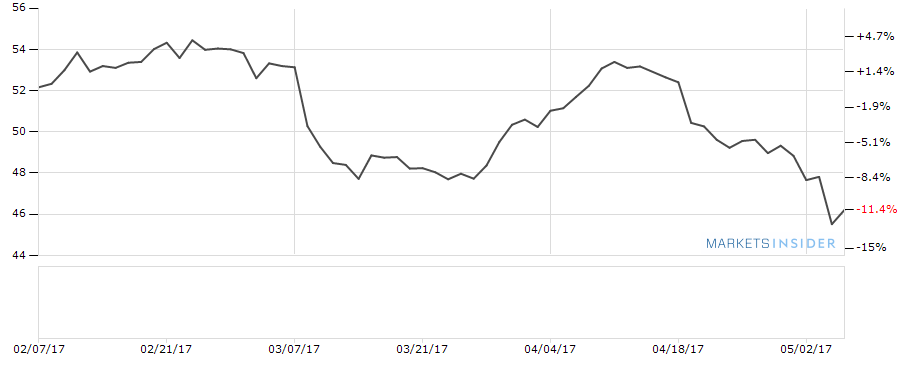
In simple English, declines were caused by money markets, not oil markets. Following are charts for the past three months for three metals – iron ore, copper and platinum – followed by crude oil. Note the similarity of the price trends for the past three weeks. Either rising oil output from the Permian Basin affects everything for global commodities markets or there are other forces at play.
IRON ORE 62.49 USD -1.39 (-2.22%) Official Close 5/5/2017
COPPER 5,571.07 USD 5.11 (0.99%) Official Close 5/5/2017


PLATINUM 914.00 USD 9.50 (1.05%) Official Close 5/5/2017

OIL (WTI) 46.47 USD 0.98 (2.15%) Official Close 5/5/2017
Source: tradingeconomics.com
On a percentage basis, the declines in iron ore, copper and platinum since mid-April are similar to oil. On May 3, when WTI closed under US$48, a Bloomberg article titled “Trump’s Commodities Rally Is Almost Gone” wrote, “Commodities are sinking to a five-month low, almost erasing the rally that followed Donald Trump’s surprise election win. The selloff has been led by industrial metals and oil, sectors that fueled raw-materials gains earlier this year on the view that faster global growth would boost demand”. Part of the problem, again, was China. “Metals used in construction and heavy manufacturing were hit after data released over the weekend suggested slowing growth in China and figures Monday showing U.S. auto sales last month fell short of analysts’ estimates”.
More reports support the conclusion much of oil’s selloff was technical, not market-driven. STC OTC Corp., a New Jersey-based commodities specialist, wrote in oilprice.com on May 5, “We’re viewing this week’s flat price damage as a function of bullish frustrations and momentum chasing rather than new bearish fundamental revelations. In short, we think the market became impatient with a lack of visible inventory draws four months into OPEC cuts and that Chinese macro concerns, a modest (and possibly transient) uptick in Libyan production and an unimpressive EIA report lead to length liquidation, self-reinforced stop losses and momentum from robots smelling blood in the water”.
What this says is while the usual markets factors surround OPEC and inventories may affect sentiment, the other factors are the longs (bulls) went short (bears, resulting on “length liquidation”) and commodity trading algorithms kicked in as prices fell (“self-reinforced stop losses” and “robots smelling blood in the water”).
When it became clear earlier bullish bets on oil post-OPEC were about to cost speculators a lot of money, speculators and their machines took over and engineering bearish positions to mitigate losses.
The Financial Post wrote the same thing the same day. The article read, “The drop introduced a new level of uncertainty into the oil market, perplexing those who track the price of oil. Tudor (Tudor, Pickering, Holt and Co., an energy investment bank) analysts said in Friday research note that part of steep drop in prices could be attributed to trading algorithms in the market, which can lead to widespread sell-offs once prices reach a specific threshold”.
Anish Kapadia, a senior research analyst at Tudor in London, said, “There’s nothing concrete that I think explains the move. All of these algos are similar to each other and they all respond to the same triggers”.
Not surprisingly, trading volumes in oil futures and options on May 4 were at near record levels. This is commodity equivalent of what stocks markets call high frequency trading.
PTSD sufferers in the battered upstream oil and gas industry will take little comfort to learn their economic future is in the hands of computer-programs written by programmers and traders who have never set foot on a drilling rig or production operation, nor put on a pair of coveralls or a hard hat.
What is most remarkable about the oil price meltdown was some of the other very positive oil news making headlines at the same time. But this was delivered by people, not computers.
GMP First Energy’s oil analyst Martin King told a Calgary business audience May 2 that oil could reach US$75 a barrel in two years. King was quoted in the Calgary Herald as saying, “The U.S. cannot drown the world in oil – it’s fundamentally impossible. We think the data in the coming weeks and months should begin to put more of a positive spin on the resetting of the global oil market to more reasonable levels, but it will take some time”.
While U.S. shale production is indeed rising and affecting investor sentiment, King says the “law of diminishing returns” will rule the day as the number of prospects that work at today’s prices declines. However, he admitted short term challenges remain. But it was unlikely he anticipated it would happen in only two days.
An article on oilprice.com May 5 titled “$44 Trillion Needed To Keep Up With World’s Energy Demands” was quite bullish. In it Chevron CEO John Watson was quoted May 1 as saying, “Shale can help. Certainly, between now and the end of the decade it will be a big contributor to meeting that millions-barrels-of-oil-demand growth that’s out there. But ultimately oil fields decline, and we’re going to need all sources of supply, including the shales, but also deepwater and other sources around the world”.
The article reported the IEA in its 2016 Oil Market Report forecast rising consumption because half a billion people in places like sub Sharan Africa still don’t even have electricity. The IEA estimated US$26 trillion of the US$44 trillion must be invested in oil, natural gas and (yes) coal to meet these requirements by 2040. The IEA again cited reservoir decline rates noting that producers must continue to reinvest just to stay in business. The IEA said lobal declines are “equivalent to losing the current output of Iraq from the global balance every two years”.
Some good news for Canada seldom mentioned is natural gas. In April the price gas in Alberta on the NGX exchange averaged Cdn$2.58 per gigajoule (GJ), almost double the average of only Cdn$1.31 in April of 2016. In May of last year gas fetched only Cdn$1.14 because of the Fort McMurray fires. For June and July it was only Cdn$1.42 and Cdn$2.03 respectively. For the first four months of 2017 the average price was 48% higher than the for the same period in 2016, Cdn$2.70 compared to Cdn$1.82. This has added a lot of extra cash and has nothing to do with the price or oil.
However, that oil has declined partly because of technical trading reasons and should rise in the future when demand clearly exceeds supply doesn’t change anything for those trying to forge a corporate or personal path forward in post-collapse world of oil. Any risk premium that once supported prices because of potential supply disruptions from the more volatile parts of the world is gone because of current high inventories. This makes petroleum just another commodity, subject to the same market vagaries as other commodities like iron ore, copper and platinum.
Only when it is proven OPEC’s production cuts and greatly reduced global reinvestment are shrinking inventories will the bulls fully reclaim the markets from the bears. So do up your seat belt. With commodity speculators and algorithms in charge, volatility is assured.
About David Yager – Yager Management Ltd.
Based in Calgary, Alberta, David Yager is a former oilfield services executive and the principal of Yager Management Ltd. Yager Management provides management consultancy services to the oilfield services industry in a number of areas including M&A, Strategic Planning, Restructuring and Marketing. He has been writing about the upstream oil and gas industry and energy policy and issues since 1979.
See David Yager’s Corporate CV
List of David Yager’s Consulting Services
David Yager can be reached at Ph: 403.850.6088 Email: yager@telus.net
Share This:


Canada’s Advantage as the World’s Demand for Plastic Continues to Grow